Nucleation phenomena and extreme vulnerability of spatial k-core systems
Abstract
K-core percolation is a fundamental dynamical process in complex networks with applications that span numerous real-world systems. Earlier studies focus primarily on random networks without spatial constraints and reveal intriguing mixed-order transitions. However, real-world systems, ranging from transportation and communication networks to complex brain networks, are not random but are spatially embedded. Here, we study k-core percolation on two-dimensional spatially embedded networks and show that, in contrast to regular percolation, the length of connections can control the transition type, leading to four different types of phase transitions associated with novel phenomena and a rich phase diagram. A key finding is the existence of a metastable phase in which microscopic localized damage, independent of system size, can cause a macroscopic phase transition, a result which cannot be achieved in traditional percolation. In this case, local failures can spontaneously propagate the damage radially until the system entirely collapses, a phenomenon analogous to the nucleation process. These findings suggest novel features and extreme vulnerabilities of spatially embedded k-core network systems, and highlight the necessity to take into account the characteristic length of links when designing robust spatial networks. Furthermore, our insight about the microscopic processes and their origin during the mixed order and first order abrupt transitions in k-core networks could shed light on the mechanisms of many systems where such transitions occur.
I Introduction
A phase transition is characterized by changes in the macroscopic properties of a system when crossing the critical point [1, 2]. Percolation is a mathematical model that has been widely explored to exhibit and understand geometric phase transitions and explain the conditions under which these transitions are discontinuous (first-order) or continuous (second-order) [3, 4]. Of particular recent interest are systems that exhibit mixed-order transitions showing features from both first- and second-order transitions. Recent advances indicate that this behavior may be related to long-range interactions [5, 6, 7, 8]. In recent years, mixed-order transitions have been reported for k-core pruning in random networks [9, 10, 11, 12, 8]. The k-core approach, which involves the iterative removal of nodes with a degree smaller than from a network, provides a unique perspective on the underlying structure of the network and its robustness. Notably, k-core pruning has been seen as a percolation process in which nodes are removed from the outer layers of the network, leading to the term “k-core percolation” [9, 10, 13, 14]. K-core percolation has found widespread applications in real systems with spatial characteristics. Examples include the brain [15, 16, 17], cellular structures [18, 19], the Internet [20], communication infrastructures [21, 22], and ecological networks [23, 24, 25]. Furthermore, as in any percolation process, k-core percolation has expanded its reach to dynamic processes [9, 10], emphasizing its versatility and relevance. At the heart of k-core percolation research lies the investigation of phase transitions and critical behaviors [26, 27, 11, 12]. Intriguingly, k-core percolation on random networks has been shown to result in a mixed-order phase transition for [11, 28], where the order parameter (the size of the giant component of the k-core) exhibits an abrupt jump akin to first-order phase transitions but near criticality, it features a scaling behavior typical to second-order phase transitions.
While k-core percolation has received extensive attention and demonstrated mixed-order transitions, it mainly focuses on non-spatial random networks. In reality, numerous real-world systems, from transportation networks and power grids to communication systems and brain networks, are commonly embedded in two- or three-dimensional space [16, 29, 30, 31]. Despite their widespread existence, our understanding of the robustness and vulnerability of these spatially embedded networks undergoing the k-core process remains very limited. As a result, a comprehensive framework for understanding the effects of spatial embedding is notably absent. Although the role of long-range interactions in mixed-order transitions was found to be pivotal [6, 8], the exact mechanism through which the k-core induces this transition remains an open problem. In particular, when dealing with random networks featuring small-world characteristics, the lack of spatial, finite length scale connections within the k-core structure poses a significant challenge in examining how the characteristic length of the links influences the vulnerability of the system. By investigating k-core percolation in spatially embedded random networks, we can gain insight into how spatial constraints impact network functionality [30]. Currently, a limited number of studies have explored the spatial effect of k-core percolation, with a predominant focus on phase transitions and critical behavior [32, 33]. However, these studies did not consider the effect of controlling the length scale of links which, as we show here, is critical for understanding the network vulnerability. Consequently, there is a discernible gap in the development of a unified framework to understand the underlying mechanisms that drive catastrophic breakdowns near critical points.
Here, we develop a comprehensive numerical framework for investigating the attributes of k-core percolation within spatially embedded two dimensional networks. We provide evidence, based on extensive simulations, that the distribution of link lengths in a spatial system undergoing k-core pruning will determine the nature of the phase transition and elucidate the mechanisms driving the transitions in k-core systems showing four different types of phase transitions. Importantly, we show that there exists a new regime in the phase diagram, an extreme risk phase, i.e., a metastable phase, where a microscopic intervention above a certain size anywhere in the system yields a macroscopic phase transition represented by the collapse of the network. This finding demonstrates a fundamental vulnerability in these systems, a result which cannot be observed in traditional percolation studies. Therefore, spatially embedded networks may collapse significantly more easily than previously thought, and special attention must be paid to increase their robustness and avoid catastrophic damage.
More precisely, our primary focus lies on examining the impact of link length within a 2D spatially embedded network. Our objective is to discern the influence of the characteristic link length (denoted as ) on the properties of the critical phase transition of the k-core. Small values of favor links to nearby nodes, whereas larger values of introduce increasingly longer-range links, and eventually, when is of the order of , the linear size of the system, one obtains a fully random network. We find that the percolation critical point for k-core percolation reaches a maximum value at a critical characteristic length , which depends on . Below this value of the phase transition is continuous, but becomes abrupt for . Interestingly, the mechanisms behind the abrupt first-order transitions observed for are found to depend on the value of . For values of that are slightly higher than , the transition is abrupt and results from the propagation of a spontaneous local failure, causing the radius of the damage to increase until the system fully collapses. This is similar to a nucleation process in the gas-liquid model or in the spin model. However, when is much larger than , a critical branching process emerges as the nodes fail homogeneously anywhere in the system, at a constant low (microscopic) rate, eventually leading to an infinite-size avalanche. The analysis of the critical conditions and the underlying mechanisms reveals a rich phase diagram. Of particular interest is that in addition to the above phases, we observe a novel extremely vulnerable phase, i.e., a metastable phase where a microscopic localized attack anywhere in the system above a critical radius (which is independent of the system size) spontaneously spreads and leads to the full collapse of the system. These observations point to inherent extreme vulnerabilities of the system and can provide a comprehensive understanding of the mechanisms that lead to continuous second-order, mixed-order, and first-order transitions.
II Model
The structure of a spatially embedded network is largely determined by the dimension of the embedding space, the location of the nodes, and the length of the links in this space. For example, a two-dimensional network where each node only connects to short-distance neighbors can be mapped to a square lattice, and all critical exponents of the percolation transition in the embedded network will be the same as in a pure square lattice, since they share the same spatial dimension and thus belong to the same universality class [34]. Here, to investigate the relations between the link length and the k-core percolation properties, we place all network nodes at the sites of a 2D square lattice. The number and length of links for each node are determined by (a) the chosen degree distribution and (b) the length distribution of the links. Given a Poisson degree distribution and a mean degree, we construct spatially embedded networks using the -model [29, 31, 35], where the Euclidean length of the links between pairs of nodes follows an exponential distribution,
| (1) |
The parameter defines the characteristic length of the links in the network. This model allows us to control the embedding strength of the spatial network by adjusting the value of . For , the link length probability is independent of the distance, and the model becomes equivalent to a non-spatial random network. Thus, this model can also describe a random network since the limiting case when the values are of the order of the lattice size. On the other hand, for values of much smaller than the lattice linear length , the probability of long-range links tends to zero, so this limiting case is now a 2D lattice structure.
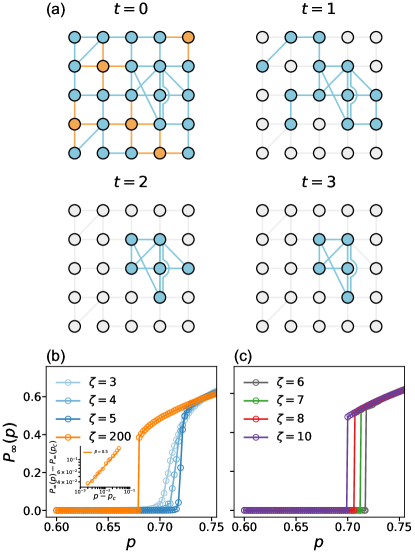
In our model, we consider a network with nodes and average degree , where each node is a site in a 2D Euclidean lattice with integer coordinates . We fix the value of and generate links with lengths distributed according to in Eq. 1. We implement periodic boundary conditions that restrict link lengths to . For each link of length , we randomly select a node and uniformly choose a node from the candidate set of nodes at a distance from node . Notice that integer solutions may not exist for all values of , as can be seen from the equation . In such instances, we adopt a straightforward approach: we select the node closest to the desired distance and establish a connection with it using the chosen link. Importantly, we enforce a one-to-one connection rule, eliminating any instances of multiple links between the same pair of nodes. We repeat this process until all links have been assigned. An example of a spatially embedded network generated by the model is shown in Fig. 1(a).
In the k-core percolation process, the initial step involves a random removal of nodes with a probability of . Subsequently, we initiate the k-core pruning procedure, in which all nodes possessing degrees lower than are eliminated, and the degrees of the remaining nodes are updated accordingly. This step is repeated with the recalculated degrees until all remaining nodes have degrees equal to or greater than . Figure 1(a) demonstrates a simple 3-core percolation process in a small spatially embedded network. In the results, we show the analysis using the 5-core percolation. For more percolation results at different values, see the Supplementary Material.
The fraction of nodes, , in the giant connected component (GCC) plays the role of the order parameter in the phase transition. The GCC corresponds to the remaining k-core structure in the network, and characterizes the robustness of the system, which we assume to be functional only if the remaining fraction of the GCC has a measure larger than zero. The critical probability is defined from the plot of vs as the value of where vanishes for the first time as we lower .
III Results
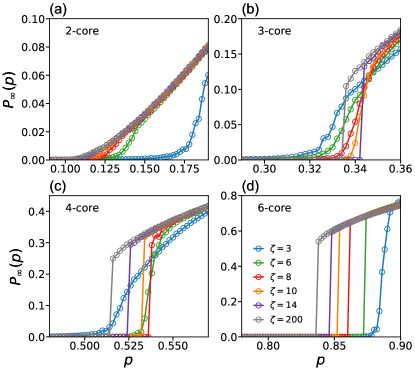
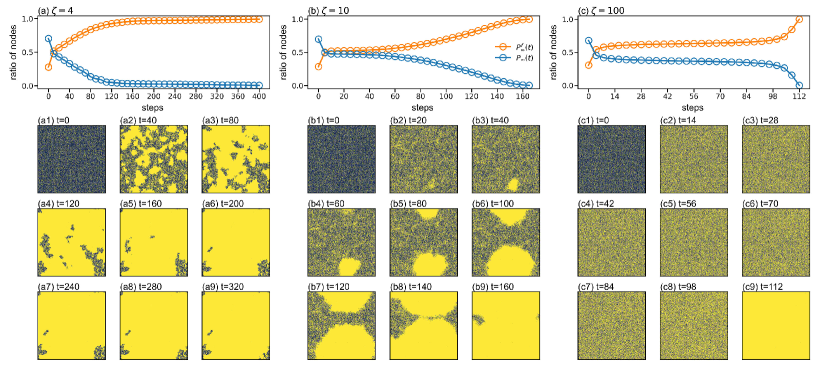
The effect of the characteristic link length. We study the behavior of the phase transition for the 5-core percolation, as we vary the characteristic length . For , the network exhibits strong spatial effects, with connections largely restricted between neighboring nodes. This system undergoes a continuous phase transition at , as shown in Fig. 1(b). This is in contrast to the discontinuous transition for the case in the same plot, which behaves, as expected, similarly to the percolation of k-core in random networks [9]. Due to the absence of long-range links for small values, the damage remains localized and is confined to the vicinity of the randomly removed nodes, leading to the absence of global or catastrophic failures. As we increase the value of , we introduce longer links that result in both a change in the critical value and a change in the nature of the transition that becomes abrupt (Fig. 1(c)). It is important to note the differences between the abrupt behavior for but close to 6 (Fig. 1(c)) and the abrupt transition for (Fig. 1(b)). While for one can see in a a curvature just above , representing a singular behavior with a critical exponent (see the inset of Fig. 1(b)), for just above 6 there is no such a singular regime and the drop in when decreasing is abrupt. This feature already indicates, as we show later, that these two transitions have different mechanisms.
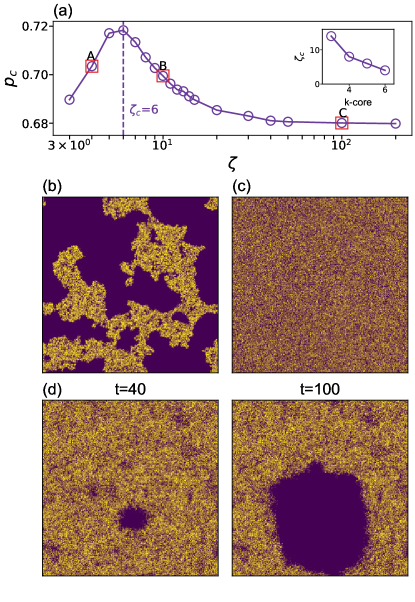
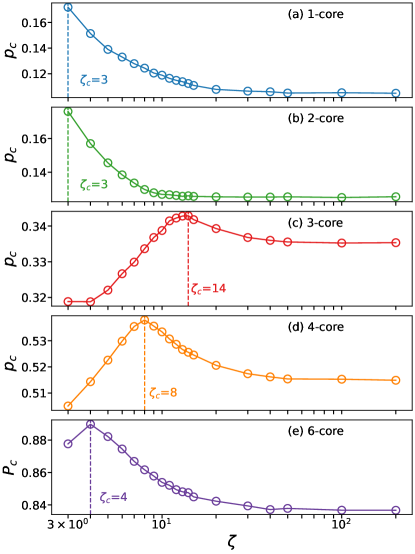
In Fig. 2(a) we plot the value of as a function of . The value of the critical point increases with until it reaches a maximum value at . The larger number of long-range links with increasing enables the propagation of failures over a larger area of the network. As a result, a smaller number of initial removed nodes is needed to cause system collapse, leading to a larger value of . In this range, below the phase transition remains continuous (Fig. 1(b)), indicating that failures do not propagate far enough to trigger an abrupt collapse. As a result, some areas of the network sustain limited damage while others are impacted more significantly. For example, Fig. 2(b) shows the stable GCC at , which exhibits clear fractal features at , similar to percolation in a single lattice network [34]. This is in marked contrast to the resulting structure of the GCC of a random network at where the damage is spread uniformly throughout the network (Fig. 2(c)).
For values above and smaller than the system length, the phase transition becomes discontinuous, as seen in Fig. 1(c). As shown in Fig. 2(d), the k-pruning now results in a drastically different mechanism. After the random removal of the initial nodes, a large enough hole emerges spontaneously, due to fluctuations somewhere in the network. The front of the hole spontaneously expands outwards from this hole, due to the finite , until it consumes the entire network. This process is analogous to the well-known nucleation process observed during the freezing of water. This is one of the key aspects of this transition which we discuss extensively later in this paper. Hence, there is no scaling behavior for near criticality similar to a first-order phase transition, see Fig. 1(c). The visualization of the cascading process for in Fig. 2(d) clearly demonstrates this interpretation. Initially, random fluctuations in network density create a region where the fraction of remaining nodes is significantly lower than the overall average, thus creating a hole in the system. The surviving nodes remain largely connected and the value of remains high, since only small clusters are isolated from the GCC. However, as the hole evolves and propagates, it eventually leads to the sudden collapse of the entire system. Further supporting explanations can be found in Fig. S3 and S5.
As increases above , the value of gradually decreases and approaches the asymptotic value observed in random networks, , as seen in Fig. 2(a). When becomes very large, of the order of the system length, the transition becomes mixed-order (Fig. 1(b)), in contrast to pure first-order transitions at intermediate values of (Fig. 1(c)). In this mixed-order transition, for large , the order parameter still exhibits an abrupt jump, but shows a scaling behavior close to with a critical exponent , similar to what has been found in a random network [9], see inset in Fig.1(b). In this case, the characteristic lengths are of the order of the system linear size and a hole cannot propagate radially. Hence, there is no nucleation process and the system is driven by a bifurcation process, which has been found in [10]. As shown in Fig. 2 (c), the network is highly homogeneous near criticality, without allowing the formation of any hole of significant size.
The above results are based on 5-core percolation, but similar behavior is found for other core percolation, see Figs. S1 and S2. Higher values of exhibit stronger cascading effects that lead to a decrease in , as shown in the inset of Fig. 2(a). For , the phase transition remains continuous at independently of the value , because there is limited propagation of failure in 2-core and 1-core percolation [8], which is an effect of percolation rather than spatial embedding. However, for , the characteristic length of the links leads to the rich dynamical phenomena as described above.
In summary, the type of phase transition at different characteristic lengths is determined by the nature of spontaneous fluctuations following the node removals in the system. For links of short lengths, these fluctuations only act locally, creating progressively all sizes of gaps in a typical fractal fashion. When the characteristic lengths of are very long, the system fails uniformly, since any node removal can impact nodes at any distance. In the intermediate range, a spontaneous emergence of a localized hole which eventually consumes the entire system leads to a rapid system disintegration, with clear features of a first-order transition.
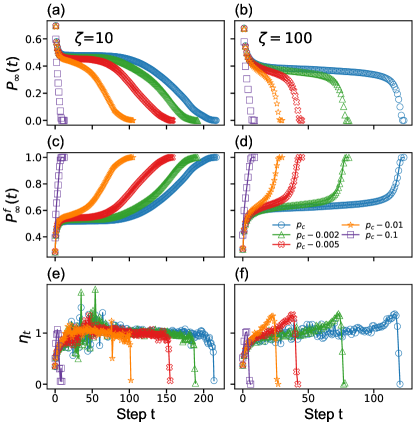
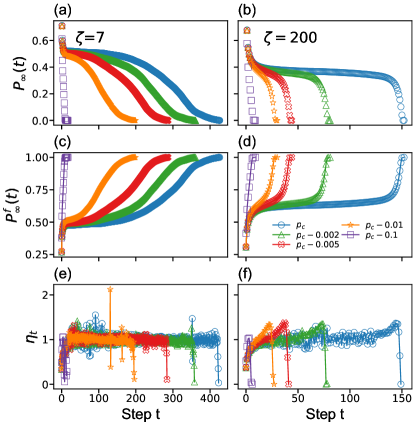
The dynamic process of critical cascading failure. In the previous section, we described how the value of controls the type of transition and indicated that there exist two distinct mechanisms that can lead to discontinuous transitions when . In this section, we focus on studying and quantitatively demonstrating these mechanisms that yield the cascading failure process for and for , both at and near the criticality (Fig. 3). Here, we remove a fraction of nodes as a starting point, similar to Figs. 1(b) and (c), and then follow the evolving giant connected component in each iteration (time step), see Figs. 3(a) and (b). To clearly differentiate between the two dynamical processes, besides following the giant component we also track the largest cluster formed by failed nodes up to the time step , , in Figs. 3(c) and (d). We also monitor the branching factor, defined as the ratio between failure sizes at two successive time steps and in Figs. 3(e) and (f).
The analysis of these properties for highlights three main stages of distinct behavior. undergoes a rapid decline, followed by a plateau, then decreases parabolically and slowly to zero, as seen in Fig. 3(a). In contrast to the case of , in Fig. 3(b), where shows a plateau followed by a sharp drop. This contrast can be understood by following the size of the largest failure cluster in Figs. 3(c) and (d). While for the increase in radius is linear and the area parabolic, characterizing nucleation growth, for , the nearly flat curve is followed by a fast increase, consistent with homogeneous failures followed by a nearly abrupt collapse. Note that Figs. 3(e) and (f) show that during the plateau the branching factor is close to 1 showing another critical feature. This cascading behavior found at is similar to those observed for values just below , that is, at the area under the curve in Fig. 2(a). For these values, one can see a shorter duration of the plateau as we move further from the critical curve, since the system is more fragile, as seen in Figs. 3(a-d).
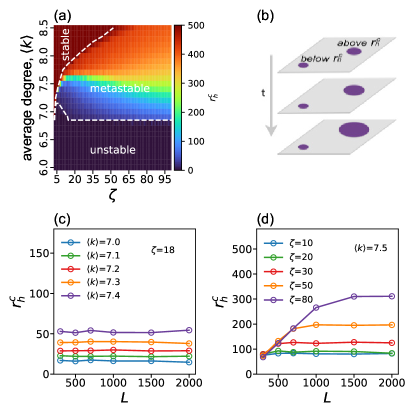
Localized microscopic attack: new extremely vulnerable metastable phase. We have shown above that for intermediate values of , spontaneous fluctuations are the main cause leading to network collapse via nucleation at the critical point . Note that, the regime above the curve of in Fig. 2(a) describes a state of existence of the network, that is the resulting GCC has a non-zero measure. However, we find here that within this area above the curve, there is a new extremely vulnerable phase where a localized microscopic attack anywhere in the system will trigger nucleation growth and network collapse. Importantly, the critical localized size of the attack does not depend on the size of the network. We call this phase a metastable phase, and we highlight this phase in Fig. 4(a) within the dashed line. The system in this phase behaves in marked contrast to regular percolation, where the network in the regime above always remains connected and cannot collapse by any localized attacks [36].
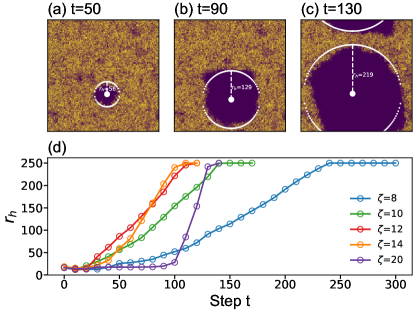
K-core percolation studies focus mainly on random removal of nodes. However, in spatially embedded networks and for the intermediate range , there are strong correlations within the neighborhood of a node, due to the length scale . This is the main driving force behind the metastable phase in which networks become extremely vulnerable to localized attacks, when nodes are removed from a small microscopic area in the network. Next, we study the effect of microscopic localized attacks on k-core percolation in spatially embedded networks via the creation of a hole of radius in the network. In the metastable phase we show the existence of a critical hole radius , below which the network is resilient and sustains damage, and above which the network collapses spontaneously.
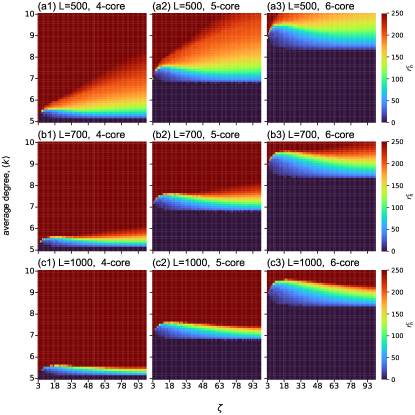
We model a localized attack by creating a hole centered on a random node and removing all nodes located within a geometrical radius from this node and their links. This initial removal is then followed by the k-pruning process, which leads to further damage to the network. The cascade failures triggered by a localized attack depends on the k-core value, the characteristic length of the link and the average degree of the network. In our simulations, we systematically scanned the entire range of and for a given k-core and found that the phase diagram of this system includes three distinct phases: stable, unstable, and metastable, see Fig. 4(a). The stable phase is characterized by the containment of damage within the initial affected area, with no propagation of failure, independent of the size of the initial hole, i.e. only will trivially destroy the network. In the unstable phase, the failure propagates spontaneously throughout the system, even for a minimal attack (), that is, . In the metastable phase, the final state of the system depends on the initial hole size. If the hole radius is less than a critical finite size , then the failure remains local, but for the localized damage propagates outwards spontaneously and the entire system collapses, as demonstrated in the schematic Fig. 4(b).
A key feature of the metastable phase is that the value of the critical hole radius is independent of the system size , in contrast to random attacks where the collapse of system occurs when the number of removed nodes is proportional to . This means that a microscopic intervention yields a macroscopic phase transition. Indeed, in Fig. 4(c), we can see that the radius of the critical hole remains unchanged when increasing the system size for any value in the metastable state. Similarly, in Fig. 4(d) we fix and vary in the metastable regime. We find that increases linearly with , but eventually reaches a threshold where it remains constant despite further increases of , thus highlighting the impact of finite-size effects in the system. The striking conclusion is that increasing the size of the system does not improve its resilience against localized attacks.
The process leading to the metastable phase relies on the formation of the failure front around a hole of size . After removing the initial hole, a fraction of the remaining nodes on the failure front may have remaining degrees below . This leads to the subsequent removal of these nodes in the failure front, causing the propagation of damage to continue radially outwards. The local network density and the length of long-range links are therefore the key factors in determining the probability that the neighboring nodes of the front will retain a degree greater than , or if they will be removed. As a result, the relation between and is enough to determine the eventual state of the system. We verify that the existence of a metastable state is a generic property in these systems with similar results for different k-core percolation processes and system sizes in Fig. S6.
IV Discussion
In this work, we have developed a comprehensive framework to investigate the behavior of k-core percolation within spatially embedded 2D networks. We find that for random node removal, the critical point and the nature of the mechanism behind the phase transition in k-core percolation are determined by the characteristic link length, , of the spatial network. Furthermore, we unveil a rich phase diagram with second-, first-, and mixed-order phase transitions, each associated with specific mechanisms depending on the value of . A key finding in our study is the existence of a previously unexplored regime in the phase diagram, which constitutes an extremely vulnerable (metastable) phase, where microscopic intervention results in a macroscopic phase transition. These findings highlight the surprising vulnerability of spatial k-core systems and point to the important role of the underlying mechanisms that can shape the organization and robustness of real-world systems with spatial characteristics, such as the brain [15].
These results are unique in the fields of network science and phase transitions, since finite perturbations within a limited area in spatial systems are typically contained and cannot damage the entire system. The specific feature in k-core percolation that makes this behavior possible, is that a node needs to maintain a minimum degree at all times to survive, but at the same time its neighbors need to also obey the same condition, i.e., even if a node remains unharmed it fails if the degree of its neighbors becomes lower than the threshold. The long-range links facilitate this interaction between a node and its neighbors and by tuning the length of these shortcuts we can modify the behavior of the transition. This behavior is reminiscent of results in interdependent networks [37] where the existence of two types of interactions, i.e. connectivity and dependency links, leads to a phase diagram where both first-order and second-order transitions are present, and localized microscopic attacks can also bring down the entire system [5, 29, 38, 39]. The main mechanism in interdependent systems is a cascade of removals alternating between the two layers, facilitated by the dependency links. In the case of spatial k-core percolation, however, there exists only one type of connectivity links so an analogy between the two systems is not straightforward. At a conceptual level, however, in k-core percolation the survival of a node also depends on the survival of its neighbors, which may suggest that a node’s dependence on other nodes, either implicit or explicit, is a key feature that can lead to novel percolation properties. For example, previous research has shown that the two models have the same critical exponents near the critical point in random non-spatial networks [40, 8, 41]. These observations lead us to conjecture that nodes interdependence, broadly defined, could be the underlying common characteristic of a novel universality class, which has not been observed until now. The existence of such a universality class remains currently unknown and further work is needed to clarify its possible existence and its properties. On the other hand, our insight about the microscopic processes and their origin during the mixed order and first order abrupt transitions in both k-core and interdependent networks could shed light on the mechanisms of many systems where such transitions occur.
V Acknowledgment
This work was supported by the Israel Science Foundation, the Binational Israel-China Science Foundation (Grant No. 3132/19), the NSF-BSF (Grant No. 2019740), the EU H2020 Project RISE (Project No. 821115), and the EU H2020 DIT4TRAM. Zengru Di acknowledges the support from the Key Program of the National Natural Science Foundation of China (Grant No. 71731002). Bnaya Gross acknowledges the support of the Mordecai and Monique Katz Graduate Fellowship Program. Leyang Xue and Shengling Gao acknowledge the support of the China Scholarship Council Program.
References
- Christensen and Moloney [2005] K. Christensen and N. R. Moloney, Complexity and criticality, Vol. 1 (World Scientific Publishing Company, 2005).
- Dorogovtsev et al. [2008] S. N. Dorogovtsev, A. V. Goltsev, and J. F. F. Mendes, Rev. Mod. Phys. 80, 1275 (2008).
- Stanley [1971] H. E. Stanley, Phase transitions and critical phenomena, Vol. 7 (Clarendon Press, Oxford, 1971).
- Solé [2011] R. Solé, Phase transitions, Vol. 3 (Princeton University Press, 2011).
- Li et al. [2012] W. Li, A. Bashan, S. V. Buldyrev, H. E. Stanley, and S. Havlin, Physical Review Letters 108, 228702 (2012).
- Lee et al. [2017] D. Lee, W. Choi, J. Kértesz, and B. Kahng, Scientific Reports 7, 5723 (2017).
- Gross et al. [2022] B. Gross, I. Bonamassa, and S. Havlin, Physical Review Letters 129, 268301 (2022).
- Gao et al. [2023] S. Gao et al., arXiv preprint arXiv:2305.06443 (2023).
- Dorogovtsev et al. [2006] S. N. Dorogovtsev, A. V. Goltsev, and J. F. F. Mendes, Physical Review Letters 96, 040601 (2006).
- Baxter et al. [2015] G. Baxter, S. Dorogovtsev, K.-E. Lee, J. Mendes, and A. Goltsev, Physical Review X 5, 031017 (2015).
- Lee et al. [2016a] D. Lee, M. Jo, and B. Kahng, Physical Review E 94, 062307 (2016a).
- Wu et al. [2022] R.-J. Wu, Y.-X. Kong, Z. Di, Y.-C. Zhang, and G.-Y. Shi, Physica A: Statistical Mechanics and its Applications 608, 128260 (2022).
- Li et al. [2021] M. Li, R.-R. Liu, L. Lü, M.-B. Hu, S. Xu, and Y.-C. Zhang, Physics Reports 907, 1 (2021).
- Kong et al. [2019] Y.-X. Kong et al., Physics Reports 832, 1 (2019).
- Van Den Heuvel and Sporns [2011] M. P. Van Den Heuvel and O. Sporns, Journal of Neuroscience 31, 15775 (2011).
- Lahav et al. [2016] N. Lahav et al., New Journal of Physics 18, 083013 (2016).
- Shanahan et al. [2013] M. Shanahan, V. P. Bingman, T. Shimizu, M. Wild, and O. Güntürkün, Frontiers in Computational Neuroscience 7, 89 (2013).
- Luo et al. [2009] F. Luo, B. Li, X.-F. Wan, and R. H. Scheuermann, in BMC bioinformatics, Vol. 10 (BioMed Central, 2009) pp. 1–11.
- Filho et al. [2018] H. A. Filho, J. Machicao, and O. M. Bruno, PloS One 13, e0195843 (2018).
- Carmi et al. [2007] S. Carmi, S. Havlin, S. Kirkpatrick, Y. Shavitt, and E. Shir, Proceedings of the National Academy of Sciences 104, 11150 (2007).
- Alvarez-Hamelin et al. [2005] I. Alvarez-Hamelin, L. Dall’Asta, A. Barrat, and A. Vespignani, arXiv preprint cs.NI/0511007 (2005).
- Zhang et al. [2008] G.-Q. Zhang, G.-Q. Zhang, Q.-F. Yang, S.-Q. Cheng, and T. Zhou, New Journal of Physics 10, 123027 (2008).
- Burleson-Lesser et al. [2020] K. Burleson-Lesser, F. Morone, M. S. Tomassone, and H. A. Makse, Scientific Reports 10, 3357 (2020).
- Morone et al. [2019] F. Morone, G. Del Ferraro, and H. A. Makse, Nature Physics 15, 95 (2019).
- Wu et al. [2023] R.-J. Wu, Y.-X. Kong, Z. Di, J. Bascompte, and G.-Y. Shi, Physical Review Letters 130, 097401 (2023).
- Pittel et al. [1996] B. Pittel, J. Spencer, and N. Wormald, Journal of Combinatorial Theory, Series B 67, 111 (1996).
- Baxter et al. [2012] G. Baxter, S. Dorogovtsev, A. Goltsev, and J. Mendes, Physical Review Letters 109, 248701 (2012).
- Zhu and Chen [2017] Y. Zhu and X. Chen, arXiv preprint arXiv:1710.02959 (2017).
- Danziger et al. [2016] M. M. Danziger et al., Europhysics Letters 115, 36002 (2016).
- Barthélemy [2011] M. Barthélemy, Physics Reports 499, 1 (2011).
- Bonamassa et al. [2019] I. Bonamassa, B. Gross, M. M. Danziger, and S. Havlin, Physical Review Letters 123, 088301 (2019).
- Gao et al. [2015] J. Gao, T. Zhou, and Y. Hu, Scientific Reports 5, 14662 (2015).
- Moukarzel and Sokolowski [2010] C. F. Moukarzel and T. Sokolowski, in Journal of Physics: Conference Series, Vol. 246 (2010) p. 012019.
- Bunde and Havlin [2012] A. Bunde and S. Havlin, Fractals and disordered systems (Springer Science & Business Media, 2012).
- Vaturi et al. [2022] N. Vaturi, B. Gross, and S. Havlin, Europhysics Letters (2022).
- Shao et al. [2015] S. Shao et al., New Journal of Physics 17, 023049 (2015).
- Buldyrev et al. [2010] S. V. Buldyrev, R. Parshani, G. Paul, H. E. Stanley, and S. Havlin, Nature 464, 1025 (2010).
- Berezin et al. [2015] Y. Berezin et al., Scientific Reports 5, 1 (2015).
- Vaknin et al. [2017] D. Vaknin, M. M. Danziger, and S. Havlin, New Journal of Physics 19, 073037 (2017).
- Lee et al. [2016b] D. Lee, S. Choi, M. Stippinger, J. Kertész, and B. Kahng, Physical Review E 93, 042109 (2016b).
- Gross et al. [2020] B. Gross, H. Sanhedrai, L. Shekhtman, and S. Havlin, Physical Review E 101, 022316 (2020).
VI SUPPLEMENTARY MATERIAL
K-core percolation. For k-core percolation with , the critical point decreases with increasing , and a continuous phase transition is observed at all characteristic lengths, as shown in Figs. S1(a) and S2(a)(b). While long-range links can facilitate the spread of failure across a broader network region, the system for remains resilient with no extensive cascading failures (by definition, the k-core condition does not impose additional restrictions for node removal in 1-core and 2-core percolation, compared to the percolation condition of belonging to the largest cluster) [8]. For k-core percolation with , e.g. in Fig. 2(a), long range interactions lead to the phenomena described in the main text.
Spatio-temporal propagation of a hole. To illustrate the spatio-temporal propagation of cascading failures, we analyzed the radius of holes that emerged during the dynamic process. Figures S3(a)-(c) show an example of the hole radius evolution, . In Fig. S3(d), we plot against for various values, where we can see that transitions from a low value to a larger constant value via almost linear growth. In all cases, two distinct states are observed, which correspond to critical branching and to the nucleation process. At low values, the system undergoes a critical branching process where only small holes exist that grow slowly, and there are no holes of critical finite size. Once the hole size reaches the critical finite size, exhibits a linear growth associated with a nucleation process. This nucleation process continues as increases until reaches a constant value when the holes reach the system boundary. Interestingly, as increases, it takes more time steps to form holes with a critical finite size, the duration of the nucleation process is shorter, and the hole grows faster than in smaller . As explained in the main text, the nucleation process becomes weaker as moves away from .
Dynamic evolution processes for and . To provide further insight into the distinction between nucleation and critical branching processes, we follow the evolution in two extreme cases, and . When is close to , the radius of the hole that can trigger the failure propagation is close to the minimal radius value. Hence, holes that emerge during the dynamic process quickly reach the critical size and induce the nucleation process in subsequent time steps. As observed in Figs. S4(a)(c)(e) for , one can see that undergoes a shorter branching process and then decreases parabolically, while increases parabolically until the system collapses. In contrast, when is of the order of the system length , as shown in Figs. S4(b)(d)(f), we observe a prolonged plateau for , followed by a sharp decrease and an abrupt growth for , associated with an avalanche process. As gradually moves away from , both the nucleation and the critical branching processes exhibit a behavior similar to that in , but with shorter dynamic processes.
The dynamic process and mechanisms driving the phase transition for various . In k-core percolation, the nature of the phase transition depends on the characteristic length, , and on the existence of spontaneous fluctuations which form due to the node removal process. Values of below lead to a continuous phase transition. At the transition changes to first order, and for even higher values of of the order of the system size, the transition changes to mixed-order. By examining snapshots at different time steps, here we give a clear insight into the underlying mechanisms behind the dynamic processes which lead to the corresponding phase transitions, as shown in the Fig. S5.
For small values, failures are limited to local propagation. As shown in Fig. S5(a1)-(a3), the damaged regions of the network gradually propagate outward from the initial points of failure, leading to a structure exhibiting typical fractal features. In line with this, in Fig. S5(a), the size of the giant component exhibits an almost parabolic decrease, while the largest failure cluster shows parabolic growth in earlier time steps. This is followed by a prolonged plateau, indicating the removal of a small number of nodes (microscopic sizes) at each step, as evidenced in Fig. S5(a) and (a4)-(a9).
For intermediate values, local failures can propagate further. Local fluctuations give rise to a hole, i.e. a large local concentration of removed nodes. The formation of such a hole is followed by an expansion of the hole diameter, as it consumes nodes around its perimeter which continues to grow until the entire system collapses, see Fig. S5(b2)-(b9). Figure S5(b) clearly illustrates a rapid decrease in the size of the giant component as the hole expands outwards, coupled with a corresponding growth in the size of the largest failure cluster, a behavior consistent with a nucleation process.
For larger values, of the order of the system size, failures can transfer anywhere in the system. The network structure remains homogeneous throughout the removal process, without any significant holes, which indicates a bifurcation process. The network continuously dilutes until it eventually undergoes an avalanche process which leads to a sudden collapse, as evidenced in Fig. S5(c1)-(c9). As a result, the size of the giant component and the largest failure cluster display an extended plateau phase, which ultimately leads to rapid descent and growth, respectively.
Localized attacks in the metastable phase are independent of the system size. A key finding in this work is that a localized attack of a small critical size can destroy the system, independently of the system size. We demonstrate this point in Fig.S6, where we plot the critical radius length, i.e. the minimum hole size that can destroy the system, as a function of the average degree and of the characteristic length, , for different system lengths (see also Figs. 4(c) and 4(d) in the main text). These plots are the equivalent of a phase diagram, where the structural system parameters (here and ) determine the state (phase) of the system. In general, we can distinguish three different regimes: (a) Unstable regime. At the bottom of the diagram, which means that the system is already at a collapse state. (b) Stable regime. A stable regime appears at the top area of the diagram, which corresponds to dense stable networks with high values. The k-structures in the original system are now stronger and nodes have a higher number of connections, which means that they are less vulnerable to the loss of a neighbor. As a result, the critical hole size is of the order of the system size , i.e. the system cannot be destroyed by a localized attack, except for the trivial case where this attack reaches the entire system. (c) Metastable regime. In this area, the critical hole size, , has a finite value smaller than the system linear scale. The key observation here is that remains constant in this regime as we increase the system size in the figure. We observe a small finite-size effect, where the extent of the regime becomes smaller with size, but it is clear that there is always an area where the value of remains unchanged. The same behavior is also observed for any k-core value. These observations demonstrate the extreme vulnerability of the system to localized attacks in this metastable regime, since a very large system can fail due to removing a very small fraction of its nodes.