Evaluation Metrics of Language Generation Models
for Synthetic Traffic Generation Tasks
Abstract
Many Natural Language Generation (NLG) tasks aim to generate a single output text given an input prompt. Other settings require the generation of multiple texts, e.g., for Synthetic Traffic Generation (STG). This generation task is crucial for training and evaluating QA systems as well as conversational agents, where the goal is to generate multiple questions or utterances resembling the linguistic variability of real users. In this paper, we show that common NLG metrics, like BLEU, are not suitable for evaluating STG. We propose and evaluate several metrics designed to compare the generated traffic to the distribution of real user texts. We validate our metrics with an automatic procedure to verify whether they capture different types of quality issues of generated data; we also run human annotations to verify the correlation with human judgements. Experiments on three tasks, i.e., Shopping Utterance Generation, Product Question Generation and Query Auto Completion, demonstrate that our metrics are effective for evaluating STG tasks, and improve the agreement with human judgement up to 20% with respect to common NLG metrics. We believe these findings can pave the way towards better solutions for estimating the representativeness of synthetic text data.
Evaluation Metrics of Language Generation Models
for Synthetic Traffic Generation Tasks
Simone Filice2, Jason Ingyu Choi1, Giuseppe Castellucci1, Eugene Agichtein1, Oleg Rokhlenko1 1Amazon, Seattle - USA 2Amazon, Tel Aviv - Israel {filicesf,chojson,giusecas,eugeneag,olegro}@amazon.com
1 Introduction
Synthetic Data Generation (SDG) is often used to augment the training material of Natural Language Processing (NLP) models Feng et al. (2021). Synthetic data is needed as the increasing complexity of NLP models makes them data hungry, while privacy concerns complicate the acquisition, storage and annotation of real data. SDG is particularly useful for AI assistants, since large-scale data is needed to train and to track their performance. Text generation is controlled by prompting the model with the content to verbalize. For example, to generate shopping utterances for voice-based e-commerce, the input can include an intent, e.g., search, and slotting information, e.g., a product. Given the multitude of linguistic expressions for searching a product, NLG models must generate multiple outputs for the same prompt. We refer to this single-prompt-multi-output setting as Synthetic Traffic Generation (STG).
Evaluating NLG models for STG is an open question. Common solutions, e.g., BLEU Papineni et al. (2002), ROUGE Lin (2004), or BERT-score Zhang et al. (2020), independently rate each text. As shown in table 1, averaging per-utterance scores is not ideal. The table compares synthetic and user utterances having the same search intent about running shoes by Nike; each synthetic utterance is individually good, but if we consider entire bags111A bag refers to a set of utterances with repetitions, which allows to distinguish between frequent and rare expressions., it is clear that the generated data does not resemble real traffic.
| Real Traffic Data | Synthetic Traffic Data |
|---|---|
| Search for nike running shoes | Search for nike running shoes |
| Look for shoes for running | Search for nike running shoes |
| Do you have running shoes from nike | Search for nike running shoes |
| Search nike shoes | Search for nike running shoes |
| Can you show me blue running shoes | Search for nike running shoes |
In this paper, we propose several metrics to evaluate NLG models for STG. Our metrics perform a bag-level comparison between generated texts and real user data. To validate our metrics, we design an automatic procedure where the reference bag is manipulated using different types of noise. We compare the resulting noisy bags with the original bag and verify whether our metrics can capture synthetically introduced noises. We further conduct manual assessments to verify the correlation between the metrics and human judgments on deciding which generated bag is more similar to the reference one. Experiments using one publicly available dataset and two real industry scenarios show that our proposed bag-level metrics are superior to standard NLG metrics that average all possible pairwise scores. Nevertheless, evaluating the quality of synthetic data is still an open problem that deserves special attention from the community. From our knowledge, this is the first work that studies a wide range of existing metrics in the context of STG, and we believe our findings represent a valuable starting point in this research direction.
2 Related Work
Evaluation in NLG is challenging as many tasks are open ended and there are almost infinite ways to express a concept Gatt and Krahmer (2017). Human judgement is the gold standard but it is expensive and time-consuming; researchers thus often resort to automatic metrics. Common metrics are untrained and evaluate the n-gram overlap between generated and reference texts. For example, Bilingual Evaluation Understudy (BLEU) Papineni et al. (2002), often used in Machine Translation, computes the weighted geometric mean of n-gram precision scores; Recall-Oriented Understudy for Gisting Evaluation (ROUGE) Lin (2004), initially proposed in automatic summarization, focuses on recall; Consensus-based Image Description Evaluation (CIDEr) Vedantam et al. (2014), proposed for image captioning, uses tf-idf to compute the weighted n-gram overlap. Others relax the lexical match by using synonyms (e.g., Metric for Evaluation of Translation with Explicit ORdering (METEOR) Banerjee and Lavie (2005)) or embeddings similarity (e.g., MoverScore Zhao et al. (2019)).
Other metrics are machine learned: BERTscore Zhang et al. (2019) uses BERT embeddings Devlin et al. (2019) to match candidate words by cosine similarity; Sentence-BERT (SBert) Reimers and Gurevych (2019) is a Siamese network to compute the cosine similarity between BERT sentence embeddings; BLEURT Sellam et al. (2020) is a BERT model fine-tuned to provide human-like ratings.
The above metrics compare a generated text with a reference. Since a single reference cannot cover all the plausible outputs, researchers propose to use multiple references to improve the correlation with human judgments Läubli et al. (2020). Some metrics, e.g., BLEU, support multi-references, while others can be extended by computing the average or max score across all references. This single-generation-multi-reference comparison is still different from our use case, as we need to compare multiple generated outputs to multiple references.
In the context of Generative Adversarial Networks Goodfellow et al. (2014), some metrics have been proposed to compare distributions of generated and reference images Borji (2019). These are tailored for the Computer Vision domain and cannot be easily applied to NLG. For a more detailed survey on NLG evaluation, please refer to Celikyilmaz et al. (2020).
3 Metrics for Synthetic Traffic Generation
| Metric | Description |
|---|---|
| Pair | Averaged pairwise scores using BLEU-3. |
| Pair | Averaged pairwise scores using ROUGE-L. |
| Pair | Averaged pairwise scores using CIDEr. |
| Pair | Averaged pairwise scores using SBert. |
| Cos | Cosine similarity of TF representations of and . |
| Cos | Cosine similarity of TF-IDF representations of and . |
| Clus | DBSCAN applied to TF encodings of and . |
| InvPP | Inverse of perplexity of 4-gram language model. |
| InvKL | Inverse of KL divergence of unigram distributions. |
| Align | Alignment-based metric using BLEU-3. |
| Align | Alignment-based metric using ROUGE-L. |
| Align | Alignment-based metric using CIDEr. |
| Align | Alignment-based metric using SBert. |
We propose different families of metrics. In the following, we refer to the generated and reference bags with and , respectively.
Pairwise Metrics. A naïve solution for estimating the bag-to-bag similarity is computing the average sentence-to-sentence similarity between all the pairs from the two bags. More formally, given a sentence-to-sentence similarity metric , we define the pairwise bag-to-bag similarity as:
This solution tends to favor generated bags that contain mostly texts from the head of the reference distribution (i.e., the most frequent expressions). The reason is that each text in is compared to each text in , and head texts maximize the average similarity.
Alignment-based Metrics. Word alignment has been extensively studied in machine translation (Och and Ney, 2000; Li et al., 2019). We propose metrics based on sentence-level alignment. In particular, we expand the ideas proposed in graph algorithms (Bhagwani et al., 2012) by representing and as a bipartite graph where each sentence from and corresponds to a node. We create edges connecting each node to each node by assigning a weight as , where can be any existing sentence-to-sentence similarity metric. To compute sentence-level alignments, we apply an existing maximal matching algorithm (Gabow, 1976) to the resulting graph and obtain the sentence-level alignment . Once maximal matching pairs are found, we compute the bag-to-bag similarity as:
This is essentially summing the weights that maximize the pairwise similarity defined by any sentence similarity metric, normalized by the length of two bags222In this formulation we are assuming that . If instead the number of texts in the two bags are different, they can be made equal by using upsampling or downsampling..
In our formulation we enforce a strict 1-to-1 alignment, i.e., each node from is aligned to a single node from , and vice versa. Note that if there are duplicate texts in a bag, we simply create multiple copies of the same node.
Clustering Metrics.
We explore metrics proposed for data clustering, such as cluster purity, which measure how balanced class labels are within each cluster. Specifically, given and and any sentence encoder , we estimate the bag-to-bag similarity using the procedure illustrated in Algorithm 1.
We mix and into a bag and measure as the percentage of texts from in . Then, we apply DBSCAN Ester et al. (1996) to . If and are similarly distributed, the resulting clusters should contain texts of both bags, otherwise the clusters should have a higher purity, i.e., containing texts only from or . For each cluster we can compute the difference between its percentage of texts from , namely , and the expected percentage . The bag similarity is the weighted average of these values.
We use DBSCAN as it does not need to specify the number of clusters: indeed, the optimal number of clusters is unknown. Intuitively, this value corresponds to the number of sub-modalities users can adopt to verbalize a given concept.
Document Similarity Metrics. We consider also document similarity solutions: given a sentence encoder , we compute the vector representation of a bag by summing up the encoding of its texts, i.e., . The similarity between and is then the cosine similarity of their vectors:
We also consider representing the bags as their uni-gram probability distribution and compute the Kullback–Leibler divergence (Joyce, 2011) . As a similarity score, we adopt the inverse of such value:
Language Model Metrics. We define a metric inspired by the ASR and language model literature. We train a language model333We adopt a 4-gram language model with Knerser-Ney Smoothing Hsu and Glass (2008). using and compute the perplexity of texts in , i.e., . The final score is then the inverse of the perplexity:
4 Evaluating the Evaluation Metrics
In this section we describe two strategies - one entirely automatic, the other one based on human judgements - to validate and identify the most promising metrics for STG. Refer to Table 2 for a summary of the metrics we adopt in the experiments below.
4.1 Evaluation Tasks and Data
Product Question Generation (PQG). Given a product we aim to generate product related questions. We prompt a NLG model with the product title, product category and product attribute type (e.g., shoes type, hard drive capacity).
We adopt two open-source datasets: Amazon Product Question Answers (Amazon-PQA) (Rozen et al., 2021) and MAVE (Yang et al., 2022). The former contains 10M product questions/answers from amazon.com. The latter contains product category and product attribute type-value annotations on 2.2M Amazon products. We select the product questions from Amazon-PQA corresponding to products in MAVE. We apply keyword matching to identify the questions containing category-specific attribute values. For example, the question “How many mb is in the 64 gb?” contains the value “64 gb” for the attribute “usb flash drives capacity”. By applying this procedure we obtained 84,044 questions that contain product category/attribute annotations from MAVE. Following the context definition from Section 4.1, there are 31,727 unique contexts distributed across 22,900 unique products. There are 1,246 (3.9%) contexts that contain 10+ questions, 9,982 (31.4%) with 2-9 questions and 20,499 (64,6%) only have 1 question.
To create a test split, we sampled 1,000 contexts from 10+ questions group since we had to ensure test samples contain at least 10 questions. Similarly for development set, 1,000 contexts are sampled from 2-9 questions group. Lastly, all remaining 29,727 contexts are allocated to training set. There are 55.8k, 3.2k and 24.8k questions in training, development and test sets, respectively.
Shopping Utterance Generation (SUG). Given a product and an intent we aim to generate voice shopping utterances for a conversational assistant. We consider buy, search, add to cart and check price intents. To create the data for SUG, we used 13 months of logs from the real traffic of a shopping assistant, from which we extracted de-identified (anonymous) utterances, along with their intent and the purchased/searched product. The data from the first 12 months have been used for training and the remaining for evaluation.
Query Auto Completion (QAC). Given a product search query we aim to generate query auto-completions. We collected 50k train and 5k test queries from our search logs. The reference bags include the top-10 queries obtained from the Amazon auto-completion API444https://completion.amazon.com.
4.2 Automatic Evaluation
We propose a scalable automatic evaluation procedure. Starting from a reference bag , we create a ranking of multiple generated bags byincrementally applying multiple manipulations (or by applying the same manipulation with increased strength). This procedure guarantees that the bags in are always ranked by their level of noise. We use a metric to compute the similarity between and each . Finally, we rank the generated bags according to the metric scores, and verify whether the resulting ranking correlates with the real ranking . Our manipulations include:
-
•
Text Distribution Manipulation (TDM) (not in QAC): we alter the original distribution in to be more peaked (i.e., we substitute occurrences of tail texts with head ones) or flatter (i.e., we equalize the occurrences of each text in the bag).
-
•
Noisy Text Injection (NTI): we replace an increasing number of texts of with texts having different intents (SUG), products (SUG and PQG), or completions of different queries (QAC).
-
•
Easy Data Augmentation (EDA) Wei and Zou (2019): we modify an increasing number of texts from by applying word swapping, replacement, deletion or insertion.
-
•
Carrier Phrase555With carrier phrase we indicate the sentence portion indicating the user intent, e.g., I want to buy in the sentence I want to buy the latest iphone. Substitution (CPS) (only for SUG): we modify an increasing number of texts in by changing their carrier phrase with a random one from the same intent.
-
•
Itemname666With itemname we indicate the product mention, e.g., the latest iphone in the sentence I want to buy the latest iphone. Specificity Manipulation (ISM) (only for SUG): we modify an increasing number of texts in by making their itemname broader (removing product attributes identified by a BERT-based NER model Filice et al. (2021)) or more specific (adding popular attributes associated to the product).
We use 3,833, 2,085 and 5,000 synthetic rankings for SUG, PQG and QAC, respectively. Each contains one reference bag and a sequence of 5 manipulated bags, ranked by their level of noise. For efficiency, we limit each bag size to 100 by randomly down-sampling larger bags. Reference bags contain 32.07, 14.78 and 9.59 texts, with a 34.40, 21.99 and 1.19 standard deviation, for SUG, PQG and QAC, respectively.
Figure 1 reports the Spearman correlation between the real rankings and the ones induced by different metrics . We can observe that, pairwise metrics perform poor on TDM: the correlations are very low in SUG and PQC. Compared to other metrics, they exhibit low correlations also on NTI, especially in the QAC task. When the alignment is applied to pairwise metrics (both lexical and learned), we observe significant increases in correlation in all cases, suggesting the effectiveness of the proposed alignment. We argue that aggregating every possible pairwise scores favor the head of the distribution (i.e., frequent expressions/terms), while finding the optimal alignment better considers also the tail.
On almost all manipulations, Pair performs worse than Pair, and similarly Align achieves better correlations than Align. We suspect pre-trained models are not calibrated enough to evaluate texts from that share extremely similar lexical patterns (i.e., utterances with same intent-product pair in SUG or auto-completed queries from QAC).
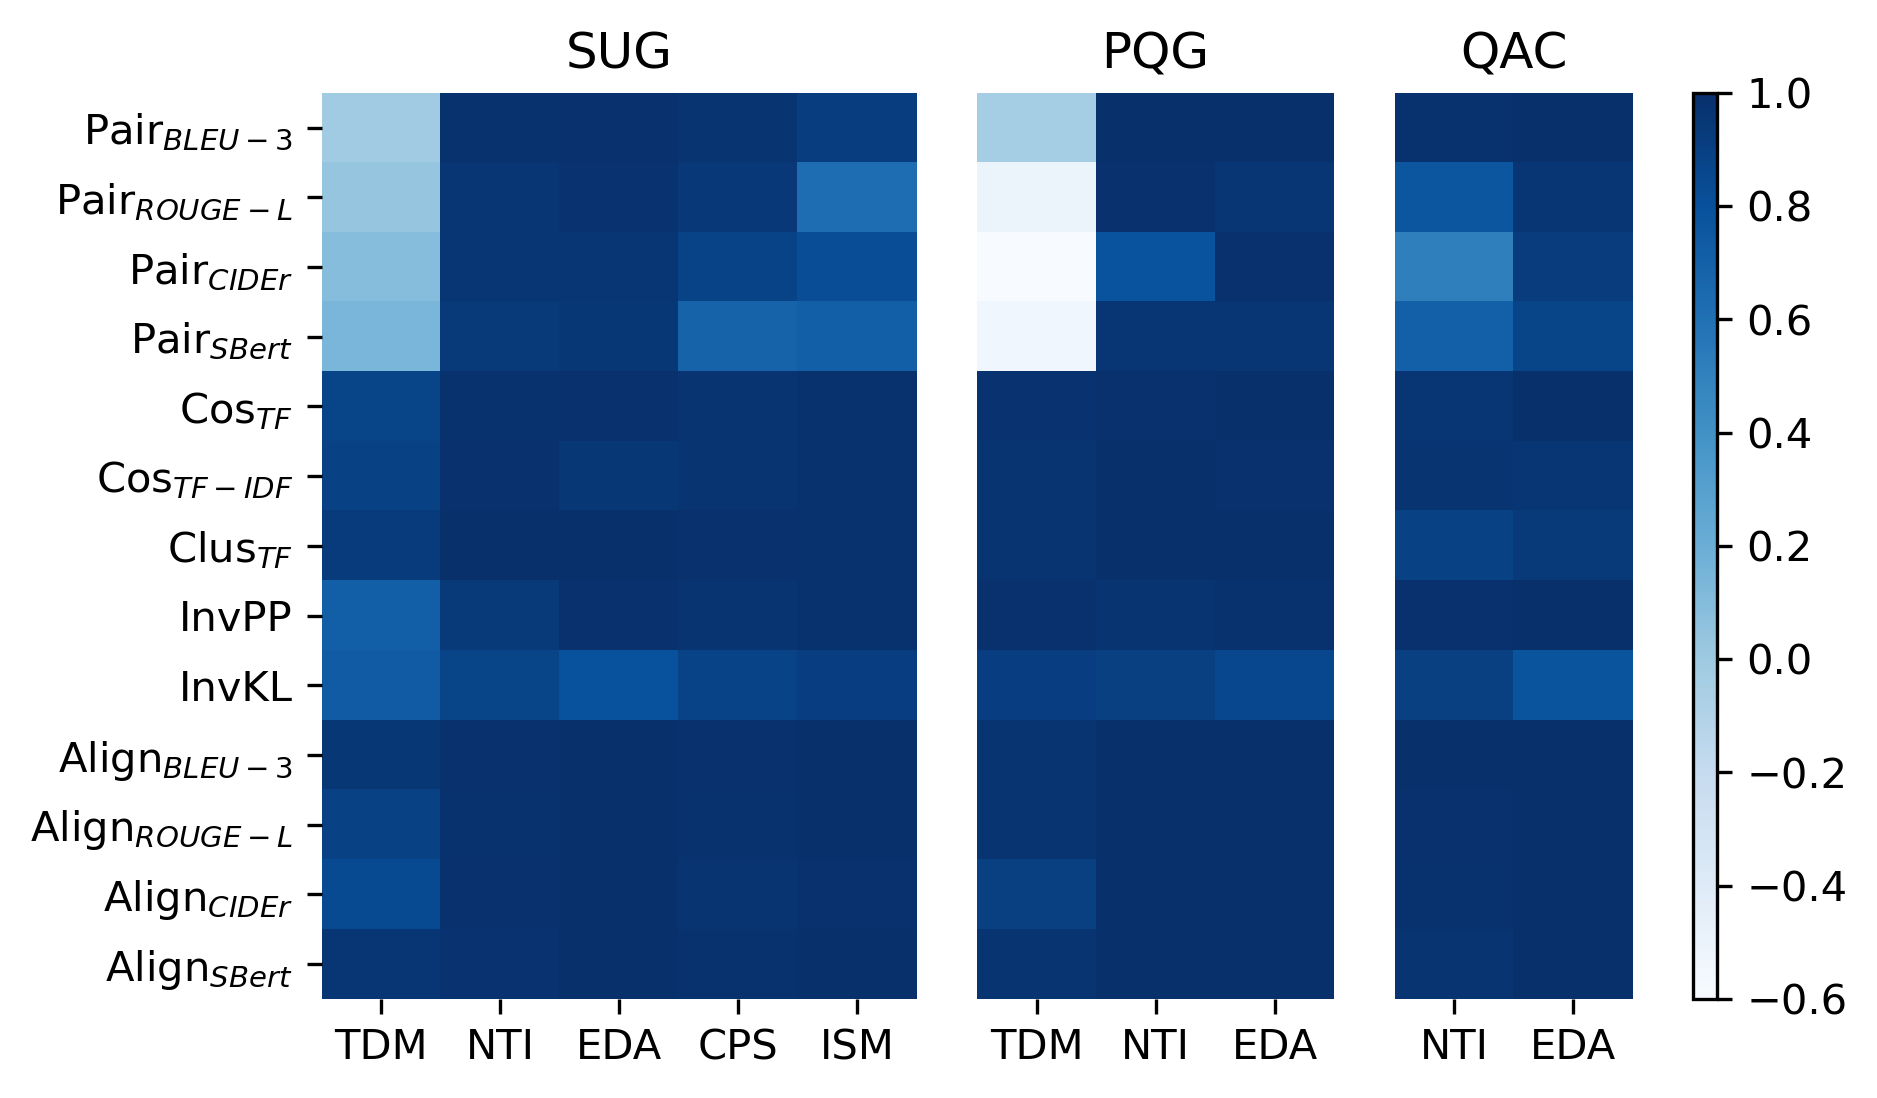
Document metrics (i.e., Cos or Cos) show strong and consistent performances in all three tasks. This is because representing an entire bag with a single representation preserves the word distribution of the bag for both tail and head expressions. Lastly, InvPP, InvKL and Clus are also competitive metrics.

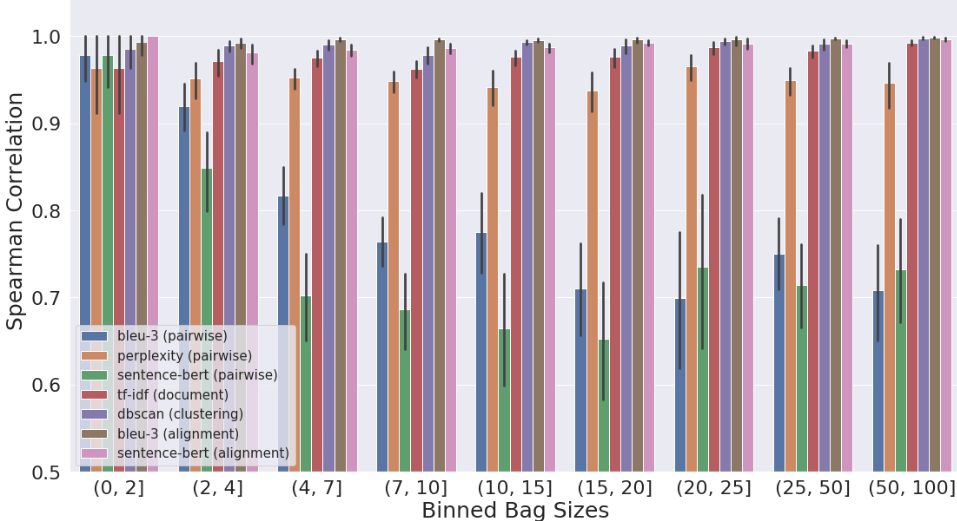
Rank Correlation vs. Bag Sizes. We further study how different metrics perform across different bag sizes. We select the top performing 7 metrics and we focus on SUG, as in PQG contains on average less than 5 questions and is less comprehensive compared to SUG, while in QAC the reference bag always contains 10 auto-completions. As shown in Figure 3, pairwise metrics suffer from performance loss as bag size increases. For instance, pairwise-BLEU-3 starts with almost perfect correlation (1.0), and degrades to 0.75 for bag sizes > 50. The trend is similar for Sentence-BERT, but the drops are much more significant. Conversely, when alignment is applied to pairwise metrics, performances are consistently strong across all bag sizes. It seems that alignment significantly reduces noise by finding the maximal alignment among two bags. For document and clustering-based metrics, there is a slight increase in performance as the bag size increases. Theoretically, document metrics should perform stronger with larger bags. However it was surprising to see that these metrics perform almost equally well on smaller bag sizes (e.g. size <= 2). For TF-IDF approaches, this makes sense because individual sentence vectors are computed first and summed to represent the bag. Hence, each sentence encoding still carries its meaning.
4.3 Human Evaluation
The generated bags we use in the automatic procedure are synthetically obtained by manipulating the reference bag, and might not fully resemble the real quality issues introduced by NLG models. Thus, we also run a human annotation task on bags generated by NLG models, and ask human experts to rate them.
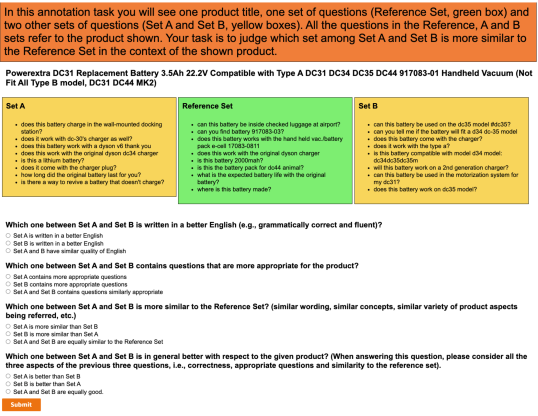
Annotation Task. We opt for a comparative annotation task, where annotators provide their preference between two generated bags; the comparative approach helps reducing subjectivity and typically leads to better annotators’ agreement Callison-Burch et al. (2007). Figure 4 illustrates an example of our annotation task for PQG. Annotators are given the following information:
-
•
Context: In SUG, the context is made of the product title and the intent. In PQG, the context is the product title. In QAC the context is the web query.
-
•
Reference Bag: a bag of texts containing the reference data related to the shown context.
-
•
Generated Bags: two bags of texts generated with two different models.
In each annotation task we collect preferences on: Q1 fluency and grammatical correctness; Q2 relevancy to the context (the product in SUG and PQG and the query in QAC); Q3 similarity to the reference bag; Q4 overall preference. Our analysis considers only Q4, but the other questions are useful to let the annotators focus on different quality aspects before expressing their overall preference. Human experts (i.e., full-time scientists) annotated 200 bag pairs for each task. A subset of these pairs were annotated by multiple annotators and we measured a satisfactory agreement on Q4: Fleiss Kappa 0.437 in SUG, 0.537 in PQG, and 0.824 on QAC. Most of the disagreement (see last bar in Figure 2) occurs when one annotator expresses a tie, while the other a preference. This is a non-severe error which can happen when an annotator notices a difference that the other does not observe or judges as marginal.
Traffic Generation Models.
For PQG, we consider the following models: (i) BART-base Lewis et al. (2019) with beam search (beam-size=10); (ii) BART-large with nucleus sampling Holtzman et al. (2019) (top-p=0.9). For SUG, we use: (i) a template-based solution where predefined intent-related carrier phrases are combined with itemnames extracted from product titles; (ii) a BART-base model with nucleus sampling (top-p=0.9). For QAC we consider (i) BART-base with beam search (beam-size=10) and (ii) T5-base Raffel et al. (2019) with nucleus sampling (top-p=0.9).
We trained all the models for 15 epochs and applying the Early Stopping with patience 3. We limited the maximum length to 256. For BART-base and T5-base we adopted a batch size 32, while for BART-large the batch size was set to 8, due to memory limitations. All the models have been acquired with 4 Nvidia V100 GPUs.
In all tasks, we also consider real texts as one of the bags under comparison: this bag and the reference bag are two different samples from the same distribution, i.e., utterances about the same intent-product in SUG, questions about the same product-aspect in PQG and top query auto-completions in QAC.
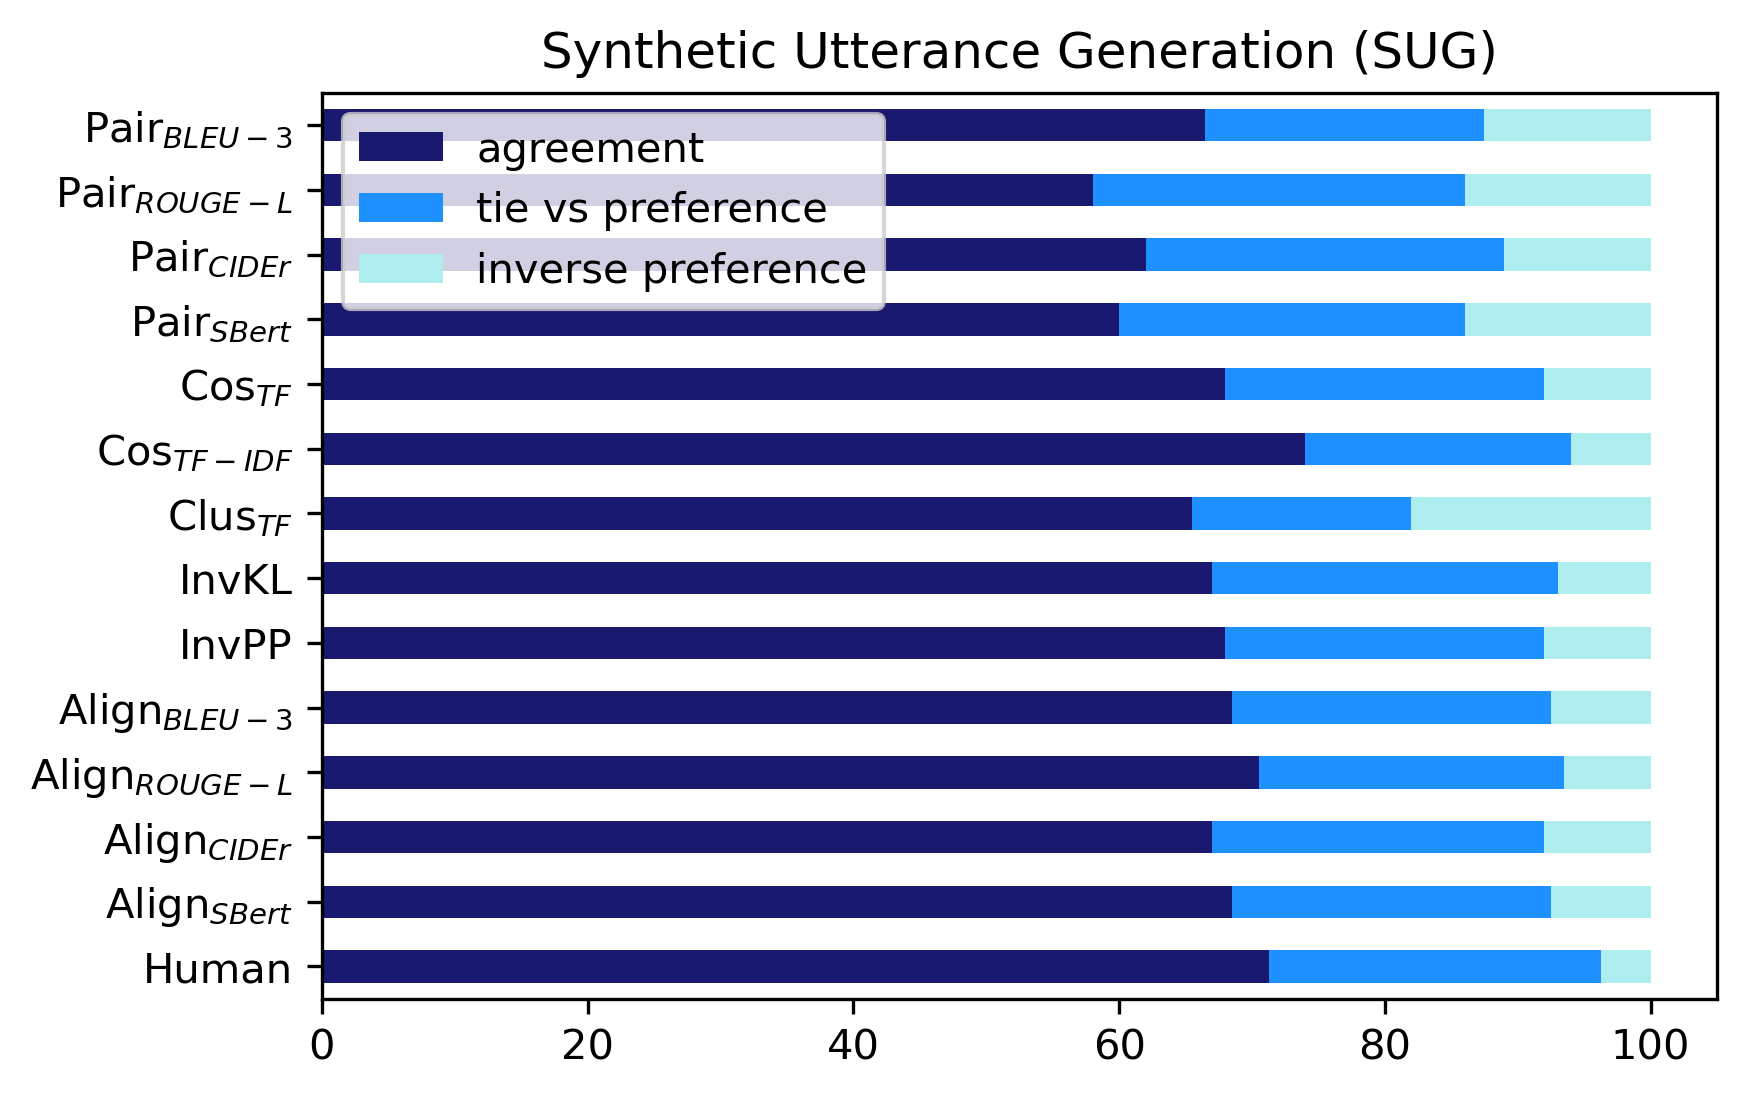
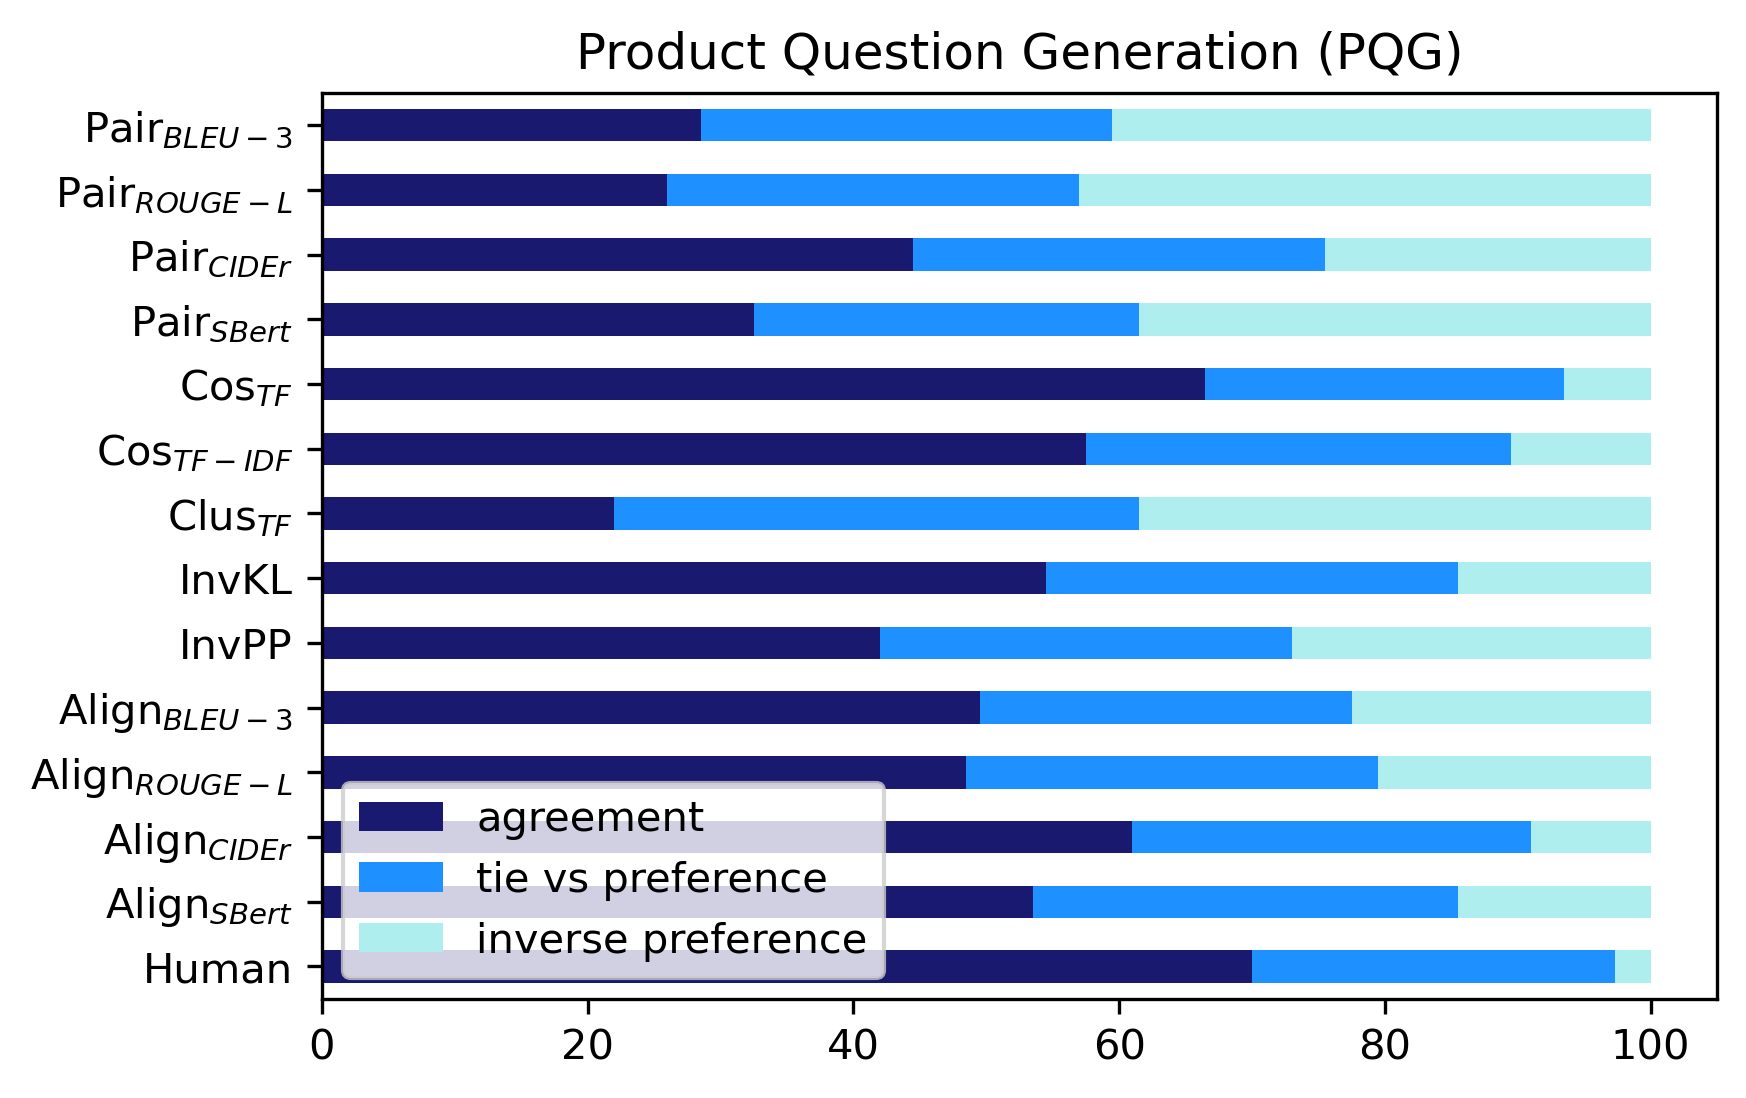
Metric-to-Human Correlations. Figure 2 reports the metric-to-human agreement, measured in accuracy. For each metric we estimate a similarity threshold to express ties: if the difference between the metric scores assigned to two bags is below the threshold, we consider the bags equally good. The threshold is set so that the percentage of ties equal the number of ties expressed by humans (16.5% for SUG, 20.0% for PQG, and 15.1% for QAC). Human evaluation confirms that the naïve usage of sentence similarity metrics (i.e., the pairwise metrics) is not effective to measure the quality of generated traffic, while the application of the alignment strategy yields substantial improvements.
For all tasks, document metrics (in particular, Cos for SUG and QAC and Cos for PQG) perform very consistently and are comparable to inter-annotator agreement, i.e., they select the best bag (or correctly identify a tie). In SUG, inverse document frequency (IDF) helps to focus on itemnames rather than carrier phrases (which have a pretty limited vocabulary). Similarly, in QAC IDF helps to focus on terms that are not part of the original input query. Also annotators privilege this novel terms when evaluating bag similarity, giving Cos some advantage. On the other side, in PQG there are many rare words (e.g., numerical tokens related to product models, dimensions, etc.) and when IDF assigns high weights on them, performance degrades. Higher results on QAC can be justified by its simpler evaluation setting: the bags contain distinct queries and this emphasizes their differences, making their comparison easier for both humans and metrics.
Overall, we argue that evaluating STG models cannot be done with standard metrics; instead, we need to consider the generated traffic as a whole. We claim that computing bag-level representations using document metrics (i.e., CosTF-IDF or CosTF) produce the most consistent solution, especially on tasks that require to generate texts with different prevalence, like SUG and PQG where we observe 8% and 22% agreement improvement w.r.t. the best pairwise metric.
5 Conclusions
This paper introduced the Synthetic Traffic Generation task, which requires a single-prompt-multi-output NLG solution, and its importance in real-world applications (e.g., for conversational agents). We tested the applicability of standard NLG evaluation metrics, like BLEU, that individually judge the quality of the generated utterances. Through extensive evaluations on publicly available and industry datasets, we observed that standard NLG metrics do not capture all the nuances of a distribution of texts. We proposed metrics that consider the generated traffic as a whole. In our experiments, document-based metrics, where we represent a text distribution as a single vector (e.g., a TF or TF-IDF representation), which can be compared to other distributions through cosine similarity, provides the most consistent solution. On tasks requiring to generated a full text distribution we observed up to 20% metric-to-human correlation improvement w.r.t. standard NLG metrics. While further work is needed to define better strategies for evaluating whether synthetic traffic is representative, we believe that our work provides a good starting point. These findings can help reducing the need for human annotations by supporting the development of better Synthetic Traffic Generation models. In fact, these models can be used to produce realistic data for optimizing or testing NLP pipelines in conversational agents.
References
- Banerjee and Lavie (2005) Satanjeev Banerjee and Alon Lavie. 2005. METEOR: An automatic metric for MT evaluation with improved correlation with human judgments. In Proceedings of the ACL Workshop on Intrinsic and Extrinsic Evaluation Measures for Machine Translation and/or Summarization, pages 65–72, Ann Arbor, Michigan. Association for Computational Linguistics.
- Bhagwani et al. (2012) Sumit Bhagwani, Shrutiranjan Satapathy, and Harish Karnick. 2012. sranjans: Semantic textual similarity using maximal weighted bipartite graph matching. In * SEM 2012: The First Joint Conference on Lexical and Computational Semantics–Volume 1: Proceedings of the main conference and the shared task, and Volume 2: Proceedings of the Sixth International Workshop on Semantic Evaluation (SemEval 2012), pages 579–585.
- Borji (2019) Ali Borji. 2019. Pros and cons of gan evaluation measures. Computer Vision and Image Understanding, 179:41–65.
- Callison-Burch et al. (2007) Chris Callison-Burch, Cameron Fordyce, Philipp Koehn, Christof Monz, and Josh Schroeder. 2007. (meta-) evaluation of machine translation. In Proceedings of the Second Workshop on Statistical Machine Translation, pages 136–158, Prague, Czech Republic. Association for Computational Linguistics.
- Celikyilmaz et al. (2020) Asli Celikyilmaz, Elizabeth Clark, and Jianfeng Gao. 2020. Evaluation of text generation: A survey. CoRR, abs/2006.14799.
- Devlin et al. (2019) Jacob Devlin, Ming-Wei Chang, Kenton Lee, and Kristina Toutanova. 2019. BERT: Pre-training of deep bidirectional transformers for language understanding. In Proceedings of the 2019 Conference of the North American Chapter of the Association for Computational Linguistics: Human Language Technologies, Volume 1 (Long and Short Papers), pages 4171–4186, Minneapolis, Minnesota. Association for Computational Linguistics.
- Ester et al. (1996) Martin Ester, Hans-Peter Kriegel, Jörg Sander, Xiaowei Xu, et al. 1996. A density-based algorithm for discovering clusters in large spatial databases with noise. In kdd, volume 96, pages 226–231.
- Feng et al. (2021) Steven Y. Feng, Varun Gangal, Jason Wei, Sarath Chandar, Soroush Vosoughi, Teruko Mitamura, and Eduard H. Hovy. 2021. A survey of data augmentation approaches for NLP. CoRR, abs/2105.03075.
- Filice et al. (2021) Simone Filice, Giuseppe Castellucci, Marcus Collins, Eugene Agichtein, and Oleg Rokhlenko. 2021. VoiSeR: A new benchmark for voice-based search refinement. In Proceedings of the 16th Conference of the European Chapter of the Association for Computational Linguistics: Main Volume, pages 2321–2329, Online. Association for Computational Linguistics.
- Gabow (1976) Harold N Gabow. 1976. An efficient implementation of edmonds’ algorithm for maximum matching on graphs. Journal of the ACM (JACM), 23(2):221–234.
- Gatt and Krahmer (2017) Albert Gatt and Emiel Krahmer. 2017. Survey of the state of the art in natural language generation: Core tasks, applications and evaluation. CoRR, abs/1703.09902.
- Goodfellow et al. (2014) Ian J. Goodfellow, Jean Pouget-Abadie, Mehdi Mirza, Bing Xu, David Warde-Farley, Sherjil Ozair, Aaron C. Courville, and Yoshua Bengio. 2014. Generative adversarial nets. In NIPS.
- Holtzman et al. (2019) Ari Holtzman, Jan Buys, Maxwell Forbes, and Yejin Choi. 2019. The curious case of neural text degeneration. CoRR, abs/1904.09751.
- Hsu and Glass (2008) Bo-June Paul Hsu and James R. Glass. 2008. Iterative language model estimation: efficient data structure & algorithms. In INTERSPEECH 2008, 9th Annual Conference of the International Speech Communication Association, Brisbane, Australia, September 22-26, 2008, pages 841–844. ISCA.
- Joyce (2011) James M Joyce. 2011. Kullback-leibler divergence. In International encyclopedia of statistical science, pages 720–722. Springer.
- Läubli et al. (2020) Samuel Läubli, Sheila Castilho, Graham Neubig, Rico Sennrich, Qinlan Shen, and Antonio Toral. 2020. A set of recommendations for assessing human–machine parity in language translation. Journal of artificial intelligence research, 67:653–672. Publisher Copyright: © 2020 AI Access Foundation. All rights reserved.
- Lewis et al. (2019) Mike Lewis, Yinhan Liu, Naman Goyal, Marjan Ghazvininejad, Abdelrahman Mohamed, Omer Levy, Veselin Stoyanov, and Luke Zettlemoyer. 2019. BART: denoising sequence-to-sequence pre-training for natural language generation, translation, and comprehension. CoRR, abs/1910.13461.
- Li et al. (2019) Xintong Li, Guanlin Li, Lemao Liu, Max Meng, and Shuming Shi. 2019. On the word alignment from neural machine translation. In Proceedings of the 57th Annual Meeting of the Association for Computational Linguistics, pages 1293–1303.
- Lin (2004) Chin-Yew Lin. 2004. ROUGE: A package for automatic evaluation of summaries. In Text Summarization Branches Out, pages 74–81, Barcelona, Spain. Association for Computational Linguistics.
- Och and Ney (2000) Franz Josef Och and Hermann Ney. 2000. Improved statistical alignment models. In Proceedings of the 38th annual meeting of the association for computational linguistics, pages 440–447.
- Papineni et al. (2002) Kishore Papineni, Salim Roukos, Todd Ward, and Wei-Jing Zhu. 2002. Bleu: a method for automatic evaluation of machine translation. In Proceedings of the 40th Annual Meeting of the Association for Computational Linguistics, pages 311–318, Philadelphia, Pennsylvania, USA. Association for Computational Linguistics.
- Raffel et al. (2019) Colin Raffel, Noam Shazeer, Adam Roberts, Katherine Lee, Sharan Narang, Michael Matena, Yanqi Zhou, Wei Li, and Peter J. Liu. 2019. Exploring the limits of transfer learning with a unified text-to-text transformer. CoRR, abs/1910.10683.
- Reimers and Gurevych (2019) Nils Reimers and Iryna Gurevych. 2019. Sentence-bert: Sentence embeddings using siamese bert-networks. CoRR, abs/1908.10084.
- Rozen et al. (2021) Ohad Rozen, David Carmel, Avihai Mejer, Vitaly Mirkis, and Yftah Ziser. 2021. Answering product-questions by utilizing questions from other contextually similar products. arXiv preprint arXiv:2105.08956.
- Sellam et al. (2020) Thibault Sellam, Dipanjan Das, and Ankur Parikh. 2020. BLEURT: Learning robust metrics for text generation. In Proceedings of the 58th Annual Meeting of the Association for Computational Linguistics, pages 7881–7892, Online. Association for Computational Linguistics.
- Vedantam et al. (2014) Ramakrishna Vedantam, C. Lawrence Zitnick, and Devi Parikh. 2014. Cider: Consensus-based image description evaluation. CoRR, abs/1411.5726.
- Wei and Zou (2019) Jason W. Wei and Kai Zou. 2019. EDA: easy data augmentation techniques for boosting performance on text classification tasks. CoRR, abs/1901.11196.
- Yang et al. (2022) Li Yang, Qifan Wang, Zac Yu, Anand Kulkarni, Sumit Sanghai, Bin Shu, Jon Elsas, and Bhargav Kanagal. 2022. Mave: A product dataset for multi-source attribute value extraction. In Proceedings of the Fifteenth ACM International Conference on Web Search and Data Mining, pages 1256–1265.
- Zhang et al. (2019) Tianyi Zhang, Varsha Kishore, Felix Wu, Kilian Q. Weinberger, and Yoav Artzi. 2019. Bertscore: Evaluating text generation with BERT. CoRR, abs/1904.09675.
- Zhang et al. (2020) Tianyi Zhang, Varsha Kishore, Felix Wu, Kilian Q. Weinberger, and Yoav Artzi. 2020. Bertscore: Evaluating text generation with BERT. In 8th International Conference on Learning Representations, ICLR 2020, Addis Ababa, Ethiopia, April 26-30, 2020. OpenReview.net.
- Zhao et al. (2019) Wei Zhao, Maxime Peyrard, Fei Liu, Yang Gao, Christian M. Meyer, and Steffen Eger. 2019. Moverscore: Text generation evaluating with contextualized embeddings and earth mover distance. CoRR, abs/1909.02622.