Comprehensive peak-width analysis in matter-wave diffraction under grazing incidence conditions
Abstract
Thermal energy atom scattering at a surface with grazing incidence conditions is an innovative method for investigating dispersive atom-surface interactions with potential application in quantum sensing interferometry. The complete establishment of this technique would require a detailed peak analysis, which has yet to be achieved. We examined peak-width fluctuations in atomic and molecular beams diffracted by a grating under grazing incidence conditions. Careful measurements and analyses of the diffraction patterns of He atoms and D2 molecules from three square-wave gratings with different periods and radii of curvature enabled the identification of factors influencing the variations in the width as a function of the grazing incidence angle. The effects of macroscopic surface curvature, grating magnification, and beam emergence are substantial under these conditions but negligible for incidence angles close to the normal. Our results shed light on the phenomena occurring in grazing incidence thermal energy atom scattering.
X-ray, electron, neutron, and atom diffraction techniques are well-established methods for studying the crystal structures of materials and their changes over time. In diffraction experiments, the width of the diffraction peak, along with its intensity and position, is a critical parameter for sample analysis. For example, peak-width analysis has been employed to estimate crystallite or grain sizes and crystal strains in X-ray powder diffraction [1, 2, 3, 4] and in grazing incidence X-ray scattering [5, 6]. In thermal-energy atom scattering (TEAS), the broadening of peak widths provides insights into temperature-induced alterations in surface morphology [7] and the density of defects such as steps on a crystal surface [8, 9].
The design of optical elements such as mirrors and gratings for X-ray and matter-wave optics also necessitates a comprehensive investigation of the widths of scattering peaks. X-rays have been focused efficiently using cylindrical concave mirrors by minimizing peak broadening effects [10, 11, 12]. Recently, this endeavor has also been extended to He atoms [13]. Furthermore, understanding wavelength-dependent peak width broadening is essential for atom monochromators [14]. Thus, analyzing peak widths is crucial for developing new methodologies and technologies based on wave diffraction.
Grazing incidence thermal energy atom scattering (GITEAS) at a surface offers a unique approach that can complement conventional TEAS, akin to the relationship between X-ray scattering and grazing incidence X-ray scattering. The lower effective energy and longer wavelength toward the surface for GITEAS make it more sensitive to weak interactions and less responsive to surface roughness. As a result, GITEAS has become valuable for studying the dispersive interaction of atoms with a surface [15, 16, 17]. Furthermore, microstructure-grating interferometry with GITEAS can be applied for quantum sensing in conjunction with monolithic atom interferometry using TEAS [18].
The versatile applications of GITEAS necessitate a precise peak-width analysis. However, under grazing incidence conditions, the peak widths are strongly influenced by an infinitesimal curvature (curvature radius of a few kilometers) and the diffraction direction near a surface, which results in unusual variations in peak widths. The presence of abnormally wide or narrow peaks further complicates the analysis. Furthermore, the traditional peak-width analysis scheme used in TEAS is insufficient for GITEAS, which highlights the need for a more sophisticated approach.
In this letter, we report a comprehensive analysis of peak widths for GITEAS. By adjusting the grating and incident beam properties, we investigate various factors contributing to peak-width variations, such as the macroscopic surface curvature, grating magnification, incident beam divergence, and angular dispersion. He atoms (D2 molecules) with mean de Broglie wavelengths of 330 or 140 pm (140 pm) are diffracted at grazing incidence angles up to 30 mrad by three gratings of different periods and macroscopic curvatures. By comparing the measured peak widths with calculated widths, we identify the dominant factors influencing the variations in peak width. This resolves any potential ambiguities in the data analysis caused by extraordinary peak widths.
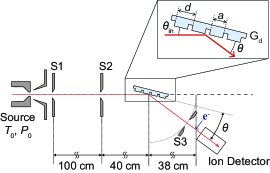
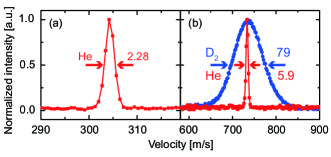
Our atom optics apparatus characterized by a tightly collimated incident beam and high-angular-resolution detector enables precise measurements of peak widths. Further details of the setup can be found in previous references [16, 19] and the Supplemental Material [20]. Here, we focus on the aspects of the apparatus pertinent to the data analysis presented in this study. A continuous beam of He or D2 is formed by supersonic expansion of the corresponding pure gas from a source cell. The source temperature () and pressure () influence the particle velocity distributions. We use three sets of source conditions, viz., gas species, , and : (He, 9.0 K, 0.5 bar), (He, 52 K, 26 bar), and (D2, 52 K, 2 bar). For each set of conditions, we observe a velocity distribution, from which the mean velocity (), full width at half maximum (FWHM) (), and corresponding mean de Broglie wavelength (see Fig. SM2 [20]) are determined. Accordingly, we obtain three corresponding sets of incident beam properties, including , , and : (304 m/s, 2.3 m/s, 330 pm), (733 m/s, 5.9 m/s, 140 pm), and (736 m/s, 79 m/s, 140 pm), respectively, which are used to explore the effects of and separately.
The beam is collimated using two slits (S1 and S2) positioned 100 cm apart as shown in Fig. SM1 [20]. The widths of these slits, and , are 20 m, except for one set of data where m and m. The incident and scattered beams are detected by precisely rotating a mass spectrometer with electron-bombardment ionization. The rotational axis of the detector is located 40 cm downstream from S2. A third slit (S3) with a width of m is positioned just before the detector. The distance between the rotational axis and S3, referred to as the grating–detector distance, is cm.
We employ three square-wave gratings with varying periods and strip widths : G1 with m and m; G20 with m and m; and G400 with m and m. Albeit nominally plane, the grating surfaces exhibit small circular curvatures. Under grazing incidence conditions the curvature along the direction perpendicular to the incident plane affects the peak width only negligibly [21, 22]. Therefore, we consider the gratings as cylindrical with their curvature radii . For concave and convex gratings, and , respectively. The estimated values of G1, G20, and G400 are 30, , and 1800 m, respectively.
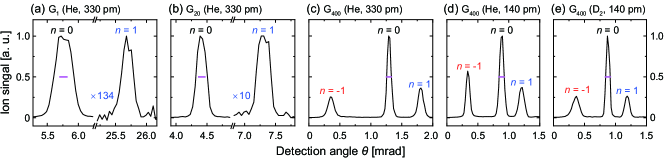
Figure 1 shows angular spectra for the three gratings measured at different experimental conditions for various incidence angles. The graphs represent the He+ or D signal as a function of the detection angle . Here, and are measured with respect to the grating surface. Numbers indicate the diffraction order assigned to each peak. The peak positions and FWHM values of the th-order diffraction beams are determined by fitting each peak to a single Gaussian function. Similarly, we determine the FWHM of the incident beam spectrum when the grating is removed from the beam path.
A peak-width analysis reveales unexpected irregular hierarchies of for the 5 cases of Fig 1: (a) , (b) , (c) , (d) , and (e) . Generally, in TEAS, diffraction peak widths increase with owing to the angular dispersion [23, 24], and an increase of the specular width with respect to can be attributed to surface defects [25]. Therefore, the unexpected hierarchies could lead to misinterpretation of underlying physics and errors in peak assignment.
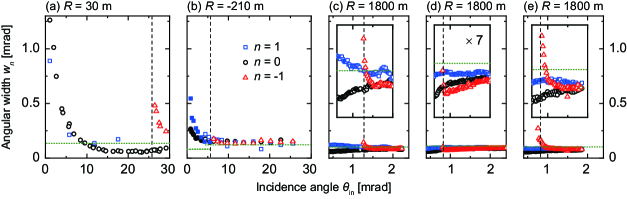
To study the peak-width variations systematically, we plot as a function of for the five experimental conditions in Fig. 2. Each graph includes horizontal dotted lines indicating and vertical dashed lines representing the Rayleigh incidence angle of st-order diffraction beam emergence (). When , the st-order diffraction beam emerges from the grating and propagates parallel to its surface; in this case, [26, 27].
The relationship between and varies under different experimental conditions and for individual diffraction orders. Furthermore, the inconsistent hierarchies among , , and change with . Several factors contribute to these variations: (i) the macroscopic curvature of the grating surface, (ii) grating magnification, (iii) diffraction beam spread resulting from the divergence of the incident beam, and (iv) angular dispersion due to the non-monochromatic nature of the beam. Among these factors, (i) pertains to a property of the grating, (ii) results from the diffraction principle, and (iii) and (iv) are determined by the incident beam properties.
The macroscopic curvature of the grating surface accounts for the variation in shown in Fig. 2. The magnitude of directly influences the steepness of the decrease in . Additionally, when (), increases (decreases) asymptotically toward with as illustrated in Fig. 2(a) [Fig. 2(b)]. Furthermore, the steep increase in with decreasing in Fig. 2(a) and 2(e) is attributed to angular dispersion. Finally, the hierarchical order of shown in the inset of Fig. 2(d) results from the grating magnification.
Factors (i)–(iv) contribute to differently depending on , , and , which can be formulated by the following approximate equation for a linear width : , where
| (1) |
| (2) |
| (3) |
| (4) |
and
| (5) |
In these equations, represents the object distance, denotes the focal length of the th-order diffraction beam, and denotes the width of the incident beam at the center of the grating. Because S1 constrains the effective source size of the matter-wave beam, we approximate the object as a Gaussian distribution with a standard deviation of WS1/4. Similarly, the boxcar-shaped function defined by S3 is approximated as a Gaussian function with a standard deviation of WS3/4.
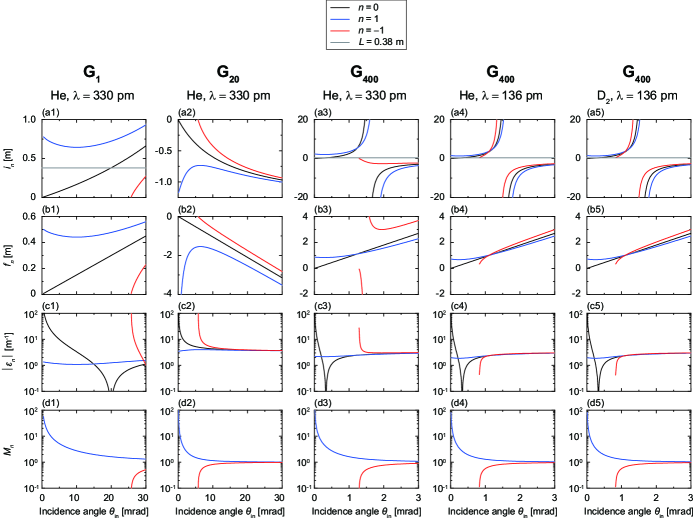
The macroscopic curvature of the grating represented by is relevant to its focal length. Under grazing incidence conditions, the object distance and image distance of the th-order beam satisfy the thin lens equation: . The term in the parentheses of Eq. (1) then represents the focusing error, , and the product is the width of the (de-)focused incident beam at the detection plane [28]. The focal length is a function of and . Specifically, can be expressed as [10, 13]; therefore, (or ) can be determined based on the values of and , as illustrated in Fig. SM4 [20].
The grating magnification given by , also known as anamorphic magnification, represents the ratio of the width of a collimated diffracted beam to that of a collimated incident beam [29]. When considering a collimated beam () incident on a flat grating (), characterizes the grating magnification.
describes the effect of the geometrical incidence beam divergence on the diffraction beam spread . When m, m for the specular peak, which is negligible. In contrast, becomes significant when as it happens when approaches the Rayleigh angle of beam emergence .
Slit diffraction at S2 contributes additional incident-beam divergence , which is responsible for . In the Fraunhofer limit, . Similar to , this contribution becomes pronounced only for an emerging peak close to the Rayleigh condition.
accounts for diffraction peak broadening resulting from angular dispersion due to the beam’s finite velocity spread . This effect is absent in the specular peak.
Finally, the finite size of the detector entrance slit, S3, also contributes to the observed diffraction peak widths by the term () of Eq. (5). This contribution is a constant 15 m for all experimental conditions.
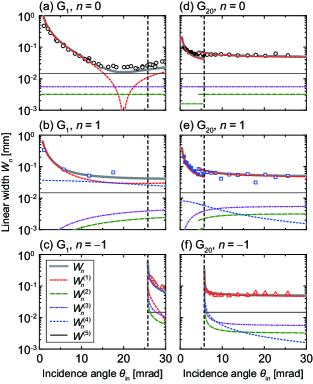
To assess the relative contributions of these five terms to , we compare the measured (symbols) for G1 and G20 with the corresponding calculated values for , , , , , and (lines) in Fig. 3. The theoretical curves are determined considering the grating’s macroscopic curvature radius as the sole adjustable parameter. The angular width presented in Figs. 2(a) and 2(b) is converted to the linear width and presented in the first- and second-column graphs in Fig. 3, respectively. The values for corresponding to G1 (G20) are calculated with m ( m). The estimation of employs the linear width of the incident beam, namely, m ( m).
For G20 a second data set was obtained with tighter beam collimation ( m, m) at small incidence angles mrad (filled symbols in Fig. 2(b)) resulting in an angular width as small as = 0.081 mrad ( m and m). Figures 3(d)–3(f) illustrate the corresponding calculations.
The breakdown of into its five constituent terms in Fig. 3 highlights the dominant factors in each case. The substantial reductions in for G1 at varying incidence angles result from different factors for , 1, and . As illustrated in the left-column graphs, at mrad, mrad, and mrad, , (red dashed curves), and (blue-dotted curve) predominantly influence their respective values. Notably, the grating magnification is unity for the specular beam, which makes the key determinant for . Conversely, varies by less than 33 in the given range of incidence angles while the grating magnification term decreases tenfold [see Figs. SM4(c1) and SM4(d1)] [20]. Therefore, the principal contributors to the steep decline in for , 1, and are the macroscopic curvature, grating magnification, and angular dispersion, respectively.
Similar to G1, the decreases in and for G20 are primarily determined by the macroscopic curvature and grating magnification, respectively [see Figs. 3(d), 3(e), SM4(c2), and SM4(d2)]. However, unlike G1, the 20-fold larger of G20 diminishes the effect of angular dispersion [see Eq. (4)]; as a result, the influence of curvature on the reduction of becomes dominant.
Even though G400 is nearly flat with m, given the extreme grazing-incidence conditions the curvature still affects the peak width variations. As can be seen in Figs. 2(c)–2(e) all three peak widths , , and can be narrower than the incidence beam width resulting from beam focusing due to the concave curvature of the grating (refer to the first and second rows in Fig. SM5) [20].
In addition, the width hierarchy visible in Fig. 2(d) () presents a clear example for peak widths being dominated by grating magnification; the closer a beam propagates to the surface, the smaller its width. This trend is less clear in Fig. 2(c) and (e) where is not consistently the smallest width at the given incidence angles. Specifically, for incidence angles slightly larger than the -order Raleigh angle , exceeds both and .
As shown in Figs. SM5(c), SM5(f), and SM5(i), the larger contributions of the terms , , and compared with lead to broadening of . The small close to Rayleigh conditions boosts these three terms. Interestingly, as shown in Fig. SM5, and were the dominant factors for the He atom beams with two different , whereas was the crucial factor for the D2 molecular beam. This behavior can be attributed to the 13-times larger velocity spread of the D2 beam compared with that of the He beam at identical velocity .
In conclusion, our combined experimental and theoretical investigations of diffraction peak widths in GITEAS reveal the primary factors that induce variations in peak widths. Notably, the primary factor governing the width of diffraction beams varies depending on diffraction order, incidence angle, and grating period. Our study reveals the effects of macroscopic curvature, emerging beams, and grating magnification, which have been overlooked in other scattering techniques, such as TEAS. Thus, our findings address potential ambiguities in interpreting diffraction data as those presented in Fig. 1.
The comprehensive peak-width analysis conducted in this study lays the groundwork for extending the applicability of GITEAS to investigate the unique characteristics of dispersive interactions between atoms and thin-layer surfaces such as graphene sheets or few layers hexagonal boron nitride, known for their flexibility. While recent theoretical investigations [30] have delved into these interactions, limited experimental studies are available. Additionally, this analysis can guide the design of atom optical components. Although both at mrad and near in Fig. 2(a) are sufficiently broad for monochromator applications, only the st-order diffraction beam is suitable for this purpose. This is because wavelength-dependent angular dispersion and wavelength-independent grating magnification primarily influence and , respectively. Furthermore, peak-width analysis will become critical in atom interferometry using GITEAS.
This study was supported by NRF (National Research Foundation of Korea) grants funded by the Korean Government (NRF-2020R1A2C3003701 and NRF-2022M3C1C8094518).
L. Y. K. and D. W. K. contributed equally to this work.
References
- Scherrer [1918] P. Scherrer, Göttinger Nachrichten Math. Phys. 2, 98 (1918).
- Langford and Wilson [1978] J. I. Langford and A. J. C. Wilson, J. Appl. Cryst. 11, 102 (1978).
- Balzar et al. [2004] D. Balzar, N. Audebrand, M. R. Daymond, A. Fitch, A. Hewat, J. I. Langford, A. Le Bail, D. Louër, O. Masson, C. N. McCowan, et al., J. Appl. Cryst. 37, 911 (2004).
- Holzwarth and Gibson [2011] U. Holzwarth and N. Gibson, Nat. Nanotechnol. 6, 534 (2011).
- Smilgies [2009] D. M. Smilgies, J. Appl. Cryst. 42, 1030 (2009).
- Mahmood and Wang [2020] A. Mahmood and J.-L. Wang, Sol. RRL 4, 2000337 (2020).
- Farías and Rieder [1998] D. Farías and K. H. Rieder, Rep. Prog. Phys. 61, 1575 (1998).
- Poelsema et al. [1982] B. Poelsema, R. L. Palmer, G. Mechtersheimer, and G. Comsa, Surf. Sci. 117, 60 (1982).
- Poelsema and Comsa [1989] B. Poelsema and G. Comsa, eds., Scattering of thermal energy atoms from disordered surfaces, vol. 115 of Springer tracts in modern physics (Springer, Berlin, 1989).
- Kirkpatrick and Baez [1948] P. Kirkpatrick and A. V. Baez, J. Opt. Soc. Am. 38, 766 (1948).
- Mimura et al. [2010] H. Mimura, S. Handa, T. Kimura, H. Yumoto, D. Yamakawa, H. Yokoyama, S. Matsuyama, K. Inagaki, K. Yamamura, Y. Sano, et al., Nat. Phys. 6, 122 (2010).
- Yumoto et al. [2013] H. Yumoto, H. Mimura, T. Koyama, S. Matsuyama, K. Tono, T. Togashi, Y. Inubushi, T. Sato, T. Tanaka, T. Kimura, et al., Nat. Photon. 7, 43 (2013).
- Schewe et al. [2009] H. C. Schewe, B. S. Zhao, G. Meijer, and W. Schöllkopf, New J. Phys. 11, 113030 (2009).
- Schief et al. [1996] H. Schief, V. Marsico, K. Kuhnke, and K. Kern, Surf. Sci. 364, L631 (1996).
- Druzhinina and DeKieviet [2003] V. Druzhinina and M. DeKieviet, Phys. Rev. Lett. 91, 193202 (2003).
- Zhao et al. [2008] B. S. Zhao, S. A. Schulz, S. A. Meek, G. Meijer, and W. Schöllkopf, Phys. Rev. A 78, 010902 (2008).
- Zhao et al. [2010a] B. S. Zhao, H. C. Schewe, G. Meijer, and W. Schöllkopf, Phys. Rev. Lett. 105, 133203 (2010a).
- Fiedler et al. [2023] J. Fiedler, K. Lefmann, W. von Klitzing, and B. Holst, Phys. Rev. A 108, 023306 (2023).
- Lee et al. [2019] J. H. Lee, L. Y. Kim, Y.-T. Kim, C. Y. Lee, W. Schöllkopf, and B. S. Zhao, Phys. Rev. Lett. 122, 040401 (2019).
- [20] See Supplemental Material for more details.
- Erko et al. [2011] A. Erko, M. Idir, T. Krist, and A. G. Michette, eds. (Springer, Berlin, 2011).
- Als-Nielsen and McMorrow [2011] J. Als-Nielsen and D. McMorrow, eds. (John Wiley & Sons, Ltd, West Sussex, 2011).
- Estermann and Stern [1930] I. Estermann and O. Stern, Z. Phys 61, 95 (1930).
- Grisenti et al. [2000] R. E. Grisenti, W. Schöllkopf, J. P. Toennies, J. R. Manson, T. A. Savas, and H. I. Smith, Phys. Rev. A 61, 033608 (2000).
- Poelsema et al. [1981] B. Poelsema, G. Mechtersheimer, and G. Comsa, Surf. Sci. 111, 519 (1981).
- Zhao et al. [2010b] B. S. Zhao, G. Meijer, and W. Schöllkopf, Phys. Rev. Lett. 104, 240404 (2010b).
- Zhao et al. [2011] B. S. Zhao, G. Meijer, and W. Schöllkopf, New J. Phys. 13, 065017 (2011).
- Saleh and Teich [2019] B. E. Saleh and M. C. Teich, Fundamentals of photonics (John Wiley & Sons, Ltd, New York, 2019).
- Palmer [2020] C. Palmer, Diffraction grating handbook (MKS Instruments, Inc., New York, 2020), 8th ed.
- Woods et al. [2016] L. M. Woods, D. A. R. Dalvit, A. Tkatchenko, P. Rodriguez-Lopez, A. W. Rodriguez, and R. Podgornik, Rev. Mod. Phys. 88, 045003 (2016).
- Schöllkopf et al. [2004] W. Schöllkopf, R. E. Grisenti, and J. P. Toennies, Eur. Phys. J. D 28, 125 (2004).
Supplemental Material
Atomic and molecular beam apparatus
A continuous beam was generated by supersonically expanding either He atoms or D2 molecules through a 5-m-diameter nozzle. The temperature and pressure of the source were set to 9.0 K and 0.5 bar, respectively, for He atoms of pm and set to K and bar, respectively, for He atoms of pm. To compare the diffractions of the He atomic and D2 molecular beams of the same values, we set the conditions for D2 molecules to bar and K. The values were determined from the velocity distributions of the particles.
The beam first passed through a skimmer with a diameter of 500 m and was subsequently collimated by two slits (S1 and S2) placed 100 cm apart. The widths of these slits, and , were the same ( m) for most measurements while for one set of data shown in this paper it was m and m. The incident and scattered beams were detected by precisely rotating a mass spectrometer with electron-bombardment ionization. The rotational axis of the detector was located 40 cm downstream from S2. Just before the ion detector, a third slit (S3) with a width of m was positioned to enhance the angular resolution. The distance between the rotational axis and S3, referred to as the grating–detector distance (or detector radius), was cm. This distance, combined with the narrow aperture of S3, yielded a full width at half maximum (FWHM) of approximately 0.12 mrad for the collimated incident beam. The grating was carefully positioned and oriented such that the pivot axis of the detector aligned with the center of the grating plane and was maximally parallel to the grating grooves. Therefore, the grating grooves were perpendicular to the plane of incidence defined by the incident wave vector and grating normal, resulting in in-plane diffraction. This geometry is illustrated in Fig. 1 in the main text, where both the incidence angle and detection angle are measured in relation to the grating plane.
Velocity distributions of atomic and molecular beams
We obtained the velocity distributions of the He atomic and D2 molecular beams using time-of-flight measurements conducted with a mechanical pseudo-random beam chopper [31]. Figures SM2(a) and SM2(b) present the results obtained at temperatures of K and 52 K, respectively. We employed Gaussian function fitting to determine both the mean velocity and FWHM . The ratios of for the He atom beams are 0.0075 and 0.0081 at the two different values, which are similar. In contrast, the ratio for the D2 molecular beam is 0.11.
Fabrication and characterization of the diffraction gratings
| period | curvature radius | |||
|---|---|---|---|---|
| G1 | 1 m | 30 m | ||
| G20 | 20 m | m | ||
| G400 | 400 m | 1800 m |
We employed three square-wave gratings with varying periods and strip widths : G1 with m and m, G20 with m and m, and G400 with m and m. G1 and G20 are microstructured arrays, each measuring 56 mm in length, consisting of 110-nm-thick chromium stripes that are 5 mm in length and are deposited on a 2-mm-thick quartz surface. In contrast, G400 is an array featuring parallel photoresist strips with a thickness of 1 m, width of 200 m, and length of 4 mm. These strips are located on a commercial gold mirror (Thorlabs PFSQ20-03-M03), which is 6 mm thick and has a surface area of mm2. Only the stripes were exposed to the incident atomic beam for all the angles of incidence examined in this study. Table SM1 provides a summary of the properties of these gratings that are pertinent to variations in peak width, including their period and radius of curvature .
Example angular spectrum
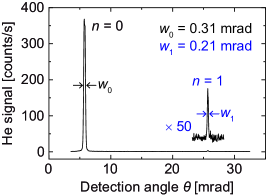
Figure SM3 shows the full angular spectrum of the He atom beam diffracted from G1 at mrad [Fig. 1(a)]. The specular peak position equals mrad. The widths of specular and 1st-order-diffraction peaks ( and ) are 0.31 mrad and 0.21 mrad, respectively.
Experimental conditions
Table SM2 lists the five experimental conditions E1–E5 at which the five data sets presented in this study were obtained.
| Particle | Grating | |||||||||||
|---|---|---|---|---|---|---|---|---|---|---|---|---|
| E1 | He | G1 | 330 pm | 9.0 K | 0.5 bar | |||||||
| E2 | He | G20 | 330 pm | 9.0 K | 0.5 bar | |||||||
| E3 | He | G400 | 330 pm | 9.0 K | 0.5 bar | |||||||
| E4 | He | G400 | 140 pm | 52 K | 26 bar | |||||||
| E5 | D2 | G400 | 140 pm | 52 K | 2.0 bar |
Calculation of parameters required for peak-width analysis
For a cylindrically concave mirror with a curvature radius , the object distance and image distance of the th-order beam satisfy the following equation under grazing incidence conditions:
| (SM1) |
Here, and represent the outermost values of the incidence angles that result in and , respectively. The incidence beam spreads over a distance of on the surface. This chord subtends an angle of at the center of curvature, making approximately equal to . Consequently, varies as a function of , as depicted in the first row of Fig. SM4 for the five experimental conditions. For our calculations, we assume m. When , a diffraction beam is focused on the detection plane. Eq. SM1 transforms into the thin-lens equation, , for a specular beam of with under grazing incidence conditions. Generally, , with which we obtain using [See Figs. SM4(b1–b5)]. Then, . The third row of Fig. SM4 shows for the five experimental conditions. To elucidate the contributions of the focusing error and the grating magnification to , we plot in the last row of Fig. SM4.
Peak-width analysis for G400
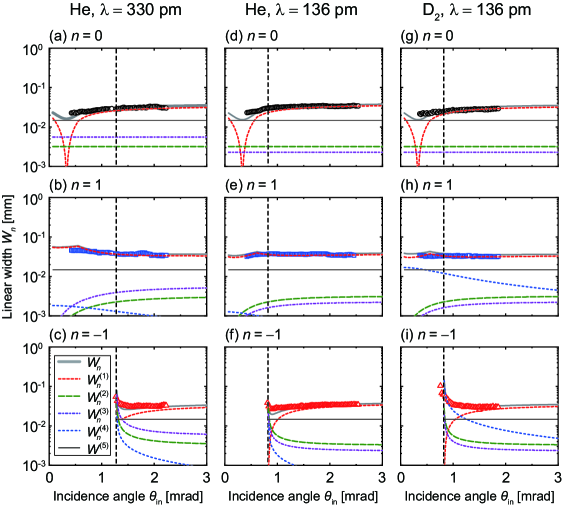
Similar to Fig. 3 in the main text, Fig. SM5 compares the measured (symbols) for G400 with the corresponding calculated values: , , , , , and (solid lines). The theoretical curves are derived using m. In most cases, the primary factor is (red dashed line). Exceptions occur for at the Rayleigh conditions of . At these conditions, approaches 0, leading to large values for , , and .