[a]INPAC and School of Physics and Astronomy, Shanghai Jiao Tong University, MOE Key Lab for Particle Physics, Astrophysics and Cosmology, Shanghai Key Laboratory for Particle Physics and Cosmology,
Shanghai 200240, China
\affiliation[b]Shanghai Jiao Tong University Sichuan Research Institute,
Chengdu 610213, China
\affiliation[ ](PandaX-4T Collaboration)
\emailAddchenxun@sjtu.edu.cn
Data reduction strategy in the PandaX-4T experiment
Abstract
The PandaX-4T experiment is designed for multiple purposes, including searches for solar neutrinos, weakly interacting massive particles, and rare double beta decays of xenon isotopes. The experiment produces a huge amount of raw data that needs to be stored for related physical analyses in a wide energy range. With the upgrading of the PandaX-4T experiment, the doubled sampling rate resulted in a larger data size, which challenges both the cost and the data processing speed. To address this issue, we propose a data reduction strategy by removing the noise tail of large signals and downsampling the remaining parts of them. This strategy reduces the requirement for storage by 65% while increasing data processing speed. The influences on physical analyses on different topics at different energy regions are negligible.
1 Introduction
The PandaX-4T experiment [1], located in the China Jinping Underground Laboratory (CJPL) [2], is a multi-purpose program for the study of particle physics and astrophysics. Its physics goals include the search of weakly interacting massive particles (WIMPs) [3], solar neutrinos [4], and the rare double beta decay of xenon isotopes [5]. The experiment utilizes the technology of dual-phase xenon time projection chamber (TPC) [6] to catch the signals generated by these events.
The PandaX-4T detector is introduced in detail in Ref. [3]. The main part of the TPC is nearly cylindrical and assembled with 24 highly reflective polytetrafluoroethylene (PTFE) panels. The TPC primarily contains liquid xenon, with a thin layer of gas phase at the top. The drift field in the liquid xenon is determined by the cathode grid on the bottom of the TPC and the gate mesh beneath the top surface of the liquid xenon. Together with the anode mesh in the gas xenon, the electron extraction field is created. Two arrays of 3-inch photo-multipliers (PMTs) are located at the top and bottom of the TPC to measure the photons produced inside the TPC. The PMTs amplify the photoelectrons, which are produced by incoming photons via the photoelectric effect on the photocathode, by a factor of about .
When particles scatter with xenon atoms in the sensitive volume, they could produce both atomic excitation and electron ionization. The de-excitation of xenon atoms and the recombination of some of the ionized electrons produce prompt scintillation or the so-called “” signal when detected by the PMT arrays. The remaining ionized electrons drift along the drift field to the top surface of liquid xenon and are extracted into the gas region to produce the proportional electroluminescence or “” signal if detected. Given the nearly constant drifting velocity of electrons inside the liquid xenon, the time difference between the and signals can be used to determine the depth of the scattering event inside the sensitive volume [6].
In the Pandax-4T experiment, the and signals are reconstructed from the collected data. For each PMT, the output signal is digitized at a sampling rate of 250 MHz. When the digitized signal exceeds a predefined threshold, a continuous segment of the samples, including those over a pre-defined threshold and a fixed number of samples before and after them, is recorded [7]. The raw data is the collection of recorded segments, together with the time and channel information.
For efficient input/output (I/O) and data compression, the raw data in the PandaX-4T experiment are stored using the Bamboo Shoot 3 [8] library, which supports custom formatting and compression of ordinary data structures. As a result, the size of a data file in the PandaX-4T experiment is approximately half that of the actual data size contained within it. The fundamental unit of the custom data structure is called RawSegment, which accurately represents the raw samples, channel number and start time. Many RawSegments collected within a short period of time are grouped together, creating a higher-level structure known as GroupData, as depicted in Figure 1. Each GroupData is characterized by a start time and an end time, which define the group boundary. The start time is defined as the start time of the first RawSegment, while the end time corresponds to the end time of the last finished RawSegment. To ensure separation between adjacent GroupDatas, a minimum gap of 1s is required. A single data file may contain thousands of GroupData objects.
For each data file, the data processing is performed by looping over the GroupData structure. A baseline is determined for each segment and then subtracted. The resulted waveforms are calibrated using light-emitting diodes (LEDs). Peaks in the waveform are identified as hits, and adjacent hits are clustered together to form signals. The signals are tagged as either , or other types based on their properties, such as height, width, and top-bottom asymmetry of charge partition. The identified signals are grouped as SignalData, with the same boundary as its parent GroupData, as shown in Fig. 1.
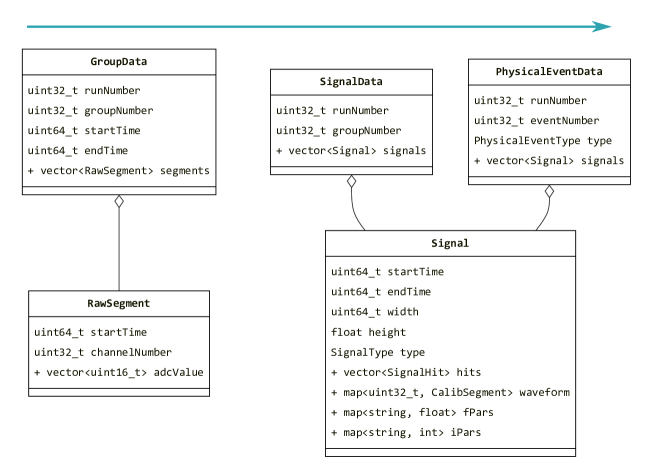
In order to reconstruct physical events, it is necessary to eliminate the boundary between adjacent SignalData blocks, as a single physical event may contain signals that are separated across them. To address this, two methods have been developed [9]. The first method involves iterating through the signals in time order. During this process, the maximum signal is recorded prior to encountering any signals, and the iteration concludes when the maximum drift time to the maximum is reached. Once found, this signal, along with the preceding and subsequent signals within a drift time window of 1 ms, is combined to form a physical event. This approach has been utilized in all of the currently published PandaX-4T results [3, 5, 4, 10, 11, 12]. The second method is developed to improve the reconstruction efficiency of physical events in low energy region during the ongoing combined analysis with both the commissioning run (Run0, 2020-2021) and the first science run (Run1, 2021-2022) data. This method begins by identifying an signal that does not have any signals surpassing one-third of its total charge within a 2 ms window prior to it.
Following this, a physical event is constructed by selecting all the signals within a 1 ms window before and after the identified signal. The signals belonging to a reconstructed physical event are stored within the data structure called PhysicalEventData, and an event number is assigned to uniquely identify this event in its containing data file.
The data contains the physical event is then converted to ROOT format for further analyses. The waveforms of the signals are not kept in the ROOT file due to the huge space consumption.
Throughout Run0 and Run1 of the PandaX-4T experiment, high-quality raw data, including both background data and calibration data spanning roughly 280 days, occupies approximately 750 TB. It can be extrapolated that a year of data collection would lead to roughly 1 PB of raw data accumulation. Additionally in the coming data taking, the implementation of a new electronics system upgrade will result in a higher sampling rate of 500 MHz [13]. The resulting doubling of data during future operations of PandaX-4T represents a significant burden on the limited storage capacity available. This challenge has motivated the PandaX-4T team to actively seek solutions to optimize the data storage and processing capabilities of the experiment.
This article is organized as follows: We discuss the data reduction strategy and its performance in Sec. 2. The effects of data reduction on the data analysis results at different energy scales are discussed in Sec. 3. The update of the data processing chain is presented in Sec. 4. At last, a brief summary is given in Sec. 5.
2 Data reduction strategy
2.1 Data information
The development of a data reduction strategy starts from the study of existing data. The total storage occupation of different types of raw data and corresponding run time are plotted in Fig 2. Then we calculated the average occupation rates of data collected in the Run0 and Run1, by dividing stored data size by data taking duration recorded in the database. The information is summarized in Table. 1. Higher rate of the 232Th calibration run in Run1 is resulted from different positions of the source, i.e., the middle loop in Run1 and the deuterium-deuterium (DD) tunnel in Run0 [14]. The high event rate in 83mKr run of Run1 is mainly caused by the Rn contamination introduced from the injection chamber and higher injection flow. The increasing of background rate in Run1 can be attributed to the elevated level of Rn background. Among all the calibration runs, Rn runs exhibit the highest average data occupation rate. This can be explained by the presence of a larger number of high energy events in Rn runs, resulting in more large signals with longer persistence times and an increased number of samples.

| Data type | calibration | background | ||||||
| 232Th | 60Co | 137Cs | Rn | 83mKr | DD | 241AmBe | ||
| Run0 | 47.3 | 59.2 | 65.1 | 36.5 | 16.1 | 36.0 | 28.9 | 11.2 |
| Run1 | 64.8 | 58.0 | 52.8 | 91.3 | 51.9 | 41.8 | 40.3 | 18.1 |
The LUX collaboration found that electron emission occurring within a time range of ms after pulses is a notable background in the low-energy region [15]. These afterglow can be mitigated using a fixed afterglow veto cut, by requiring the candidate events to be separated by at least 22 ms [3].
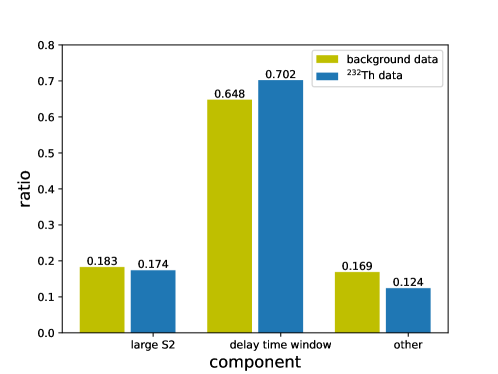
The signals discarded in the afterglow veto cut could be a major factor in the storage of collected data. To test this hypothesis, we selected 100 files from the dark matter search data and 100 files from the 232Th calibration data randomly in the Run0. We then counted the signals in the 10 ms window after a large pulse, which we refer to as the delay time window. As shown in Fig. 3, data in the delay time window contributes to about 2/3 of the storage space and large pulses themselves account for nearly 1/5.
2.2 The reduction procedures
The investigation of data occupation suggests that significant storage space reduction is possible by removing the unused portions after large pulses and reducing the sampling rate of these pulses. The procedure of removing these portions is referred to as “tail cut”, while the process of reducing the sampling rate is known as “downsampling” in the subsequent text.
To minimize the impact on the calculation of some quantities for event selection, such as the extra charge except main signals, an algorithm has been developed to determine the start and end time points for the tail cut procedure. The detailed description of this algorithm is provided below.
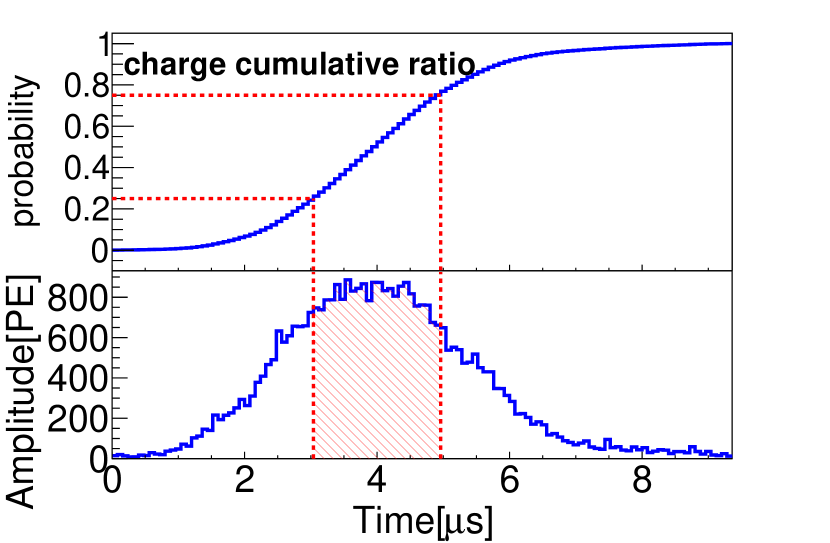
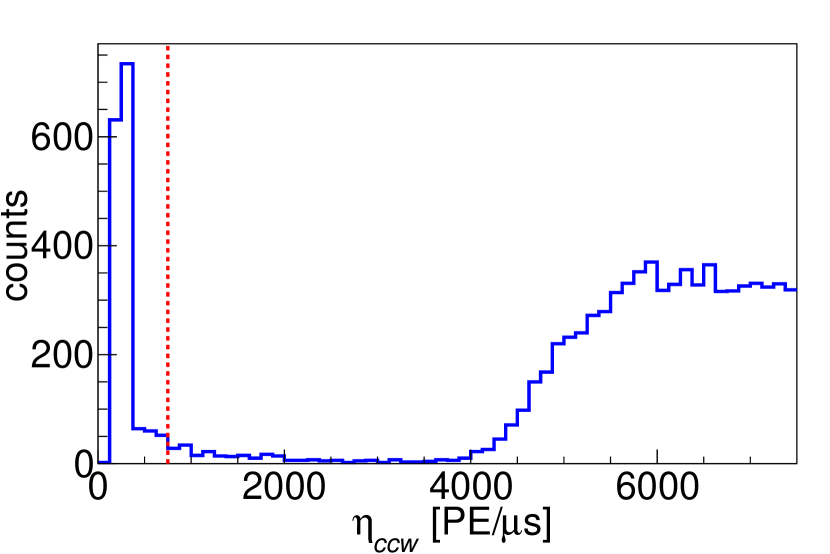
First, the original data are processed by the general data processing chain to construct signals. The time of the constructed pulses will be recorded. These s will then be investigated further to remove the mis-identified pulses using the distribution of the variable, which is the charge-to-width ratio of central 50% waveform. Fig. 4 shows the definition and distribution of this variable. The mis-tagged backgrounds have relatively low in comparison with good s.
Remaining pulses will be clustered together if the time difference between the start times of adjacent pulses is within 1 ms. Each cluster of pulses will be treated as a whole. Only clusters with at least one pulse greater than 20,000 PE will be considered in the following steps.
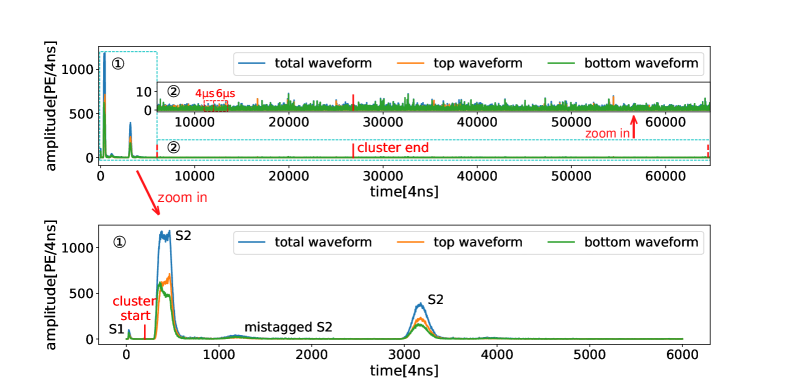
An example demonstrating the determination of the tail cut range is shown in Figure 5. For each cluster, a reverse sliding point is set on the waveform, starting from the end of the last pulse and moving backwards in steps of 2 s. At each step, the average charge per sample is calculated in the 4 s window before the sliding point () and the 6 s window after it (). The sliding stops when PE/s or . This indicates that a large signal is before the sliding point. The start point of the tail cut is set at 8 s after the final sliding point.
The end point of the tail cut is determined by iterating over the reconstructed signals after the cluster of pulses, rather than on the waveform. Because larger s lead to more delay signals in a longer time window, we adjust the iteration step size based on the cluster’s total charge to speed up the calculation, as shown in Table 2. At each step, the ratio of the total charge of the signals to the difference between the start time of the first signal and the end time of the last signal in this step is calculated. The iteration stops until the ratio is smaller than 0.5 PE/s or an pulse with a greater than the threshold of 2,500 PE/s is found in the step. The end time of the last signal in the previous iteration is set as the end point of the tail cut.
| step size | range of cluster total charge (PE) |
| 10 | |
| 20 | |
| 40 | |
| 60 |
Reducing of the sampling rate (downsampling) of the remaining pulses in the clusters could suppress the storage space occupation further. The updated sampling rate is 125 MHz. The downsampling is performed on the data structure of RawSegment. The raw adcValue is split into small groups of size , where is the ratio between the original and target sampling rates. For the data collected during Run0 and Run1, the original sampling rate was 250 MHz, resulting in a value of . However, with the anticipated upgrade of PandaX-4T, the upcoming data will be acquired at a sampling rate of 500 MHz, leading to an increased value of . The downsampled adcValue is calculated by averaging the values in each group. To reduce the round-off error caused by integer division, a value of is added to the summation of each group before averaging.
2.3 Reduction performance
To evaluate the performance of the data reduction strategy, 50 files were selected for each type of data. The results are shown in Table 3. Applying the tail cut strategy alone could reduce storage occupation by more than 50%. Using downsampling in addition to the tail cut strategy could save an additional 10% of disk space. Due to the higher fraction of high energy deposition, calibration data contains a significant amount of data in the tail part, resulting in increased storage requirements. Therefore, after the implementation of the reduction strategies, calibration data has been further reduced.
| Data type | Calibration | Background | ||||||
| 232Th | 60Co | 137Cs | Rn | 83mKr | DD | 241AmBe | ||
| raw | 1008.0 | 1004.7 | 1009.4 | 1003.8 | 1003.6 | 1007.3 | 1009.0 | 1011.2 |
| tail cut only | 419.8 | 414.5 | 483.1 | 421.9 | 377.7 | 409.7 | 420.3 | 460.2 |
| tail cut and downsampling | 308.4 | 297.2 | 338.5 | 323.9 | 297.1 | 305.5 | 309.9 | 364.0 |
3 Effect on data analysis
Data reduction permanently removes some data, which may affect total exposure and event reconstruction. We discuss the impact of data reduction on analysis in this section.
3.1 Exposure
The exposure is calculated by excluding regions determined by the afterglow veto cut from the actual data taking time. For example, the fixed veto cut reported in Ref. [3] has resulted in an exposure loss of 7.3% for Run0 data. Recently, a new adaptive veto cut is implemented, leading to a smaller exposure loss of about 5.25% when applied to data in Run0 and Run1 [9].
When the afterglow veto cut is combined with the data reduction, the excluding region will be determined as the result from the “union” operation of the regions given by both algorithms. Since the tail cut algorithm removes data that would mostly be covered by the veto cut, the loss of exposure introduced by the data reduction is small when combined with the adaptive veto cut. The resulting exposure loss is about 5.32%.
3.2 Large pulses
For large pulses over 20,000 PE, the total charge and width of the central 80% charge (wCDF) are expected to change after data reduction. wCDF is an important variable used to design data quality cuts. To study these effects, we inspected the large pulses in single scattering (SS) events with all data quality cuts applied in a 232Th calibration run. The results are presented in Fig. 6. The charge and wCDF deviations are both smaller than 1% for the vast majority of the studied pulses (97.6% and 95.3%, respectively).
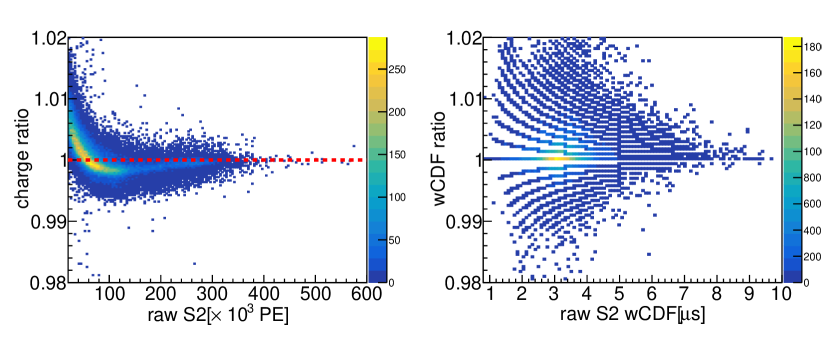
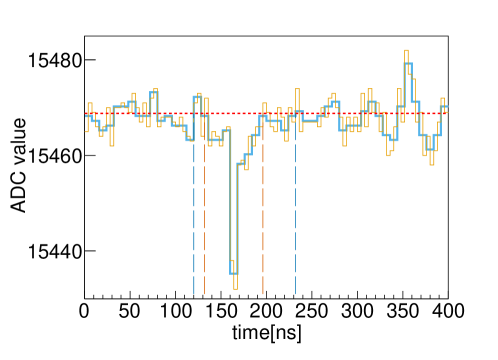
Notably, for raw charge below approximately 50,000 PE, the reduced charge typically increases, whereas for charges exceeding 50,000 PE, the reduced charge tends to decrease. This phenomenon can be explained by the combination of two opposing effects. The first effect is attributed to downsampling. As illustrated in Fig. 7, downsampling smooths waveform fluctuations, leading to “fatter” small hits that contribute more charge. On the other hand, the second effect arises from the tail cut, which involves discarding noisy tails of large pulses, resulting in a reduction in charge. The downsampling effect has a greater impact on smaller pulses as they have a higher proportion of small hits, leading to an increase in charge after reduction. Conversely, larger pulses tend to exhibit a decrease in charge due to these effects.
3.3 Events in the mid-to-high energy region
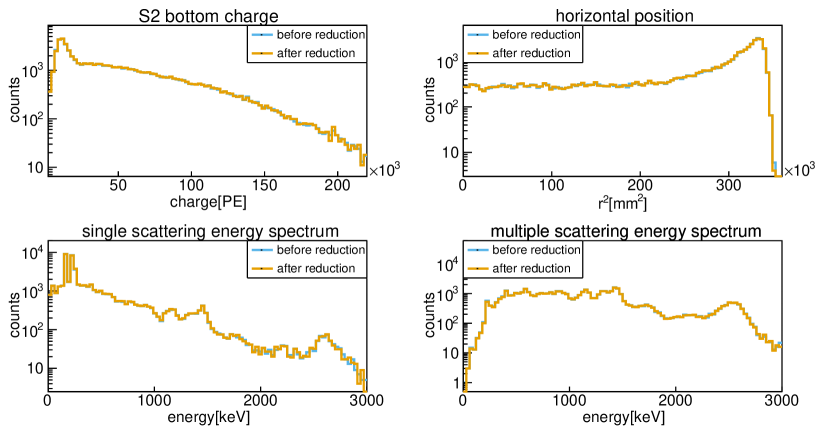
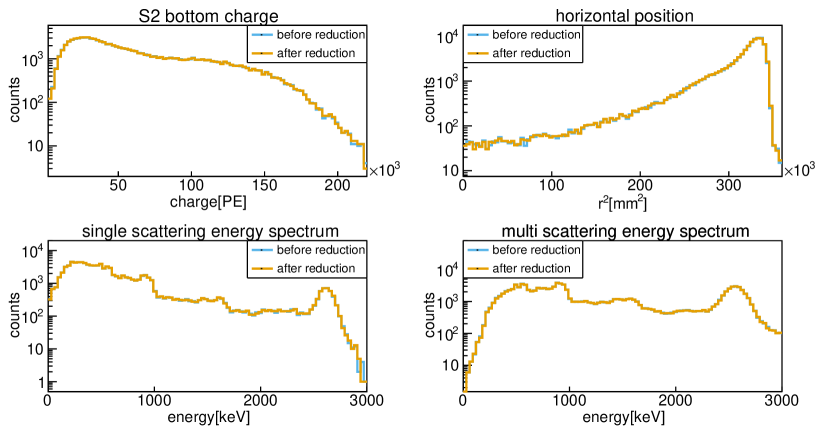
The mid-to-high energy region in PandaX-4T data analysis refers to the energy range between 20 keV and 3000 keV, where many interesting physical phenomena occur. In addition to the 232Th run mentioned previously, a background run was also used to test the effects of data reduction on data analysis in the mid-to-high energy region. Fig. 8 shows the distribution of bottom charge, horizontal position after desaturation [5], and energy spectra for SS events that passed the data quality cuts. The energy spectra of MS events are also shown. We conclude that data reduction has a negligible effect on the distributions. Table 4 shows the number of reconstructed SS and MS events before and after data reduction. The total number of events changes slightly after the data reduction, mainly because some adjacent events may be reconstructed as one after the tail cut. Some of these events are recoganized as MS, while others are filtered out by data quality cuts.
| Type/Counts | before reduction | after reduction | change |
| background, SS | 7583 | 7558 | |
| background, MS | 6820 | 6816 | |
| 232Th, SS | 101209 | 100771 | |
| 232Th, MS | 130479 | 130728 |
3.4 Events in the low energy region
The low energy region is below 20 keV, where WIMPs and solar 8B neutrinos are searched. We evaluated the effect of data reduction on a Rn calibration run in Run1 firstly. After data reduction, 2 of the 3,186 candidate events disappeared, and no new candidate events appeared. Inspection of these two events showed that the event reconstruction algorithm expanded their event window due to the tail cut before them, introducing additional noise. As a result, they were filtered out by the waveform cleanliness requirement.
To further evaluate the effect of data reduction, we selected only the files containing candidate events after data selection and checked other types of data. For the Rn data in Run0, only 1 of the 2,177 inspected candidate events was lost for the same reason as in the Run1 Rn data. No new candidate events appeared. For the neutron calibration data with 241AmBe and DD sources, the reduced data files produced identical event lists to the original data files. Using the same method, no candidates were lost among the 4,645 selected candidates selected with basic quality cuts in Run0 for 8B neutrinos search [4]. Additionally, there were no newly emerged candidates. The analysis results in the low energy region do not change after data reduction.
4 Updates of the data processing framework
Because data reduction has a negligible effect on data analysis in all energy regions, it will be used in the upcoming PandaX-4T data taking. This will require modifications to the previously used data processing framework.
4.1 Data structure
The first thing to be updated is the underlying data storage structure. The RawSegment structure assumes that all raw data is sampled at 250 MHz. However, the new electronics sample data at 500 MHz, and downsampling in the data reduction will transform some of the data to 125 MHz. To accommodate these changes, a new variable called sampleSize is added to the structure to indicate the size of samples in nanoseconds. The value of sampleSize is 4 for the original Run0 and Run1 data, 2 for the upcoming raw data, and 8 for the downsampled RawSegment.
4.2 Multi-stage data processing
Data reduction requires multiple processing stages. In the first stage, the default data processing algorithm is applied to the raw data to reconstruct signals. However, the adaptive afterglow veto cut requires the signal densities in the noise tails after large pulses, so these parameters must be calculated before data reduction. Therefore, the second stage calculates these parameters and stores them in the database, along with the meta information of runs and files. The list of large pulses with their time is also generated in this stage. In the third stage, reduced data is produced according to the information of large pulses extracted in the previous step. The reduced raw data is then processed again to generate data for further analysis. Table 5 shows the average time consumption of different data processing steps, calculated from 50 randomly selected background run data files.
| Process step/ time(seconds) | build signals | generate parameters | data reduction | build physical events | convert to ROOT file | event selection |
| before reduction | 67.63 | 31.40 | 21.76 | 49.80 | 187.19 | 14.72 |
| after reduction | 29.14 | - | - | 17.66 | 49.82 | 13.46 |
The previous data processing chain took an average of 319.34 seconds to convert a raw data file into data for physical analysis. The new multi-stage data processing chain reduced the average required time to 230.87 seconds. More importantly, during the data reprocessing campaign of reduced data, the average required time to process one file was only 110.8 seconds.
5 Summary
We propose a data reduction strategy to save storage space in the PandaX-4T experiment. The strategy was designed by analyzing the data components and is capable of saving more than 60% of storage space. It has a negligible effect on data analysis in different energy regions and can also greatly speed up data processing.
The strategy is to be used in the following data taking operation after the upgrade of the PandaX-4T experiment. We hope that it will provide a useful reference to other experiments with large amounts of data, and that it will help to reduce the cost and complexity of data storage and processing for these experiments.
Acknowledgments
We would like to express our gratitude for the meticulous internal review conducted by Prof. Qing Lin and Dr. Yi Tao. This project is supported in part by the grants from National Science Foundation of China(No. 12090060 and No. 12175139).
References
- [1] Hongguang Zhang et al. Dark matter direct search sensitivity of the PandaX-4T experiment. Sci. China Phys. Mech. Astron., 62(3):31011, 2019.
- [2] Jainmin Li, Xiangdong Ji, Wick Haxton, and Joseph S. Y. Wang. The second-phase development of the China JinPing underground Laboratory. Phys. Procedia, 61:576–585, 2015.
- [3] Yue Meng et al. Dark Matter Search Results from the PandaX-4T Commissioning Run. Phys. Rev. Lett., 127(26):261802, 2021.
- [4] Wenbo Ma et al. Search for Solar Neutrinos in the PandaX-4T Experiment Using Neutrino-Nucleus Coherent Scattering. Phys. Rev. Lett., 130(2):021802, 2023.
- [5] Lin Si et al. Determination of Double Beta Decay Half-Life of with the PandaX-4T Natural Xenon Detector. Research, 2022:9798721, 2022.
- [6] E. Aprile and T. Doke. Liquid xenon detectors for particle physics and astrophysics. Rev. Mod. Phys., 82:2053–2097, Jul 2010.
- [7] Jijun Yang et al. Readout electronics and data acquisition system of PandaX-4T experiment. JINST, 17(02):T02004, 2022.
- [8] Siao Lei and Xun Chen. Bamboo shoot 3, data serialization used in pandax. https://github.com/pandax-experiments/bamboo-shoot3.
- [9] Yunyang Luo et al. Signal response model in PandaX-4T. 2023. in preparation.
- [10] Xuyang Ning et al. Limits on the luminance of dark matter from xenon recoil data. Nature, 618, 05 2023.
- [11] Linhui Gu et al. First search for the absorption of fermionic dark matter with the pandax-4t experiment. Phys. Rev. Lett., 129:161803, Oct 2022.
- [12] Dan Zhang et al. Search for light fermionic dark matter absorption on electrons in pandax-4t. Phys. Rev. Lett., 129:161804, Oct 2022.
- [13] Changda He et al. A 500 MS/s waveform digitizer for PandaX dark matter experiments. JINST, 16(12):T12015, 2021.
- [14] Ning Zhou. Overview of the status and plan of the pandax experiment, 2019. Talk given in TeVPA 2019.
- [15] D. S. Akerib et al. Investigation of background electron emission in the LUX detector. Phys. Rev. D, 102(9):092004, 2020.