Abstract
Mrk 783 is a narrow-line Seyfert 1 galaxy that possesses a relatively large two-sided radio emission extending up to 14 kpc from the active nucleus possibly connected with a large-scale ionized gas emission. We obtained a deep [O iii] image that revealed an extended system of emission knots and diffuse ionized gas surrounding the main galaxy. The high-excited gas is related not only with the radio structure, but also with tidal features illuminated by the active nucleus radiation up to the projected distance 41 kpc as it follows from the emission lines intensities and kinematics derived from the long-slit spectroscopic data. Moreover the part of the disk of the companion galaxy SDSS J130257.20+162537.1 located at 99 kpc projected distances to the north of Mrk 783 also falls in the AGN ionizing cone. It is possible that Mrk 783 can be considered as ‘Hanny’s Voorwerp precursor’, i.e. a galaxy that demonstrates signs of sequential switching from radio-loud to radio-quiet nuclear activity, in the moment before falling of its ionization luminosity.
1 \issuenum1 \articlenumber0 \datereceived \dateaccepted \datepublished \hreflinkhttps://doi.org/ \TitleEnigmatic emission structure around Mrk 783: cross-ionization of a companion in 100 kpc away. \TitleCitationEnigmatic emission structure around Mrk 783 \AuthorAlexei V. Moiseev 1,2,†,‡*\orcidA and Aleksandrina A. Smirnova 1,‡\orcidB and Tigran A. Movsessian 3,‡ \AuthorNamesAlexei V. Moiseev et al. \AuthorCitationMoiseev et a. \corresCorrespondence: moisav@gmail.com; (A.V.)
1 Introduction
Active galactic nucleus (AGN) feedback is important in the coevolution between AGN and its host galaxy. This fundamental physical processes has an impact on the interstellar medium and the intergalactic environment, but it has been under debate for a long time and is still not fully understood. Mrk 783 is an interesting example of a galaxy in which we can trace AGN radiation feedback on large spatial scales outside the host galaxy.
Mrk 783 was discovered by Markarian and Lipovetskii (1976), its optical spectra was first define as Narrow Line Seyfert 1 galaxy (NLS1) by Osterbrock and Pogge (1985). According to the current point of view, NLS1 is AGN with a relatively low mass of the central black hole (106–108 M⊙) in an early stage of AGN evolution (Mathur, 2000). Mrk 783 black hole mass M M⊙ is in the higher end of NLS1s distribution, its Eddington ratio is quite low (0.11) and its [O iii] line is quite strong with respect to Hβ (Berton et al., 2015).
In the radio band Mrk 783 was extensively investigated by Congiu et al. (2017, 2020). They have found in the center of galaxy a compact core with a pc-scale jet as well as two-sided extended component (up to 14 kpc from the nucleus). The authors stressed, that the galaxy ‘is one of the few NLS1 showing such an extended emission at ’. The small-scale jet and the large-scale radio emission are not aligned. Based on these facts and on the very steep spectral indexes Congiu et al. (2017) concluded that the extended emission observed in Mrk 783 might be a relic and that the radio source might be in a quiescent period of its activity cycle.
No less interesting Mrk 783 is in the optical range. V-band image reveals low surface brightness extended structures on the both sides of the galaxy nucleus that looks like tidal tail observed in interacting galaxies. The isophotes of the internal part of the galaxy indicate the presence of a second point-like structure which might be the nucleus of the second galaxy involved in the proposed merging (Congiu et al., 2020). Optical emission of the ionized gas is far more extended with respect to the radio emission mostly on the south-east side of the nucleus. The [O iii], Hβ and Hα lines were tracked up to 35 kpc from the nucleus in the spectrum obtained at the 6.5m Magellan telescope, that makes this EELR (Extended Emission Line Region) one of the most extended discovered so far (Congiu et al., 2017).
In order to better understand the physics of processes occurring in Mrk 783, we have mapped this galaxy in the [O iii] emission line at the 2.5m telescope of the Caucasus Mountain Observatory (CMO) of Sternberg Astronomical Institute of Moscow State University (SAI MSU) and also observed it at the 6m telescope of the Special Astrophysical Observatory of the Russian Academy of Sciences (SAO RAS) and 1m Schmidt telescope of the Byurakan Astrophysical Observatory (BAO) of the National Academy of Sciences of Armenia for deep spectral and imaging data. Throughout this study, we adopted the Mrk 738 redshift that gives in the standard CDM cosmology (H0 = 68 km s-1 Mpc-1, ) the luminosity distance 318 Mpc and the scale 1.35 kpc arcsec-1 according the NED database111http://http://ned.ipac.caltech.edu/.
| Data set | Date | , s | , ′′ | Sp. range | , Å |
|---|---|---|---|---|---|
| Direct imaging | |||||
| MaNGaL | 2022 Apr 07 | 2000 | 1.8 | [O iii] | 13 |
| MaNGaL | 2022 Apr 07 | 1200 | 1.8 | Continuum | 13 |
| MaNGaL | 2022 Apr 25 | 3600 | 1.6 | [O iii] | 13 |
| MaNGaL | 2022 Apr 25 | 3200 | 1.6 | Continuum | 13 |
| BAO | 2023 May 16 | 2400 | 2.7 | -sdss | |
| Long-slit spectroscopy | |||||
| SCORPIO-2 | 2023 Mar 14 | 2400 | 2.4 | 3650–7300 Å | 4.5 |
| SCORPIO-2 | 2023 Mar 14 | 2400 | 2.0 | 3650–7300 Å | 4.5 |
| SCORPIO-2 | 2023 Mar 15 | 2400 | 1.8 | 3600–8550 Å | 7.0 |
2 Observations and data analysis
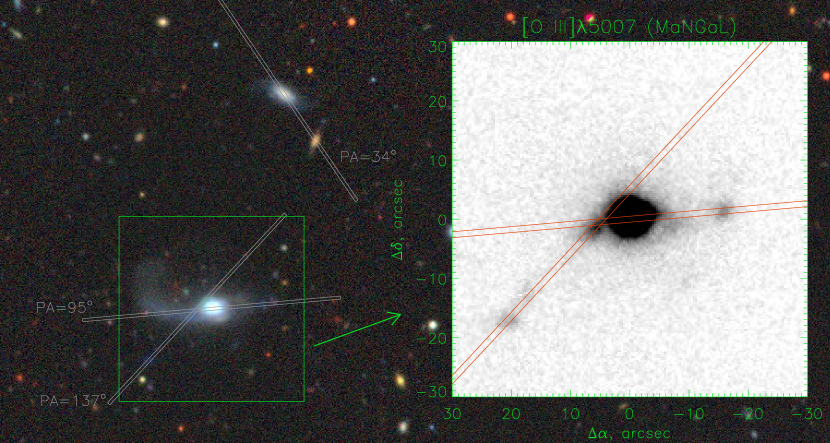
Images in the [O iii] emission line were obtained in March 2022 at the 2.5m CMO SAI MSU telescope (Shatsky et al., 2020) with the tunable filter photometer MaNGaL (Mapper of Narrow Galaxy Lines). This instrument is using a scanning Fabry-Perot interferometer as a narrow-band filter ( Å). The filter was subsequently centered on the redshifted [O iii] emission line and on the continuum shifted in 80 Å from the line. The instrument description and data reduction steps are described in Moiseev et al. (2020), the log of observations is given in Tab. 1 where , and are a total exposure, seeing value and spectral resolution correspondingly. The field of view (FoV) was with the scale px. The images obtained in different nights were aligned using the astrometric calibration via the astrometry.net software (Lang et al., 2010). The final emission line image after continuum subtraction is shown in Fig. 1. We have mapped [O iii] emission to the surface brightness with the signal-to-noise ratio .
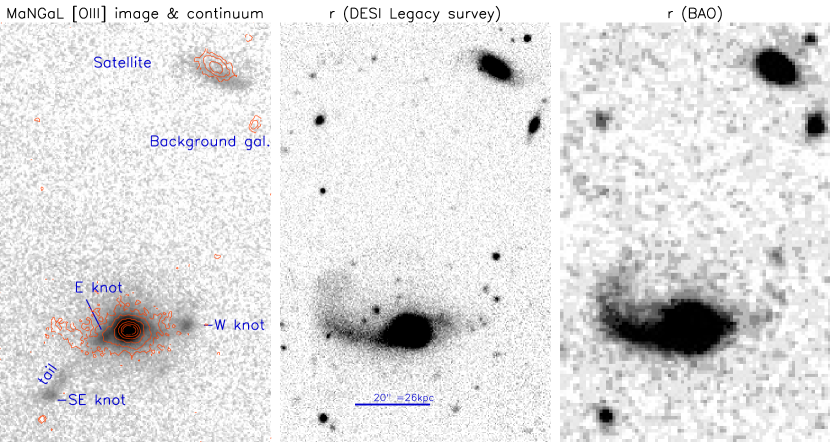
The [O iii] image reveals an extended system of emission knots and diffuse ionized gas surrounding the main galaxy. The brightest external features are (Fig. 2): (i) ‘SE knot’ at the projected distances from the nucleus that is a part of emission ‘tail’; (ii) ‘E knot’ – the bright region at to the east that is root of the ‘tail’ and (iii) ‘W knot’ at . Some of regions listed above are visible in DESI Legacy survey (Dey et al., 2019) as a faint blue structures (Fig. 1), SE knot was already found in the Magellan spectra (Congiu et al., 2017). Also a significant [O iii] emission was detected in the galaxy SDSS J130257.20+162537.1 located at (99 kpc) projected distances to the north of Mrk 783 (hereafter SDSS J1302+1625 or ‘the satellite’).
In order to study in details faint stellar structures outskirts of Mrk 783 we performed deep imaging in the -SDSS filter with the 1m Schmidt telescope of the BAO222The galaxy Mrk 783 was discovered with this telescope in 1976 (Markarian and Lipovetskii, 1976). The updated Apogee (USA) liquid-cooled CCD camera was used as a detector with the pixel scale and FoV of . The detailed description of the telescope, the photometer and data reduction steps are given in Dodonov et al. (2017). The -band image was calibrated to the magnitudes by using the DESI Legacy Surveys DR10 on-line photometric catalogue333https://datalab.noirlab.edu/ of sources in the observed field. At the signal to noise value we reached the surface brightness limit that is on mag deeper than -band DESI Legasy survey image (Fig. 2).
The spectral observations were carried out at the prime focus of the SAO RAS 6m telescope in the long-slit mode of the SCORPIO-2 focal reducer (Afanasiev and Moiseev, 2011) providing the spatial scale px along the slit. Other parameters are listed in the Tab. 1. We put the slit along the most interesting features appearing in [O iii] map: the slit with position angle crossed the possible companion galaxy SDSS J1302+1625 and fainter red galaxy SDSS J130256.50+162521.8, the slit with crossed the Mrk 783 nucleus together with W and E knots, whereas the slit exposed the tail with E and SE knots (see. 1). The spectrophotometric calibration was based on the observations of the standard star BD+75 325. Also the spectrum of this O-type star was used to correction of the galaxy spectra on the telluric absorption: O2 -band (686–698 nm) and H2O band at 710–730 nm. The last one affects the [S ii] redshifted lines of Mrk 783.
3 Ionized gas properties
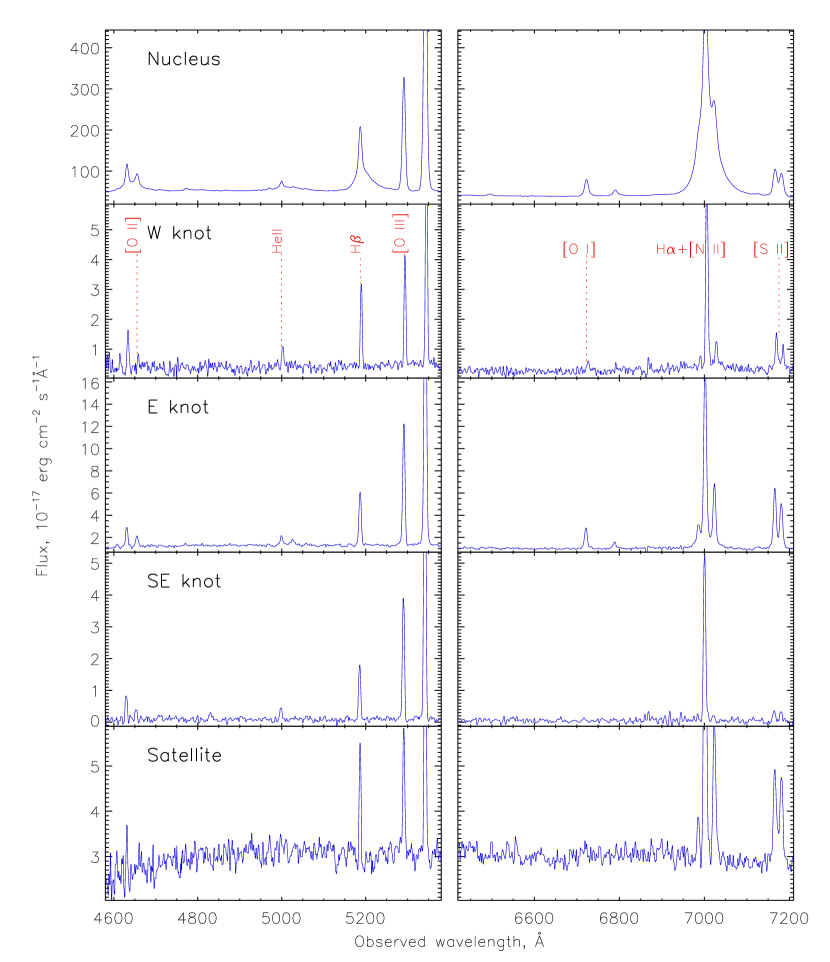
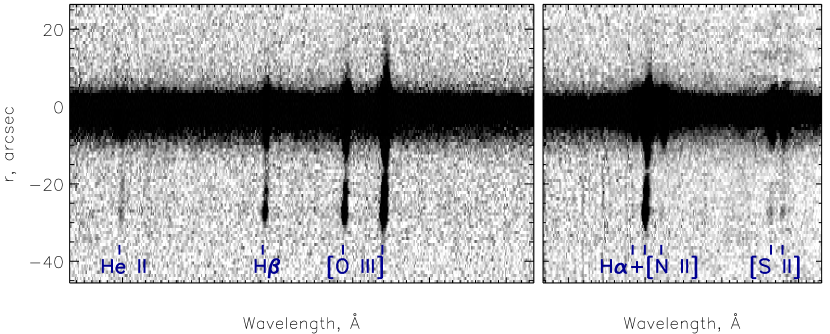
The integrated spectra of the emission knots mentioned above together with nuclei of the both galaxies are shown in Fig 3. The nuclear spectrum demonstrates the same properties detected in previous studies, including SDSS archival data444https://dr18.sdss.org/optical/spectrum/view?plateid=2603&mjd=54479&fiberid=259: a broad blue-shifted component of the Balmer emission lines and Sy-like flux ratio without bright iron emission. The both low- and high-excitation emission lines in external knots are narrow with a single-component structure. Also we detected here high-excited He ii emission with its relative intensity similar to the nuclear source: He ii/H. Fig. 4 clearly demonstrates the extended emission in He ii along the SE gaseous tail up to the projected distance (41 kpc). The spectrum of the satellite (Fig. 3, bottom panel) corresponds to intermediate objects between AGN and starburst (see Sec. 4) with narrow Balmer, [S ii],[N ii] and [O iii] lines without helium emission.
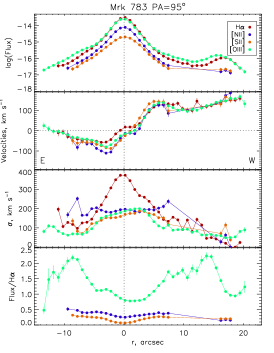
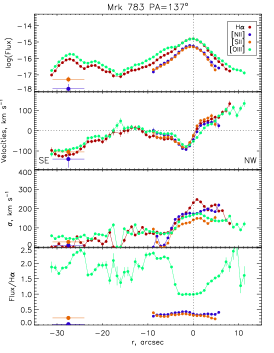
The parameters of the emission lines after subtraction of continuum interpolated by cubic spline (integrated flux, line-of-sight velocity and velocity dispersion corrected on the instrumental broadening) were estimated using a single-Gaussian fitting and shown in the Fig. 5.
In the inner few kpc () our long-slit data reveal features probably related with AGN outflow influence on the surrounding gas: a high velocity dispersion in the H line (including a spread of light from the broad line region), a significant difference between velocities in the forbidden and Balmer lines at ( in , see Fig. 5), a peak of negative velocities near the E-knot ( in ). In contrast with a circumnuclear region, the external gas in and around Mrk 783 is dynamically cold: the observed velocities in the forbidden and Balmer lines are in a good agreement within the errors; the typical velocity dispersion is . The line-of-sight velocity curve along at seems like a typical flat rotation curve of a disk galaxy (the slit lies near its photometric major axis). In this case the falling velocities in the opposite (eastern) side of this curve should be correspond to rotation in the stellar tidal tail clearly visible in broad-band images which can be partly off-plane. The amplitude of observed velocities along is about that is in an agreement with gas rotation on orbits slightly inclined to the main galaxy disk.
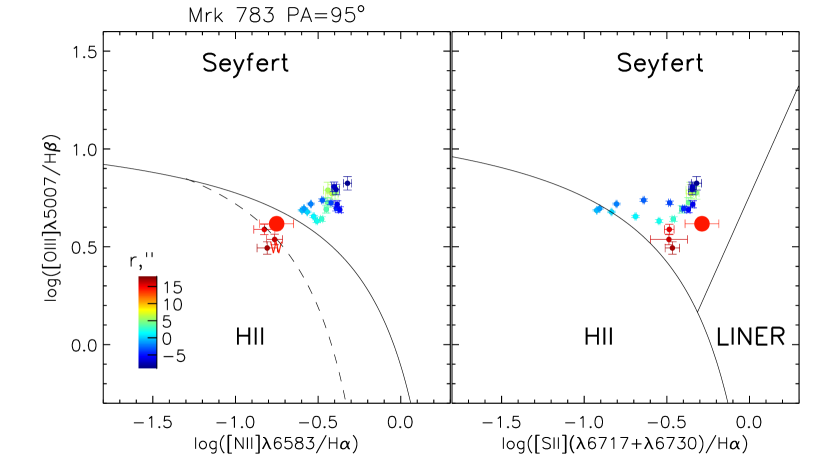
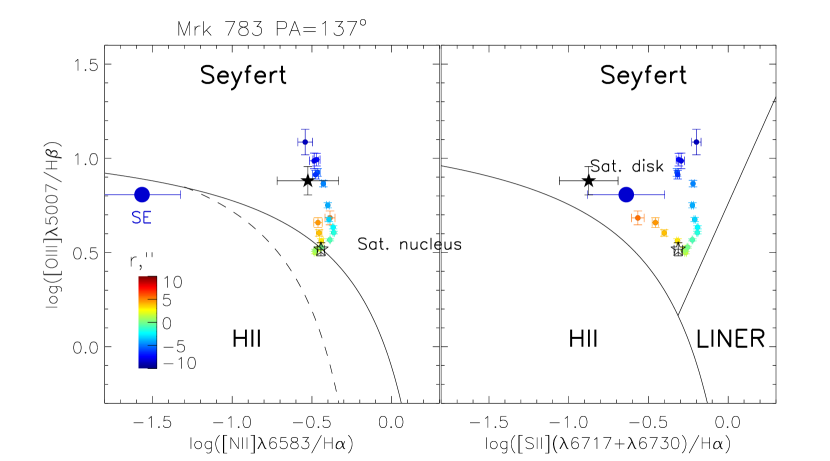
The [O iii] to H flux ratio along has a more or less constant value [O iii]/H in a very large distant range implying the same source of the gas excitation along the SE tail. Fig. 6 shows the diagnostic emission-line flux ratio diagrams (BPT, after Baldwin et al. Baldwin et al., 1981) for the Mrk 783 EELR. In contrast with the previous spectroscopic observations Congiu et al. (2017) where only upper limits for the [N ii]/H ratio were presented for the most distant SE-knot, we able to detect in this region both relatively faint [N ii] and [S ii] doublets of emission lines (Fig. 4).
On the diagram [O iii]/H vs. [S ii]/H (Fig. 6, right) all points occupied an area corresponded to the AGN-type ionization, whereas in the case of [O iii]/H vs. [N ii]/H plot (Fig. 6, left) the most distant regions locate near the border between the H ii and composite excitation (W knot) or even in the H ii area (SE knot). On the other hand, the high value of He ii/H lines ratio in these regions suggest (as well as in a bulk of EELR) the photoionization by hard UV continuum from AGN than by young OB stars. In this case, a decreasing of [N ii]/H ratio for the external regions could be caused by a relatively low gas chemical abundance. Indeed, numerical calculations by Bennert et al. (2006) for the typical NLR exhibit the similar behaviour of points on the BPT-diagramms, if we accept a metal abundance values for the W-knot and for the NW-knot.
Therefore the observed emission line ratios (He ii/H and BPT diagrams) suggest that AGN radiation is dominated source of the gas ionization up to projected distance 41 kpc from the nucleus.
4 The galaxy environment and the satellite
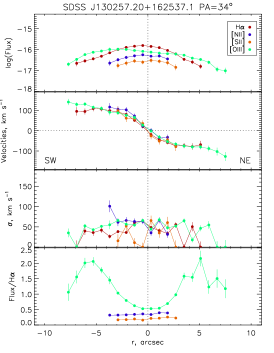
As we have already noted in Sec. 1, Mrk 783 was considered as an interacting galaxy having tidal tail and a possible secondary nucleus. The SCORPIO-2 spectrum along reveals that the brightest and nearest candidate to a possible companion — the galaxy SDSS J1302+1625 (‘the satellite’) has a systemic velocity that deviates only on from the velocity of Mrk 783 nucleus according our estimations along (, it is a mean value in the H,[N ii]and [O iii] lines) or on if we accepted the velocity of Mrk 783 nucleus according SDSS data in NED. These small velocity difference implies that Mrk 783 and SDSS J130257.20+162537.1 is a gravitationally bound pair. The slit also crossed a smaller galaxy in 20” from the satellite — J130256.50+162521.8, its spectrum corresponds to a distant galaxy redshifted at . It is marked in Fig. 2 as a ‘background galaxy’. We also found no other Mrk 783 companions by looking at the list of spectral and photometric redshifts for all NED objects up to projected distance 500 kpc ().
Can the satellite SDSS J1302+1625 create the observed peculiar morphology of Mrk 783? The most prominent tidal tail expands in E and NE directions up to projected distance (35 kpc) from the Mrk 783 center. The both DESI Legacy survey and deep BAO images (Fig. 2) demonstrate an absence of any faint tidal structures between the main galaxy and the satellite at least up to surface brightness in the -band (Sec. 2). The comparison of SDSS DR18 red magnitudes of Mrk 783 (, ) with those for the satellite (, ) gives the ratio in their luminosity and hence stellar mass –. This low ratio corresponds to the case of minor merging without significant perturbation of the main galaxy. Moreover in contrast with the main galaxy, the satellite seems unperturbed in both morphology and internal kinematics: it has a symmetrical rotation curve of the ionized gas (Fig. 5). All the facts listed above together with a possible sign of the secondary nucleus (Congiu et al., 2020) suggest that the observed peculiar morphology of Mrk 783 was caused by previous external event (merging with a companion) rather than with the low-massive satellite in kpc away.
The ionized gas properties of the satellite are intriguing. As we already mentioned in Sec. 3 its nuclear spectrum corresponds to a starburst galaxy. The emission line ratios correspond to the border between AGN and HII regions in BPT diagrams (open black star in Fig. 6, bottom panels). However the excitation of [O iii] emission increase dramatically to the galaxy outskirts — the ratio [O iii]/H reaches that is similar with the Mrk 783 EELR (Fig. 5, bottom). The corresponded points on the BPT-diagramms moves upward in the AGN area, in the region occupied by Mrk 785 EELR (the filled black star in Fig. 6, bottom). This fact implies that the outer part of the satellite disk is also ionized by the Mrk 783 AGN.
The second argument in favor of the external origin of the gas ionization in the satellite disk comes from the [O iii] emission distribution according MaNGaL data (Fig. 2). It is clearly seen that highly ionized gas in the satellite placed asymmetrically relative its nucleus — we observed it mostly on the side nearest to the Mrk 783.
We tried to estimate the electron density from the density-sensitive [S ii] doublet flux ratio [S ii][S ii]) using the diagnostic equations from (Proxauf et al., 2014) for K. The values of derived from the integrated spectra of W-knot, SE-knot and of the outer part of SDSS J1302+1625 (in the range –) are , and that corresponds to , and with the level. Preliminary we can conclude that the ionized gas density is significantly higher in the SDSS J1302+1625 disk than in Mrk 783 EELR, but the uncertainty in estimation is too great for more detailed analysis. New deeper spatially-resolved spectroscopic data are needed to better understand the ionization properties of the SDSS J1302+1625 outskirts.
5 The energetic budget
External EELRs are considered as a good probe to study the history of AGN radiative output on the time scale – yr (it corresponds to light-travel time to the gaseous clouds). The well-known prototype is Hanny’s Voorwerp, a cloud of highly ionized gas near the spiral galaxy IC 2497. The detailed comparison of the ionized gas properties and AGN luminosity clearly demonstrates that the radiation associated with a nuclear activity significantly fall at least two orders in the last yr (Lintott et al., 2009; Schawinski et al., 2010; Keel et al., 2012a). New examples of ‘fading’ AGNs were discovered in follow-up spectroscopic observations of EELR candidates found in SDSS broad-band images by volunteers of the Galaxy Zoo citizen-science project (Keel et al., 2012b, 2017), as well as in the data collected in surveys based on narrow-band [O iii] imaging (Keel et al., 2022) or integral-field spectroscopy (French et al., 2023). The ionized gas clouds around Mrk 783 including the disk of the companion galaxy allows as to use the same technique for estimation of its ionization budget.
We calculated the ionizing luminosity () required to creation the distant emission knots with the current bolometric luminosity of AGN () using the approach proposed in the paper cited above and briefly described below. The upper limit of the AGN flux absorbed by dust was estimated as a sum of fluxes in the far infrared (FIR, the wavelength range 42-122) according the Infrared Astronomical Satellite (IRAS) point-source catalogue data (Fullmer and Londsdale, 1989) and mid-infrared (MIR, the wavelength range 3.4-42) data from the Wide-filed Infrared Survey Expoler (WISE, Wright et al., 2010). We evaluated the IRAS luminosity () using a standard linear combinations of the flux in the 60 and 100 bands in the similar way as described in Keel et al. (2012b). For the WISE luminosity () we use a power-low approximation of the flux values obtained from the NED in the four bands 3.4, 4.6, 11.6 and 22.08 in the same manner as in Keel et al. (2017). For the unobscured AGN luminosity we use an empirical equation from Keel et al. (2022): , where is a nuclear luminosity in the [O iii] emission line based on the nuclear flux derived from 2D Moffat fitting of the MaNGaL image. In this case:
| (1) |
The lower limit of the nuclear source luminosity required for the ionization of the gas region having the H flux (H) occupying an angle was estimated according the equation proposed in (Keel et al., 2012b):
| (2) |
where is a galaxy redshift and is a projection of a solid angle under which the considered region is viewed from the nucleus. Here – is a projected distance from the nucleus, whereas is a radius of this region.
The quantities related to the energy balance based on the eq. (1)–(2) are listed in the Table 2. For the SE-knot we integrated the H flux from the SCORPIO-2 spectra along in the range , that is a half of the slit width. The eq. (1) is written for the slit oriented radially to the AGN, that is true for . But it is not valid for the slit orientation , passing through the satellite. To account for this, we used the same technique as described in Keel et al. (2022) for the similar observations of the external gas cloud near NGC 5514: i.e. we multiply the square of the emission edge of the satellite disk according [O iii] MaNGaL map (Fig. 2, left) on the mean surface brightness of the external part of the disk at from the satellite nucleus according spectra along . In this case, (the radius of the emission region) and (the distance from the AGN).
The ratio could be considered as an indicator of a long-term fading of AGN radiation or a difference of dust obscuration of this radiation between the direction to an observer and to EELR. Usually a fading AGN has (Keel et al., 2012b, 2022). However in the Mrk 783 this value is significantly smaller: in the SE-knot and even 0.12 in the outer disk of the companion galaxy. Of course, the real value could be higher, because the eq. (1) gives an upper bound of the active nucleus infrared luminosity and includes a fraction related with a dust heated by a star formation in the galaxy. Whereas, the eq. (2) gives a low bound of the ionizing flux absorbed by the clouds, because it depends on spatial resolution and optical thickness in the Lyman continuum (see the discussion in Keel et al., 2012a). A real spatial geometry of the system is unknown. Nevertheless we have no arguments in favour of significant fall AGN radiation in last 0.1–0.3 Myr, that corresponds to a projection of travel-light time from the Mrk 783 nucleus to the SE-knot and to the disk of SDSS J1302+1625.
| Quantities | AGN | SE-knot | Satellite |
|---|---|---|---|
| FIR luminosity | |||
| MIR luminosity | |||
| Unobscured ionizing luminosity | |||
| Total ionizing luminosity | |||
| Viewing angle , ∘ | 2.4 | 11.1 | |
| Cloud H flux, | |||
| 1.24 | 0.12 |
6 Discussion
It is generally accepted that large-scale EELRs around AGN can be formed in two main ways: via nuclear outflow driven by the kinetic power of radio jet and/or superwind in radio-loud AGN (Harrison et al., 2014; Rupke and Veilleux, 2011) or as a result of ionization of the pre-existing gas surrounding radio-quiet Seyfert galaxies (Keel et al., 2012b, 2022). The combination of the both cases is also possible, including a relic structures from the previous activity episodes (Morganti, 2017). The radio to optical luminosity ratio puts the Mrk 783 between radio-quiet and radio-loud AGN, the galaxy contains both an inner jet and extended diffuse radio structure (Congiu et al., 2017). What is an origin of this EELR?
Our spectroscopic data clearly manifest that the possible sign of jet outflow in the ionized gas kinematics appears only in the circumnuclear region ( kpc, Sec. 3). Whereas the more external gas exhibits properties similar with the external off-plane gas and tidal debris ionized by AGN in other galaxies (Keel et al., 2012a, 2022, and references therin):
-
•
The flux ratio of the most indicative emission lines (BPT-diagrams, high He ii/H) corresponds to the ionization by UV-continuum of AGN rather than by shocks related with jet or outflow.
-
•
The quiet kinematics of gas clouds (rotation on circular orbits, relatively low velocity dispersion) also indicates tidal induced motions or an external gas accretion.
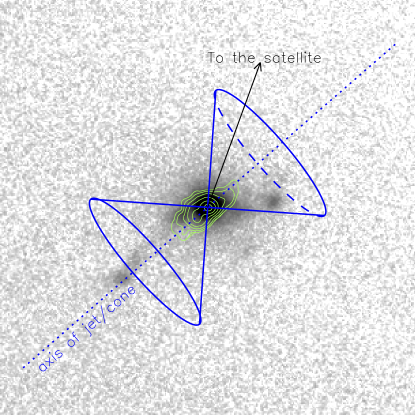
In their paper based on the Magellan spectroscopy Congiu et al. (2017) assumed that the ionized gas excitation in the Mrk 783 EELR is related with the extended radio structure. However the comparison of their synchrotron radio isocontours with MaNGaL [O iii] image manifests that only SE and E knots are more or less aligned with a direction of central radio structure, wheres the W-knot and the surrounding gas are not coincide with the radio contours (Fig. 7). On the other hand, the gas excitation and kinematics are similar in all considered structures that implies a common source of its ionization. On Fig. 7 we draw a location of possible bi-symmetric ionization cones with axis aligned according to a large-scale jet orientation (Congiu et al., 2017). The most of EELR structure lies inside the cones if we accepted the projected value of cone’s open angle . This value is in agreement with the mean value of for other ionization cones (Keel et al., 2019) if the projection effect will be taken into account.
The proposed orientation of the AGN cones allows to explain the ionization of the external parts of gaseous disk in the satellite galaxy (see the arrow in Fig. 7). As minimum a half of its disk that is close to the Mrk 783 is also ionized by the AGN. The effect of cross-ionization by companion’s AGN have been already found in several galactic pairs, however the characteristic separation was about 15-20 kpc (Moran et al., 1992; Merluzzi et al., 2018; Keel et al., 2019). In the case of Mrk 783 system the projected distance between companion’s nuclei is about 100 kpc that is perhaps the largest known today.
In the sec. 4 we presented arguments that the disturbed morphology of Mrk 783 and its tidal structures is not related with a distant companion galaxy. Most likely we observe the result of merging with a gas-rich dwarf galaxy. In this case the most of external gas in EELR came from a tidal destroyed low-metallicity companion ( according the low [N ii]/H ratio, sec. 3). The stellar tidal structure is aligned with gaseous one on the west from the galaxy, but NE emission tail has no stellar counterpart. This stellar-gaseous spatial misalignment is also observed in some AGN interacting galaxies in which EELRs are not spatial coincide with stellar tidal structures (for instance: NGC 5278/9 (Keel et al., 2019) or a spectacular local example — NGC 5194/95 (Watkins et al., 2018)). It is not surprising because in [O iii] we have detected only high-ionized fraction of a whole gaseous structure, whereas a distribution of cold H i can be revealed only by radio observations.
Interesting to note that many properties of Mrk 783 are similar to those observed in IC 2497 with Hanny’s Voorwerp nebula (Sec. 5): both are post-interacting disk galaxies having detached AGN-ionized EELR at the spatial scale of tens kpc and a relic structure traces the previous phase of radio jet activity. It means that we possible caught both galaxies after the switching between different types of activity (Fabian, 2012; Morganti, 2017): radio-loud (i.e kinetic) mode and radio-quiet (i.e. radiation) mode. However in IC 2497 the radio outburst occurred Myr ago (Smith et al., 2022), whereas a significant shortfall of AGN ionizing radiation traced in Hanny’s Voorwerp nebula is dated as –0.2 Myr ago (Lintott et al., 2009; Keel et al., 2012a). In Mrk 783 the age of the relic radio structure was not evaluated, whereas our calculations of the energetic budget (Sec. 5) presented no evidences for a significant decreasing of AGN radiation in last 0.1–0.3 Myr. Comparing these time scales we can speculate that the Mrk 783 AGN ionizing radiation will be turned off in the nearest future. Other words it can be considered as ‘Hanny’s Voorwerp precursor’. However, a more in-depth study of the ionization balance in the disk of Mrk783 companion is needed to prove this conclusion, because in the present work we operated only with integrated spectrum of the SDSS J1302+16 outskirts having a low surface brightness. Now we have performed only the first attempt to estimation of in the EELR and the satellite disk, whereas the spatial resolution is crucial for using of eq.(2), see Keel et al. (2012b, 2017). Moreover, Congiu et al. (2020) found in Mrk 783 an inner pc-scale radio jet that is significantly misalignment with a kpc-scale structure. For the explanation they proposed two scenarios: a jet precession, or reactivation after a period of inactivity. In this case the composition of recent activity episodes in Mrk 783 may be even more complex.
7 Conclusion
Based on new optical spectral and imaging observations we have studied the distribution, kinematics and excitation of the ionized gas in the giant EELR of Mrk 783 galaxy as well as the properties of its environment. The deepest to date spectra of this area allows us to consider the gas ionization conditions up to 41 kpc from the galactic nucleus. Moreover, its ionization trace was found in the disk of the satellite galaxy. The main results are following:
-
•
Mrk 783 forms a gravitationally bound pair with SDSS J130257.20+162537.1 (the projected distance between their nucleus is kpc). However the disturbed morphology and tidal structures are most likely caused by merging with other pre-existing companion — a gas-rich dwarf galaxy.
-
•
Most of the gaseous structures detected in the emission lines are ionized by the AGN radiation, but not by the radio jet.
-
•
Part of the gas illuminated by the cone belongs to the stellar tidal structure, but the most distant SE-knot is a part of external gaseous structure without stellar counterpart. Gas in this region has a low metallicity ( according the low [N ii]/H ratio).
-
•
External regions of the satellite gaseous disk at the nearest side to Mrk 783 falls into the ionizing cone from the main galaxy active nucleus. This fact makes the Mrk 783 system perhaps the most extreme example among nearby AGN galaxies of the cross-ionization a galactic disk by a companion.
-
•
A comparison of the ionizing luminosity required to create the most distant emission knots (including the satellite’s disk) with the current bolometric luminosity of the nucleus indicates that there is no significant decreasing ionizing radiation during last 0.1–0.3 Myr.
-
•
Mrk 783 can be considered as a ‘Hanny’s Voorwerp precursor’, i.e. a galaxy that demonstrates signs of sequential switching from kinematics (radio-dominated) to radiation (ionization-dominated) AGN modes, in the moment before falling of its ionization luminosity.
We hope that new multi-wavelength observations, first of all H i mapping in a radio domain, and deep optical integral-field mapping of the both galaxies in the pair allow us to better understand the spatial structure and evolution of this galactic system.
Conceptualization, A.M. and A.S.; methodology, A.M.; formal analysis, A.M., A.S. and T.M.; investigation, A.M. and A.S.; writing—original draft preparation, A.M; writing—review and editing, A.M., A.S. and T.M. All authors have read and agreed to the published version of the manuscript.
The work was performed as part of the SAO RAS government contract approved by the Ministry of Science and Higher Education of the Russian Federation.
Acknowledgements.
We obtained the observed data on the unique scientific facility “Big Telescope Alt-azimuthal” of SAO RAS. The renovation of telescope equipment is currently provided within the national project “Science and Universities”. We thank Roman Uklein and Dmitry Oparin who performed observations at the 2.5m and 6m telescopes. Some of the data presented in this paper were obtained from the Mikulski Archive for Space Telescopes (MAST). This research has made use of the NASA/IPAC Extragalactic Database (NED), which is funded by the National Aeronautics and Space Administration and operated by the California Institute of Technology. The work used the public data of the Legacy Surveys (http://legacysurvey.org), that consists of three individual and complementary projects: the Dark Energy Camera Legacy Survey (DECaLS; Proposal ID ; PIs: David Schlegel and Arjun Dey), the Beijing-Arizona Sky Survey (BASS; NOAO Prop. ID ; PIs: Zhou Xu and Xiaohui Fan), and the Mayall z-band Legacy Survey (MzLS; Prop. ID ; PI: Arjun Dey). DECaLS, BASS and MzLS together include data obtained, respectively, at the Blanco telescope, Cerro Tololo Inter-American Observatory, NSF’s NOIRLab; the Bok telescope, Steward Observatory, University of Arizona; and the Mayall telescope, Kitt Peak National Observatory, NOIRLab. The Legacy Surveys project is honored to be permitted to conduct astronomical research on Iolkam Duág (Kitt Peak), a mountain with particular significance to the Tohono Oódham Nation. This project used data obtained with the Dark Energy Camera (DECam), which was constructed by the Dark Energy Survey (DES) collaboration. Funding for the DES Projects has been provided by the U.S. Department of Energy, the U.S. National Science Foundation, the Ministry of Science and Education of Spain, the Science and Technology Facilities Council of the United Kingdom, the Higher Education Funding Council for England, the National Center for Supercomputing Applications at the University of Illinois at Urbana-Champaign, the Kavli Institute of Cosmological Physics at the University of Chicago, Center for Cosmology and Astro-Particle Physics at the Ohio State University, the Mitchell Institute for Fundamental Physics and Astronomy at Texas A&M University, Financiadora de Estudos e Projetos, Fundacao Carlos Chagas Filho de Amparo, Financiadora de Estudos e Projetos, Fundacao Carlos Chagas Filho de Amparo a Pesquisa do Estado do Rio de Janeiro, Conselho Nacional de Desenvolvimento Cientifico e Tecnologico and the Ministerio da Ciencia, Tecnologia e Inovacao, the Deutsche Forschungsgemeinschaft and the Collaborating Institutions in the Dark Energy Survey. The Collaborating Institutions are Argonne National Laboratory, the University of California at Santa Cruz, the University of Cambridge, Centro de Investigaciones Energeticas, Medioambientales y Tecnologicas-Madrid, the University of Chicago, University College London, the DES-Brazil Consortium, the University of Edinburgh, the Eidgenossische Technische Hochschule (ETH) Zurich, Fermi National Accelerator Laboratory, the University of Illinois at Urbana-Champaign, the Institut de Ciencies de l’Espai (IEEC/CSIC), the Institut de Fisica de Altes Energies, Lawrence Berkeley National Laboratory, the Ludwig Maximilians Universitat Munchen and the associated Excellence Cluster Universe, the University of Michigan, NSF’s NOIRLab, the University of Nottingham, the Ohio State University, the University of Pennsylvania, the University of Portsmouth, SLAC National Accelerator Laboratory, Stanford University, the University of Sussex, and Texas A&M University. BASS is a key project of the Telescope Access Program (TAP), which has been funded by the National Astronomical Observatories of China, the Chinese Academy of Sciences (the Strategic Priority Research Program ‘The Emergence of Cosmological Structures’ Grant #XDB09000000), and the Special Fund for Astronomy from the Ministry of Finance. The BASS is also supported by the External Cooperation Program of Chinese Academy of Sciences (Grant # 114A11KYSB20160057), and Chinese National Natural Science Foundation (Grant # 11433005). The Legacy Survey team makes use of data products from the Near-Earth Object Wide-field Infrared Survey Explorer (NEOWISE), which is a project of the Jet Propulsion Laboratory/California Institute of Technology. NEOWISE is funded by the National Aeronautics and Space Administration. The Legacy Surveys imaging of the DESI footprint is supported by the Director, Office of Science, Office of High Energy Physics of the U.S. Department of Energy under Contract No. DE-AC02-05CH1123; by the National Energy Research Scientific Computing Center, a DOE Office of Science User Facility under the same contract; and by the U.S. National Science Foundation, Division of Astronomical Sciences under Contract No. AST-0950945 to NOAO. \conflictsofinterestThe authors declare no conflict of interest. \abbreviationsAbbreviations The following abbreviations are used in this manuscript:| AGN | Active galaxy nucleus |
| EELR | Extended emission-line region |
| FWHM | Full width at half-maximum |
| LINER | Low-ionization nuclear emission-line region |
| SAO RAS | Special Astrophysical Observatory of the Russian Academy of Sciences |
References
- Markarian and Lipovetskii (1976) Markarian, B.E.; Lipovetskii, V.A. Galaxies with ultraviolet continuum. VIII. . Astrofizika 1976, 12, 389–396.
- Osterbrock and Pogge (1985) Osterbrock, D.E.; Pogge, R.W. The spectra of narrow-line Seyfert 1 galaxies. . ApJ 1985, 297, 166–176. https://doi.org/10.1086/163513.
- Mathur (2000) Mathur, S. Narrow-line Seyfert 1 galaxies and the evolution of galaxies and active galaxies. MNRAS 2000, 314, L17–L20, [arXiv:astro-ph/astro-ph/0003111]. https://doi.org/10.1046/j.1365-8711.2000.03530.x.
- Berton et al. (2015) Berton, M.; Foschini, L.; Ciroi, S.; Cracco, V.; La Mura, G.; Lister, M.L.; Mathur, S.; Peterson, B.M.; Richards, J.L.; Rafanelli, P. Parent population of flat-spectrum radio-loud narrow-line Seyfert 1 galaxies. Astronomy & Astrophysics 2015, 578, 1–12, [arXiv:astro-ph/astro-ph/1504.02772]. https://doi.org/10.1051/0004-6361/201525691.
- Congiu et al. (2017) Congiu, E.; Berton, M.; Giroletti, M.; Antonucci, R.; Caccianiga, A.; Kharb, P.; Lister, M.L.; Foschini, L.; Ciroi, S.; Cracco, V.; et al. Kiloparsec-scale emission in the narrow-line Seyfert 1 galaxy Mrk 783. Astronomy & Astrophysics 2017, 603, 1–5, [arXiv:astro-ph/astro-ph/1704.03881]. https://doi.org/10.1051/0004-6361/201730616.
- Congiu et al. (2020) Congiu, E.; Kharb, P.; Tarchi, A.; Berton, M.; Caccianiga, A.; Chen, S.; Crepaldi, L.; Di Mille, F.; Jrvel, E.; Jarvis, M.; et al. The radio structure of the narrow-line Seyfert 1 Mrk 783 with VLBA and e-MERLIN . MNRAS 2020, 499, 3149–3157, [arXiv:astro-ph/astro-ph/2009.13529]. https://doi.org/10.1093/mnras/staa3024.
- Congiu et al. (2017) Congiu, E.; Contini, M.; Ciroi, S.; Cracco, V.; Di Mille, F.; Berton, M.; Frezzato, M.; La Mura, G.; Rafanelli, P. Extended Narrow-Line Region in Seyfert Galaxies. Frontiers in Astronomy and Space Sciences 2017, 4, 27, [arXiv:astro-ph.GA/1710.01173]. https://doi.org/10.3389/fspas.2017.00027.
- Shatsky et al. (2020) Shatsky, N.; Belinski, A.; Dodin, A.; Zheltoukhov, S.; Kornilov, V.; Postnov, K.; Potanin, S.; Safonov, B.; Tatarnikov, A.; Cherepashchuk, A. The Caucasian Mountain Observatory of the Sternberg Astronomical Institute: First Six Years of Operation. In Proceedings of the Ground-Based Astronomy in Russia. 21st Century; Romanyuk, I.I.; Yakunin, I.A.; Valeev, A.F.; Kudryavtsev, D.O., Eds., 2020, pp. 127–132, [arXiv:astro-ph.IM/2010.10850]. https://doi.org/10.26119/978-5-6045062-0-2_2020_127.
- Moiseev et al. (2020) Moiseev, A.; Perepelitsyn, A.; Oparin, D. Mapper of Narrow Galaxy Lines (MaNGaL): new tunable filter imager for Caucasian telescopes. Experimental Astronomy 2020, 50, 199–214, [arXiv:astro-ph.IM/2005.14598]. https://doi.org/10.1007/s10686-020-09672-x.
- Lang et al. (2010) Lang, D.; Hogg, D.W.; Mierle, K.; Blanton, M.; Roweis, S. Astrometry.net: Blind Astrometric Calibration of Arbitrary Astronomical Images. AJ 2010, 139, 1782–1800, [arXiv:astro-ph.IM/0910.2233]. https://doi.org/10.1088/0004-6256/139/5/1782.
- Dey et al. (2019) Dey, A.; Schlegel, D.J.; Lang, D.; Blum, R.; Burleigh, K.; Fan, X.; Findlay, J.R.; Finkbeiner, D.; Herrera, D.; Juneau, S.; et al. Overview of the DESI Legacy Imaging Surveys. AJ 2019, 157, 168, [arXiv:astro-ph.IM/1804.08657]. https://doi.org/10.3847/1538-3881/ab089d.
- Dodonov et al. (2017) Dodonov, S.N.; Kotov, S.S.; Movsesyan, T.A.; Gevorkyan, M. One-meter Schmidt telescope of the Byurakan Astrophysical Observatory: New capabilities. Astrophysical Bulletin 2017, 72, 473–479. https://doi.org/10.1134/S1990341317040113.
- Afanasiev and Moiseev (2011) Afanasiev, V.L.; Moiseev, A.V. Scorpio on the 6 m Telescope: Current State and Perspectives for Spectroscopy of Galactic and Extragalactic Objects. Baltic Astronomy 2011, 20, 363–370, [arXiv:astro-ph.IM/1106.2020].
- Kewley et al. (2001) Kewley, L.J.; Dopita, M.A.; Sutherland, R.S.; Heisler, C.A.; Trevena, J. Theoretical Modeling of Starburst Galaxies. ApJ 2001, 556, 121–140, [arXiv:astro-ph/astro-ph/0106324]. https://doi.org/10.1086/321545.
- Kauffmann et al. (2003) Kauffmann, G.; Heckman, T.M.; Tremonti, C.; Brinchmann, J.; Charlot, S.; White, S.D.M.; Ridgway, S.E.; Brinkmann, J.; Fukugita, M.; Hall, P.B.; et al. The host galaxies of active galactic nuclei. MNRAS 2003, 346, 1055–1077, [arXiv:astro-ph/astro-ph/0304239]. https://doi.org/10.1111/j.1365-2966.2003.07154.x.
- Baldwin et al. (1981) Baldwin, J.A.; Phillips, M.M.; Terlevich, R. Classification parameters for the emission-line spectra of extragalactic objects. PASP 1981, 93, 5–19. https://doi.org/10.1086/130766.
- Bennert et al. (2006) Bennert, N.; Jungwiert, B.; Komossa, S.; Haas, M.; Chini, R. Size and properties of the NLR in the Seyfert-2 galaxy <ASTROBJ>NGC 1386</ASTROBJ>. A&A 2006, 446, 919–932, [arXiv:astro-ph/astro-ph/0511279]. https://doi.org/10.1051/0004-6361:20053571.
- Proxauf et al. (2014) Proxauf, B.; Öttl, S.; Kimeswenger, S. Upgrading electron temperature and electron density diagnostic diagrams of forbidden line emission. A&A 2014, 561, A10, [arXiv:astro-ph.IM/1311.5041]. https://doi.org/10.1051/0004-6361/201322581.
- Lintott et al. (2009) Lintott, C.J.; Schawinski, K.; Keel, W.; van Arkel, H.; Bennert, N.; Edmondson, E.; Thomas, D.; Smith, D.J.B.; Herbert, P.D.; Jarvis, M.J.; et al. Galaxy Zoo: ‘Hanny’s Voorwerp’, a quasar light echo? MNRAS 2009, 399, 129–140, [arXiv:astro-ph.CO/0906.5304]. https://doi.org/10.1111/j.1365-2966.2009.15299.x.
- Schawinski et al. (2010) Schawinski, K.; Evans, D.A.; Virani, S.; Urry, C.M.; Keel, W.C.; Natarajan, P.; Lintott, C.J.; Manning, A.; Coppi, P.; Kaviraj, S.; et al. The Sudden Death of the Nearest Quasar. ApJ 2010, 724, L30–L33, [arXiv:astro-ph.CO/1011.0427]. https://doi.org/10.1088/2041-8205/724/1/L30.
- Keel et al. (2012a) Keel, W.C.; Lintott, C.J.; Schawinski, K.; Bennert, V.N.; Thomas, D.; Manning, A.; Chojnowski, S.D.; van Arkel, H.; Lynn, S. The History and Environment of a Faded Quasar: Hubble Space Telescope Observations of Hanny’s Voorwerp and IC 2497. AJ 2012, 144, 66, [arXiv:astro-ph.CO/1206.3797]. https://doi.org/10.1088/0004-6256/144/2/66.
- Keel et al. (2012b) Keel, W.C.; Chojnowski, S.D.; Bennert, V.N.; Schawinski, K.; Lintott, C.J.; Lynn, S.; Pancoast, A.; Harris, C.; Nierenberg, A.M.; Sonnenfeld, A.; et al. The Galaxy Zoo survey for giant AGN-ionized clouds: past and present black hole accretion events. MNRAS 2012, 420, 878–900, [arXiv:astro-ph.CO/1110.6921]. https://doi.org/10.1111/j.1365-2966.2011.20101.x.
- Keel et al. (2017) Keel, W.C.; Lintott, C.J.; Maksym, W.P.; Bennert, V.N.; Chojnowski, S.D.; Moiseev, A.; Smirnova, A.; Schawinski, K.; Sartori, L.F.; Urry, C.M.; et al. Fading AGN Candidates: AGN Histories and Outflow Signatures. ApJ 2017, 835, 256, [arXiv:astro-ph.GA/1612.06006]. https://doi.org/10.3847/1538-4357/835/2/256.
- Keel et al. (2022) Keel, W.C.; Moiseev, A.; Kozlova, D.V.; Ikhsanova, A.I.; Oparin, D.V.; Uklein, R.I.; Smirnova, A.A.; Eselevich, M.V. The TELPERION survey for distant [O III] clouds around luminous and hibernating AGN. MNRAS 2022, 510, 4608–4625, [arXiv:astro-ph.GA/2112.07084]. https://doi.org/10.1093/mnras/stab3656.
- French et al. (2023) French, K.D.; Earl, N.; Novack, A.B.; Pardasani, B.; Pillai, V.R.; Tripathi, A.; Verrico, M.E. Fading AGNs in Poststarburst Galaxies. ApJ 2023, 950, 153. https://doi.org/10.3847/1538-4357/acd249.
- Fullmer and Londsdale (1989) Fullmer, L.; Londsdale, C.J. Cataloged galaxies and quasars observed in the IRAS survey; 1989.
- Wright et al. (2010) Wright, E.L.; Eisenhardt, P.R.M.; Mainzer, A.K.; Ressler, M.E.; Cutri, R.M.; Jarrett, T.; Kirkpatrick, J.D.; Padgett, D.; McMillan, R.S.; Skrutskie, M.; et al. The Wide-field Infrared Survey Explorer (WISE): Mission Description and Initial On-orbit Performance. AJ 2010, 140, 1868–1881, [arXiv:astro-ph.IM/1008.0031]. https://doi.org/10.1088/0004-6256/140/6/1868.
- Harrison et al. (2014) Harrison, C.M.; Alexander, D.M.; Mullaney, J.R.; Swinbank, A.M. Kiloparsec-scale outflows are prevalent among luminous AGN: outflows and feedback in the context of the overall AGN population. MNRAS 2014, 441, 3306–3347, [arXiv:astro-ph.GA/1403.3086]. https://doi.org/10.1093/mnras/stu515.
- Rupke and Veilleux (2011) Rupke, D.S.N.; Veilleux, S. Integral Field Spectroscopy of Massive, Kiloparsec-scale Outflows in the Infrared-luminous QSO Mrk 231. ApJ 2011, 729, L27, [arXiv:astro-ph.GA/1102.4349]. https://doi.org/10.1088/2041-8205/729/2/L27.
- Morganti (2017) Morganti, R. Archaeology of active galaxies across the electromagnetic spectrum. Nature Astronomy 2017, 1, 596–605, [arXiv:astro-ph.GA/1709.01667]. https://doi.org/10.1038/s41550-017-0223-0.
- Keel et al. (2019) Keel, W.C.; Bennert, V.N.; Pancoast, A.; Harris, C.E.; Nierenberg, A.; Chojnowski, S.D.; Moiseev, A.V.; Oparin, D.V.; Lintott, C.J.; Schawinski, K.; et al. AGN photoionization of gas in companion galaxies as a probe of AGN radiation in time and direction. MNRAS 2019, 483, 4847–4865, [arXiv:astro-ph.GA/1711.09936]. https://doi.org/10.1093/mnras/sty3332.
- Moran et al. (1992) Moran, E.C.; Halpern, J.P.; Bothun, G.D.; Becker, R.H. WAS 49: Mirror for a Hidden Seyfert 1 Nucleus. AJ 1992, 104, 990. https://doi.org/10.1086/116292.
- Merluzzi et al. (2018) Merluzzi, P.; Busarello, G.; Dopita, M.A.; Thomas, A.D.; Haines, C.P.; Grado, A.; Limatola, L.; Mercurio, A. An Interacting Galaxy Pair at the Origin of a Light Echo. ApJ 2018, 852, 113, [arXiv:astro-ph.GA/1801.01005]. https://doi.org/10.3847/1538-4357/aa9fff.
- Watkins et al. (2018) Watkins, A.E.; Mihos, J.C.; Bershady, M.; Harding, P. Discovery of a Vast Ionized Gas Cloud in the M51 System. ApJ 2018, 858, L16, [arXiv:astro-ph.GA/1804.01699]. https://doi.org/10.3847/2041-8213/aabba1.
- Fabian (2012) Fabian, A.C. Observational Evidence of Active Galactic Nuclei Feedback. ARA&A 2012, 50, 455–489, [arXiv:astro-ph.CO/1204.4114]. https://doi.org/10.1146/annurev-astro-081811-125521.
- Smith et al. (2022) Smith, D.J.B.; Krause, M.G.; Hardcastle, M.J.; Drake, A.B. Relic jet activity in ’Hanny’s Voorwerp’ revealed by the LOFAR two metre sky survey. MNRAS 2022, 514, 3879–3885, [arXiv:astro-ph.GA/2206.06378]. https://doi.org/10.1093/mnras/stac1568.