Further author information: (Send correspondence to Guanghui Fu, guanghui.fu@inria.fr)
Morphology-Enhanced CAM-Guided SAM for weakly supervised Breast Lesion Segmentation
Abstract
Breast cancer diagnosis challenges both patients and clinicians, with early detection being crucial for effective treatment. Ultrasound imaging plays a key role in this, but its utility is hampered by the need for precise lesion segmentation-a task that is both time-consuming and labor-intensive. To address these challenges, we propose a new framework: a morphology-enhanced, Class Activation Map (CAM)-guided model, which is optimized using a computer vision foundation model known as SAM. This innovative framework is specifically designed for weakly supervised lesion segmentation in early-stage breast ultrasound images. Our approach uniquely leverages image-level annotations, which removes the requirement for detailed pixel-level annotation. Initially, we perform a preliminary segmentation using breast lesion morphology knowledge. Following this, we accurately localize lesions by extracting semantic information through a CAM-based heatmap. These two elements are then fused together, serving as a prompt to guide the SAM in performing refined segmentation. Subsequently, post-processing techniques are employed to rectify topological errors made by the SAM. Our method not only simplifies the segmentation process but also attains accuracy comparable to supervised learning methods that rely on pixel-level annotation. Our framework achieves a Dice score of 74.39% on the test set, demonstrating compareable performance with supervised learning methods. Additionally, it outperforms a supervised learning model, in terms of the Hausdorff distance, scoring 24.27 compared to Deeplabv3+’s 32.22. These experimental results showcase its feasibility and superior performance in integrating weakly supervised learning with SAM. The code is made available at: https://github.com/YueXin18/MorSeg-CAM-SAM.
keywords:
Ultrasound images, Lesion segmentation, Weakly supervised learning, SAM1 Introduction
Breast cancer is one of the most common malignant tumors affecting women, with its incidence rising annually [1]. Globally, in 2020, there were approximately 2.26 million cases of breast cancer, leading to around 685 thousand deaths [2]. This makes it the leading cause of cancer-related mortality among women worldwide [3]. The World Health Organization launched the Global Breast Cancer Initiative in 2021, aiming to tackle this significant health challenge [3]. Globally, three main inequities affect breast cancer care [4]: late diagnosis, often at advanced stages; inadequate services, including limited diagnostic and treatment facilities; and low coverage, particularly in the inclusion of breast cancer in Universal Health Coverage (UHC). The risk factors for breast cancer are multifaceted. Age is a primary risk factor, with older women exhibiting the highest incidence rates [5]. Furthermore, genetic factors play a role in 5-10% of cases, notably mutations in the BRCA1 or BRCA2 genes [3]. Early detection and prompt treatment are vital, as the five-year survival rate can exceed 90% with early diagnosis [6]. In terms of diagnostics, while manual examinations are common, three key imaging techniques are employed: mammography, magnetic resonance imaging (MRI), and ultrasound. Ultrasound is particularly effective for examining dense breasts, as it provides detailed insights into the morphology, orientation, internal structure, and margins of lesions [7, 8]. These assessments are crucial for distinguishing between benign and malignant breast lesions [9]. Ultrasound stands out as a highly sensitive, non-invasive, radiation-free, and cost-effective method for early breast cancer detection and diagnosis, especially in dense breast tissue [10].
Computed-aided diagnosis (CAD) has emerged as a key research priority for radiologists, particularly for enhancing the efficiency of interpreting ultrasound images [11]. CAD systems can autonomously analyze lesion characteristics and differentiate them from normal tissues. However, the automatic detection of breast tumors presents challenges, notably due to their irregular shapes and blurred boundaries. Current research in breast ultrasound (BUS) image lesion segmentation falls into two main categories: traditional methods that rely on predefined features [12] and those based on deep learning [13, 14]. Traditional segmentation approaches, such as region growing-based [15, 16, 17, 18], threshold-based [19, 20, 21, 22], and clustering-based methods [23, 24], effectively capture contour information of lesions. However, they often struggle with generalization, especially in cases of lesions with fuzzy and irregular boundaries. In contrast, deep learning-based methods have shown significant progress in detecting breast lesions. A notable development in this area is the introduction of an end-to-end convolutional neural network (CNN), UNet, specifically designed for medical image segmentation [25]. Following its introduction, several neural network architectures similar to UNet, such as [26, 27, 28, 29, 30], have been developed, demonstrating enhanced abilities in segmenting breast lesions.
Most deep learning methods in medical imaging operate under fully supervised scenarios, where their performance heavily depends on the quantity of pixel-level labels [31]. However, annotating medical images requires specialized medical knowledge, including disease diagnosis and understanding of anatomical structures, making accurate and comprehensive annotation challenging. Consequently, achieving better segmentation results with less costly image annotation has become a focal point in medical image segmentation research. Researchers are increasingly exploring methods that can efficiently utilize imperfect data or labels, such as weakly supervised segmentation algorithms [32, 31]. Some approaches use classification networks and class activation maps (CAM) [33], which identify semantic features and help initially localize lesions [34, 35]. These methods not only facilitate lesion detection but also aid in understanding the classification model’s predictions [36], allowing researchers and users to examine the model’s decision-making basis [37, 38]. However, CAMs typically provide only a rough estimate of the predicted areas, and their ability to precisely delineate lesion boundaries, especially edges, is limited [39, 40]. Furthermore, the effectiveness of weakly supervised methods is often contingent on the accuracy of pseudo-labels, which, when generated by CAMs, can be influenced by surrounding background noise [41]. The recently introduced Segment Anything Model (SAM) [42] represents a significant advancement in addressing these challenges. Trained on over 11 million images with 1 billion masks (SA-1B), SAM is capable of zero-shot segmentation on unseen images using various prompts such as bounding boxes, points, and text [43]. However, its application to medical images, which often feature complex biological tissues with diverse shapes and characteristics, differs from natural images. Therefore, direct segmentation of lesions using SAM in medical contexts has not yet yielded optimal results [44, 45]. This highlights the need for continued research and adaptation of these advanced segmentation tools for specific challenges in medical imaging.
In order to overcome the limitations of current methods, we propose a novel weakly supervised breast lesion segmentation framework comprising four main modules: a traditional segmentation module based on morphology, a semantic information extraction and lesion localization module, an information fusion module, and a SAM fine-grained segmentation module. The traditional segmentation module utilizes morphology to perform initial segmentation and extract contour information from medical images, focusing on the shape, edge, and direction of lesions. The semantic information extraction and lesion localization module, leveraging image-level category labels, trains a classification network and achieves a fuzzy localization of lesions through the heat map provided by CAM. The information fusion module then adeptly combines the outputs from these two modules, generating a more comprehensive lesion area. Finally, SAM utilizes this area as a prompt for segmenting lesions, refining the segmentation process and enhancing the results through post-processing. This integrated approach aims to address the challenges in weakly supervised breast lesion segmentation by combining traditional and advanced techniques for more accurate and efficient results. The key contributions of this paper are outlined as follows:
-
•
This paper introduces a novel integration of SAM (Segment Anything Model) with weakly supervised methods for breast lesion segmentation. It can refine segmentation regions when fed with regions derived from CAM (Class Activation Maps) or similar techniques. This ability is particularly beneficial in scenarios with limited training data, ensuring improved segmentation outcomes.
-
•
The proposed segmentation framework integrates prior knowledge of lesion morphology, semantic features from medical images, and the precise segmentation capabilities of SAM. By merging these diverse methodologies, the framework is able to learn more comprehensive lesion features, leveraging the combined strengths of each approach.
-
•
The framework has been tested on publicly available datasets, showcasing impressive performance. It consistently outperforms other weakly supervised segmentation methods, with results approaching those of fully supervised techniques. This is evidenced by a Dice Score of 74.39%, only 3.92% lower than that achieved by a fully supervised UNet. Additionally, the 95% Hausdorff distance (HD95) metric is 7.95 lower compared to Deeplabv3+. These results validate the effectiveness and generalizability of our proposed method.
2 Related work
2.1 Weakly supervised segmentation methods
Deep learning, particularly through architectures like UNet and DeepLabv3+, has revolutionized lesion segmentation in medical imaging. UNet [25], known for its encoder-decoder structure and skip connections, simplifies the segmentation process by eliminating complex manual feature extraction. DeepLabv3+ extends these capabilities with dilated convolution, effectively handling variations in lesion size and shape [46]. This adaptability makes it especially suitable for complex medical image segmentation tasks.
However, supervised learning based lesion segmentation relies on high-quality, pixel-level annotated datasets, which makes this field challenging . To achieve high-quality segmentation with easier and more cost-effective annotations, researchers are exploring weakly supervised strategies, for example interaction-based methods. These methods involve user participation in selecting regions, marking boundaries, and refining labels, guiding the algorithm for better segmentation. For instance, Roth et al. [47] used a random walk algorithm with user clicks to train a convolutional network, enhancing segmentation with custom loss functions and attention mechanisms. Pinheiro and Collobert [48] proposed a method using pixel-level labels and back-propagation of errors for more accurate weakly supervised segmentation. These approaches offer promising alternatives to resource-heavy fully supervised methods, especially when high-quality annotated datasets are scarce.
Weakly supervised semantic segmentation has gained significant attention in recent times, especially with the advancement of class activation mapping (CAM) techniques [33]. Various researchers have proposed innovative methods to enhance the accuracy and overcome the inherent limitations of CAM-based approaches. For instance, Chen et al. [49] introduced the causal CAM (C-CAM) method, addressing the challenge of unclear object boundaries between foreground and background. C-CAM operates on two causal chains: the category-causal chain, which relates to how image content affects categories, and the anatomical-causal chain, focusing on anatomical structures influencing organ segmentation. This method has been thoroughly tested across three public medical image datasets. Zhong et al. [50] proposed a combination of CAM and weakly supervised detection-aware pre-training (DAP). This approach leverages weakly labeled categorical data for pre-training, transforming the categorical dataset into a detection dataset via a weakly supervised target localization method based on class-activation mapping. This enables the pre-trained models to be location-aware and capable of predicting bounding boxes. Ahn and Kwak [51] proposed AffinityNet that generates accurate segmentation labels for training images based solely on image-level class labels. It combines semantic features with random walking to modify CAM and produce segmentation labels. These methods exemplify the innovative approaches in weakly supervised learning for medical image lesion detection and segmentation, significantly reducing the cost and subjectivity associated with manual labeling. However, weakly supervised methods primarily rely on image-level labeling, which can lead to the model learning imprecise features, impacting the final segmentation’s accuracy. Additionally, these methods might not fully exploit all available information in complex images, particularly with intricate lesion structures or boundary cases. To address these challenges, the integration of boundary-refined gain tools is crucial. It can be balanced and effective strategy for dealing with the complexities and nuances of medical image segmentation.
2.2 SAM based segmentation methods
The Segment Anything Model (SAM) [42] has recently gained considerable attention in the computer vision community for its remarkable zero-shot image segmentation capabilities. SAM, a model capable of generalizing to unfamiliar objects and images without additional training, incorporates the prompt paradigm from natural language processing into computer vision. This approach enables accurate image segmentation based on input prompts, such as points or boxes, and can generate masks for all objects in an image. However, SAM is primarily optimized for natural images, and its direct application in medical image segmentation has proven less accurate, posing significant challenges in this domain [44, 52]. Addressing these issues, researchers are focusing on adapting SAM for medical imaging. Ma and Wang et al. [52] developed MedSAM, trained on a large-scale dataset containing over 1 million medical image-mask pairs. MedSAM is adept at segmenting various anatomical structures and lesions across different medical imaging modalities, offering a balanced mix of automation and customization. Similarly, Wu et al. [53] introduced the Medical SAM Adapter, which integrates medical-specific knowledge into SAM using parameter-efficient adaptive fine-tuning techniques, significantly enhancing the original model. Fine-tuning SAM to suit specific datasets enhances its adaptability and ability to capture relevant features, improving performance on both familiar and unseen data [45]. This process allows SAM to learn more generalizable features, aiding its performance across diverse samples and scenarios. However, fine-tuning may demand substantial computational resources, such as increased training time and storage, which could limit its applicability. Moreover, a fine-tuned SAM might not generalize well across various types of medical images or segmentation tasks due to domain-specific adaptations. Recent studies have shown that using prompt methods with SAM can markedly improve its performance. Chen et al. [54] introduced RSPrompter, a novel prompt learning technique, to guide SAM in generating semantic instance-level masks, particularly enhancing its capabilities in remote sensing image instance segmentation. Deng et al. [55] proposed the SAM-U framework, incorporating multi-frame prompts to achieve more accurate medical image segmentation. Compared to fine-tuning, prompt methods can reduce the dependency on large quantities of accurate labels. By integrating prompts into training, the model can achieve commendable performance with a relatively limited number of labels. Additionally, prompt methods enhance the model’s interpretability, offering a more comprehensible and user-friendly approach to image segmentation.
These research demonstrate the potential and effectiveness of SAM, a generalized segmentation model that can be extended to the medical image field.
3 Methods
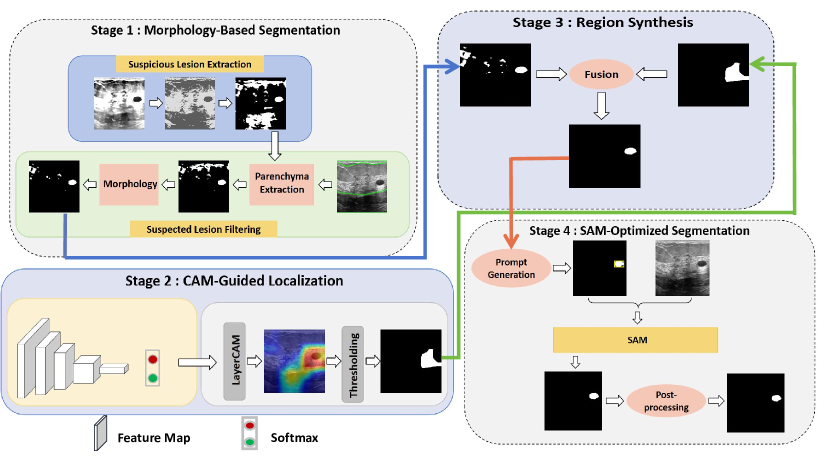
In this study, we proposed a weakly supervised lesion segmentation methods for breast ultrasound images, building upon the framework outlined in Liu et al. [56]. Our methodology, detailed in Figure 1, commences with an initial segmentation of medical images, utilizing morphological knowledge like lesion shape and edges. This is followed by lesion localization obtained from an image classification model and CAM. Subsequently, we flexibly integrate the outcomes of traditional morphological segmentation with those of lesion localization. The process concludes with the application of the SAM and various post-processing techniques to refine the segmentation results to remove the topological error.
3.1 Traditional segmentation based on morphological feature
Initially, our process begins with segmenting the medical image based on key characteristics of the lesions, such as shape, edges, and orientation. We employ the K-means algorithm to cluster the pre-processed image. Following this, we apply thresholding to isolate all suspected lesions. These suspected lesions are then meticulously filtered using morphological knowledge to ensure precision in the segmentation.
3.1.1 Suspicious lesion extraction
In breast ultrasound imaging, the images frequently exhibit low overall brightness, with grayscale values primarily confined to a lower range. To counteract this, we implement an automatic color enhancement (ACE) technique, as described by Getreuer [57]. This ACE algorithm enhances image contrast by assessing the brightness and interrelationships between a target pixel and its adjacent pixels. Within this context, let represent a specific color channel of an RGB breast ultrasound (BUS) image, defined over the domain . The intensities in this channel are normalized within the range . The ACE process is applied independently to each of the three color channels, facilitating chromatic aberration correction in the BUS image as shown in Equation 1.
| (1) |
where represents , represents the Euclidean distance between and . The slope function, , plays a pivotal role in adapting to local image contrasts. It is designed to enhance minor variations and enrich significant ones, effectively compressing or expanding the dynamic range based on local image content. In the subsequent stage, we compute the enhancement channel by normalizing to the range as shown in Equation 2. This normalization is crucial for maintaining consistency in contrast enhancement across the image.
| (2) |
Following ACE, we employ the K-means clustering algorithm, an iterative method that groups the image data into distinct clusters based on a distance formula. The objective function , as depicted in Equation 3, is minimized to achieve optimal clustering. Here, signifies the number of clusters, the number of points in each cluster, and the centroid of each cluster. The term quantifies the distance between a data point and the centroid of its cluster.
| (3) |
After clustering, we perform global threshold segmentation, dividing the image into target and background regions using global information. This step is essential in completing the extraction of all suspected lesions, setting the stage for subsequent detailed analysis and segmentation.
3.1.2 Suspected lesion filtering
Our filtering approach for suspected lesions in breast ultrasound (BUS) images involves a layered anatomical model, as advised by experienced radiologists. We classify BUS image structures into three layers: subcutaneous fat, breast parenchyma, and chest wall muscle. Early-stage breast cancer lesions, typically benign, are almost exclusively located in the parenchymal layer. A radiologist with extensive clinical experience annotates this layer, assigning a mask to each pixel, where denotes the subcutaneous fat layer, the breast parenchyma layer, and the chest wall muscle layer. This annotation facilitates the extraction of the breast parenchymal layer and the removal of suspected lesions from non-parenchymal areas.
For filtering suspected lesions within the parenchymal layer, we consider both the shape and aspect ratio of lesions, taking into account the textural characteristics of breast ultrasound images. Benign lesions like cystic nodules typically exhibit a hypoechoic, round or oval shape. We use morphological knowledge to filter out erroneously extracted tissues based on aspect ratio; benign lesions generally have a ratio between and , while ducts and lobules have a lower ratio. We calculate the minimum enclosing rectangle for each lesion from the binary image obtained by K-means clustering and thresholding, determining height and width. Non-target areas are then filtered out using this morphological knowledge. The criterion for screening non-lesion areas, based on their aspect ratio, is defined as follows in Equation 4:
| (4) |
Here, denotes the aspect ratio of the -th suspected lesion in the binary image.
3.2 CAM-Guided classification model for lesion localization
3.2.1 Semantic information extraction
To train a supervised learning segmentation model, the lesions in medical images require pixel-level annotation by professional medical experts. This process is time-consuming and costly, and the interpretation and annotation of medical images may be affected by the subjective judgment of experts. Different experts may give different annotations, which can lead to inconsistencies and uncertainty. Considering these existing problems, we use image-level labels to achieve semantic information extraction.
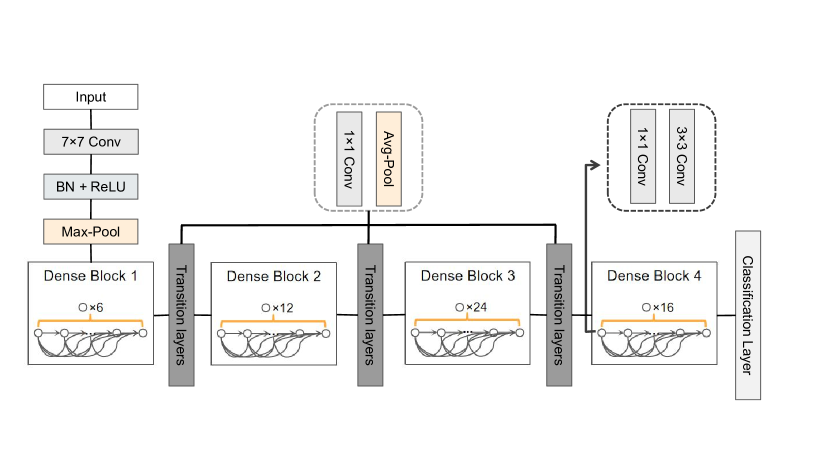
In our study, we employ DenseNet for classifying breast ultrasound (BUS) images due to its ability to effectively utilize features from shallow layers with low complexity, aiding in achieving a smooth decision function with enhanced generalization performance. Specifically, we utilize the DenseNet-121 variant, which comprises 121 layers, as depicted in Figure 2. The network’s architecture begins with an initial convolutional layer designed for three input channels. This layer uses a convolution kernel with a stride of 2 for extracting preliminary features. Subsequent processes include batch normalization and the application of ReLU activation functions. Spatial resolution is then reduced through a maximum pooling operation. The neural network consists of four dense blocks and three transition layers. The dense blocks contain 6, 12, 24, and 16 convolutional blocks, respectively. Each block features tightly connected convolutional layers, incorporating both and convolutions. These layers process outputs from preceding layers, continuously integrating new features. Transition layers, positioned between the dense blocks, comprise a convolution followed by a average pooling layer to decrease the spatial dimension of the output. The culmination of dense blocks and transition layers leads to a batch normalization layer that normalizes the final feature set. This is followed by mapping these features to the number of output categories in the classification output layer. In this network, the initial convolutional layer extracts fundamental features like edges and textures. The subsequent convolutional layers within the dense blocks build upon these features, enhancing semantic information layer by layer. The dense connectivity ensures efficient feature reuse and information transmission, while the transition layers help maintain semantic information as they reduce the feature map size. Ultimately, global average pooling aggregates the feature maps into a comprehensive representation, capturing the overarching semantic information of the image.
Let presents the BUS dataset, where represents the -th image and is its corresponding image-level label, indicating the presence (or absence) of a lesion in image . The data with lesions is represented as , and the data without lesions is represented as . The training process involves minimizing the binary cross entropy (BCE) loss, which is mathematically formulated as:
| (5) |
where is the number of samples, represents the classification network and is the sigmoid function.
3.2.2 Lesion localization
In our study’s weakly supervised breast lesion localization phase, we employed an optimized Class Activation Mapping (CAM) method known as LayerCAM [39] to generate a heatmap for benign lesion images. LayerCAM is integrated following the final convolutional layer of DenseNet, highlighting key features relevant to classification. This approach provides a rudimentary lesion area approximation without the need for pixel-level labeling. The calculation of the prediction score for a target category () is described by Equation 6, where is the score, represents the classifier function with parameters , and is the input image. Let denote the output feature map from the final convolutional layer, with being the -th feature map within . Each activation in at spatial position is represented by .
| (6) |
To compute the gradient of the target category’s prediction score with respect to a specific spatial location in , we use Equation 7:
| (7) |
LayerCAM uniquely assigns weights to each spatial location in the feature map based on their importance. These weights are determined by the gradients, using positive gradients as weights and assigning zero to negative gradients (Equation 8):
| (8) |
The weighted activation for each position in the feature map is calculated using Equation 9:
| (9) |
Finally, to obtain the class activation map, the adjusted activations are linearly combined across the channel dimension and passed through a ReLU function (Equation 10):
| (10) |
LayerCAM effectively utilizes deep learning to correlate key image features with potential disease areas, yielding valuable semantic information about lesions. Additionally, it can transform the class activation map into a binary image using a specific threshold. This thresholding process facilitates the initial identification of lesion location and size without requiring any extra annotations.
3.3 Feature fusion and region synthesis
The morphology based algorithm is effective in contour extraction but faces challenges in medical image segmentation due to low contrast between lesions and surrounding tissues, complex lesion shapes and boundaries, and sensitivity to image noise. This sensitivity can lead to incorrect clustering and erroneous segmentation. Conversely, deep classification networks, through LayerCAM, can identify salient object regions but often suffer from imprecise activations. To address these limitations, we propose a fusion of traditional segmentation and deep learning methods, leveraging the strengths of both to construct a more accurate and complete lesion region, thereby enhancing segmentation accuracy.
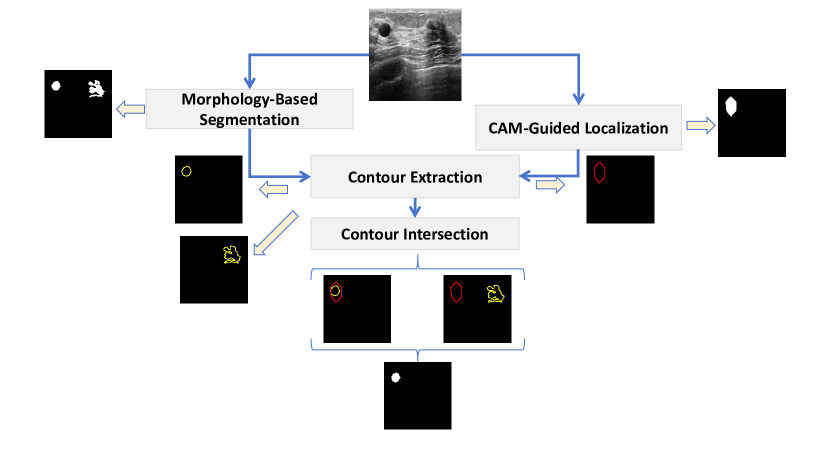
Let represents the set of suspected lesions extracted via traditional morphology-based segmentation, and denote the set identified through CAM-guided lesion localization module. We extract the outline of each lesion in the and fuse them with lesions in the to identify the one with the maximum intersection area. This lesion is then selected as the final synthetic result for next step. If there’s no intersection between and , we consider as our segmentation outcome. This operation is mathematically expressed in Equation 11:
| (11) |
where is the lesion with the largest overlap between and . Figure 3 illustrates this fusion process. In this way, a collection of lesion regions that encompass both morphological and semantic information.
3.4 SAM-Optimized lesion segmentation
In this section, we detail the utilization of the SAM to enhance segmentation results obtained from synthesis regions. The initial segmentation, while incorporating morphological and CAM based semantic information, often lack precise lesion boundaries and areas. SAM, with its capability for high-precision segmentation, is proposed as a potent tool to refine the segmentation result. SAM’s architecture comprises three key components: an image encoder, a prompt encoder, and a mask decoder. The image encoder uses a scalable Vision Transformer (ViT) pre-trained by MAE, adept at processing high-resolution inputs. Its primary function is to transform the target image into a feature space representation. For BUS image segmentation, we have devised two strategies to generate box and point prompts to intergrate with SAM. These prompts are then fed into the encoder. The mask decoder plays a crucial role in integrating the embeddings produced by both the image and prompt encoders. It decodes the final segmentation mask from the combined feature map of these embeddings. This process effectively aligns the image embedding, prompt embedding, and output token to generate a detailed and accurate mask, thereby enhancing the overall quality and precision of the segmentation.
In our research, the BUS images often contain complex biological structures and are susceptible to various noise sources. Direct application of the SAM proved insufficient for medical image segmentation due to these complexities. However, we discovered that using intermediate results as seed signals in SAM significantly improves its efficacy. We used the original BUS image as input to SAM and experimented with two ways to interactive with SAM: box prompt and point prompt. In box prompt segmentation, for each breast ultrasound (BUS) image, we generate the smallest enclosing rectangle from the fused pseudo-label information. This rectangular data is then fed as a seed region signal into SAM’s prompt encoder, where it is transformed into embedding vectors. A mask decoder, leveraging these embeddings, segments the lesion mask from the BUS image. The second method, point prompt segmentation, involves generating random points on the fused pseudo-labels. The coordinates of these points are input into SAM’s prompt encoder, leading to enhanced pseudo-labels post-SAM segmentation. Moreover, we observed that the lesion areas segmented by SAM often contain holes. To rectify this, we apply a morphological reconstruction post-processing operation to refine the topological error. This method involves iterative expansion and erosion operations to identify and fill these gaps, resulting in more accurate lesion segmentation outcomes.
4 Experiments and results
4.1 Implementation details
Our implementation utilizes the PyTorch framework [58] and is trained on a single NVIDIA GeForce RTX 3090 (24GB). The morphology-based segmentation module employs K-means clustering with for lesion extraction, using a binarization threshold of 90. The classification model we used is DenseNet121 [59], pre-trained on ImageNet [60]. We utilize Stochastic Gradient Descent (SGD) as the optimizer, with a weight decay of 0.0004 and momentum of 0.9. The learning rate starts at , and the model is trained over 100 epochs with a minimum batch size of 16. We employ several evaluation metrics: Dice score, the 95th percentile of Hausdorff Distance (HD95), and Intersection over Union (IoU). For each of these metrics, we calculate and report both the mean and the 95% confidence interval. The confidence intervals are determined using bootstrap analysis, involving 5000 resampling iterations to ensure statistical robustness and accuracy in our results.
Our ablation experiments, detailed in Section 4.3, were meticulously designed to assess the performance of each module. We summarize the experimental setup and final setting as follows. We employ LayerCAM to determine the approximate location of the lesion and establish a binarization threshold at 200. In the final experiments, we incorporate the ViT-H model version of SAM.
4.2 Dataset
The Breast Ultrasound Image (BUSI) dataset [61] is a classification and segmentation resource comprising ultrasound images from 600 female patients aged 25 to 75, collected in 2018. It contains 780 PNG images, categorized into normal, benign, and malignant classes, with 133 normal, 437 benign, and 210 malignant images.
Our research is centered on understanding the early mechanisms in breast health and disease, primarily aimed at early detection and prevention of breast cancer. The segmentation of benign and normal images is crucial in identifying potential early abnormalities, thereby enhancing both prevention and early diagnosis for patients. Due to incomplete lesion labeling in the dataset, such as instances of multiple lesions with only one marked, we undertook a secondary selection process. This refined the dataset to 123 normal and 365 benign cases. To counter the imbalanced data distribution, we augmented the normal images using techniques like flipping and rotation. The dataset was then randomly divided into a training set with 390 images (around 80%) and a testing set with 98 images (around 20%). All experimental images were resized to dimensions for consistency in analysis.
4.3 Experimental results
4.3.1 CAM based lesion location
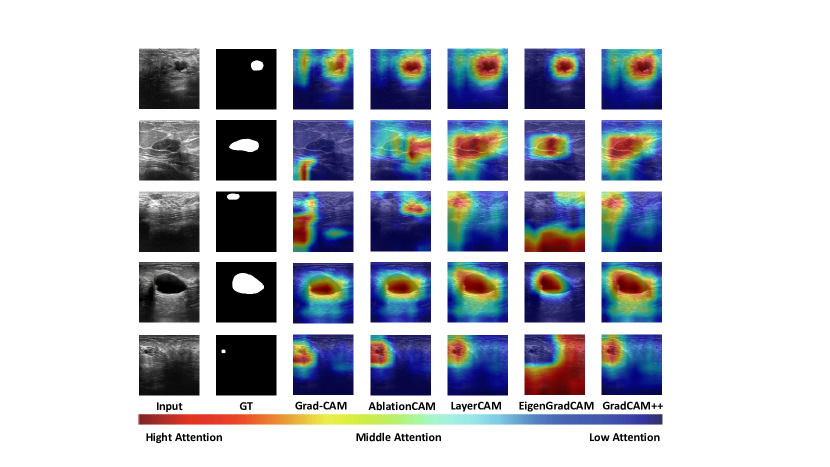
To refine lesion localization and segmentation, we evaluated five class activation mapping (CAM) methods: Grad-CAM [62], AblationCAM [63], LayerCAM [39], EigenGradCAM [64], and Grad-CAM++ [65]. The grayscale maps obtained from the CAM are transformed into binary segmentation maps using customized thresholds. We conducted comparisons across five CAM related methods at thresholds from 180 to 210. However, due to Grad-CAM’s inability to segment lesions at a threshold of 210, we limited the comparison at this threshold to the other four methods. The experiments of threshold selection is detailed in Table 1, with the best outcomes highlighted in bold. LayerCAM’s superiority lies in its ability to assign distinct weights to each spatial location, thereby acknowledging the varying significance of the class of interest. This feature enables LayerCAM to eliminate background noise and retain reliable object localization information. The visualization of the results from various CAM models is presented in Figure 4. Informed by these results, we have chosen LayerCAM, set at a threshold value of 200, as the module for advancing to the subsequent experiment.
| Threshold | Methods | Dice() | HD95 | IoU() |
|---|---|---|---|---|
| 180 | Grad-CAM | 35.60 [30.58,40.58] | 50.65 [42.78,59.96] | 23.86 [20.10,27.71] |
| AblationCAM | 36.69 [31.61,41.70] | 49.37 [41.88,58.37] | 24.89 [20.95,28.92] | |
| LayerCAM | 36.32 [31.15,41.78] | 56.78 [48.01,66.74] | 24.89 [20.67,29.39] | |
| EigenGradCAM | 36.91 [31.16,42.71] | 62.86 [48.88,78.41] | 25.73 [21.33,30.31] | |
| Grad-CAM++ | 35.70 [30.69,40.98] | 54.13 [46.50,62.49] | 24.24 [20.19,28.60] | |
| 190 | Grad-CAM | 35.98 [31.09,40.73] | 49.20 [41.37,58.41] | 23.99 [20.33,27.70] |
| AblationCAM | 37.39 [32.46,42.28] | 47.67 [40.33,56.32] | 25.27 [21.50,29.14] | |
| LayerCAM | 37.86 [32.72,43.17] | 52.43 [44.01,61.88] | 25.93 [21.79,30.27] | |
| EigenGradCAM | 37.81 [32.00,43.56] | 61.87 [47.77,77.32] | 26.41 [22.00,30.98] | |
| Grad-CAM++ | 37.24 [32.20,42.46] | 50.77 [43.24,59.22] | 25.35 [21.32,29.59] | |
| 200 | Grad-CAM | 35.78 [30.93,40.53] | 47.05 [39.20,56.19] | 23.81 [20.21,27.45] |
| AblationCAM | 37.72 [32.85,42.57] | 46.32 [38.87,54.92] | 25.41 [21.72,29.22] | |
| LayerCAM | 40.40 [35.28,45.57] | 45.60 [38.17,53.88] | 27.78 [23.66,32.01] | |
| EigenGradCAM | 38.35 [32.48,44.22] | 61.18 [46.94,76.70] | 26.86 [22.33,31.48] | |
| Grad-CAM++ | 38.78 [33.69,43.82] | 47.36 [39.97,55.59] | 26.46 [22.48,30.56] | |
| 210 | AblationCAM | 36.86 [31.85,41.70] | 45.15 [37.52,53.91] | 24.75 [20.97,28.54] |
| LayerCAM | 40.34 [35.29,45.28] | 45.09 [37.50,53.77] | 27.61 [23.73,31.48] | |
| EigenGradCAM | 37.65 [31.86,43.53] | 60.78 [46.35,76.39] | 26.25 [21.74,30.81] | |
| Grad-CAM++ | 39.50 [34.44,44.53] | 46.16 [38.25,55.19] | 26.99 [23.05,31.01] |
4.3.2 Ablation experiments
In our ablation study, we systematically evaluated the performance impact of various components and configurations within our proposed framework. This approach helps in understanding the contribution of each module to the overall segmentation task. We experiment with two prompting methods for SAM: the point prompt and the box prompt. In the point prompt approach, we randomly generate 10 points within the synthesized area described in Section 3.3 and input these into the SAM model. For the box prompt method, we construct the smallest enclosing rectangle around the synthesized lesion as the box prompt. And then subsequently fed into SAM for segmentation.
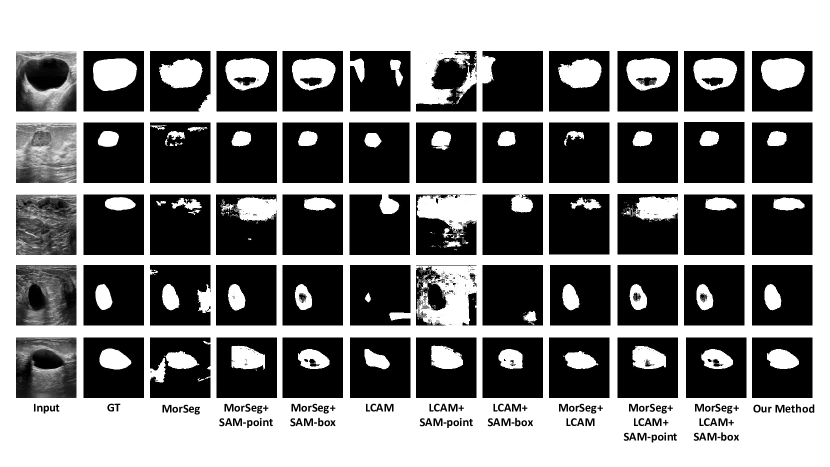
The results of the ablation experiments are shown in Table 2, with bold indicating the best results. Each configuration was meticulously assessed to determine its contribution to the effectiveness of the segmentation task. This structured approach not only underscores the individual significance of the modules but also illustrates their combined impact in our comprehensive framework.
The results presented in the table indicate that using a box prompt as input for SAM yields better performance compared to a point-based prompt. Furthermore, the most effective segmentation results for this task are attained by integrating all these modules. The visualization of the ablation experiment’s results is presented in Figure 5. It is evident from these visualizations that each of our proposed modules contributes to enhancing the performance of lesion segmentation. A notable observation from Figure 5 is the tendency of SAM-segmented results to exhibit holes in certain areas. This issue may stem from the manner in which prompts are provided to the model, underscoring the necessity for final post-processing steps to address these gaps. The performance of our model shown in Table 4 is after post-processing to fill the holes inside the segment area.
| Modules | Dice(%) | HD95 | IoU(%) | |||
|---|---|---|---|---|---|---|
| MorSeg | LCAM | SAM-p | SAM-b | |||
| ✓ | 45.15 [39.23,51.02] | 104.70 [93.72,115.36] | 32.95 [27.91,38.28] | |||
| ✓ | ✓ | 45.66 [36.65,55.05] | 82.98 [67.38,98.48] | 39.29 [30.80,48.05] | ||
| ✓ | ✓ | 45.49 [35.74,55.24] | 64.45 [51.17,78.14] | 40.25 [31.27,49.27] | ||
| ✓ | 40.40 [35.28,45.57] | 45.60 [38.17,53.88] | 27.78 [23.66,32.01] | |||
| ✓ | ✓ | 22.21 [16.12,28.97] | 124.76 [112.39,136.40] | 16.55 [11.10,22.69] | ||
| ✓ | ✓ | 58.22 [50.54,65.80] | 35.74 [27.22,45.12] | 48.57 [41.19,55.91] | ||
| ✓ | ✓ | ✓ | 67.04 [60.31,73.20] | 29.33 [21.79,37.75] | 56.14 [49.77,62.21] | |
| ✓ | ✓ | ✓ | 70.45 [63.04,77.24] | 36.30 [25.58,48.14] | 61.73 [54.79,68.69] | |
| ✓ | ✓ | ✓ | 74.10 [66.84,80.68] | 25.63 [18.13,34.25] | 65.82 [58.71,72.27] | |
4.3.3 Comparison of different versions of SAMs
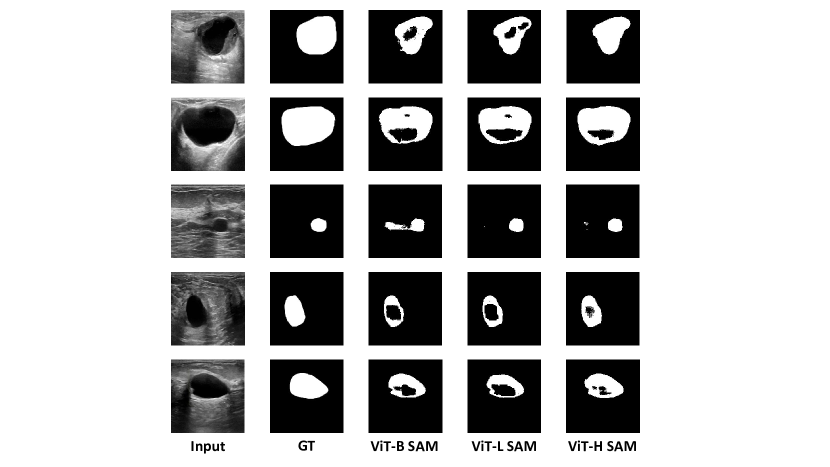
In our study, we evaluated three models from the SAM series, each with different parameter counts: ViT-B (91M parameters), ViT-L (308M), and ViT-H (636M). In this experiment, we utilize the box prompt for the SAM model, as the results presented in Table 2 indicate superior performance of the box prompt compared to the point prompt. Comparative experiments to evaluate their performance were conducted, with the results detailed in Table 3, where the best results are highlighted in bold. The performance of these results is also illustrated in Figure 6. The experimental findings suggest a trade-off between resource consumption and performance efficiency, indicating that the choice of model should align with the capabilities of the available experimental equipment. Based on these considerations, we selected ViT-H SAM for our final segmentation tasks. The observations from the Figure 6 highlight that holes are present in all versions of SAM predictions, underscoring the importance of post-processing when utilizing SAM for accurate results.
| Methods | Dice() | HD95 | IoU() | AVG Time(s) |
|---|---|---|---|---|
| ViT-B SAM | 71.04 [63.76,77.63] | 26.66 [19.03,35.36] | 62.10 [54.93,68.65] | 0.1470 |
| ViT-L SAM | 73.36 [66.24,79.84] | 24.70 [17.45,33.10] | 64.52 [57.76,70.75] | 0.2934 |
| ViT-H SAM | 74.10[66.84,80.68] | 25.63 [18.13,34.25] | 65.82 [58.71,72.27] | 0.4817 |
4.3.4 Compare with other deep learning models
In our study, we evaluated the effectiveness of our proposed framework by comparing it with three distinct methods: UNet [25], Deeplabv3+ [46], and AffinityNet [51]. UNet and Deeplabv3+ are fully supervised networks, whereas AffinityNet operates under a weakly supervised paradigm with only image-level labeling. For an equitable comparison, all networks were retrained on the BUSI dataset. Quantitative comparison results are presented in Table 4. The experimental results show that the two supervised learning methods exhibit nearly consistent performance in both Dice Score and IoU metrics. Relative to these, our model’s performance is marginally lower, with a Dice score approximately 4% less. However, the overlapping confidence intervals indicate that this difference is not statistically significant [66, 67]. In terms of the HD95, our model exceeds UNet by 2.61 and shows a reduction of 7.95 compared to Deeplabv3+, demonstrating its precision in identifying lesion boundaries. This suggests that our weak supervision strategy can potentially surpass supervised learning methods in performance.
Compared to the weakly supervised method, AffinityNet, our method demonstrates significant improvements across all evaluation metrics. The inferior performance of AffinityNet underscores both the complexity of this task and the advantage of our method’s comprehensive strategy for utilizing information, which includes both lesion contours and semantic details from breast images. These outcomes collectively underscore the effectiveness and precision of our proposed framework in medical image segmentation tasks.
| Models | Training | Dice() | HD95 | IoU() |
|---|---|---|---|---|
| UNet | SL | 78.31 [71.77,84.28] | 21.66[11.05,35.54] | 70.51[63.61,76.77] |
| Deeplabv3+ | 78.40[72.78,83.21] | 32.22[17.79,49.91] | 68.49[63.10,73.23] | |
| AffinityNet | WSL | 16.14[10.98,21.73] | 78.15[68.08,89.41] | 10.98[7.03,15.35] |
| Proposed model | 74.39[67.09,81.02] | 24.27[16.67,32.85] | 66.27[59.09,72.91] |
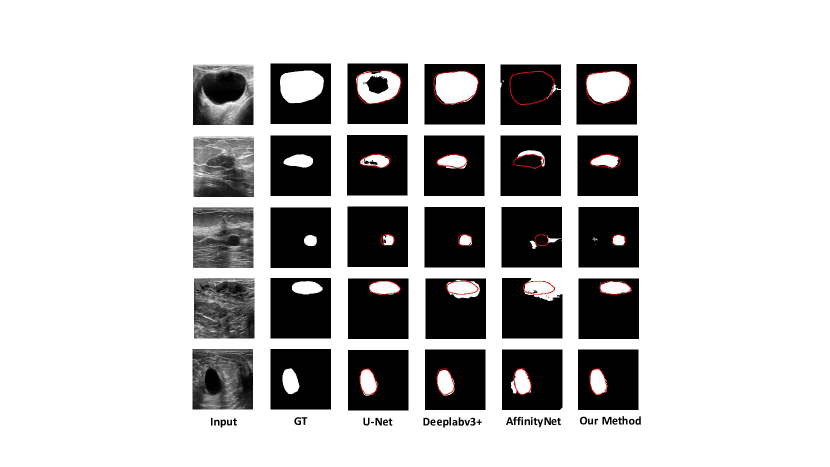
Figure 7 offers a visual comparison of segmentation results from our method against UNet, Deeplabv3+, and AffinityNet, using representative cases from the test set. This comparison distinctly highlights the sensitivity of our method to lesion contours. As observed in Figure 7, our proposed framework excels in segmenting contours and smaller lesions, outperforming both UNet and Deeplabv3+ in these aspects. The figure further reveals that the fully supervised methods, UNet and Deeplabv3+, tend to be influenced by background noise during segmentation, leading to the extraction of some non-lesion tissues. Our method effectively addresses this issue by removing incorrect segmentations through our refined process of filtering suspected lesions. In comparison with AffinityNet, which operates under a similar weakly supervised framework, our method demonstrates superior accuracy in producing segmentation masks. This indicates the effective extraction and utilization of semantic features from breast images in our approach. Overall, our proposed method achieves competitive results, particularly notable for its lower reliance on extensive annotation, compared to traditional fully supervised segmentation techniques.
5 Discussion
Our model comprises four distinct modules: morphological feature segmentation, CAM-guided localization, feature fusion, and final SAM-optimized segmentation. Optimal results necessitate coordinated functioning between these modules, which presented a challenge in our study. Nonetheless, our objective is to maximize the utilization of medical prior knowledge to minimize the reliance on detailed pixel-level annotation. The ablation experiment validates the essential role of each module and provides insights into their individual performances, such as using only morphology and CAM, or the efficiency of a lightweight SAM. This flexibility enables researchers to tailor module combinations to suit specific needs and contexts.
This study aims to develop an effective primary screening method for breast cancer identification, potentially reducing misdiagnosis and overtreatment, particularly in resource-constrained environments. Our focus was solely on normal and benign tumors in mammography for experimental data. Although the performance of our proposed method differs by only 4% in Dice score compared to supervised learning, the considerable overlap in the performance confidence intervals of both models suggests that the difference might not be statistically significant [66, 67]. The promising performance of our approach paves the way for incorporating a broader spectrum of data types and diseases in future research.
6 Conclusion
In this study, we introduce a novel, morphology-enhanced CAM-guided SAM framework for weakly supervised segmentation of breast lesions from ultrasound images. Our methodology, evaluated using the BUSI public dataset, effectively segments lesions with image-level labeling. The framework capitalizes on a priori knowledge of breast lesion morphology for contour extraction and incorporates semantic feature extraction and lesion localization using a CAM-based approach. We explored various class activation mapping techniques, ultimately integrating LayerCAM for highlighting lesion regions. Leveraging the strengths of both segmentation methods, we fuse the extracted information for more accurate and smoother segmentation. The SAM model serves as a powerful segmentation enhancement tool, refining these synthesis results. A final post-processing step is applied for further enhancement. Our approach demonstrates notable effectiveness, achieving a Dice Score of 74.39%, and a 95th percentile Hausdorff Distance (HD95) of 24.27. These results not only affirm the validity and superiority of our method but also show its competitive edge over fully supervised network like Deeplabv3+ in boundary segmentation accuracy, while significantly outperforming weakly supervised networks that rely solely on image-level labels. In the future research, we aim to expand this framework’s application to lesion segmentation in other medical imaging datasets, further advancing the field of medical image analysis.
7 Dataset and Code Availability
-
•
The dataset employed in our experiments is publicly accessible via: https://scholar.cu.edu.eg/?q=afahmy/pages/dataset
-
•
The SAM models used in our research are also publicly available at: https://github.com/facebookresearch/segment-anything.
-
•
Additionally, our complete code, encompassing both the model architecture and checkpoints, is available for download at: https://github.com/YueXin18/MorSeg-CAM-SAM.
8 Acknowledgments
This study is supported by a research project from the Beijing Postdoctoral Research Foundation (No. 2022zz075). Guanghui Fu is supported by a Chinese Government Scholarship provided by the China Scholarship Council (CSC).
References
- [1] Sun, Y.-S., Zhao, Z., Yang, Z.-N., Xu, F., Lu, H.-J., Zhu, Z.-Y., Shi, W., Jiang, J., Yao, P.-P., and Zhu, H.-P., “Risk factors and preventions of breast cancer,” International journal of biological sciences 13(11), 1387 (2017).
- [2] World health organization, “Breast cancer.” https://www.who.int/news-room/fact-sheets/detail/breast-cancer (2023).
- [3] Wilkinson, L. and Gathani, T., “Understanding breast cancer as a global health concern,” The British Journal of Radiology 95(1130), 20211033 (2022).
- [4] World health organization, “The global breast cancer initiative.” https://www.who.int/initiatives/global-breast-cancer-initiative/breast-cancer-inequities (2023).
- [5] Benson, J. R., Jatoi, I., Keisch, M., Esteva, F. J., Makris, A., and Jordan, V. C., “Early breast cancer,” The Lancet 373(9673), 1463–1479 (2009).
- [6] Islami, F., Goding Sauer, A., Miller, K. D., Siegel, R. L., Fedewa, S. A., Jacobs, E. J., McCullough, M. L., Patel, A. V., Ma, J., Soerjomataram, I., et al., “Proportion and number of cancer cases and deaths attributable to potentially modifiable risk factors in the united states,” CA: a cancer journal for clinicians 68(1), 31–54 (2018).
- [7] Jafari, S. H., Saadatpour, Z., Salmaninejad, A., Momeni, F., Mokhtari, M., Nahand, J. S., Rahmati, M., Mirzaei, H., and Kianmehr, M., “Breast cancer diagnosis: Imaging techniques and biochemical markers,” Journal of cellular physiology 233(7), 5200–5213 (2018).
- [8] Kuhl, C. K., Strobel, K., Bieling, H., Leutner, C., Schild, H. H., and Schrading, S., “Supplemental breast MR imaging screening of women with average risk of breast cancer,” Radiology 283(2), 361–370 (2017).
- [9] Iranmakani, S., Mortezazadeh, T., Sajadian, F., Ghaziani, M. F., Ghafari, A., Khezerloo, D., and Musa, A. E., “A review of various modalities in breast imaging: technical aspects and clinical outcomes,” Egyptian Journal of Radiology and Nuclear Medicine 51(1), 1–22 (2020).
- [10] Guo, R., Lu, G., Qin, B., and Fei, B., “Ultrasound imaging technologies for breast cancer detection and management: a review,” Ultrasound in medicine & biology 44(1), 37–70 (2018).
- [11] Dromain, C., Boyer, B., Ferre, R., Canale, S., Delaloge, S., and Balleyguier, C., “Computed-aided diagnosis (CAD) in the detection of breast cancer,” European journal of radiology 82(3), 417–423 (2013).
- [12] Zahoor, S., Lali, I. U., Khan, M. A., Javed, K., and Mehmood, W., “Breast cancer detection and classification using traditional computer vision techniques: a comprehensive review,” Current medical imaging 16(10), 1187–1200 (2020).
- [13] Liu, S., Wang, Y., Yang, X., Lei, B., Liu, L., Li, S. X., Ni, D., and Wang, T., “Deep learning in medical ultrasound analysis: a review,” Engineering 5(2), 261–275 (2019).
- [14] Van Sloun, R. J., Cohen, R., and Eldar, Y. C., “Deep learning in ultrasound imaging,” Proceedings of the IEEE 108(1), 11–29 (2019).
- [15] Kolahdoozi, M., Amirkhani, A., and Maroufi, M., “Fuzzy cognitive maps and a new region growing algorithm for classification of mammography images,” in [2017 24th National and 2nd International Iranian Conference on Biomedical Engineering (ICBME) ], 1–6, IEEE (2017).
- [16] Punitha, S., Amuthan, A., and Joseph, K. S., “Benign and malignant breast cancer segmentation using optimized region growing technique,” Future Computing and Informatics Journal 3(2), 348–358 (2018).
- [17] Shrivastava, A., Chaudhary, A., Kulshreshtha, D., Singh, V. P., and Srivastava, R., “Automated digital mammogram segmentation using dispersed region growing and sliding window algorithm,” in [2017 2nd international conference on image, vision and computing (ICIVC) ], 366–370, IEEE (2017).
- [18] El Idrissi El Kaitouni, S., Abbad, A., and Tairi, H., “A breast tumors segmentation and elimination of pectoral muscle based on hidden Markov and region growing,” Multimedia Tools and Applications 77(23), 31347–31362 (2018).
- [19] Singh, N. and Veenadhari, S., “Breast cancer segmentation using global thresholding and region merging,” International Journal of Computer Sciences and Engineering 6(12), 292–297 (2018).
- [20] Zebari, D. A., Zeebaree, D. Q., Abdulazeez, A. M., Haron, H., and Hamed, H. N. A., “Improved threshold based and trainable fully automated segmentation for breast cancer boundary and pectoral muscle in mammogram images,” Ieee Access 8, 203097–203116 (2020).
- [21] Yang, X., Wang, R., Zhao, D., Yu, F., Heidari, A. A., Xu, Z., Chen, H., Algarni, A. D., Elmannai, H., and Xu, S., “Multi-level threshold segmentation framework for breast cancer images using enhanced differential evolution,” Biomedical Signal Processing and Control 80, 104373 (2023).
- [22] Suradi, S. H., Abdullah, K. A., and Isa, N. A. M., “Breast lesions detection using fadhecal and multilevel Otsu thresholding segmentation in digital mammograms,” in [International Conference on Medical and Biological Engineering ], 751–759, Springer (2021).
- [23] Muhammad, M., Zeebaree, D., Brifcani, A. M. A., Saeed, J., and Zebari, D. A., “Region of interest segmentation based on clustering techniques for breast cancer ultrasound images: A review,” Journal of Applied Science and Technology Trends 1(3), 78–91 (2020).
- [24] Huang, Q., Luo, Y., and Zhang, Q., “Breast ultrasound image segmentation: a survey,” International journal of computer assisted radiology and surgery 12, 493–507 (2017).
- [25] Ronneberger, O., Fischer, P., and Brox, T., “U-net: Convolutional networks for biomedical image segmentation,” in [Medical Image Computing and Computer-Assisted Intervention–MICCAI 2015: 18th International Conference, Munich, Germany, October 5-9, 2015, Proceedings, Part III 18 ], 234–241, Springer (2015).
- [26] Vidal, J., Vilanova, J. C., Martí, R., et al., “A U-Net ensemble for breast lesion segmentation in DCE MRI,” Computers in Biology and Medicine 140, 105093 (2022).
- [27] Byra, M., Jarosik, P., Szubert, A., Galperin, M., Ojeda-Fournier, H., Olson, L., O’Boyle, M., Comstock, C., and Andre, M., “Breast mass segmentation in ultrasound with selective kernel U-Net convolutional neural network,” Biomedical Signal Processing and Control 61, 102027 (2020).
- [28] Chen, G., Li, L., Dai, Y., Zhang, J., and Yap, M. H., “AAU-net: an adaptive attention U-net for breast lesions segmentation in ultrasound images,” IEEE Transactions on Medical Imaging 42 (2022).
- [29] Ning, Z., Zhong, S., Feng, Q., Chen, W., and Zhang, Y., “SMU-net: Saliency-guided morphology-aware U-Net for breast lesion segmentation in ultrasound image,” IEEE transactions on medical imaging 41(2), 476–490 (2021).
- [30] Sun, H., Li, C., Liu, B., Liu, Z., Wang, M., Zheng, H., Feng, D. D., and Wang, S., “AUNet: attention-guided dense-upsampling networks for breast mass segmentation in whole mammograms,” Physics in Medicine & Biology 65(5), 055005 (2020).
- [31] Zhou, Z.-H., “A brief introduction to weakly supervised learning,” National science review 5(1), 44–53 (2018).
- [32] Tajbakhsh, N., Jeyaseelan, L., Li, Q., Chiang, J. N., Wu, Z., and Ding, X., “Embracing imperfect datasets: A review of deep learning solutions for medical image segmentation,” Medical Image Analysis 63, 101693 (2020).
- [33] Zhou, B., Khosla, A., Lapedriza, A., Oliva, A., and Torralba, A., “Learning deep features for discriminative localization,” in [Proceedings of the IEEE conference on computer vision and pattern recognition ], 2921–2929 (2016).
- [34] Li, Y., Liu, Y., Huang, L., Wang, Z., and Luo, J., “Deep weakly-supervised breast tumor segmentation in ultrasound images with explicit anatomical constraints,” Medical image analysis 76, 102315 (2022).
- [35] Altini, N., Brunetti, A., Puro, E., Taccogna, M. G., Saponaro, C., Zito, F. A., De Summa, S., and Bevilacqua, V., “NDG-CAM: nuclei detection in histopathology images with semantic segmentation networks and grad-CAM,” Bioengineering 9(9), 475 (2022).
- [36] Groen, A. M., Kraan, R., Amirkhan, S. F., Daams, J. G., and Maas, M., “A systematic review on the use of explainability in deep learning systems for computer aided diagnosis in radiology: Limited use of explainable AI?,” European Journal of Radiology , 110592 (2022).
- [37] Fu, G., Li, J., Wang, R., Ma, Y., and Chen, Y., “Attention-based full slice brain CT image diagnosis with explanations,” Neurocomputing 452, 263–274 (2021).
- [38] Wang, R., Fu, G., Li, J., and Pei, Y., “Diagnosis after zooming in: A multilabel classification model by imitating doctor reading habits to diagnose brain diseases,” Medical physics 49(11), 7054–7070 (2022).
- [39] Jiang, P.-T., Zhang, C.-B., Hou, Q., Cheng, M.-M., and Wei, Y., “LayerCAM: Exploring hierarchical class activation maps for localization,” IEEE Transactions on Image Processing 30, 5875–5888 (2021).
- [40] Bae, W., Noh, J., and Kim, G., “Rethinking class activation mapping for weakly supervised object localization,” in [Computer Vision–ECCV 2020: 16th European Conference, Glasgow, UK, August 23–28, 2020, Proceedings, Part XV 16 ], 618–634, Springer (2020).
- [41] Sun, K., Shi, H., Zhang, Z., and Huang, Y., “ECS-net: Improving weakly supervised semantic segmentation by using connections between class activation maps,” in [Proceedings of the IEEE/CVF international conference on computer vision ], 7283–7292 (2021).
- [42] Kirillov, A., Mintun, E., Ravi, N., Mao, H., Rolland, C., Gustafson, L., Xiao, T., Whitehead, S., Berg, A. C., Lo, W.-Y., et al., “Segment anything,” arXiv preprint arXiv:2304.02643 (2023).
- [43] Chen, T., Mai, Z., Li, R., and Chao, W.-l., “Segment anything model (SAM) enhanced pseudo labels for weakly supervised semantic segmentation,” arXiv preprint arXiv:2305.05803 (2023).
- [44] Mazurowski, M. A., Dong, H., Gu, H., Yang, J., Konz, N., and Zhang, Y., “Segment anything model for medical image analysis: an experimental study,” Medical Image Analysis 89, 102918 (2023).
- [45] Shi, P., Qiu, J., Abaxi, S. M. D., Wei, H., Lo, F. P.-W., and Yuan, W., “Generalist vision foundation models for medical imaging: A case study of segment anything model on zero-shot medical segmentation,” Diagnostics 13(11), 1947 (2023).
- [46] Chen, L.-C., Zhu, Y., Papandreou, G., Schroff, F., and Adam, H., “Encoder-decoder with atrous separable convolution for semantic image segmentation,” in [Proceedings of the European conference on computer vision (ECCV) ], 801–818 (2018).
- [47] Roth, H. R., Yang, D., Xu, Z., Wang, X., and Xu, D., “Going to extremes: weakly supervised medical image segmentation,” Machine Learning and Knowledge Extraction 3(2), 507–524 (2021).
- [48] Pinheiro, P. O. and Collobert, R., “From image-level to pixel-level labeling with convolutional networks,” in [Proceedings of the IEEE conference on computer vision and pattern recognition ], 1713–1721 (2015).
- [49] Chen, Z., Tian, Z., Zhu, J., Li, C., and Du, S., “C-CAM: Causal CAM for weakly supervised semantic segmentation on medical image,” in [Proceedings of the IEEE/CVF Conference on Computer Vision and Pattern Recognition ], 11676–11685 (2022).
- [50] Zhong, Y., Wang, J., Wang, L., Peng, J., Wang, Y.-X., and Zhang, L., “DAP: Detection-aware pre-training with weak supervision,” in [Proceedings of the IEEE/CVF conference on computer vision and pattern recognition ], 4537–4546 (2021).
- [51] Ahn, J. and Kwak, S., “Learning pixel-level semantic affinity with image-level supervision for weakly supervised semantic segmentation,” in [Proceedings of the IEEE conference on computer vision and pattern recognition ], 4981–4990 (2018).
- [52] Ma, J. and Wang, B., “Segment anything in medical images,” arXiv preprint arXiv:2304.12306 (2023).
- [53] Wu, J., Fu, R., Fang, H., Liu, Y., Wang, Z., Xu, Y., Jin, Y., and Arbel, T., “Medical SAM adapter: Adapting segment anything model for medical image segmentation,” arXiv preprint arXiv:2304.12620 (2023).
- [54] Chen, K., Liu, C., Chen, H., Zhang, H., Li, W., Zou, Z., and Shi, Z., “Rsprompter: Learning to prompt for remote sensing instance segmentation based on visual foundation model,” arXiv preprint arXiv:2306.16269 (2023).
- [55] Deng, G., Zou, K., Ren, K., Wang, M., Yuan, X., Ying, S., and Fu, H., “SAM-U: Multi-box prompts triggered uncertainty estimation for reliable SAM in medical image,” arXiv preprint arXiv:2307.04973 (2023).
- [56] Liu, X., Li, J., Zhao, L., Zhu, C., Ma, T., Xu, X., and Zhao, Q., “Anatomy-guided weakly supervised breast lesion segmentation fusing contour and semantic information,” in [Proceedings of IEEE International Conference on Systems, Man, and Cybernetics ], 7283–7292 (2023).
- [57] Getreuer, P., “Automatic color enhancement (ACE) and its fast implementation,” Image Processing On Line 2, 266–277 (2012).
- [58] Paszke, A., Gross, S., Massa, F., Lerer, A., Bradbury, J., Chanan, G., Killeen, T., Lin, Z., Gimelshein, N., Antiga, L., et al., “PyTorch: An imperative style, high-performance deep learning library,” Advances in neural information processing systems 32 (2019).
- [59] Huang, G., Liu, Z., Van Der Maaten, L., and Weinberger, K. Q., “Densely connected convolutional networks,” in [Proceedings of the IEEE conference on computer vision and pattern recognition ], 4700–4708 (2017).
- [60] Deng, J., Dong, W., Socher, R., Li, L.-J., Li, K., and Fei-Fei, L., “Imagenet: A large-scale hierarchical image database,” in [2009 IEEE conference on computer vision and pattern recognition ], 248–255, Ieee (2009).
- [61] Al-Dhabyani, W., Gomaa, M., Khaled, H., and Fahmy, A., “Dataset of breast ultrasound images,” Data in brief 28, 104863 (2020).
- [62] Selvaraju, R. R., Cogswell, M., Das, A., Vedantam, R., Parikh, D., and Batra, D., “Grad-CAM: Visual explanations from deep networks via gradient-based localization,” in [Proceedings of the IEEE international conference on computer vision ], 618–626 (2017).
- [63] Ramaswamy, H. G. et al., “Ablation-CAM: Visual explanations for deep convolutional network via gradient-free localization,” in [proceedings of the IEEE/CVF winter conference on applications of computer vision ], 983–991 (2020).
- [64] Muhammad, M. B. and Yeasin, M., “Eigen-CAM: Class activation map using principal components,” in [2020 international joint conference on neural networks (IJCNN) ], 1–7, IEEE (2020).
- [65] Chattopadhay, A., Sarkar, A., Howlader, P., and Balasubramanian, V. N., “Grad-CAM++: Generalized gradient-based visual explanations for deep convolutional networks,” in [2018 IEEE winter conference on applications of computer vision (WACV) ], 839–847, IEEE (2018).
- [66] Jurdi, R. E., Varoquax, G., and Colliot, O., “Confidence intervals for performance estimates in 3d medical image segmentation,” arXiv preprint arXiv:2307.10926 (2023).
- [67] El Jurdi, R. and Colliot, O., “How precise are performance estimates for typical medical image segmentation tasks?,” in [2023 IEEE 20th International Symposium on Biomedical Imaging (ISBI) ], 1–5, IEEE (2023).