MMC: Advancing Multimodal Chart Understanding with Large-scale Instruction Tuning
Abstract
With the rapid development of large language models (LLMs) and their integration into large multimodal models (LMMs), there has been impressive progress in zero-shot completion of user-oriented vision-language tasks. However, a gap remains in the domain of chart image understanding due to the distinct abstract components in charts. To address this, we introduce a large-scale MultiModal Chart Instruction (MMC-Instruction) dataset comprising 600k instances supporting diverse tasks and chart types. Leveraging this data, we develop MultiModal Chart Assistant (MMCA), an LMM that achieves state-of-the-art performance on existing chart QA benchmarks. Recognizing the need for a comprehensive evaluation of LMM chart understanding, we also propose a MultiModal Chart Benchmark (MMC-Benchmark), a comprehensive human-annotated benchmark with 9 distinct tasks evaluating reasoning capabilities over charts. Extensive experiments on MMC-Benchmark reveal the limitations of existing LMMs on correctly interpreting charts, even for the most recent GPT-4V model. Our work provides an instruction-tuning methodology and benchmark to advance multimodal understanding of charts.
1 Introduction
Large Language models (LLMs) such as GPT-3, PaLM, ChatGPT, Bard, and LLaMA Brown et al. (2020); Chowdhery et al. (2022); OpenAI (2022); Manyika (2023); Touvron et al. (2023) have undergone rapid development, demonstrating significant capabilities in performing a wide range of tasks effectively. To enable LLMs with vision ability, open-source large multimodal models (LMMs) such as MiniGPT-4 Zhu et al. (2023), LLaVA Liu et al. (2023d), mPLUG-Owl Ye et al. (2023), Multimodal-GPT Gong et al. (2023), and LRV Liu et al. (2023b) have been developed, incorporating advanced image understanding capabilities into LLMs to interpret and analyze visual inputs. While successful in the general domains, such open-source LMMs are less effective for chart images because chart image understanding is tremendously different from natural scene image understanding. Contrasting with natural scene images, which primarily contain objects and reflect their spatial relationships, chart images contain unique abstract elements (such as flow diagrams, trend lines, color-coded legends, etc.) that convey specific data-related information.
Current open-source LMMs are limited in their ability to accurately interpret complex chart contents, as they often lack domain-specific training essential for tasks such as differentiating between various types of graphs, interpreting axis labels and data points, and extracting meaningful patterns and trends. integrating advanced chart understanding capabilities could further refine the LMMs’ ability to analyze contextually and reason about the information presented in charts, thereby broadening their applicability in fields like data analytics, academic research, and business intelligence.
| Datasets | Figure Num | Question | Answer Type | Plot Type | Task Num | Benchmark |
| FigureQA | 180k | Template | Fixed Vocab | 4 | 1 | ✘ |
| DVQA | 300k | Template | Fixed Vocab | 1 | 1 | ✘ |
| PlotQA | 224k | Template | Fixed | 1 | 1 | ✘ |
| ChartQA | 21.9k | Free-form | Open Vocab | Unbounded | 2 | Human Check |
| SciGraphQA | 295k | Free-form | Open Ended | Unbounded | 2 | ✘ |
| MMC-Instruction (Ours) | 600k | Free-form | Open Ended | Unbounded | 9 | Human Check |
In this paper, we introduce MultiModal Chart Instruction (MMC-Instruction), a 600k chart understanding dataset consisting of both chart-text alignment data and chart instruction-tuning data. MMC-Instruction is not only much larger but also more diverse compared to existing public datasets Kahou et al. (2017); Masry et al. (2022); Methani et al. (2020); Kafle et al. (2018). Unlike previous work with templated-based questions, MMC-Instruction is constructed by prompting GPT-4 to generate instructions with diverse language styles and tasks (Table 1). Furthermore, our MMC-Instruction considers a variety of chart types, including but not limited to histograms, scatter plots, area charts, and more complex graphical representations. By performing unified instruction tuning upon current LMMs with MMC-Instruction, we further propose a modularized LMM, namely Multimodal Chart Assistant (MMCA), jointly finetuned on a wide range of visually situated language understanding tasks. MMCA achieves state-of-the-art performance on current chart question-answer benchmarks compared with existing open-source LMMs.
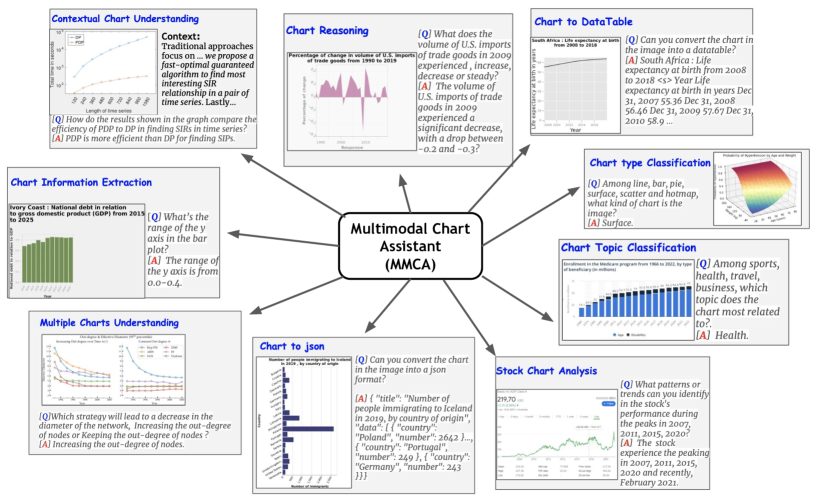
To accurately assess the capabilities of current Large Multimodal Models (LMMs) for chart understanding, we introduce a novel comprehensive evaluation tool: the MultiModal Chart Benchmark (MMC-Benchmark). First, MMC-Benchmark is the first human-annotated benchmark in line with human cognition to evaluate LMM’s ability to comprehend visual charts. Second, it contains a wide range of tasks, including chart information extraction, chart reasoning, contextual chart understanding, chart topic classification, stock chart analysis, multiple chart understanding, chart type classification, chart-to-datatable and chart-to-json. Third, MMC-Benchmark offers two quantitative evaluation methods, including free-format Generation Ability Evaluation using ChatGPT and multiple-choice QA format Chart Understanding Ability Evaluation without the requirement of ChatGPT. Our evaluation highlights the limitations of existing open-source LMMs. In addition, we further broaden our analysis through experiments with GPT-4V (OpenAI, 2023b; Yang et al., 2023b; Liu et al., 2023a), the latest multimodal version of GPT-4 OpenAI (2023a). Our experiments indicate that MMC-Benchmark also poses significant challenges to GPT-4V, especially in Chart to Datatable and Chart to Json tasks. It indicates the importance of MMC-Instruction corpus and MMC-Benchmark in advancing multimodal understanding.
Our main contributions are as follows:
-
•
MMC-Instruction dataset. We present a novel large-scale instruction-tuning dataset for chart understanding. It includes diverse topics, language styles, chart types, and open-ended answers in line with human cognition.
-
•
MMC-Benchmark. We present a manually annotated benchmark specifically designed to assess the capability of LMMs in chart understanding across nine distinct sub-tasks to ensure a comprehensive evaluation.
-
•
MMCA model. We propose an instruction-tuned LMM model that outperforms existing open-source state-of-the-art (SoTA) LMMs for chart understanding on both existing chart understanding benchmarks and our proposed benchmark.
Our data and code will be available at this repo 111https://github.com/FuxiaoLiu/MMC.
2 Related Work
Multimodal Large Language Model. Recently, Large Language Models (LLMs) have shown strong performances in zero-shot tasks across multiple domains. Recent studies explore using LLMs for multi-modal task completion. One direction Wu et al. (2023a); Yang et al. (2023c, a) uses ChatGPT as the intermediary to choose the best tools or experts for visual interpretation according to user’s inquiries. Another direction is end-to-end training Zhu et al. (2023); Liu et al. (2023d, b); Ye et al. (2023); Yin et al. (2023); Wu et al. (2023b); Zhang et al. (2023); Cao et al. (2023); Zhai et al. (2023) utilizing LLMs and visual encoders to create integrated models for multimodal tasks with inter-connected parameters to relate them. These existing approaches perform well on general visual and language tasks like image captioning and visual question answering with strong language skills. However, when it comes to chart understanding, they often fall short due to a lack of specific training to bridge the chart information with the textual content. Our work enhances visual chart understanding by introducing a novel chart visual instruction-tuning corpus and chart understanding model.
Chart Text Understanding. Another line of research Kantharaj et al. (2022); Masry et al. (2023); Lee et al. (2023) is to train a high-resolution image encoder on a large image-text pair corpus to learn text recognition during the pretraining stage. However, these models rely on specific finetuning on different downstream datasets and cannot achieve open-domain multi-task understanding like LLMs or LMMs do. Earlier datasets such as Kahou et al. (2017); Chaudhry et al. (2020); Methani et al. (2020); Masry et al. (2023); Liu et al. (2020, 2023c) primarily rely on synthetic data, with template-generated questions and answers selected from a fixed vocabulary. More recently, ChartQA Masry et al. (2022) utilizes real-world, web-crawled charts to develop its visual question-answering datasets, supplemented by human annotators. However, it mainly focuses on compositional and visual questions. Li and Tajbakhsh (2023) uses Palm-2 to generate question-answering data for academic charts. However, the answers generated by Palm-2 contain hallucinations. Comparatively, the advantages of our dataset come from its larger size, more diverse topics, richer language styles, and good quality.
3 MMC-Instruction
3.1 Chart-Text Alignment Data
To build a large training corpus for chart-text alignment with a diverse range of styles and topics, we aim to collect chart and text data from online sources. We first collect the Scientific Chart-Caption corpus with both chart and text crawled from arXiv. In addition, we utilize several existing public chart datasets that are suitable for chart-text alignment. The collected charts can be categorized into multiple topics, including computer science, business, health, biology, agriculture, etc.
Scientific Chart-Caption data collected by us. We first download the academic articles (2010-2020) through an official dump from the arXiv website. It is licensed under CC-0, which grants remake and republish rights. Unlike Hsu et al. (2021) using PDFs, we utilize the source files containing the original LaTeX and figure files. In order to improve the dataset quality, we removed the source files without LaTeX or figure files and the source files that are hard to parse. We only keep the chart figures with rich text information in the captions by deleting the pairs whose caption length is less than 25 tokens.
Leveraging Existing Datasets. For chart-text alignment training with diverse chart caption data, we further include the following five public chart datasets for which the underlying data tables are available: (i) Statista Kantharaj et al. (2022), (ii) PlotQA Methani et al. (2020), (iii) VisText Tang et al. (2023), (iv) ChartInfo Lal et al. (2023), (v) Unichart Masry et al. (2023).
3.2 Chart Instruction-Tuning Data
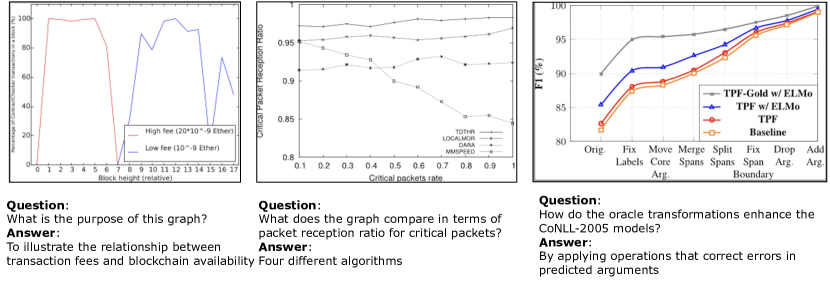
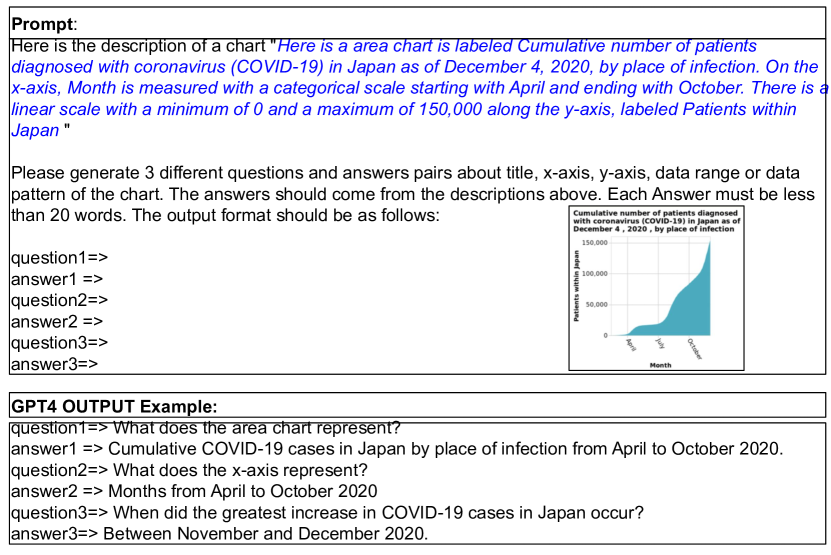
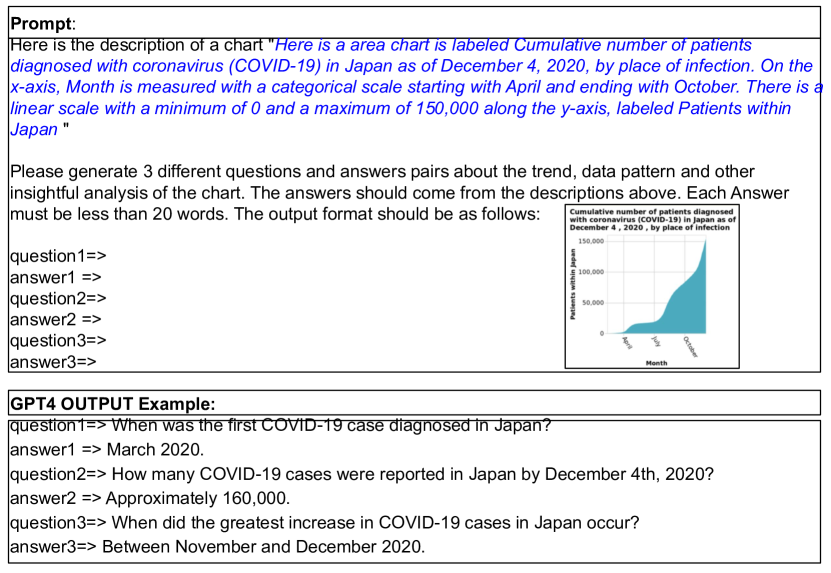
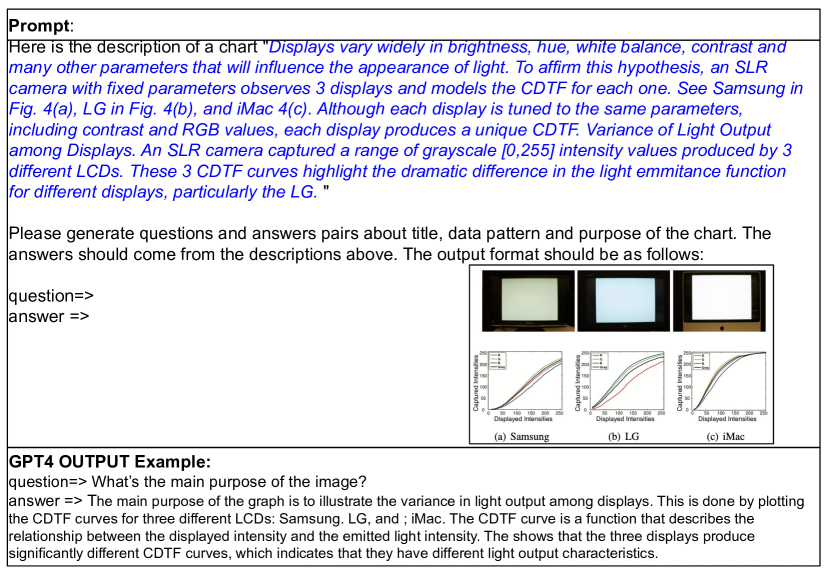
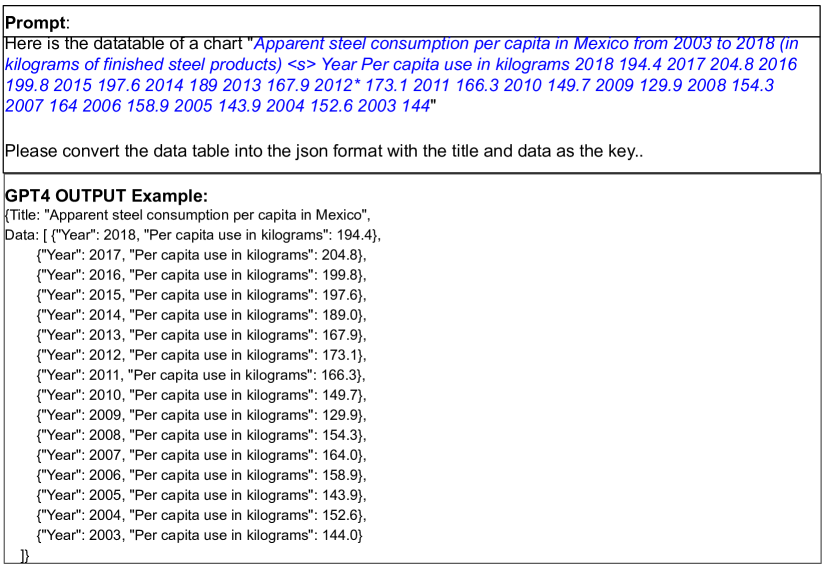
This section introduces the construction of our instruction tuning data in detail. To align the model to follow a variety of instructions, we construct diverse instruction-tuning instances about the provided chart images by prompting the language-only GPT-4. Specifically, given a chart description, we design instructions in a prompt that asks GPT-4 to generate questions and answers in a style as if it could see the image (even though it only has access to the text). The prompt examples for GPT-4 are shown in Fig. 17, 18, 19, 20. Our instruction-tuning data is formatted as: “Human: {question} AI: {answer}”. MMC-Instruction includes the following tasks: chart information extraction, chart reasoning, scientific chart understanding, chart-to-datatable, and chart-to-json. Examples of our chart instruction-tuning data are shown in Fig. 1 and Fig. 5, 6, 7, 8, 9, 10, 11, 12 in the Appendix.
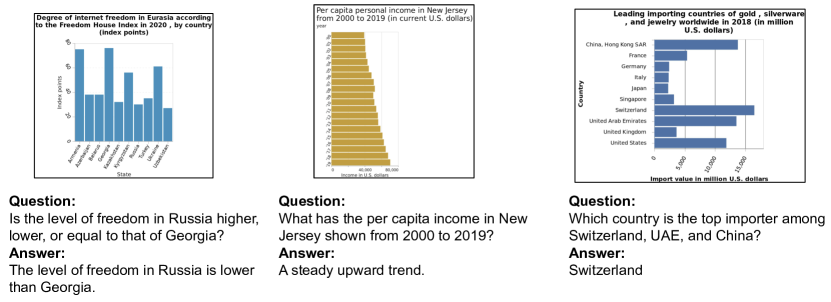
Chart Information Extraction requires the model to extract from the input chart detailed information such as title, coordinate value, scope, trend, etc. To achieve this goal, we collect the generated L1 captions from Tang et al. (2023), whose content enumerates aspects of the chart’s construction. Then, we ask GPT-4 to generate question-answer pairs about the detailed construction information about the chart given L1 captions. In addition, we require the generated answers to be less than 20 words to address hallucination Liu et al. (2023b).
Chart Reasoning requires the model to analyze and identify data patterns, relationships, and anomalies of the input chart. To achieve this goal, we collect the generated L2/L3 captions from Tang et al. (2023), which summarize the statistics and synthesize the cognitive phenomena of the chart. Then, we ask GPT-4 to generate question-answer pairs that require analysis skills.
Scientific Chart Understanding is a challenging task that needs scientific background knowledge. To create instruction-tuning data, we combine the abstract, title, and image captions of arXiv papers to construct the comprehensive textual context. Sometimes, the image caption is too short for GPT-4 to generate meaningful questions and answers regarding the image. To provide more context regarding the image, we also create a prompt that includes paragraphs mentioning the figure in the paper. From our observation, we find a portion of the questions are not graph-related but a follow-up on the textual context in previous answers. Hence, we use heuristic rules to delete the non-chart-related questions.
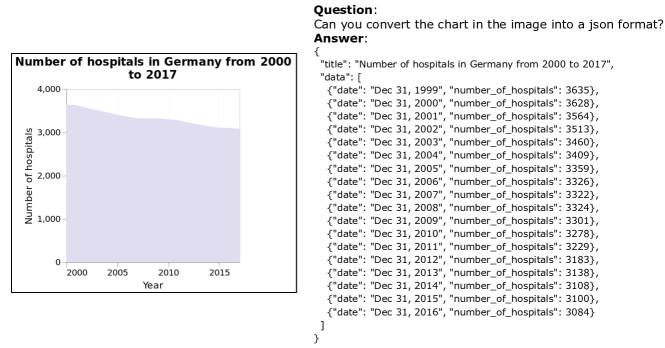
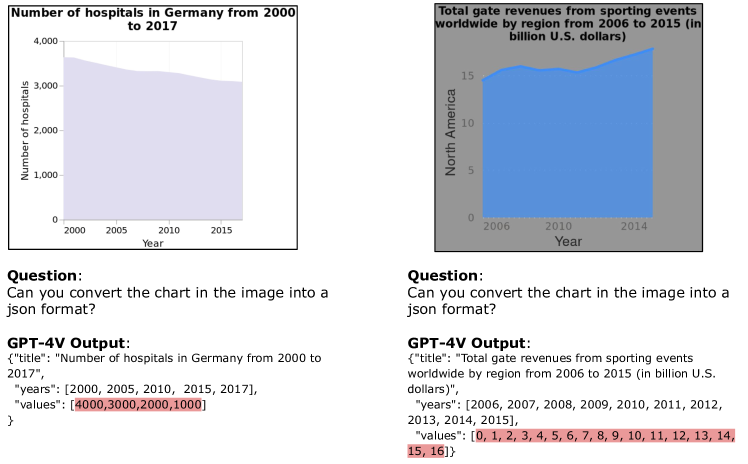
Chart-to-DataTable and Chart-to-Json are the tasks of transforming the visual information represented in the chart into the structured data format of a table or a JSON. This process typically requires interpreting the graphical elements of the chart, such as bars, lines, or pie segments, quantifying their values, and then organizing these values into a tabular format that accurately reflects the original chart.
| Category | Image Source | Question Source | Question Type | Number | Human Check |
| Chart Information Extraction | Statista.com | GPT4 | Free-form/MQA | 330 | ✔ |
| Chart Reasoning | Statista.com | GPT4 | Free-form/MQA | 256 | ✔ |
| Contextual Chart Understanding | arxiv | GPT4, human | Free-form/MQA | 56 | ✔ |
| Multiple Chart Understanding | arxiv | GPT4, human | Free-form/MQA | 52 | ✔ |
| Chart Type Classification | Web Crawl | Groundtruth label | Free-form/MQA | 360 | ✔ |
| Chart Topic Classification | Web Crawl | Groundtruth label | Free-form/MQA | 536 | ✔ |
| Chart To DataTable | VisText | Source Article | Free-form/MQA | 400 | ✔ |
| Chart To Json | VisText | GPT4 | Free-form/MQA | 96 | ✔ |
| Stock Chart Analysis | Google Bard | Source Article | Free-form/MQA | 40 | ✔ |
4 MultiModal Chart Assistant (MMCA)
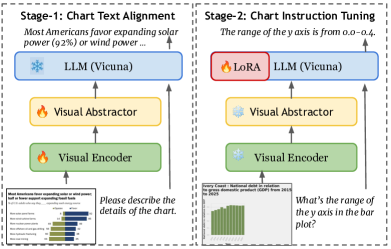
Architecture. Our model Multimodal Chart Assistant (MMCA) is built on top of the most recent multimodal architectures (e.g., mPLUG-Owl Ye et al. (2023)), MiniGPT4 Zhu et al. (2023)) that guide LLMs to follow multimodal instructions. In order to improve the existing LLMs to perform better on chart understanding tasks, we further fine-tune mPLUG-Owl 7B Ye et al. (2023)) on our proposed MMC-Instruction corpus consisting of Chart-Text Alignment Data and Chart Instruction-Tuning Data. mPLUG-Owl contains a pre-trained visual foundation model (CLIP vision encoder), a visual abstractor, and a language foundation model (Vicuna). The visual foundation model is responsible for extracting visual features from the input images, and the visual abstractor distills these features using a set of learnable tokens. The resulting visual features are then concatenated with the word embeddings of the input sentence and fed into the language model to generate the response. We incorporate a two-stage training paradigm.
Stage-1: Chart Text Alignment. In this stage, we freeze both the visual encoder and the language decoder and train the visual abstractor with our Chart-Text Alignment Data for 1 epoch. This stage enables the mapping of visual features of charts to LLM’s word embedding space.
Stage-2: Chart Instruction Tuning. In the second stage, we freeze the visual abstractor, visual encoder, and language decoder and use the low-rank adaptation approach (LoRA) Ye et al. (2023) to fine-tune the language model. Specifically, we train the language model with LoRA on our Chart Instruction-Tuning Data for 3 epochs. The training hyper-parameters are the same as Ye et al. (2023). This stage enables LLM’s instruction following capabilities for chart understanding.
5 MMC-Benchmark
The recent progress of LMMs has enabled the open-ended zero-shot completion of user-oriented vision-language tasks such as open-ended chart understanding. As a result, a comprehensive evaluation benchmark is necessary to evaluate the performances of different LMMs on these tasks and provide quantitative guidance for future research and development. However, for chart understanding, existing benchmarks often fall short of evaluating open-ended questions and unbounded chart types. Our dataset, MMC-Benchmark, is therefore motivated to bridge this gap, offering three unique characteristics for chart understanding: (i) MMC-Benchmark is the first benchmark with human annotations to evaluate LMM’s ability to comprehend visual charts. (ii) MMC-Benchmark is more diverse with various sources and nine different tasks, including chart information extraction, chart reasoning, contextual chart understanding, multiple chart understanding, chart type classification, chart topic classification, chart-to-datatable, chart-to-json, and stock chart analysis, with examples shown in Fig.1. (iii) MMC-Benchmark provides two evaluation methods for convenient quantitative analysis, including free-format Generation Ability Evaluation using ChatGPT and multiple-choice QA format Chart Understanding Ability Evaluation without the requirement of ChatGPT. The statistic of MMC-Benchmark is shown in Tab. 2.
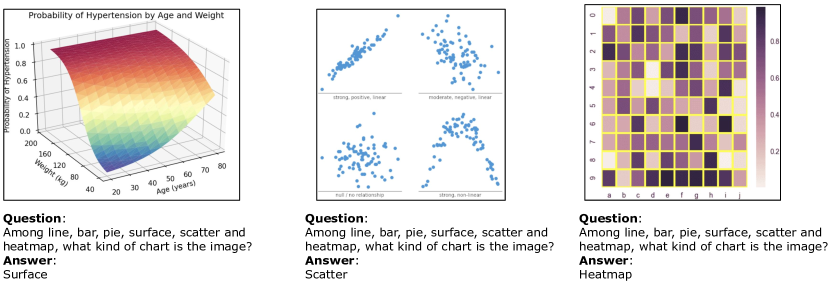
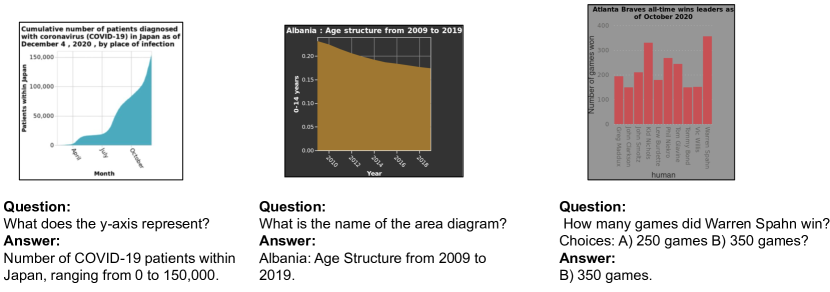
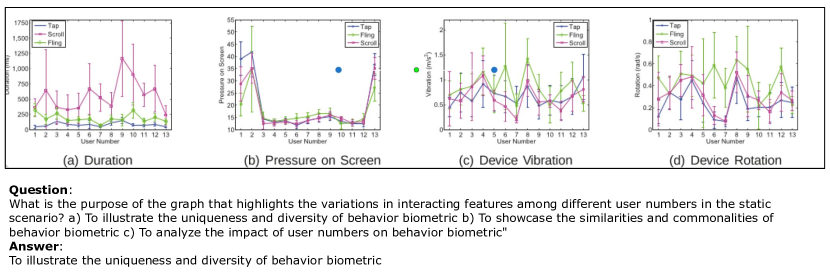
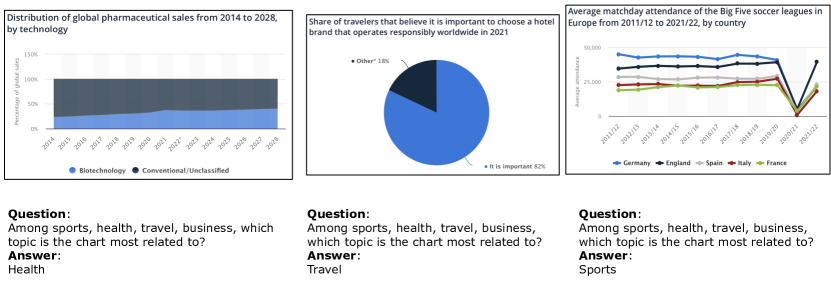
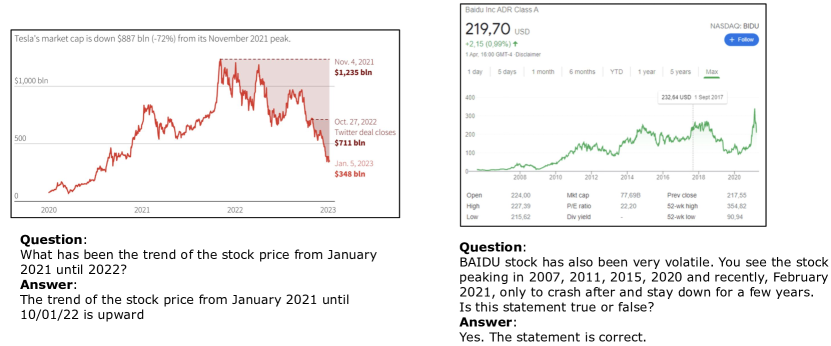
Data Collection. For chart information extraction and chart reasoning tasks, the images are samples from Masry et al. (2022), but the instruction-answer pairs are all manually constructed by us rather than from existing public annotations. For contextual chart understanding and multiple chart understanding, we collect the source images from scientific charts of arXiv that are not presented in our training sets. Contextual chart understanding requires the models to read the context information to answer the questions of the charts. We utilize the abstract of the scientific paper as the context information. We manually design the questions for the multiple chart understanding, which evaluates the model’s complex reasoning ability to compare between multiple charts. The chart type classification task contains six types: line, bar, pie, scatter, heatmap, and surface. The images of line, bar, and pie chart are from Methani et al. (2020) while others are collected by us from Google Bard. The chart topic classification task includes health, business, computer science, travel, and sports, whose images are crawled from Google. As for the chart-to-datatable and chart-to-json tasks, we use the images and data tables from Wu et al. (2023a). The json data is generated by prompting GPT-4 with the datatable as the input. Finally, for stock chart analysis, we collect the chart images of stock from Google Bard without including corresponding captions due to hallucination concerns. Instead, we look through the source article and manually construct the questions about the stock trend, predictions, and corresponding background knowledge.
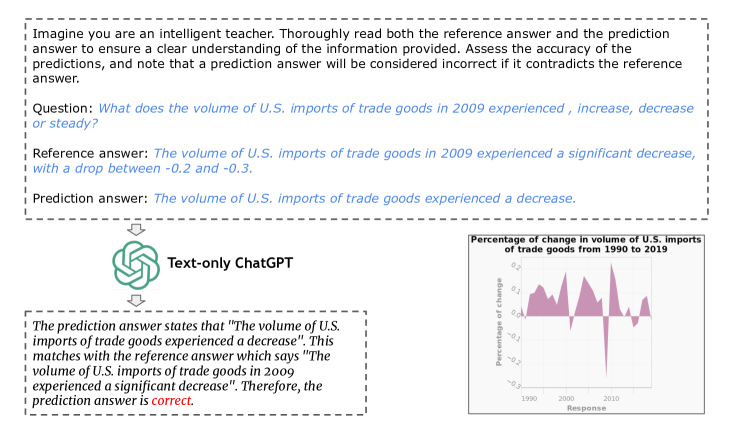
Evaluation Protocols. In order to evaluate LMMs’ generation ability and chart understanding ability, the instructions in MMC-Benchmark consists of two parts. (1) Generation Ability Evaluation, which utilizes ChatGPT to compare between reference answers and generated texts. The prompt we used for evaluation is shown in Fig. 3, where we provide ChatGPT with the question, the reference answer, and the model prediction and ask ChatGPT to assess the accuracy of the model prediction. (2) Understanding Ability Evaluation, which aims to let the model select the correct answer from multiple choice questions (MQA) given in the chart. For each image, we manually design choices for each question. Unlike Generation Ability Evaluation, Understanding Ability Evaluation does not require the utilization of ChatGPT.
6 Experiments
6.1 Experimental Setup
Our MMCA model is trained with 8 Nvidia Tesla V100 GPUs. We compare MMCA with existing models in three setups: (a) Open-source LMMs including MiniGPT4-7B (Zhu et al., 2023), mPLUG-owl-7B (Ye et al., 2023), LRV-Instruction (Liu et al., 2023b), LLaVA-7B (Liu et al., 2023d), and Multimodal-GPT-9B (Gong et al., 2023). (b) GPT-4V OpenAI (2023b) recently released by OpenAI. (c) Non-LLMs based models including Pix2Struct (Lee et al., 2023) and Donut (Kim et al., 2022).
6.2 Experiment Results
| Free-form Evaluation | LLAVA | MiniGPT4 | mPLUG-owl | LRV-Instruct | MMCA(Ours) | GPT-4V |
| Chart Information Extraction | 0.29 | 0.23 | 0.27 | 0.24 | 0.35 | 0.63 |
| Chart Reasoning | 0.28 | 0.20 | 0.22 | 0.19 | 0.30 | 0.57 |
| Contextual Chart Understanding | 0.30 | 0.21 | 0.28 | 0.23 | 0.33 | 0.55 |
| Multiple Chart Understanding | 0.24 | 0.17 | 0.23 | 0.21 | 0.29 | 0.39 |
| Chart Type Classification | 0.27 | 0.20 | 0.25 | 0.22 | 0.31 | 0.79 |
| Chart Topic Classification | 0.31 | 0.19 | 0.24 | 0.21 | 0.32 | 0.82 |
| Stock Chart Analysis | 0.24 | 0.18 | 0.25 | 0.23 | 0.32 | 0.70 |
| Chart to Datatable | 0.00 | 0.00 | 0.05 | 0.00 | 0.08 | 0.05 |
| Chart to Json | 0.01 | 0.00 | 0.00 | 0.00 | 0.05 | 0.04 |
| MQA Evaluation | LLAVA | MiniGPT4 | mPLUG-owl | LRV-Instruct | MMCA(Ours) |
| Chart Information Extraction | 0.41 | 0.39 | 0.45 | 0.45 | 0.49 |
| Chart Reasoning | 0.37 | 0.35 | 0.44 | 0.41 | 0.47 |
| Contextual Chart Understanding | 0.45 | 0.34 | 0.50 | 0.42 | 0.55 |
| Multiple Chart Understanding | 0.40 | 0.32 | 0.43 | 0.45 | 0.47 |
| Chart Type Classification | 0.51 | 0.48 | 0.55 | 0.50 | 0.59 |
| Chart Topic Classification | 0.50 | 0.52 | 0.54 | 0.51 | 0.64 |
| Stock Chart Analysis | 0.45 | 0.46 | 0.45 | 0.45 | 0.57 |
| Chart to Datatable | 0.33 | 0.40 | 0.44 | 0.35 | 0.64 |
| Chart to Json | 0.35 | 0.39 | 0.41 | 0.39 | 0.59 |
6.2.1 Evaluation Results on MMC-Benchmark
As indicated in Tab. 3 and Tab. 4, MMCA achieves better performance in all 9 tasks in comparison with the existing open-source models. The improvement of MMCA demonstrates the effectiveness of our MMC-Instruction data in enabling the LMM to complete chart understanding tasks. In addition, we find that current LMMs are better at understanding cross-modality relationships in the image but weaker at comprehending text layout information. This can be attributed to their lack of text recognition, scientific knowledge, and math reasoning abilities. The weak performance of MiniGPT4 can be attributed to its limited instruction-tuning data with a single task in a small size. Though fine-tuned with instruction-tuning data from text-rich images, LLAVa and mPLUG-owl do not perform well, indicating that strong text recognition abilities in images do not guarantee high performance on MMC-Benchmark, which requires comprehensive visual perception and chart reasoning capability.
Additionally, current LMMs perform badly on the chart-to-datatable and chart-to-json tasks. We conjecture that it is due to the fact that these two tasks require strong OCR ability to output all the data values in the chart correctly. If one value is missing, the prediction will be regarded as incorrect. Besides, we also find that the overall performance of Multiple Chart Understanding is lower than Contextual Chart Understanding. This phenomenon may be attributed to the lack of training data with multiple images as input.
6.2.2 Results on Public Benchmarks
We compare our MMCA with the state-of-the-art methods on existing public benchmarks including ChartQA (Masry et al., 2022), DocVQA (Mathew et al., 2021), and TextVQA Yang et al. (2021). As shown in Tab. 5, our MMCA outperforms existing LMMs, including MiniGPT4 and LRV-Instruction on the three public benchmarks. Moreover, without including any finetuning on the corresponding datasets, our proposed MMCA model outperforms both Pix2Struct and Donut that are finetuned on these datasets. Such results validate that with the help of open-domain large multi-modal models (LMMs), the performance of chart understanding can be significantly improved.
| Model | ChartQA | DocVQA | TextVQA |
| Donut | 41.8 | 67.5 | 43.5 |
| Pix2Struct | 56.0 | 72.1 | - |
| MiniGPT4 | 46.5 | 42.3 | - |
| LRV-Instruction | 47.5 | 58.5 | - |
| MMCA(Ours) | 57.4 | 72.5 | 57.6 |
6.2.3 Comparison with GPT-4V
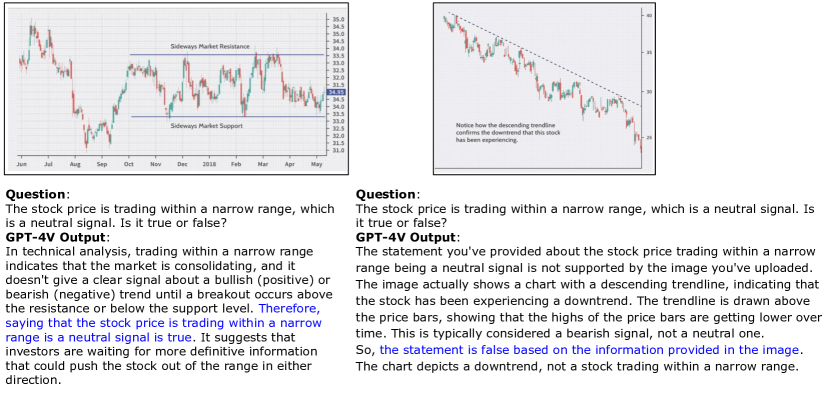
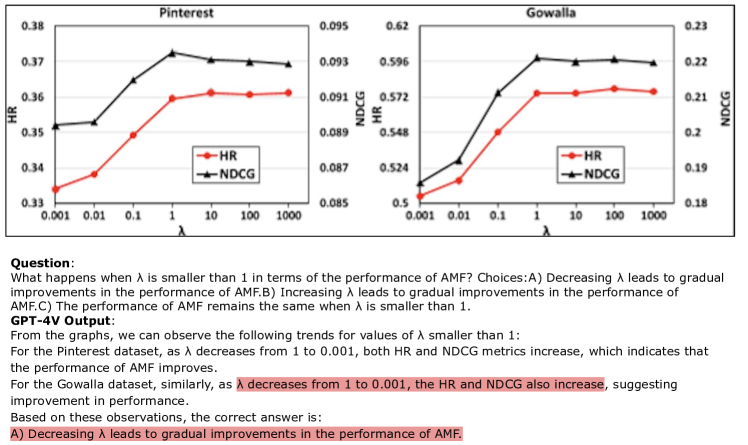
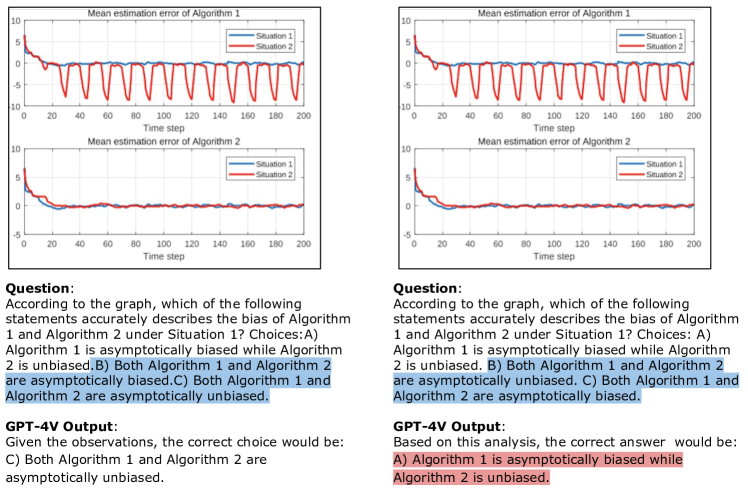
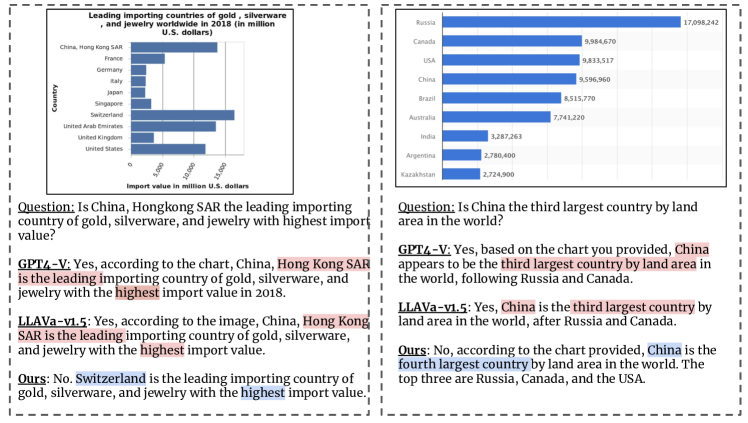
We further evaluate and benchmark GPT-4V OpenAI (2023b) via the “gpt-4-vision-preview” model on our proposed MMC-Benchmark. In our queries to GPT-4V, we prepend the prompt with “Generate a short and concise response to the following image text pair.” The quantitative results are shown in Tab. 3. Remarkably, GPT-4V surpasses all open-source LMMs by substantial margins on seven out of the nine tasks of MMC-Benchmark. Such results prove GPT-4V’s strong skills in text recognition, scientific knowledge, and math reasoning. The only two tasks GPT-4V performs poorly are Chart to Datatable and Chart to Json. As shown in Fig.16, GPT-4V misrecognizes the data value from the charts. Apart from the two tasks, GPT-4V may predict incorrectly on the Multiple Charts Understanding tasks such as Fig. 14, 15. Other failure examples are shown in Fig. 4. As indicated by (Liu et al., 2023a), the strong language prior misled GPT-4V to answer “China appears to be the third largest country by land area in the world”, which conflicts with the information mentioned in the chart “USA appears to be the third largest country by land area in the world”. This MMC-Benchmark analysis is intended as a source of inspiration for future research, specifically in the realms of advanced multimodal prompting techniques and model refinements to improve the LMM performance further.
The strength and weakness of the closed proprietary GPT-4V model shown in our MMC-Benchmark evaluation further proves the value of our proposed MMC-Instruction corpus for the open-source community to improve LMMs for chart understanding. As shown in Table 3 & 4, our MMC-Instruction corpus helps to significantly improve MMC-Benchmark performances over existing public LMMs by a large margin in all nine tasks. This corpus can be applied in future open-source LMMs to boost their chart understanding performance. Moreover, our work demonstrates a part of the weakness areas of the GPT-4V model, and the MMC-Instruction corpus provides instruction tuning data for future closed proprietary and open-source models to tackle such weaknesses.
6.3 Discussions
We summarize four common problems affecting the performance of existing large multimodal models (LMMs) like MiniGPT4, etc.
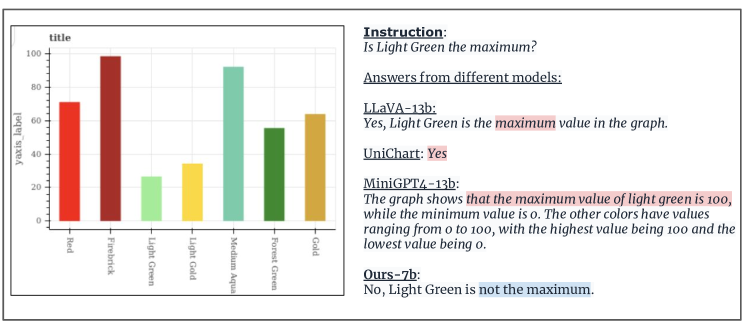
Not Following Instructions. Even with a very concise instruction design, there are LMMs that do not follow the user’s instructions. For example, in Fig. 21(a) of the Appendix, when asked “Please identify the proportion of Americans who favor the coal mining.”, Pix2Struct and Unichart answer “Yes” and “the proportion of Americans who favor coal mining.”, respectively. Additionally, in Fig. 21(a)(a), MiniGPT4 makes a declarative expression without answering whether light green is the maximum or not. In our opinion, a good chart understanding model should be able to follow instructions. However, to the best of our knowledge, most of the existing LLM-based or LMM-based models, except for GPT-4V, are not able to follow human instructions for chart understanding well.
Vision Encoder is Weak. Existing LMMs typically use CLIP as the vision encoder and do not update its parameters during training. However, as CLIP is trained to align visual embeddings with short captions, its capability on modeling the spatial interactions of chart elements like trend lines and color-coded legends is limited. On the other hand, such capabilities are essential to identify specific legends, trends, or labels in the chart. The potential method is to add segmentation Kirillov et al. (2023) and project the segments into the LLM token embedding space. Instead, in our proposed MMCA approach, we finetune LMMs on our MMC-Instruction data by updating the vision projector during training and improving the integration of visual elements into the LLM input domain. The improvements in our experiments demonstrate the effectiveness of our proposed MMC-Instruction dataset and the training strategy in MMCA.
MMC-Benchmark is more Challenging than Previous Benchmarks. From Tab. 3, we find that the overall scores for existing models on MMC-Benchmark are relatively lower than those on the current benchmarks like ChartQA. Such results are expected since the questions in MMC-Benchmark are more diverse, and the answers are open-ended. Additionally, MMC-Benchmark contains more topics that require both a comprehensive understanding of charts and proficient language skills.
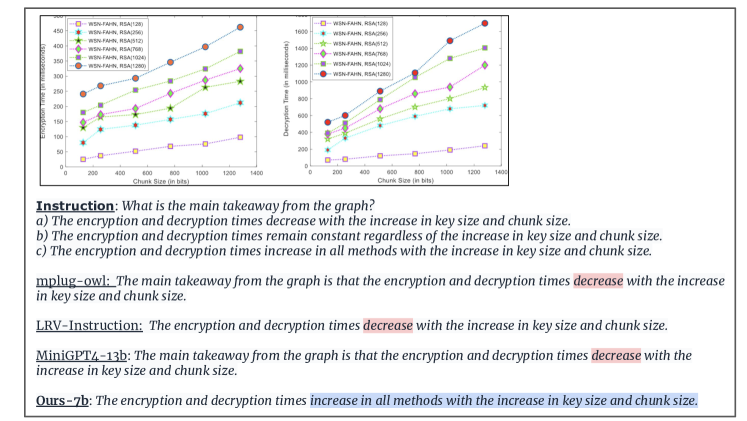
Chart-to-DataTable and Chart-to-Json are extremely Difficult. As shown in Tab. 3, all current LMMs, including GPT-4V, perform badly on these two tasks. It is probably due to the fact that these two tasks require strong OCR skills to output all the data values in the chart correctly. If one value is missing, the prediction will be regarded as incorrect. Compared with baselines in Fig. 21(a), our MMCA model is able to produce more accurate responses in correct output formats.
7 Conclusion
This paper aims to tackle the challenge of chart understanding with Large Multimodal Models (LMMs). Firstly, we present a novel and large-scale chart instruction-tuning dataset called MMC-Instruction that includes diverse topics, language styles, chart types, and open-ended answers in line with human cognition. Secondly, we introduce a human-annotated benchmark called MMC-Benchmark to evaluate LLMs’ abilities for chart understanding quantitatively. We also conduct abundant experiments on a total of nine subtasks to comprehensively evaluate LMMs. Finally, we propose an instruction-tuned LMM called MMCA that outperforms existing open-source state-of-the-art (SoTA) methods on both well-established chart understanding datasets and MMC-Benchmark.
Though we believe MMCA represents a significant step toward building a useful multimodal chart assistant, we notice MMCA is limited by a weak vision encoder and preliminary performance on chart-to-datatable and chart-to-json tasks. Future work is directed toward overcoming the challenges with advanced visual encoding and modeling.
References
- Brown et al. (2020) Tom Brown, Benjamin Mann, Nick Ryder, Melanie Subbiah, Jared D Kaplan, Prafulla Dhariwal, Arvind Neelakantan, Pranav Shyam, Girish Sastry, Amanda Askell, et al. 2020. Language models are few-shot learners. Advances in neural information processing systems, 33:1877–1901.
- Cao et al. (2023) Yunkang Cao, Xiaohao Xu, Chen Sun, Xiaonan Huang, and Weiming Shen. 2023. Towards generic anomaly detection and understanding: Large-scale visual-linguistic model (gpt-4v) takes the lead. arXiv preprint arXiv:2311.02782.
- Chaudhry et al. (2020) Ritwick Chaudhry, Sumit Shekhar, Utkarsh Gupta, Pranav Maneriker, Prann Bansal, and Ajay Joshi. 2020. Leaf-qa: Locate, encode & attend for figure question answering. In Proceedings of the IEEE/CVF Winter Conference on Applications of Computer Vision, pages 3512–3521.
- Chowdhery et al. (2022) Aakanksha Chowdhery, Sharan Narang, Jacob Devlin, Maarten Bosma, Gaurav Mishra, Adam Roberts, Paul Barham, Hyung Won Chung, Charles Sutton, Sebastian Gehrmann, et al. 2022. Palm: Scaling language modeling with pathways. arXiv preprint arXiv:2204.02311.
- Gong et al. (2023) Tao Gong, Chengqi Lyu, Shilong Zhang, Yudong Wang, Miao Zheng, Qian Zhao, Kuikun Liu, Wenwei Zhang, Ping Luo, and Kai Chen. 2023. Multimodal-gpt: A vision and language model for dialogue with humans. arXiv preprint arXiv:2305.04790.
- Hsu et al. (2021) Ting-Yao Hsu, C Lee Giles, and Ting-Hao’Kenneth’ Huang. 2021. Scicap: Generating captions for scientific figures. arXiv preprint arXiv:2110.11624.
- Kafle et al. (2018) Kushal Kafle, Brian Price, Scott Cohen, and Christopher Kanan. 2018. Dvqa: Understanding data visualizations via question answering. In Proceedings of the IEEE conference on computer vision and pattern recognition, pages 5648–5656.
- Kahou et al. (2017) Samira Ebrahimi Kahou, Vincent Michalski, Adam Atkinson, Ákos Kádár, Adam Trischler, and Yoshua Bengio. 2017. Figureqa: An annotated figure dataset for visual reasoning. arXiv preprint arXiv:1710.07300.
- Kantharaj et al. (2022) Shankar Kantharaj, Rixie Tiffany Ko Leong, Xiang Lin, Ahmed Masry, Megh Thakkar, Enamul Hoque, and Shafiq Joty. 2022. Chart-to-text: A large-scale benchmark for chart summarization. arXiv preprint arXiv:2203.06486.
- Kim et al. (2022) Geewook Kim, Teakgyu Hong, Moonbin Yim, JeongYeon Nam, Jinyoung Park, Jinyeong Yim, Wonseok Hwang, Sangdoo Yun, Dongyoon Han, and Seunghyun Park. 2022. Ocr-free document understanding transformer. In European Conference on Computer Vision, pages 498–517. Springer.
- Kirillov et al. (2023) Alexander Kirillov, Eric Mintun, Nikhila Ravi, Hanzi Mao, Chloe Rolland, Laura Gustafson, Tete Xiao, Spencer Whitehead, Alexander C Berg, Wan-Yen Lo, et al. 2023. Segment anything. arXiv preprint arXiv:2304.02643.
- Lal et al. (2023) Jay Lal, Aditya Mitkari, Mahesh Bhosale, and David Doermann. 2023. Lineformer: Line chart data extraction using instance segmentation. In International Conference on Document Analysis and Recognition, pages 387–400. Springer.
- Lee et al. (2023) Kenton Lee, Mandar Joshi, Iulia Raluca Turc, Hexiang Hu, Fangyu Liu, Julian Martin Eisenschlos, Urvashi Khandelwal, Peter Shaw, Ming-Wei Chang, and Kristina Toutanova. 2023. Pix2struct: Screenshot parsing as pretraining for visual language understanding. In International Conference on Machine Learning, pages 18893–18912. PMLR.
- Li and Tajbakhsh (2023) Shengzhi Li and Nima Tajbakhsh. 2023. Scigraphqa: A large-scale synthetic multi-turn question-answering dataset for scientific graphs. arXiv preprint arXiv:2308.03349.
- Liu et al. (2023a) Fuxiao Liu, Tianrui Guan, Zongxia Li, Lichang Chen, Yaser Yacoob, Dinesh Manocha, and Tianyi Zhou. 2023a. Hallusionbench: You see what you think? or you think what you see? an image-context reasoning benchmark challenging for gpt-4v (ision), llava-1.5, and other multi-modality models. arXiv preprint arXiv:2310.14566.
- Liu et al. (2023b) Fuxiao Liu, Kevin Lin, Linjie Li, Jianfeng Wang, Yaser Yacoob, and Lijuan Wang. 2023b. Aligning large multi-modal model with robust instruction tuning. arXiv preprint arXiv:2306.14565.
- Liu et al. (2023c) Fuxiao Liu, Hao Tan, and Chris Tensmeyer. 2023c. Documentclip: Linking figures and main body text in reflowed documents. arXiv preprint arXiv:2306.06306.
- Liu et al. (2020) Fuxiao Liu, Yinghan Wang, Tianlu Wang, and Vicente Ordonez. 2020. Visualnews : Benchmark and challenges in entity-aware image captioning.
- Liu et al. (2023d) Haotian Liu, Chunyuan Li, Qingyang Wu, and Yong Jae Lee. 2023d. Visual instruction tuning. arXiv preprint arXiv:2304.08485.
- Manyika (2023) James Manyika. 2023. An overview of bard: an early experiment with generative ai. AI. Google Static Documents.
- Masry et al. (2023) Ahmed Masry, Parsa Kavehzadeh, Xuan Long Do, Enamul Hoque, and Shafiq Joty. 2023. Unichart: A universal vision-language pretrained model for chart comprehension and reasoning. arXiv preprint arXiv:2305.14761.
- Masry et al. (2022) Ahmed Masry, Do Xuan Long, Jia Qing Tan, Shafiq Joty, and Enamul Hoque. 2022. Chartqa: A benchmark for question answering about charts with visual and logical reasoning. arXiv preprint arXiv:2203.10244.
- Mathew et al. (2021) Minesh Mathew, Dimosthenis Karatzas, and CV Jawahar. 2021. Docvqa: A dataset for vqa on document images. In Proceedings of the IEEE/CVF winter conference on applications of computer vision, pages 2200–2209.
- Methani et al. (2020) Nitesh Methani, Pritha Ganguly, Mitesh M Khapra, and Pratyush Kumar. 2020. Plotqa: Reasoning over scientific plots. In Proceedings of the IEEE/CVF Winter Conference on Applications of Computer Vision, pages 1527–1536.
- OpenAI (2022) OpenAI. 2022. Introducing chatgpt.
- OpenAI (2023a) OpenAI. 2023a. Gpt-4 technical report. arXiv preprint arXiv:2303.08774.
- OpenAI (2023b) OpenAI. 2023b. Gpt-4v(ision) system card.
- Tang et al. (2023) Benny J Tang, Angie Boggust, and Arvind Satyanarayan. 2023. Vistext: A benchmark for semantically rich chart captioning. arXiv preprint arXiv:2307.05356.
- Touvron et al. (2023) Hugo Touvron, Thibaut Lavril, Gautier Izacard, Xavier Martinet, Marie-Anne Lachaux, Timothée Lacroix, Baptiste Rozière, Naman Goyal, Eric Hambro, Faisal Azhar, et al. 2023. Llama: Open and efficient foundation language models. arXiv preprint arXiv:2302.13971.
- Wu et al. (2023a) Chenfei Wu, Shengming Yin, Weizhen Qi, Xiaodong Wang, Zecheng Tang, and Nan Duan. 2023a. Visual chatgpt: Talking, drawing and editing with visual foundation models. arXiv preprint arXiv:2303.04671.
- Wu et al. (2023b) Shengqiong Wu, Hao Fei, Leigang Qu, Wei Ji, and Tat-Seng Chua. 2023b. Next-gpt: Any-to-any multimodal llm. arXiv preprint arXiv:2309.05519.
- Yang et al. (2023a) Rui Yang, Lin Song, Yanwei Li, Sijie Zhao, Yixiao Ge, Xiu Li, and Ying Shan. 2023a. Gpt4tools: Teaching large language model to use tools via self-instruction. arXiv preprint arXiv:2305.18752.
- Yang et al. (2023b) Zhengyuan Yang, Linjie Li, Kevin Lin, Jianfeng Wang, Chung-Ching Lin, Zicheng Liu, and Lijuan Wang. 2023b. The dawn of lmms: Preliminary explorations with gpt-4v (ision). arXiv preprint arXiv:2309.17421, 9.
- Yang et al. (2023c) Zhengyuan Yang, Linjie Li, Jianfeng Wang, Kevin Lin, Ehsan Azarnasab, Faisal Ahmed, Zicheng Liu, Ce Liu, Michael Zeng, and Lijuan Wang. 2023c. Mm-react: Prompting chatgpt for multimodal reasoning and action. arXiv preprint arXiv:2303.11381.
- Yang et al. (2021) Zhengyuan Yang, Yijuan Lu, Jianfeng Wang, Xi Yin, Dinei Florencio, Lijuan Wang, Cha Zhang, Lei Zhang, and Jiebo Luo. 2021. Tap: Text-aware pre-training for text-vqa and text-caption. In Proceedings of the IEEE/CVF conference on computer vision and pattern recognition, pages 8751–8761.
- Ye et al. (2023) Qinghao Ye, Haiyang Xu, Guohai Xu, Jiabo Ye, Ming Yan, Yiyang Zhou, Junyang Wang, Anwen Hu, Pengcheng Shi, Yaya Shi, et al. 2023. mplug-owl: Modularization empowers large language models with multimodality. arXiv preprint arXiv:2304.14178.
- Yin et al. (2023) Shukang Yin, Chaoyou Fu, Sirui Zhao, Ke Li, Xing Sun, Tong Xu, and Enhong Chen. 2023. A survey on multimodal large language models. arXiv preprint arXiv:2306.13549.
- Zhai et al. (2023) Yuexiang Zhai, Shengbang Tong, Xiao Li, Mu Cai, Qing Qu, Yong Jae Lee, and Yi Ma. 2023. Investigating the catastrophic forgetting in multimodal large language models. arXiv preprint arXiv:2309.10313.
- Zhang et al. (2023) Ao Zhang, Hao Fei, Yuan Yao, Wei Ji, Li Li, Zhiyuan Liu, and Tat-Seng Chua. 2023. Transfer visual prompt generator across llms. arXiv preprint arXiv:2305.01278.
- Zhu et al. (2023) Deyao Zhu, Jun Chen, Xiaoqian Shen, Xiang Li, and Mohamed Elhoseiny. 2023. Minigpt-4: Enhancing vision-language understanding with advanced large language models. arXiv preprint arXiv:2304.10592.
Appendix A Appendix