Scaling TabPFN: Sketching and Feature Selection for Tabular Prior-Data Fitted Networks
Abstract
Tabular classification has traditionally relied on supervised algorithms, which estimate the parameters of a prediction model using its training data. Recently, Prior-Data Fitted Networks (PFNs) such as TabPFN have successfully learned to classify tabular data in-context: the model parameters are designed to classify new samples based on labelled training samples given after the model training. While such models show great promise, their applicability to real-world data remains limited due to the computational scale needed. Here we study the following question: given a pre-trained PFN for tabular data, what is the best way to summarize the labelled training samples before feeding them to the model? We conduct an initial investigation of sketching and feature-selection methods for TabPFN, and note certain key differences between it and conventionally fitted tabular models.
1 Introduction
Classification of tabular data is a basic machine learning task of vital importance, and has inspired a large set of algorithmic approaches. These approaches, ranging from classical algorithms such as gradient-boosted trees [prokhorenkova_catboost_2018; xgboost] to recent attempts with deep learning [somepalli2021saint] have all been focused on choosing proper model parameters (and hyper-parameters) given an explicitly defined model hypothesis class.
In a recent parallel line of work, Prior-Data Fitted Networks such as TabPFN have successfully been demonstrated to classify tabular data based on a training set given as the model input [hollmann_tabpfn_2023]. Rather than using training data to fit the model parameters, TabPFN gets at inference time a set that contains both labeled and unlabeled samples. It then predicts the ‘missing’ labels directly based on the labeled input samples, rather than exclusively relying on trained model parameters. In this sense, the working of TabPFN resembles the phenomenon of in-context learning that is exhibited by large language models such as GPT, which emerges during pretraining [brown_language_2020; li2023emergent]. In TabPFN, the pretraining stage can be viewed as inducing suitable statistical priors which are then used to fill in the missing labels.
In large language models, the choice (and length) of the context crucially affects prediction performance [xie_explanation_2022]. Optimizing the performance of large language models often requires long (and fairly complicated) prompting strategies. Many recent studies have examined how prompting in-context learning algorithms allows the model to retrieve memorized information, perform simple mathematical operations, or even execute high-level reasoning [liu_goat_2023; meng2022locating; nanda_progress_2023]. Context-optimization strategies have been less frequently studied for tabular models such as TabPFN. They are, however, crucial, as memory constraints prevent TabPFN from using more than a few thousand samples as context.
When using Prior-Data Fitted Networks for tabular data, the “prompt” is composed from the sample values and their labels from the training set. The model is then expected to give predictions on a set of unlabelled samples, also given as part of the prompt. This setting is simpler than the case for language models: all the labelled parts of the prompt are weighed equally, and the labeled (training) samples can be treated as an unordered set, rather than parts of an ordered string with internal syntax.
Focusing on in-context learning for tabular data has additional advantages: (i) While the evaluation of language models is a hard problem (covering many tasks and complicated metrics) the evaluation of tabular data classifiers is straightforward. (ii) The prior knowledge implicitly contained in the pretrained model is driven in the tabular case by synthetic data, unlike the case with large language models which use large web-scraped text corpora. (iii) Improving the results of TabPFN further advances the use of deep models for tabular data and may be of practical importance.
Here, we focus on understanding one part of the context optimization problem for tabular classification: summarizing a large training dataset, , into a more compact set, , such that most of the information useful to the model is contained in . The relative simplicity of tabular in-context learning allows us to formalize a concrete question: Given a pretrained model, which operations should be used to summarize the input target data before feeding it to TabPFN?
In this short paper, we empirically study basic properties about how one should (or should not) summarize a target tabular dataset when used as context for in-context learning.
2 Sketching and feature selection for tabular in-context learning
Feature selection and sketching methods have been extensively explored in prior literature on tabular classification [munteanu_coresets-methods_2018; chandrashekar_survey_2014]. In the following section, we report the results of applying a representative selection of these methods.
2.1 Experimental setting
To systematically evaluate TabPFN with the different context summarization we select a subset of nineteen datasets from [mcelfresh_when_2023] which exceed either the feature or sample limitation recommended by the authors of TabPFN, which are 100 features and 1000 samples, respectively [hollmann_tabpfn_2023]. We limit our algorithmic comparison to TabPFN and CatBoost, which is the best-performing overall model in [mcelfresh_when_2023]. The complete list of datasets can be found in Sec. LABEL:app:dataset-list. For ease of comparison with existing meta-analyses, where possible we replicate the method of [mcelfresh_when_2023]. We compare CatBoost with 30 hyperparameter settings (one default set and 29 random sets, using Optuna) to TabPFN, averaging over 10 train/validation folds for each dataset.
Our main results can be found in Tab. 1. We conduct our primary investigation into sketching methods at features and samples from each dataset. Dataset names are drawn from OpenML with abbreviations as follows: gddc refers to gas-drift-different-concentrations, fm to Fashion-MNIST, ss to skin-segmentation. CB stands for CatBoost, TP for TabPFN, f for full dataset, b for best result using any combination of algorithms, and r for the best result using random feature and random sample selection. SKT is an abbreviation for sketching method, FTS for feature selection, SMP for sampling strategy. We report the most successful combination for each model, on each dataset, with respect to average accuracy over ten folds.
We determine statistically significant () performance differences between algorithms by use of a Wilcoxon signed-rank test between CatBoost and TabPFN. A Holm-Bonferroni correction is used to account for multiple comparisons.
| Dataset | Acc (CB, f) | Acc (CB, b) | Acc (CB, r) | Acc (TP, b) | Acc (TP, r) | SKT / FTS / SMP (CB) | SKT / FTS / SMP (TP) |
|---|---|---|---|---|---|---|---|
| airlines_189354 | 0.653 | 0.637 | 0.637 | 0.594 | 0.589 | RND / RND / PR | RND / RND / PR |
| albert_189356 | 0.698 | 0.657 | 0.657 | 0.64 | 0.64 | RND / RND / PR | RND / RND / PR |
| CIFAR_10_167124 | 0.434 | 0.37 | 0.342 | 0.373 | 0.372 | RND / PCA / PR | RND / RND / PR |
| connect-4_146195 | 0.749 | 0.716 | 0.716 | 0.66 | 0.659 | RND / RND / PR | RND / RND / PR |
| eeg-eye-state_14951 | 0.832 | 0.808 | 0.806 | 0.932 | 0.932 | RND / RND / PR | RND / RND / EQ |
| elevators_3711 | 0.855 | 0.838 | 0.838 | 0.9 | 0.899 | RND / MUT / PR | RND / RND / PR |
| FM_146825 | 0.843 | 0.787 | 0.787 | 0.835 | 0.812 | RND / RND / PR | RND / PCA / PR |
| gddc_9987 | 0.97 | 0.976 | 0.955 | 0.994 | 0.993 | RND / PCA / EQ | RND / RND / PR |
| higgs_146606 | 0.71 | 0.684 | 0.684 | 0.665 | 0.661 | RND / RND / PR | RND / RND / PR |
| hill-valley_145847 | 0.514 | 0.514 | 0.514 | 0.56 | 0.56 | RND / RND / PR | RND / RND / PR |
| mfeat-factors_12 | 0.954 | 0.95 | 0.943 | 0.973 | 0.973 | KMN / RND / EQ | RND / RND / PR |
| mfeat-pixel_146824 | 0.955 | 0.951 | 0.951 | 0.971 | 0.97 | RND / RND / PR | RND / RND / PR |
| pendigits_32 | 0.972 | 0.966 | 0.964 | 0.995 | 0.993 | RND / RND / PR | RND / RND / PR |
| poker-hand_9890 | 0.664 | 0.572 | 0.561 | 0.519 | 0.515 | RND / RND / PR | RND / RND / PR |
| riccardo_168338 | 0.951 | 0.956 | 0.93 | 0.991 | 0.982 | RND / PCA / EQ | RND / MUT / EQ |
| robert_168332 | 0.446 | 0.367 | 0.367 | 0.384 | 0.359 | RND / RND / PR | RND / PCA / EQ |
| semeion_9964 | 0.887 | 0.869 | 0.863 | 0.915 | 0.915 | RND / MUT / EQ | RND / RND / PR |
| ss_9965 | 0.994 | 0.989 | 0.987 | 0.999 | 0.999 | RND / RND / PR | RND / RND / PR |
| volkert_168331 | 0.608 | 0.56 | 0.56 | 0.557 | 0.555 | RND / RND / PR | RND / RND / PR |
2.2 The effect of scale for tabular data classification
We begin with a short empirical study of the effect of the number of supplied labelled samples on the accuracy of our compared algorithms (TabPFN and CatBoost), noting the following interesting facts:
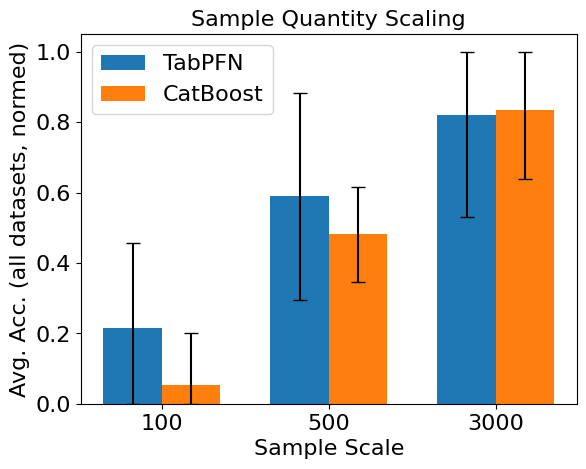
(i) Although the authors of TabPFN do not recommend using the model beyond its 1000-sample context length limit [hollmann_tabpfn_2023] without retraining, using larger context lengths can lead to significant gains. In Fig. 1, we ablate the effect of using different quantities of samples. We consider 100, 500, and 3000 samples for both CatBoost and TabPFN. Whiskers represent one standard deviation from the mean. Feature subsets are taken using mutual information, sampling is random, and class weighting is proportional.
(ii) Performance improves on most datasets as context length increases from 100 to 3000 samples, but the gains are far more pronounced in CatBoost than in TabPFN.
(iii) TabPFN often outperforms CatBoost at sample sizes up to 1000, and remains highly competitive above that threshold. That said, we acknowledge that with a more rigorous parameter search, either model may be capable of exceeding our reported metrics (achieved using random hyperparameter sweeps).
2.3 Sketching for tabular in-context learning
Context length often limits the usefulness of TabPFN (Fig.1). Therefore, when reducing the given number of samples to a smaller subset, we wish the subset to preserve as much useful context from the original dataset. Since the utilization of context by the model is not explicitly known, we turn to empirical investigation. The summarization of context samples may depend on the samples themselves , their labels , or both. We study these factors independently: we examine summarization methods for , and apply them according to the labels in one of two manners: equal: having a similar amount of samples from each label; and proportion: keeping the number of samples from each label proportional to their abundance in the original data.
In terms of the samples summarization method, we investigate a few options: random: picking a random subset of samples. K-means: Choosing the samples as the K-means cluster centers of the original data, where is determined according to . CoreSet agarwal2005geometric: Choosing an sized CoreSet. We implement our methods using the faiss library. [johnson2019billion]
Results. We summarize the results in Tab. 1.
A key takeaway is that in all our experiments except one, we find that random sub-selection of samples works as well as any other method, making it a strong baseline for future experiments.
CatBoost does show a statistically significant benefit from KMeans sketching on the mfeat-factors dataset. Intriguingly, mfeat-factors only has 2000 samples in the dataset; it is probable that sampling with replacement using the equal strategy leads to a better sample emphasis with -means, compared to random sampling (by having a less biased model).
Sampling values in an equal (vs. proportional) manner is beneficial on 21% of datasets when using CatBoost, and on 16% of datasets when using TabPFN. In some cases, the difference is quite large; the best context-summarization for TabPFN / riccardo using equal sampling attained an accuracy of %, compared to just % when using proportional sampling.
2.4 Feature dimensionality reduction for tabular in-context learning
We investigate three options for feature dimensionality reduction: random reduction: picking a random subset of features. mutual information: selects features with high mutual information to the target dataset [vergara2014review]. PCA: taking the first principal components. For the latter we use the scikit-learn implementations [scikit-learn].
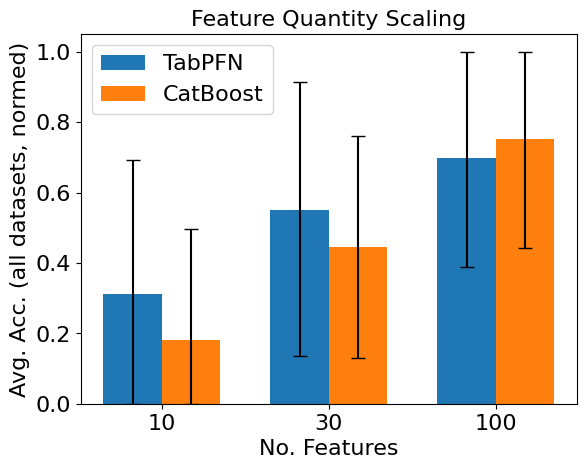
We find that feature subsampling often has a significant effect on classifier performance, and that the in-context classification method of TabPFN is more dependent on feature selection than that of CatBoost. 4 of our datasets have more than 256 features; (riccardo, Robert, Fashion-MNIST, CIFAR-10). For Robert, FashionMNIST, and riccardo, the best TabPFN setting with mutual information or PCA feature selection outperforms random reduction. See Tab. 1.
On a related note, we report in Fig. 1 the mean normalized performance for both TabPFN and CatBoost with 10, 30, and 100 features. Whiskers represent one standard deviation from the mean. Feature subsets are taken using mutual information, sampling is random, and class weighting is proportional. While both models improve with more samples, the effect is more pronounced and consistent in CatBoost; as feature quantity scales up, performance is the same or better on all datasets. When we reduce the feature space in TabPFN from 100 to 10 features, performance improves on two datasets (higgs and connect-4). This indicates that in-context tabular classification may be more sensitive to the presence of spurious features than supervised methods.
|
|
3 Related works
Evaluation of deep learning for tabular data.[deepnns] introduced into the literature TabSurvey, an exhaustive comparison between existing deep learning approaches for heterogeneous tabular data. Their work was extended recently by [mcelfresh_when_2023]. Like our work, the latter directly compares CatBoost and TabPFN with sample and feature sketching. We extend this considerably, demonstrating the effects of data scaling and the comparative importance of feature and sample selection methods.
Active learning. Another relevant line of works considered selecting an optimal subset of a dataset to be labeled hacohen2022active; yehuda2022active; sener2017active. While this field mostly looks to ease the labeling burden, rather than to save computational resources, it also looks to effectively reduce the number of samples included in the training set.
Efficient attention mechanisms for transformers. The runtime and memory usage of transformer architectures such as TabPFN grows quadratically with the number of training samples, placing severe computational bounds on their ability to scale. A wide range of efficient attention mechanisms have been proposed as a workaround for this limitation. press2021train; chen2023extending; sun2022length; xiao_efficient_2023; han_hyperattention_2023 We consider such mechanisms an important direction for future research into scaling TabPFN.