Direct Observation of Entangled Electronic-Nuclear Wave Packets
Abstract
We present momentum resolved covariance measurements of entangled electronic-nuclear wave packets created and probed with octave spanning phaselocked ultrafast pulses. We launch vibrational wave packets on multiple electronic states via multi-photon absorption, and probe these wave packets via strong field double ionization using a second phaselocked pulse. Momentum resolved covariance mapping of the fragment ions highlights the nuclear motion, while measurements of the yield as a function of the relative phase between pump and probe pulses highlight the electronic coherence. The combined measurements allow us to directly visualize the entanglement between the electronic and nuclear degrees of freedom and follow the evolution of the complete wavefunction.
I Introduction
The interplay between electronic and nuclear dynamics is at the forefront of attosecond science and of fundamental importance for understanding energy flow at the molecular level [1, 2, 3, 4, 5]. Of particular interest is the role that electronic coherences play in driving basic photophysical processes such as photoisomerization, light harvesting, and how these coherences are affected by nuclear dynamics [6, 7]. While electronic coherences in atoms can last for several nanoseconds and have been studied extensively [8, 9, 10], measurements of coherences in large molecules have been limited to a few femtoseconds [11, 12, 13, 14, 15, 16, 17, 18], or in special cases a few tens of femtoseconds [19].
The rapid loss of electronic coherence is driven by the coupling between the electrons and the nuclei. This can be seen by writing the full molecular wave function after photo-excitation in a Born-Huang (Oppenheimer) expansion:
| (1) |
where represents the th electronic state of the molecule and represents the nuclear wavefunction on the th electronic state. The frequencies in the exponent are defined by the formula , where is the potential energy surface of state as a function of the nuclear coordinate . The coefficients can depend on time because internal conversion or intersystem crossing can lead to a changes in the population of a given electronic state; however, this is not relevant in this experiment.
The wave packet described by Equation 1 can be created by multiphoton absorption using a very short (2 cycle) pulse [20], such that the excitation is dominated by a single sub-cycle of the pulse. In the case of –photon absorption, the effective bandwidth of the order Rabi frequency is times the spectral bandwidth, allowing for excitation of multiple electronic states for any given photon order. When driving –photon absorption, it is natural to expect order excitation of nearby states [20, 21, 22].
Here we focus on the special case of Equation 1 for two excited states which are separated by one photon order (e.g., 4– and 5–photon absorption). The off diagonal term of the density matrix, which expresses the electronic coherence is given by:
| (2) |
In our experiment we are considering an –photon absorption to the state 1, and –photon absorption to state 2 by the pump pulse, which we can write as . Subsequently, a probe pulse doubly ionizes both excited states with –photon and –photon absorption, respectively. Double ionization is established by velocity map imaging measurements of fragment ions in covariance [23, 24]. The pump and the probe pulses are phase-locked and the probe pulse is delayed by , so we can write the electric field as , where we control the phase and delay with our pulse-shaper. Making use of the expression for given above, we can express the dication yield as:
| (3) |
Here, and represent the ionization amplitudes for states 1 and 2, which are proportional to the and power of the electric field of the probe:
| (4a) | ||||
| (4b) | ||||
where and are the matrix elements for ionization from state 1 or 2 respectively into the final dicationic state . Integrating over , one can arrive at an expression for the ionization yield in terms of the delay and phase that we control [25]:
| (5) |
This expression highlights the phase dependence of the ionization yield and three mechanisms for electronic decoherence. The first is the loss of wavefunction overlap – the decay of the product . The second is dephasing – an dependent phase advance , which washes out the integrated yield. The last is the loss of population, i.e., the decay of the coefficients via internal conversion or intersystem crossings. All three contributions to decoherence can be suppressed for states with parallel potential energy surfaces, which can minimize internal conversion and dephasing, and for which the wave packet evolution is very similar, maintaining the overlap. Furthermore, if one is able to perform –resolved measurements, then one can further mitigate dephasing since one limits the range in over which the phase term is integrated. Here, we experimentally demonstrate long lived electronic coherences between dissociative states of a polyatomic molecule with parallel potential energy surfaces, and illustrate how covariance velocity map imaging of the fragment ions arising from the dication (providing KER resolved measurements) allows us to directly view the entangled electronic and nuclear degrees of freedom, which leads to dephasing and the decay of electronic coherence.
There have been many studies that aim to determine the dominant mechanism for the loss of coherence [17, 3, 19, 26, 27, 28, 29, 30]. While the dominant mechanism can depend on the details of the molecular system, calculations support the idea that vibrational dephasing can be mitgated in states with parallel potentials, leading to long lasting coherences [27].
In earlier work [22], we found parallel potentials for relatively low–lying states of the molecule Thiophene – states involving excitation of lone pair orbitals. Here we consider excitation of high lying Rydberg states, for which the potential energy surfaces are approximately parallel [22, 31].
In this paper we study entangled nuclear-electronic wave packets in 1,1,1-Trifluoroacetone (3F-Acetone). Via multi-photon excitation, we excite the molecule to a pair of high-lying Rydberg states of the neutral molecule. We then follow the evolution of electronic coherences between these two states and demonstrate how electronic coherences can be maintained even in the face of large amplitude nuclear motion (i.e., dissociation).
II Experimental Method
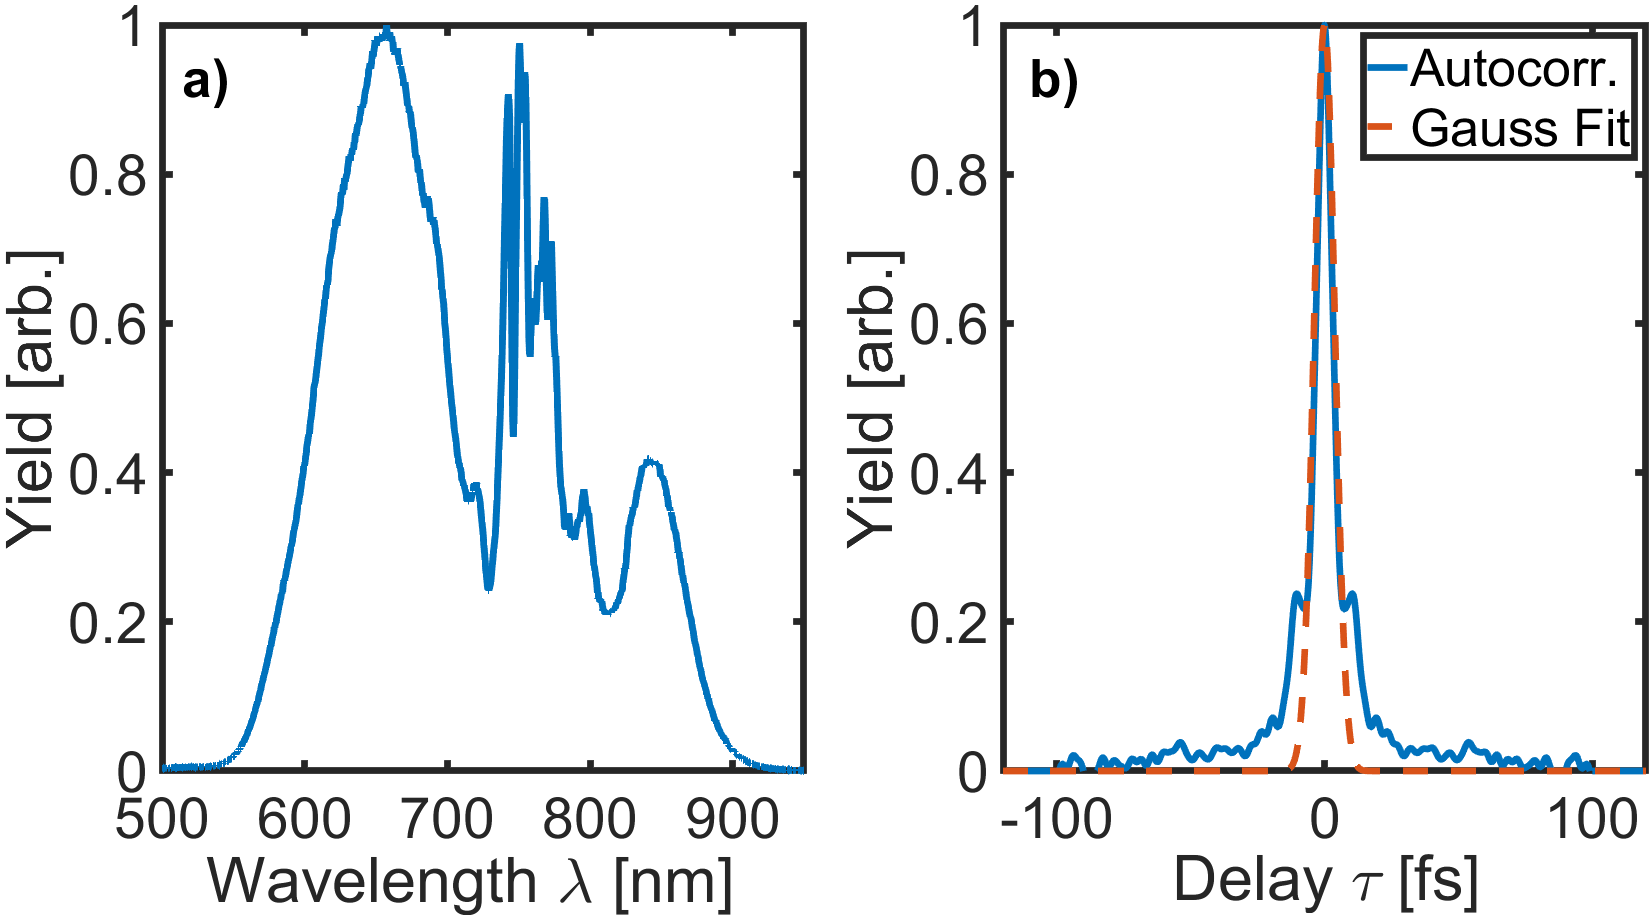
We carried out measurements using a commercial amplified titanium sapphire laser that produces 30–fs pulses at 1 kHZ with up to 1–mJ pulse energy. The 30–fs pulses are spectrally broadened using an Argon-filled 2.1–m long hollow–core fiber with inner diameter of 450 m (see Figure 5 in the Appendix for the spectrum). The broadened pulses are then compressed and shaped using an acousto-optic modulator (AOM) pulse shaper [32].
The initial electric field is shaped in the frequency domain (at the Fourier plane of the pulse shaper) by an acoustic mask programmed onto the AOM to produce a pump-probe pulse pair. The shaped electric field is given by . For control of the pump-probe delay and relative phase between the pulses, we choose a mask of the form
| (6) |
where controls the overall amplitude, the relative amplitude (, the relative phase and the relative delay between the two pulses. The quantity is the locking frequency and writes a delay dependent relative phase such that there is always constructive interference at the frequency (for ), regardless of the delay between the two pulses. Thus the controllable phase of the laser can be described by .
In addition to control of the pulse pair, the pulse shaper also allows us to characterize the pulses we generate. We perform pulse-shaper-assisted, second harmonic generation collinear frequency resolved optical gating (PS-CFROG) to determine the temporal profile of our pulses [32]. The resulting compressed and shaped pulses have a minimum duration of 7 fs FWHM (see Figure 5 in the appendix). We made extensive use of the AOM pulse shaping capability to compress, control, and characterize the laser pulses [32].
The shaped pulses are focused onto an effusive molecular beam of 3F-Acetone inside the velocity map imaging spectrometer using a 5 cm focal length concave silver mirror, which is inside the vacuum chamber. The base pressure of the vacuum chamber is Torr. The molecule 3F-Acetone is introduced into a separate sample chamber, and then skimmed into the reaction chamber in order to yield an effusive beam. This effusive beam overlaps with the laser focus at the center of our VMI apparatus. The partial pressure of 3F-Acetone inside the reaction chamber was kept around Torr in order to yield the desired count rate of around ion hits per laser shot.
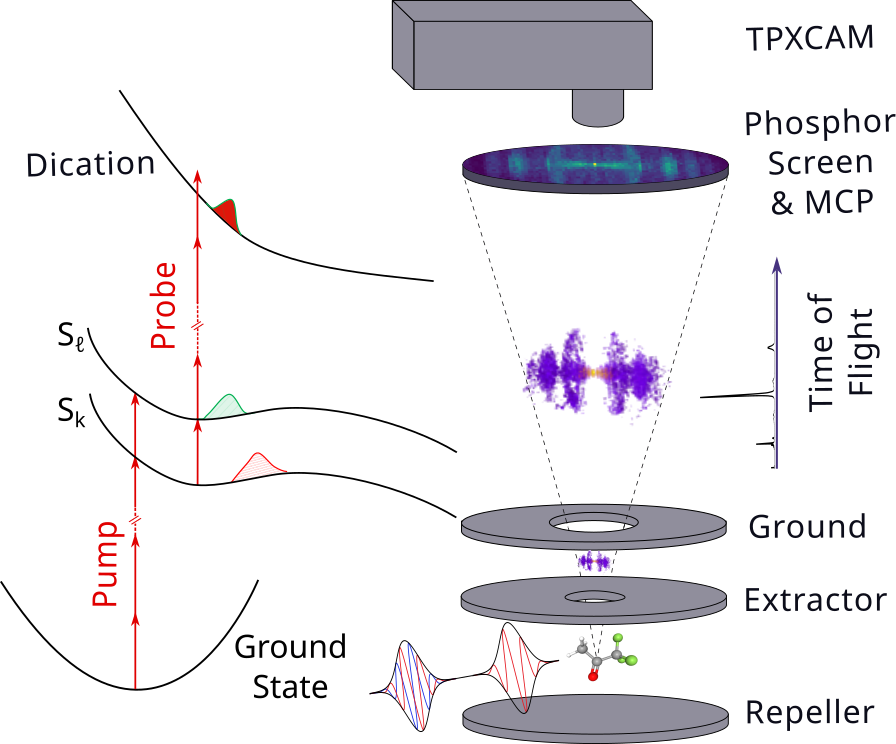
We collect ion momentum data using a velocity map imaging system, which has funnel micro channel plates with open area of 90% and a P47 phosphor screen (depicted schematically in Figure 1). The hits are recorded by a Timepix camera, whose pixels have a time of arrival resolution of 1.5 ns [33, 34], allowing us to simultaneously record and resolve all of the fragment ions produced in a given laser shot. Furthermore, the Timepix camera allows us to reconstruct the 3D momentum of ions using the time of flight of ions and their position () without the need for Abel inversion [35, 34]. We estimate the peak laser intensity for an unshaped laser pulse at the focus to be 550 TW/cm2 (corresponding to individual pump and probe intensities of about 230 TW/cm2 and 550 TW/cm2, respectively), which we have obtained from the cutoff of above-threshold ionization of Argon.
III Results
We measured the momenta of fragment ions from 3F-Acetone in covariance as a function of the delay and the relative phase between the two pulses. We focus on the fragmentation of the molecule along the CF3–COCH3 bond using covariance velocity map imaging. In particular, we look at the correlation of CF and COCH ions in the dataset on a shot by shot basis, which allows us to hone in on the dissociation along the CF3–COCH3 coordinate. Working in covariance provides the same information as coincidence, but allows us to work in a higher count rate regime [23, 36, 37, 24].
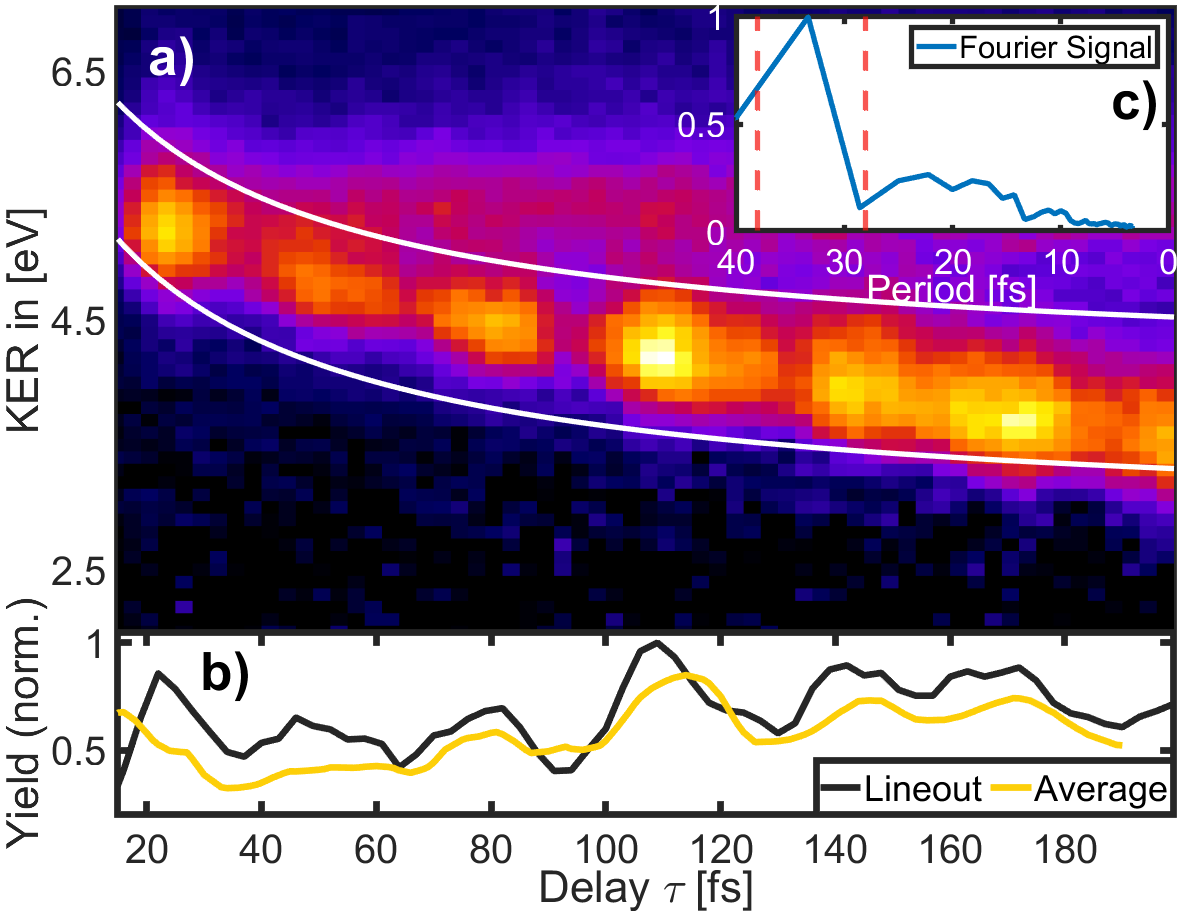
In Figure 2 we present the results of the pump-probe measurements, which show the energy resolved covariance yield of CF and COCH ions as a function of the pump-probe delay. Measuring these two fragment ions in covariance and checking for momentum conservation confirms that they come from the same molecular dication, and allows us to draw some simple conclusions about the dynamics between pump and probe pulses. There are two prominent features in Figure 2: the kinetic energy release decreases with pump–probe delay, and the covariance yield is modulated with a period of fs. The monotonic decrease in kinetic energy release with pump–probe delay is consistent with dissociation along this bond, while the modulations in the yield are consistent with vibrations during dissociation.
As the KER resolved pump–probe measurements of the fragment ions point toward dissociative dynamics, we considered electronic states of both the neutral and monocation. The ground state of the monocation is dissociative along the COCH–CF3 coordinate [38, 39], meaning that the dynamics could take place on low lying states of the cation or high lying Rydberg states of the neutral, which are parallel to the lowest cationic state. We argue below based on phase dependent measurements that it is unlikely to be cationic states.
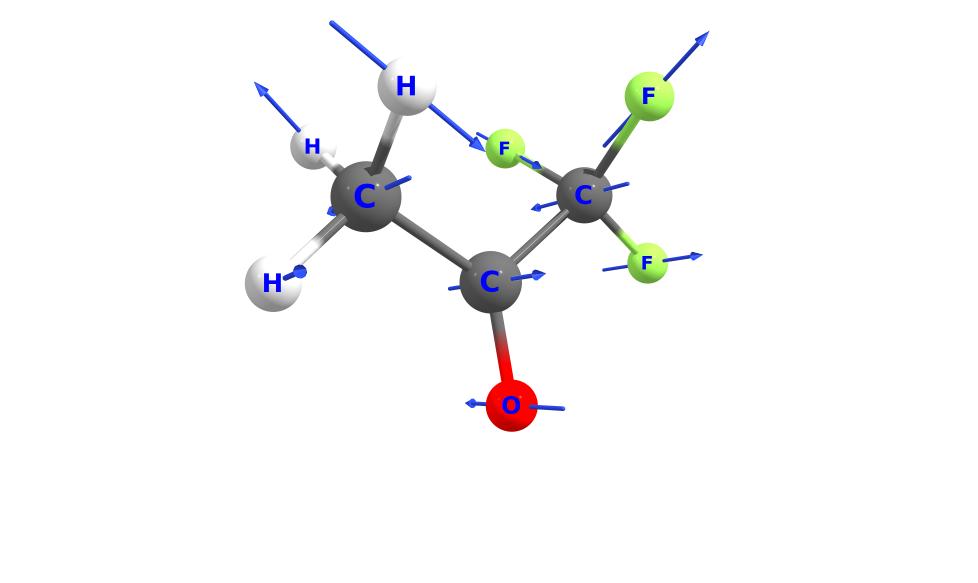
In order to interpret the modulations in the covariance yield, we calculated the vibrational frequencies of the neutral ground state at the B3LYP level of theory. The modes with frequencies near the measured modulation frequency are listed in (Table 1) of the appendix. Given that we expect the excited states of the molecule to have slightly lower frequencies and that the modulations have a pronounced effect on the CF and COCH yield, we suspect that it is CF3 vibrations which are underlying the modulations in the measurements. In Figure 7 in the appendix we depict the motion of the anti-symmetric CF3 mode that might give rise to the modulations we see in Figure 2.
With the pulse shaper, we have the ability to perform pump–probe measurements with independent control over the phase and delay between pump and probe pulses. This allows us to confirm that the modulations in the covariance yield arise from a vibrational coherence rather than an electronic one. The bottom panel of Figure 2 compares the measurements carried out for a fixed phase between pump and probe pulses with measurements that are averaged over all phases at each delay. Both measurements show clear modulations in the yield, consistent with these arising from vibrations which modulate the ionization yield.
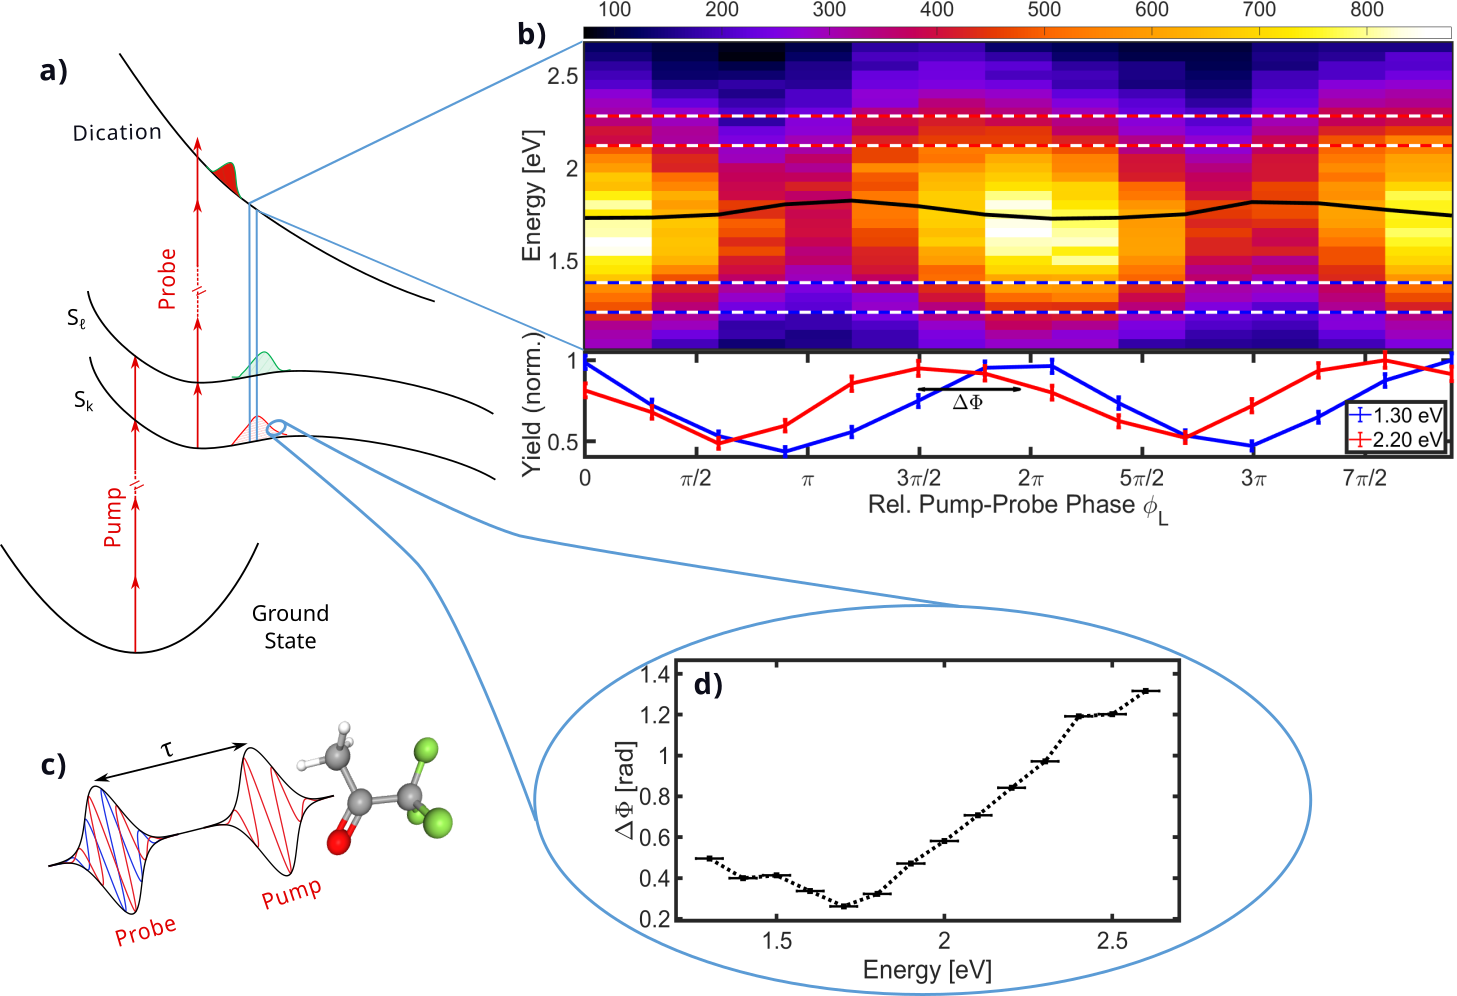
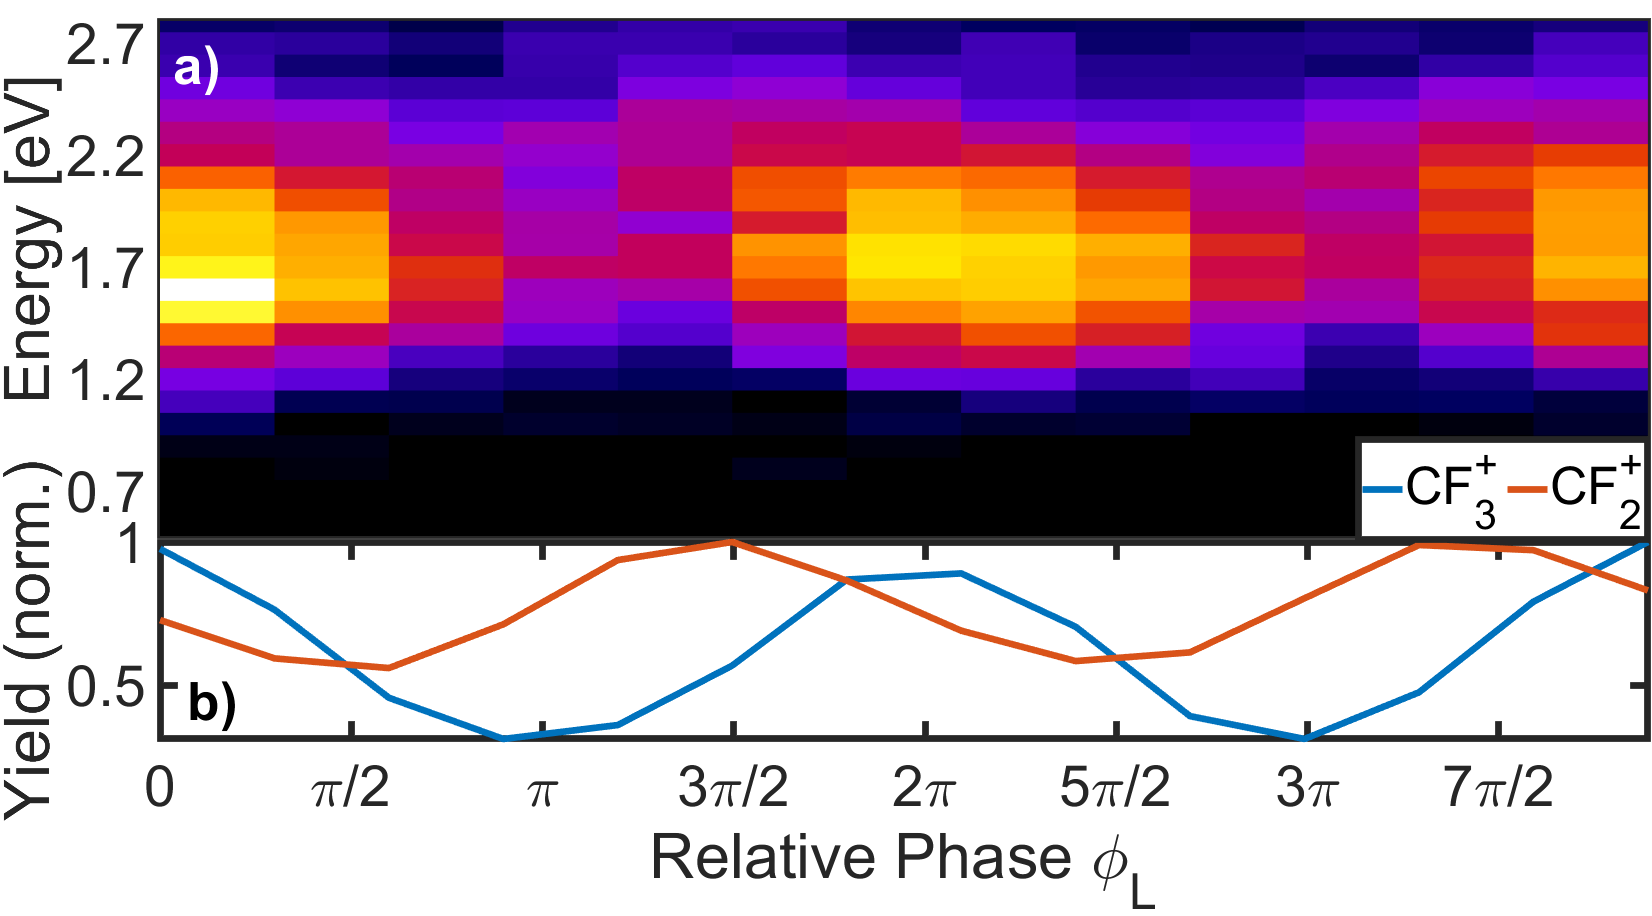
While pump–probe measurements which average over phase allow us to focus on vibrational dynamics, phase scans at fixed delays highlight electronic coehrences, as shown in Equation 5. In Figure 3 we present the phase scan at a fixed delay of 95 fs. We chose this delay partially to rule out any optical interference between the pump and the probe pulses, and partially to highlight the long lived electronic coherences which persist during dissociation. In the appendix we detail how we have ruled out optical interference of the two pulses. Since we see a single modulation of the energy resolved yield in Figure 3 within 2 phase, as opposed to multiple modulations within 2, the states that contribute to the electronic coherence must be separated by a single photon energy 111In general, if the states were separated by photons we would see modulations within as the phase term in Equation 5 would become .
Single point electronic structure calculations at the Frank–Condon point for the ion show that there are no pairs of states of the cation that are separated by a single photon. We thus conclude that the electronic coherence is coming from high–lying states of the neutral molecule. The fact that the states are high lying also has the consequence that the potential energy surfaces are likely close to being parallel to each other [22, 31]. This effect decreases the decoherence of the two states due to loss of wave function overlap as outlined in the introduction.
Figure 3 shows an explicit manifestation of entanglement between nuclear and electronic degrees of freedom. Here we plot the energy resolved yield of the CF fragment, instead of the covariant kinetic energy release from CF and COCH since the statistics are better for the single fragment yield. We have, however, used the covariance method to confirm that the plotted yield is indeed coming from the dissociation along the CF3–COCH3 bond. Note that the kinetic energy of the CF fragment is determined by the CF3–COCH3 distance. As the kinetic energy of the CF changes, so does the position of constructive interference of the two wave packets. This is highlighted by the variation in the first moment of the energy distribution, which is plotted in black on top of the 2D color plot. We make this connection explicit by plotting in panel d) the phase shift, , between the different lineouts (black arrow shown with the red and blue curves in the bottom of panel b)) from Figure 3 as a function of kinetic energy of the CF fragment.
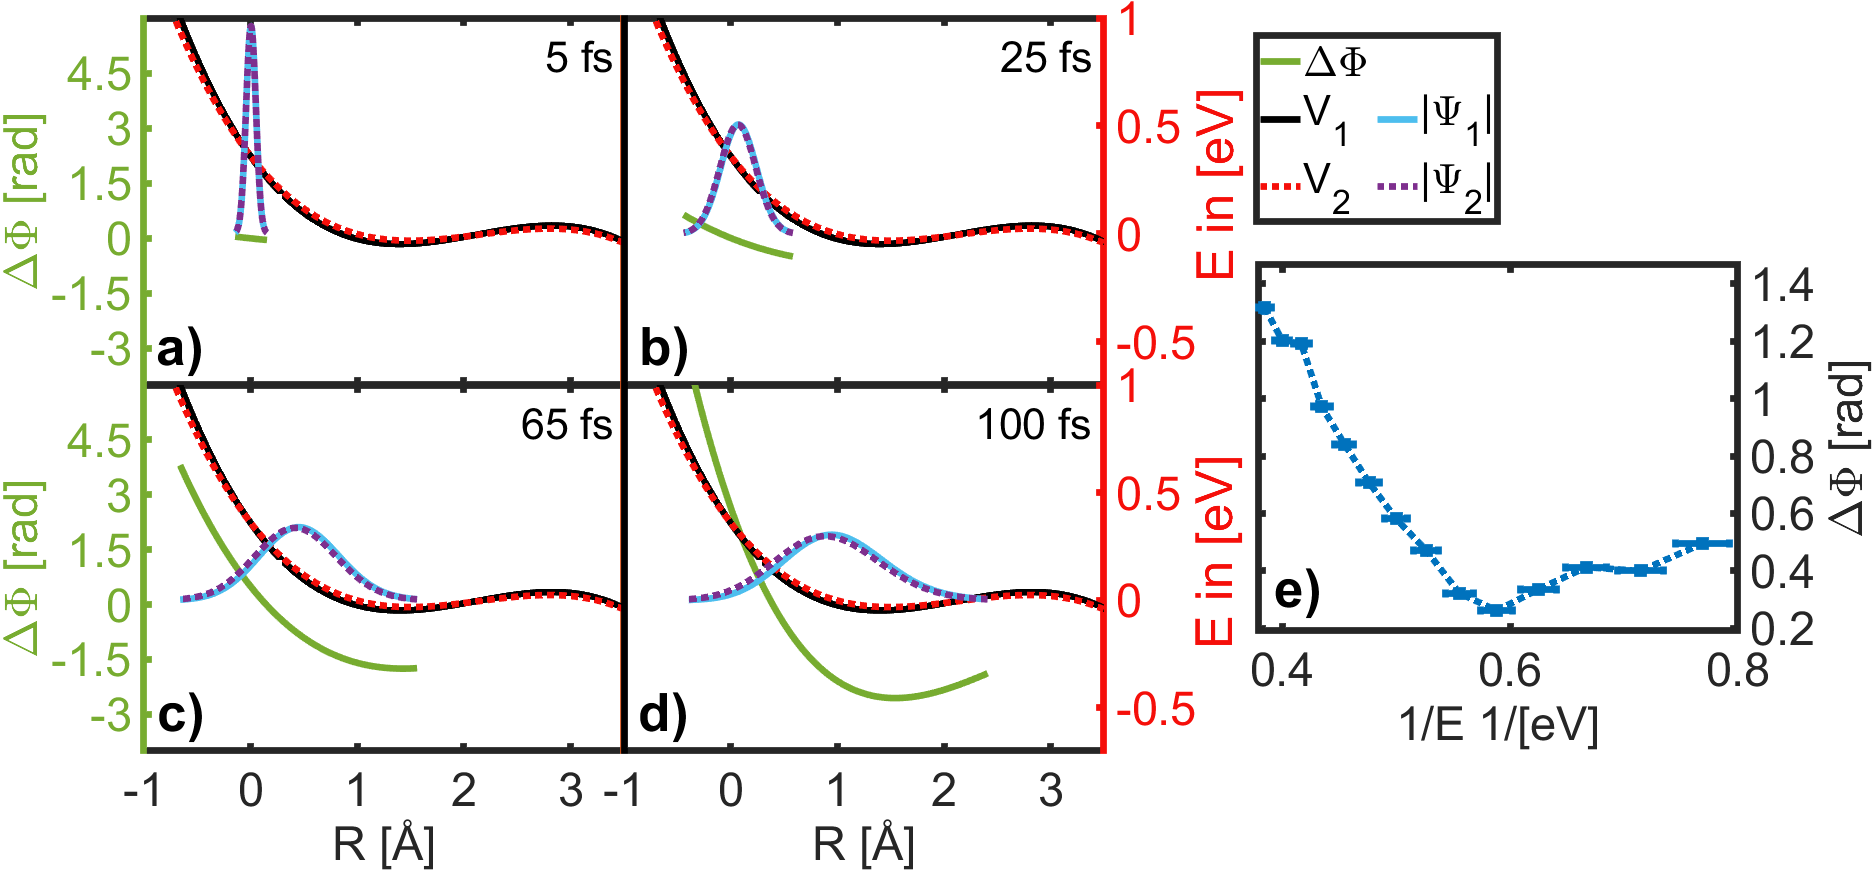
As a test of the basic idea that our measurements are sensitive to the KER dependent (and thus the coordinate dependent) phase difference between the wave functions on the two electronic states, we carried out calculations where we solve the time dependent Schrödinger equation (TDSE) for a model 1D potential. We consider two wave packets propagating on slightly different parallel potentials. We employ the split operator formalism to propagate the initial wave functions on the two dissociative potentials and plot the evolution of the phase difference between the two wave-functions. Figure 4 shows the results of the calculations. We see a qualitative agreement between the measured phase difference and the phase difference of two wave-functions. The potential used in the calculations is based on our expectation for the high lying Rydberg states of the molecule, which are parallel to the ground state of the molecular cation [31, 38]. We defined the potential in the calculations as a cubic spline between four points, roughly setting the position of the initial roll down, the minimum, the barrier height and the roll down after the barrier. We fixed these four points and generated a series of potentials by randomly varying around these points in order to determine the sensitivity of the calculations to the details of the potential energy curve on which the wave packets evolve. Our calculations showed the same qualitative features independent of the exact shape of the potential: As shown in panel (a), the wave packets initially have very little phase difference because they haven’t propagated on the potentials for enough time to develop a phase difference. As the wave packets pick up momentum on slightly different potentials, we see a linear phase difference between them (b). As the wave packets further progress down the potential and experience less acceleration or are slowed down by the barrier, the linear phase difference evolves into a hockey stick shaped feature (c)–(d). We have confirmed that this hockey stick shaped feature in panel (c) persists qualitatively as we vary the potentials around the fixed points. This furthers our interpretation that the measurements we show in Figure 3 are indeed resulting from the coherent interference of two wave-packets propagating on approximately parallel dissociative potential energy surfaces.
IV Conclusion
In conclusion, we have presented measurements of entangled nuclear–electronic wave packet dynamics in a multimode molecular system. In particular, we have observed a pump–probe phase–dependence of the energy resolved yield of molecular fragments (Figure 3). A phase locked pump–probe pulse pair launches and interrogates the wave packet dynamics via multiphoton excitation and ionization. Fragment ions are measured with momentum resolved covariance velocity map imaging. In the pump–probe scan we observe a dissociation along the CF3–COCH3 bond which is coupled with vibrational excitation of the molecule (Figure 2). Our measurements highlight the entanglement between electronic and nuclear degrees of freedom, and demonstrate the maintenance of electronic coherence despite large amplitude nuclear motion.
Acknowledgements
G.M., B.K., C. C. and T.C.W. were supported by the National Science Foundation under award number 2110376. I. B-I was supported by the Chemical Sciences, Geosciences, and Biosciences Division, Office of Basic Energy Science, Office of Science, U.S. Department of Energy, under Award No. DE-FG02-86ER13491.
Conflict of Interest
The authors declare that they have no conflicts of interest.
Data Availability
The data that support the findings of this study are available from the corresponding author upon reasonable request.
Appendix
We took care in ruling out any optical interference between the pump and the probe pulses. We checked for optical interference in two independent ways. The first was to perform detailed pulse characterization measurements, using PS-CFROG to characterize the pulses. In Figure 5 we plot the spectrum and the CFROG of the compressed pulse. Note that while there is some structure in the pulse around 10 fs, there are no pre or post pulses at longer ( 95 fs) delays where we carry out our interference measurements.
Our second independent check is looking at the phase dependence of different fragment ions. If optical interference were giving rise to the modulations seen in Figure 3 it would be because the total electric field varies with phase as a result of constructive and destructive interference. In this case the phase dependence of the yields of all fragments in a given dataset would be the same because the modulations are only due to variation in the total intensity. This is, however, not the case as we show in Figure 6. There we can see that the CF and CF yields are phase shifted relative to each other. Combined with our characterization of the pulses, we conclude that the phase variation is due to dynamics in the molecule and is not an optical interference effect.
| Assignment [41] | Frequency [cm-1] | Period [fs] |
|---|---|---|
| CH3 symmetric rock | 962 | 35 |
| CH3 antisymmetric rock | 1027 | 32 |
| CF3 symmetric stretch | 1131 | 29 |
| CF3 antisymmetric stretch | 1189 | 28 |
References
- Corkum and Krausz [2007] P. B. Corkum and F. Krausz, Nature physics 3, 381 (2007).
- Palacios and Martín [2020] A. Palacios and F. Martín, Wiley Interdisciplinary Reviews: Computational Molecular Science 10, e1430 (2020).
- Koll et al. [2022] L.-M. Koll, L. Maikowski, L. Drescher, T. Witting, and M. J. J. Vrakking, Phys. Rev. Lett. 128, 043201 (2022).
- Vrakking [2022] M. J. J. Vrakking, Journal of Physics B: Atomic, Molecular and Optical Physics 55, 134001 (2022).
- Vrakking [2021] M. J. J. Vrakking, Phys. Rev. Lett. 126, 113203 (2021).
- Duan et al. [2017] H.-G. Duan, V. I. Prokhorenko, R. J. Cogdell, K. Ashraf, A. L. Stevens, M. Thorwart, and R. D. Miller, Proceedings of the National Academy of Sciences 114, 8493 (2017).
- Maiuri et al. [2018] M. Maiuri, E. E. Ostroumov, R. G. Saer, R. E. Blankenship, and G. D. Scholes, Nature chemistry 10, 177 (2018).
- Maeda and Gallagher [2004] H. Maeda and T. F. Gallagher, Phys. Rev. Lett. 92, 133004 (2004).
- Weinacht et al. [1998] T. C. Weinacht, J. Ahn, and P. H. Bucksbaum, Phys. Rev. Lett. 80, 5508 (1998).
- Yeazell et al. [1990] J. A. Yeazell, M. Mallalieu, and C. R. Stroud, Phys. Rev. Lett. 64, 2007 (1990).
- Arnold et al. [2017] C. Arnold, O. Vendrell, and R. Santra, Physical Review A 95, 033425 (2017).
- Halász et al. [2013] G. Halász, A. Perveaux, B. Lasorne, M. Robb, F. Gatti, and Á. Vibók, Physical Review A 88 (2013).
- Franco et al. [2008] I. Franco, M. Shapiro, and P. Brumer, The Journal of chemical physics 128, 244905 (2008).
- Scheidegger et al. [2022] A. Scheidegger, J. Vaníček, and N. V. Golubev, The Journal of Chemical Physics 156, 034104 (2022).
- Hwang and Rossky [2004] H. Hwang and P. J. Rossky, The Journal of Physical Chemistry B 108, 6723 (2004).
- Kamisaka et al. [2006] H. Kamisaka, S. V. Kilina, K. Yamashita, and O. V. Prezhdo, Nano letters 6, 2295 (2006).
- Vacher et al. [2017] M. Vacher, M. J. Bearpark, M. A. Robb, and J. a. P. Malhado, Phys. Rev. Lett. 118, 083001 (2017).
- Vacher et al. [2015] M. Vacher, L. Steinberg, A. J. Jenkins, M. J. Bearpark, and M. A. Robb, Phys. Rev. A 92, 040502 (2015).
- Despré et al. [2018] V. Despré, N. V. Golubev, and A. I. Kuleff, Phys. Rev. Lett. 121, 203002 (2018).
- Kaufman et al. [2022] B. Kaufman, P. Marquetand, T. Weinacht, and T. Rozgonyi, Physical Review A 106, 013111 (2022).
- Lunden et al. [2014] W. D. Lunden, P. Sándor, T. C. Weinacht, and T. Rozgonyi, Physical Review A 89, 053403 (2014).
- Kaufman et al. [2023a] B. Kaufman, P. Marquetand, T. Rozgonyi, and T. Weinacht, Phys. Rev. Lett. , (accepted) (2023a).
- Cheng et al. [2023] C. Cheng, L. J. Frasinski, G. Moğol, F. Allum, A. J. Howard, D. Rolles, P. H. Bucksbaum, M. Brouard, R. Forbes, and T. Weinacht, Phys. Rev. Lett. 130, 093203 (2023).
- Allum et al. [2021] F. Allum, C. Cheng, A. J. Howard, P. H. Bucksbaum, M. Brouard, T. Weinacht, and R. Forbes, J. Phys. Chem. Lett. 12, 8302 (2021).
- Kaufman et al. [2023b] B. Kaufman, P. Marquetand, T. Rozgonyi, and T. Weinacht, J. Phys. B , (submitted) (2023b).
- Matselyukh et al. [2022] D. T. Matselyukh, V. Despré, N. V. Golubev, A. I. Kuleff, and H. J. Wörner, Nat. Phys. 18, 1206 (2022).
- Vester et al. [2023] J. Vester, V. Despré, and A. I. Kuleff, J. Chem. Phys. 158, 104305 (2023).
- Dey et al. [2022] D. Dey, A. I. Kuleff, and G. A. Worth, Phys. Rev. Lett. 129, 173203 (2022).
- Vacher et al. [2016] M. Vacher, F. E. A. Albertani, A. J. Jenkins, I. Polyak, M. J. Bearpark, and M. A. Robb, Faraday Discuss. 194, 95 (2016).
- Csehi et al. [2020] A. Csehi, P. Badankó, G. J. Halasz, Á. Vibók, and B. Lasorne, Journal of Physics B: Atomic, Molecular and Optical Physics 53, 184005 (2020).
- Gibson et al. [1991] G. Gibson, R. Freeman, and T. McIlrath, Phys. Rev. Lett. 67, 1230 (1991).
- Catanese et al. [2021] A. Catanese, B. Kaufman, C. Cheng, E. Jones, M. G. Cohen, and T. Weinacht, OSA Continuum 4, 3176 (2021).
- Nomerotski [2019] A. Nomerotski, Nuclear Instruments and Methods in Physics Research Section A: Accelerators, Spectrometers, Detectors and Associated Equipment 937, 26 (2019).
- Cheng et al. [2020] C. Cheng, R. Forbes, A. J. Howard, M. Spanner, P. H. Bucksbaum, and T. Weinacht, Phys. Rev. A 102, 052813 (2020).
- Zhao et al. [2017] A. Zhao, M. van Beuzekom, B. Bouwens, D. Byelov, I. Chakaberia, C. Cheng, E. Maddox, A. Nomerotski, P. Svihra, J. Visser, V. Vrba, and T. Weinacht, Review of Scientific Instruments 88, 113104 (2017).
- Cheng et al. [2022] C. Cheng, V. Singh, S. Matsika, and T. Weinacht, J. Phys. Chem. A 126, 7399 (2022).
- Boguslavskiy et al. [2012] A. E. Boguslavskiy, J. Mikosch, A. Gijsbertsen, M. Spanner, S. Patchkovskii, N. Gador, M. J. J. Vrakking, and A. Stolow, Science 335, 1336 (2012).
- Cardoza et al. [2005a] D. Cardoza, M. Baertschy, and T. Weinacht, Chem. Phys. Lett. 411, 311 (2005a).
- Cardoza et al. [2005b] D. Cardoza, M. Baertschy, and T. Weinacht, J. Chem. Phys. 123 (2005b).
- Note [1] In general, if the states were separated by photons we would see modulations within as the phase term in Equation 5 would become .
- Durig and Church [1980] J. R. Durig and J. S. Church, Spectrochimica Acta Part A: Molecular and Biomolecular Spectroscopy 36, 957 (1980).