The Asteroseismological Richness of RCB and dLHdC Stars
Abstract
RCB stars are solar-mass objects that can exhibit large periods of extinction from dust ejection episodes. Many exhibit semiregular pulsations in the range of days with semi-amplitudes of magnitude. Space-based photometry has discovered that solar-like oscillations are ubiquitous in hydrogen-dominated stars that have substantial outer convective envelopes, so we explore the hypothesis that the pulsations in RCB stars and the closely related dustless hydrogen-deficient carbon (dLHdC) stars, which have large convective outer envelopes of nearly pure helium, have a similar origin. Through stellar modeling and pulsation calculations, we find that the observed periods and amplitudes of these pulsations follows the well-measured phenomenology of their H-rich brethren. In particular, we show that the observed modes are likely of angular orders and and predominantly of an acoustic nature (i.e. -modes with low radial order). The modes with largest amplitude are near the acoustic cut-off frequency appropriately rescaled to the helium-dominated envelope, and the observed amplitudes are consistent with that seen in high luminosity () H-rich giants. We also find that for , an HdC stellar model exhibits a radiative layer between two outer convective zones, creating a -mode cavity that supports much longer period ( days) oscillations. Our initial work was focused primarily on the adiabatic modes, but we expect that subsequent space-based observations of these targets (e.g. with TESS or Plato) are likely to lead to a larger set of detected frequencies that would allow for a deeper study of the interiors of these rare stars.
1 Introduction
R Coronae Borealis (RCB) stars are a class of hydrogen-deficient carbon (HdC) stars (for review, see, e.g., Clayton, 1996, 2012). While RCB stars normally have between and (e.g., Alcock et al., 2001; Tisserand et al., 2009), they often show large optical photometric declines (sometimes reaching 9 magnitudes) lasting years, caused by dust ejection episodes. Closely related to RCB stars are dustless hydrogen-deficient carbon (dLHdC) stars, which show RCB-like spectra but do not show dust ejection episodes (e.g., Warner, 1967; Tisserand et al., 2022). In this work, we do not distinguish between RCB and dLHdC stars, but use HdC as an umbrella term encasing both.
Two formation channels are proposed for RCB stars: the double-degenerate merger scenario (Webbink, 1984; Saio & Jeffery, 2002), where an RCB star is born from the merger between a He white dwarf (WD) and a carbon-oxygen WD, and the final He flash scenario (Iben et al., 1996), where a post-asymptotic giant branch star undergoes a late He shell flash. The former is favored in part because of the large ratio between and in RCB stars, which requires large amounts of formed from partial He burning be dredged up to the surface (Clayton et al., 2007; García-Hernández et al., 2010). In addition, recent 3D (Munson et al., 2021, post-merger evolution in 1D) and 1D merger simulations (Menon et al., 2013, 2019; Lauer et al., 2019; Crawford et al., 2020; Munson et al., 2022) have shown good agreement between the nucleosynthesis and the observed abundances in RCB atmospheres. Furthermore, the inferred number of galactic RCB stars (e.g., Tisserand et al., 2020) is broadly consistent with that expected from the He WD - CO WD merger rate (e.g., Ruiter et al., 2009; Karakas et al., 2015), whereas the final flash stars spend too little time in the RCB phase to explain the number of known RCB stars (Clayton et al., 2006). It has been suggested that dLHdC stars are similarly formed through mergers, but with different mass ratios (e.g., Karambelkar et al., 2022; Tisserand et al., 2022).
Ground-based studies of RCB stars show semiregular variability with photometric semi-amplitudes between 0.05 mag and 0.3 mag and radial velocity semi-amplitudes between 10 and 20 km s-1 (e.g., Alexander et al., 1972; Lawson et al., 1990, 1994; Lawson & Cottrell, 1997; Alcock et al., 2001; Percy et al., 2004; Percy, 2023). While Alexander et al. (1972) and Lawson & Cottrell (1997) suggest that the variability is due to radial pulsations, Feast et al. (2019) find no coherent periodicity in the long-term radial velocity observations of R CrB itself, and suggest that the variability is instead due to large surface convective plumes. However, Alcock et al. (2001) were able to extract periods for several HdC stars using MACHO data with a long base-line from 1992 to 1999 (e.g., star 18.3325.148 with 83.8 days, star 12.10803.56 with 50.5 days). Distinguishing between the effects of pulsations and surface convective plumes is an interesting observational question, but for the purpose of this paper, we proceed by interpreting periodic HdC variability as pulsations. The pulsation periods range from 20 days to days, but among 14 RCB stars studied by Percy (2023) using data from the All-Sky Automated Search for Supernovae (ASAS-SN; Shappee et al., 2014; Kochanek et al., 2017), the periods cluster between 30 and 50 days. Similar periods are found in the infrared light curves of 5 RCB stars (Karambelkar et al., 2021). Only 13 out of 32 dLHdC stars have detectable variability from ASAS-SN (Tisserand et al., 2022), with lower peak-to-peak photometric amplitudes of mag and shorter periods of days , and lower radial velocity amplitudes (Lawson & Cottrell, 1997; Tisserand et al., 2023).
Previous nonadiabatic calculations have suggested that the strange mode instability (for a review, see Saio, 2009), which exists in highly nonadiabatic and radiation pressure-dominated environments, could excite these pulsations both for radial (e.g., Saio et al., 1984; Gautschy et al., 1990; Saio et al., 1998; Saio, 2008; Goldstein & Townsend, 2020) and nonradial modes (Glatzel & Gautschy, 1992; Saio, 2008).
We argue here that HdC pulsations are solar-like oscillations (for a review of solar-like oscillations, see, e.g., Chaplin & Miglio, 2013), which are acoustic oscillations (-modes) stochastically excited by surface convection (see e.g., Goldreich & Keeley, 1977; Goldreich et al., 1994; Samadi & Goupil, 2001; Belkacem et al., 2006, for discussions on the excitation and damping mechanism), unlike self-excited pulsations driven by instabilities like the kappa mechanism. First discovered in the Sun, solar-like oscillations exist in all subgiants and red giants up to and beyond the tip of the red giant branch (e.g., Mosser et al., 2013; Stello et al., 2014; Yu et al., 2020). These discoveries were possible due to accurate photometric measurements enabled by space-based missions such as CoRoT (Baglin et al., 2006; De Ridder et al., 2009) and Kepler (Borucki et al., 2010; Beck et al., 2011). Discovery of solar-like oscillations has allowed for the asteroseismological derivation of a star’s mass and radius, as well as probes into its core structure (e.g., Bedding et al., 2011; Mosser et al., 2012a), core rotation rate (e.g., Beck et al., 2012; Mosser et al., 2012b), and internal magnetic fields (e.g., Fuller et al., 2015; Stello et al., 2016).
The power spectrum of solar-like oscillations consists of many sharp individual peaks whose heights follow a Gaussian-like envelope, with a frequency of maximum power, . Modes of the same angular degree but neighboring radial orders are separated by the large frequency separation, . The former scales as the acoustic cutoff frequency, (e.g., Kjeldsen & Bedding, 1995), where is the adiabatic sound speed, is the pressure scale height, and is the first adiabatic exponent.
HdC stars have neutral He-dominated atmospheres (mean molecular weight ), as opposed to for H-dominated stars. Since and for an ideal gas (e.g., Yıldız et al., 2016; Viani et al., 2017), we expect a correction factor for the solar-scaled relation when applied to HdC stars:
| (1) |
which corresponds to a period of d, in agreement with the observed period range for HdC stars.
For high radial order -modes, the large frequency separation is given by
| (2) |
which for our models yield, to within 20%,
| (3) |
which is about times the solar relation111For our fiducial model, eqn 2 is about times the solar relation at , and increases to at higher as increases. .
These simple estimates imply that HdC stars would exhibit solar-like oscillations in the period range that is observed and with radial orders of . Even at these low radial orders, we find that agrees with the asymptotic relation (eqn 2) within 10% for . Therefore, the use of to assign radial orders is still applicable.
We present evolutionary models and pulsation calculations for HdC stars to show that HdC could exhibit solar-like oscillations in the observed period range. In Sec 2, we construct 3 HdC star models with a CO core and a He-rich envelope. We then present adiabatic calculations for our fiducial model in Sec 3.1 and other models in Sec 3.2. Non-adiabatic calculations are summarized in Sec 3.3 and detailed in Appendix A. We conclude in Sec 4 by comparing to observations and highlighting future work.
2 H Deficient Stellar models
We prepare 3 non-rotating HdC models following Lauer et al. (2019); Schwab (2019); Crawford et al. (2020); Munson et al. (2022), using the Modules for Experiments in Stellar Astrophysics ( version ; Paxton et al., 2011, 2013, 2015, 2018, 2019; Jermyn et al., 2023). We adopt the Asplund et al. (2000) compositions for the majority RCB population, with , , , and . This implicitly assumes that chemical mixing between the core and envelope has occurred during and immediately after the merger, and so we do not include chemical mixing processes, unlike the aforementioned works. We adopt the (Marigo & Aringer, 2009) low-temperature opacity tables for varying CNO abundances. We adopt a mixing length parameter of and a metallicity of .
Our models mimic post-merger objects where the CO core has cooled after completing He burning. We accrete an envelope with the Asplund et al. (2000) composition onto a CO core with central temperature , and then inject entropy into the envelope to allow it to reach temperatures for He shell-burning and to expand to sizes typical for an HdC star. We experiment with different mass combinations, with and , and the effect of including wind mass loss (Bloecker, 1995, with efficiency factor ).
We perform adiabatic calculations with (version ; Townsend & Teitler, 2013; Townsend et al., 2018; Goldstein & Townsend, 2020), for angular degrees . The outer surface boundary condition is taken to be zero surface pressure. For most models, we excise the degenerate WD core, which eliminates mixed gravito-acoustic modes deep in the core and reduces computation cost. We take the inner boundary condition to be zero radial displacement. For a few models we explore the mixed gravito-acoustic modes with a full stellar model with a regularity inner boundary condition. In the following, we refer to the radial order as defined in Takata (2006). For , refers to that of the excised-core model, and not the full stellar model. We explore the non-adiabatic modes using the contour method (Goldstein & Townsend, 2020) in Sec 3.3 and Appendix A.
Our model names start with (initial He mass)+(initial CO mass), and if mass loss is involved, “ML” is added to the end. For example, the 0.20+0.50ML model has initially and and has a Bloecker (1995) wind mass loss.
Our and input and output files are available at Zenodo (https://doi.org/10.5281/zenodo.10139856).
3 Asteroseismic results
3.1 Adiabatic fiducial model
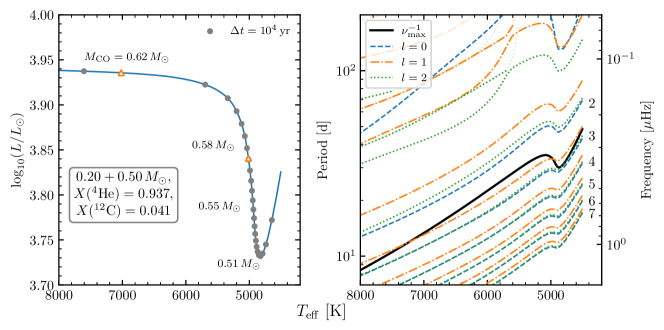
We first discuss model as our fiducial. The left panel of Figure 2 shows the evolution of this model on the Hertzsprung-Russell (HR) diagram. We only exhibit the long-lived phase of stable He shell burning. As He shell burning proceeds, the core mass grows to at a rate of appropriate for steady He burning, and the luminosity increases. This and other models follow a core mass-luminosity relation given by for to within 20%. The variance of 20% is due to varying initial CO core masses (e.g., Saio & Jeffery, 2002). As the envelope becomes exhausted, the model moves to higher toward the WD track. The mode periods of model during the evolution from low to high are shown in the right panel.
In general, is close in frequency to the modes, and we may observe a couple of modes (few ) around . As expected for higher radial orders, eqn 2 holds within for . It underpredicts by for . Eqn 3, which is times the solar relation, works for HdC stars to within 20% for all models.
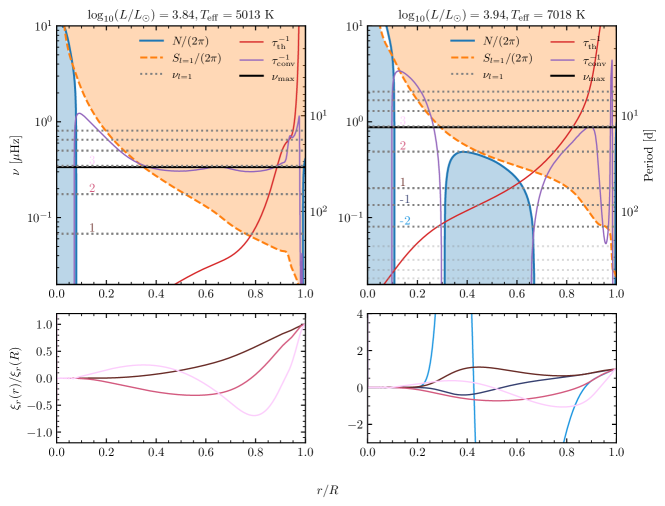
Mode propagation diagrams for two selected models are shown in Figure 4. Acoustic -modes have and , where and are the Brunt-Väisälä and Lamb frequencies squared, and propagate in the orange region. Gravity -modes have and , and propagate in the blue region. Elsewhere, the modes are evanescent. Note that the blue and white regions correspond to radiative () and convective zones (). As the -mode and -mode propagation regions overlap in frequency space, we expect modes with mixed characters from both (e.g., Osaki, 1975; Aizenman et al., 1977; Christensen-Dalsgaard, 2004; Dupret et al., 2009).
At low (left panel), the envelope is fully convective, whereas at high (right panel), the envelope shows two convective zones separated by a radiative zone. The deep convection zone is associated with the iron bump opacity peak, and the outer with the helium ionization zones. This radiative zone creates a -mode cavity in addition to that in the non-convecting core, thus creating mixed modes even when the CO core is excised. Some of the mixed modes have predominantly -mode character. If we examine their mode inertia, given by (e.g., Aerts et al., 2010; Dupret et al., 2009)
| (4) |
where and are the horizontal and radial displacement eigenfunctions, we find that these -dominated modes have much larger mode inertia than -dominated modes, since these -dominated modes have relatively larger amplitudes deep in the envelope where is higher. We show these -dominated modes as semitransparent lines in Figures 2 & 4. We note that the envelope radiative zone separating the two convection zones grows in extent with increasing . Detection of periods of days (as found in e.g., Lawson et al., 1990; Rao & Lambert, 2015; Karambelkar et al., 2021) would provide useful information on the envelope structure of HdC stars; such -d periods have been suggested by Lawson et al. (1990) to be non-radial pulsations as these periods appear longer than that predicted for the radial fundamental mode.
The non-convecting WD core creates another -mode cavity, allowing core -modes to couple to the envelope -modes. We calculate modes for the full stellar model corresponding to the models in Figure 4. These modes are shown as orange and green dots in the top panel of Figure 5. Each local minimum in mode inertia corresponds to a -dominated mixed mode, and agrees well with the excised-core modes which are shown as orange circles. Furthermore, the -dominated modes have identical eigenfunctions in the envelope between the excised-core models and full models (the latter are shown in the bottom panel of Figure 4). The successful recovery of the -dominated mixed modes supports our approach to perform most calculations with excised-core models.
For low frequency -dominated modes, the mode inertia agrees well between the full model and excised core model. However, as the frequency increases, the mode inertia of the full models increase relative to the excised-core models. The reason is that the evanescent region shrinks (white region in top panels of Figure 4) as the frequency increases, allowing for higher amplitude of the mode eigenfunctions near the core. The higher density there increases the mode inertia (see Eqn 4). This effect is stronger for modes than , because the Lamb frequency squared is higher for , which widens the evanescent region and weakens mode coupling for .
The bottom panels of Fig 5 show the difference in mode periods relative to the -dominated mixed modes, for , . Away from the -dominated mixed mode, the period spacing is regular and agrees well with , reflecting the asymptotic behavior of the core -modes which have . In this model, we removed by hand a spike in coming from an artificial composition discontinuity between the old CO core and the fresh CO from He shell burning , because we assumed C/O=50/50 for the core during initial model construction, but realistic burning produces fresh C/O; mixing during and after the merger, which we do not model, could smooth this composition discontinuity. Otherwise, the period spacing would not agree with the asymptotic relation, due to this buoyancy glitch (e.g., Cunha et al., 2015). Resolving any of the -dominated mixed modes could offer deep insights into the core structure of HdC stars as has been done for Kepler red giants (e.g., Bedding et al., 2011; Mosser et al., 2012a), but is a challenge given that days requires an observation time of yrs.
Our calculations do not capture the coupling between convection and oscillations. The convective eddy turnover timescale,
| (5) |
where is the convective speed, is comparable to the periods of the modes. This suggests that convection could play an important role for these modes. Furthermore, the local thermal timescale,
| (6) |
where is the heat capacity at constant pressure, is shorter than the mode periods over a large fraction of the stellar envelope, suggesting that non-adiabatic effects may be important, as we discuss in Sec 3.3 and Appendix A.
3.2 Other models
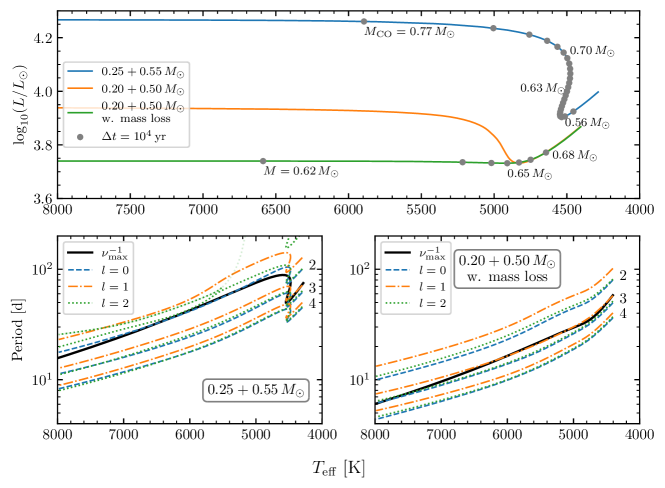
We explore the parameter space occupied by HdC stars by introducing models and ML. The HR diagrams of these two models are shown in the top row of Figure 7. Model (blue) represents a higher mass and higher luminosity HdC star () and has a lifetime of yr. For model ML (green), rapid mass loss decreases its mass down to once it reaches the HdC stage, accompanied by a drop in luminosity to . It then evolves to the blue at roughly constant luminosity as its mass decreases to . Its lifetime in the HdC stage ( yr) is shorter than without mass loss ( yr). This model represents a lower mass and lower luminosity HdC star, compared to model which has no mass loss (). Note that, as explored by Schwab (2019), the RCrB lifetime, total mass, and luminosity reached by the models sensitively depend on the mass loss prescription, with higher mass loss generally yielding a shorter lifetime, lower mass and lower luminosity.
Mode periods near are shown in the bottom row of Figure 7. Model (left panel) shows longer periods than model , and model ML (right) shows shorter periods, since the global dynamical timescale increases with radius. Because of its scaling as , the period corresponding to shows a similar trend, with closest to the mode in model , and mode in model ML.
3.3 Summary of non-adiabatic effects
We investigate non-adiabatic effects for modes in Appendix A. Unlike previous works (e.g., Wood, 1976; Weiss, 1987; Gautschy et al., 1990; Saio et al., 1998), our focus is not on the mechanism for self-excitation, but we are interested in how non-adiabaticity changes the real part of the frequency, particularly near . For models and ML, the mode frequencies near do not deviate from their adiabatic counterparts by more than . At where non-adiabatic effects are weak, the agreement is within 2%. Model behaves similarly at . However, at higher additional modes appear, and correspondence between the non-adiabatic and adiabatic modes becomes complicated.
4 Conclusion
In this work, we argue that HdC pulsations are, by nature, solar-like oscillations resulting from a vigorously convecting envelope. We use the solar-scaled relation to He-rich HdC stars, with a correction for He-rich compositions (Eqn 1) to focus our work on those modes most likely of large amplitude. We construct models with a CO core and He-rich envelopes, and perform adiabatic calculations for using . We find that is generally times the solar relation, and suggest a new relation (Eqn 3) that is times the solar relation and applies within 20% for He-rich objects. Modes near have radial orders , which means a few modes are excited for HdC stars, in agreement with observations that only one or two periods are observed for HdC stars (e.g., Karambelkar et al., 2021; Percy, 2023).
Our corrected for He-rich compositions matches the d periods typically found in RCB stars (Percy, 2023). As HdC star models move to higher , a radiative zone appears in the otherwise fully convective envelope, which creates a -mode cavity and may explain some of the longer periods ( days) observed in HdC stars (e.g., Lawson et al., 1990). As shown in Sec 3.2, a lower mass HdC star has a lower luminosity due to its smaller core mass. Because of its smaller radius, its pulsation periods (and period corresponding to ) are also shorter. This points to a smaller mass for dLHdC stars, which have shorter pulsation periods as well as lower absolute magnitudes than RCB stars ( days; Tisserand et al., 2022).
Space-based observations of solar-like oscillations in sub-giants and giants find a strong relation between the semi-amplitude of pulsations with the stellar luminosity, extending all the way up the red giant branch (e.g., Huber et al., 2011; Yu et al., 2018, 2020). At the brightest end (e.g. at the tip of the RGB and beyond into the AGB) these are fully convective, H-rich stars in the realms of the ground based studied long-period variables (e.g., Mosser et al., 2013; Stello et al., 2014; Yu et al., 2020). Though we have little available phenomenology for the HdC stars, their observed amplitudes ( mag) are consistent with comparably luminous H-rich counterparts ( mag; Yu et al., 2020), giving us additional confidence in our solar-like oscillation hypothesis. Whether the tendency of the observed modes in these luminous stars to be preferentially dipolar (Stello et al., 2014) also proves true in the HdC realm remains to be seen. HdC stars also have RV variability with peak-to-peak amplitude (e.g., Lawson & Cottrell, 1997; Tisserand et al., 2023). If interpreted as radial pulsations (however, see Feast et al., 2019), this would translate to a radial amplitude of , which seems reasonable given that this is around 10% of the stellar radius.
In addition, dLHdC stars have lower absolute magnitudes than RCB stars with the same color and shorter pulsation periods(Tisserand et al., 2022), which as our models show, hints that dLHdC stars may have lower masses. If true, then dLHdC stars are ideal for studying pulsations in HdC stars, not just because they do not show dust ejection episodes, but also because non-adiabatic effects are less important.
Future photometric studies of HdC stars using e.g., TESS (Ricker et al., 2014), Palomar Gattini IR (De et al., 2020) or Plato (Rauer et al., 2014), may uncover more pulsation periods for HdC stars. For example, due to revisits, TESS can observe some HdC stars over multiple pulsation periods. dLHdC stars are ideal targets for TESS since they show no declines and have shorter pulsation periods ( days; Tisserand et al., 2022) which is shorter than or comparable to TESS observation of a single sector (27 days). Determination of and could then yield asteroseismic masses and radii for HdC stars.
We also perform non-adiabatic calculations for . We find that at , the mode frequencies do not deviate much from their adiabatic counterparts, particularly near . This remains true at higher for models and ML, but additional modes appear for model which complicates mode identification. Nevertheless, most HdC stars studied by Crawford et al. (2023) have , which means non-adiabatic effects are likely unimportant for them.
Finally, these 1D models have envelopes that are significantly radiation pressure-dominated, with radiation pressure accounting for % of the total pressure. At the opacity peaks associated with the iron bump and the two helium ionization zones, the local luminosity is super-Eddington, creating a density inversion at the first helium ionization zone. Convection is likely inefficient in the sense of strong radiative losses. A 3D radiation hydrodynamic simulation similar to Jiang et al. (2018) will provide much deeper insights into the envelope structure, and may furthermore clarify whether HdC variability is due to pulsations or surface convective plumes (e.g., Feast et al., 2019).
Appendix A Non-adiabatic effects
At low (), the non-adiabatic modes show a clear correspondence with the adiabatic modes. The correspondence can be tracked on the complex frequency plane (i.e., vs ) by gradually scaling the local thermal timescale by a factor , from a large number corresponding to the adiabatic limit, to corresponding to the non-adiabatic limit (e.g., Saio et al., 1984; Gautschy et al., 1990). The low radial order (low frequency) non-adiabatic modes, especially those near , have real frequencies that agree well with their adiabatic counterparts, except for (see later discussion). For , the agreement is within 2%. Therefore, mode identification using adiabatic calculations should be sufficient for modes with . Higher radial order modes have increasingly lower real frequencies relative to their adiabatic counterparts. This is because as non-adiabaticity increases, the sound propagation time changes from the adiabatic limit to the isothermal limit, and hence becomes longer (e.g., Zinn et al., 2023). With increasing radial order, heat exchange between neighboring temperature perturbations increases, enhancing the influence of non-adiabaticity. For these high radial order modes, we find that non-adiabaticity increases the number of radial nodes, in agreement with Goldstein & Townsend (2020).
The picture becomes complicated as increases (). We first discuss the merger models with and without mass loss. Most non-adiabatic modes that have a correspondence with the adiabatic modes have that significantly deviate from their adiabatic counterparts and may approach that of another mode. At very low frequencies (at or below that of the mode), a number of modes with high mode inertia and/or high damping () appear, which we speculate are secular in origin. In addition, we find a few damped modes that cross numerous other modes on a modal diagram (e.g., vs ). These modes rapidly decrease in with unlike the other modes, and we interpret these as the strange modes studied by Wood (1976); Cox et al. (1980); Saio et al. (1984). We do not further investigate the nature of these additional modes. Our present focus is on modes near . Intriguingly, the non-adiabatic mode which is nearest to , shows deviation from its adiabatic counterpart. The non-adiabatic modes both increase in relative to their adiabatic counterparts, and the mode shows a decrease. The relative change in for is modest, increasing from at to at . Meanwhile, of the mode increases up to times starting from . For the model, many additional modes appear, with comparable and mode inertia as the modes which have an adiabatic counterpart, making mode identification complicated.
In short, non-adiabatic effects are not significant for low (), but at high may change mode frequencies relative to their adiabatic counterparts or even introduce additional modes. However, mode frequencies near may still be well approximated by the adiabatic limit.
References
- Aerts et al. (2010) Aerts, C., Christensen-Dalsgaard, J., & Kurtz, D. W. 2010, Asteroseismology, doi: 10.1007/978-1-4020-5803-5
- Aizenman et al. (1977) Aizenman, M., Smeyers, P., & Weigert, A. 1977, A&A, 58, 41
- Alcock et al. (2001) Alcock, C., Allsman, R. A., Alves, D. R., et al. 2001, ApJ, 554, 298, doi: 10.1086/321369
- Alexander et al. (1972) Alexander, J. B., Andrews, P. J., Catchpole, R. M., et al. 1972, MNRAS, 158, 305, doi: 10.1093/mnras/158.3.305
- Asplund et al. (2000) Asplund, M., Gustafsson, B., Lambert, D. L., & Rao, N. K. 2000, A&A, 353, 287
- Astropy Collaboration et al. (2013) Astropy Collaboration, Robitaille, T. P., Tollerud, E. J., et al. 2013, A&A, 558, A33, doi: 10.1051/0004-6361/201322068
- Astropy Collaboration et al. (2018) Astropy Collaboration, Price-Whelan, A. M., Sipőcz, B. M., et al. 2018, AJ, 156, 123, doi: 10.3847/1538-3881/aabc4f
- Baglin et al. (2006) Baglin, A., Auvergne, M., Barge, P., et al. 2006, in ESA Special Publication, Vol. 1306, The CoRoT Mission Pre-Launch Status - Stellar Seismology and Planet Finding, ed. M. Fridlund, A. Baglin, J. Lochard, & L. Conroy, 33
- Beck et al. (2011) Beck, P. G., Bedding, T. R., Mosser, B., et al. 2011, Science, 332, 205, doi: 10.1126/science.1201939
- Beck et al. (2012) Beck, P. G., Montalban, J., Kallinger, T., et al. 2012, Nature, 481, 55, doi: 10.1038/nature10612
- Bedding et al. (2011) Bedding, T. R., Mosser, B., Huber, D., et al. 2011, Nature, 471, 608, doi: 10.1038/nature09935
- Belkacem et al. (2006) Belkacem, K., Samadi, R., Goupil, M. J., Kupka, F., & Baudin, F. 2006, A&A, 460, 183, doi: 10.1051/0004-6361:20065370
- Bloecker (1995) Bloecker, T. 1995, A&A, 297, 727
- Borucki et al. (2010) Borucki, W. J., Koch, D., Basri, G., et al. 2010, Science, 327, 977, doi: 10.1126/science.1185402
- Chaplin & Miglio (2013) Chaplin, W. J., & Miglio, A. 2013, ARA&A, 51, 353, doi: 10.1146/annurev-astro-082812-140938
- Christensen-Dalsgaard (2004) Christensen-Dalsgaard, J. 2004, Sol. Phys., 220, 137, doi: 10.1023/B:SOLA.0000031392.43227.7d
- Clayton (1996) Clayton, G. C. 1996, PASP, 108, 225, doi: 10.1086/133715
- Clayton (2012) —. 2012, \jaavso, 40, 539, doi: 10.48550/arXiv.1206.3448
- Clayton et al. (2007) Clayton, G. C., Geballe, T. R., Herwig, F., Fryer, C., & Asplund, M. 2007, ApJ, 662, 1220, doi: 10.1086/518307
- Clayton et al. (2006) Clayton, G. C., Kerber, F., Pirzkal, N., et al. 2006, ApJ, 646, L69, doi: 10.1086/506593
- Cox et al. (1980) Cox, J. P., Wheeler, J. C., Hansen, C. J., et al. 1980, Space Sci. Rev., 27, 529, doi: 10.1007/BF00168346
- Crawford et al. (2020) Crawford, C. L., Clayton, G. C., Munson, B., Chatzopoulos, E., & Frank, J. 2020, MNRAS, 498, 2912, doi: 10.1093/mnras/staa2526
- Crawford et al. (2023) Crawford, C. L., Tisserand, P., Clayton, G. C., et al. 2023, MNRAS, 521, 1674, doi: 10.1093/mnras/stad324
- Cunha et al. (2015) Cunha, M. S., Stello, D., Avelino, P. P., Christensen-Dalsgaard, J., & Townsend, R. H. D. 2015, ApJ, 805, 127, doi: 10.1088/0004-637X/805/2/127
- De et al. (2020) De, K., Hankins, M. J., Kasliwal, M. M., et al. 2020, PASP, 132, 025001, doi: 10.1088/1538-3873/ab6069
- De Ridder et al. (2009) De Ridder, J., Barban, C., Baudin, F., et al. 2009, Nature, 459, 398, doi: 10.1038/nature08022
- Dupret et al. (2009) Dupret, M. A., Belkacem, K., Samadi, R., et al. 2009, A&A, 506, 57, doi: 10.1051/0004-6361/200911713
- Feast et al. (2019) Feast, M. W., Griffin, R. F., Herbig, G. H., & Whitelock, P. A. 2019, MNRAS, 482, 4174, doi: 10.1093/mnras/sty2893
- Fuller et al. (2015) Fuller, J., Cantiello, M., Stello, D., Garcia, R. A., & Bildsten, L. 2015, Science, 350, 423, doi: 10.1126/science.aac6933
- García-Hernández et al. (2010) García-Hernández, D. A., Lambert, D. L., Kameswara Rao, N., Hinkle, K. H., & Eriksson, K. 2010, ApJ, 714, 144, doi: 10.1088/0004-637X/714/1/144
- Gautschy et al. (1990) Gautschy, A., Glatzel, W., Gautschy, A., & Glatzel, W. 1990, MNRAS, 245, 597, doi: 10.1093/mnras/245.4.597
- Glatzel & Gautschy (1992) Glatzel, W., & Gautschy, A. 1992, MNRAS, 256, 209, doi: 10.1093/mnras/256.2.209
- Goldreich & Keeley (1977) Goldreich, P., & Keeley, D. A. 1977, ApJ, 212, 243, doi: 10.1086/155043
- Goldreich et al. (1994) Goldreich, P., Murray, N., & Kumar, P. 1994, ApJ, 424, 466, doi: 10.1086/173904
- Goldstein & Townsend (2020) Goldstein, J., & Townsend, R. H. D. 2020, ApJ, 899, 116, doi: 10.3847/1538-4357/aba748
- Harris et al. (2020) Harris, C. R., Millman, K. J., van der Walt, S. J., et al. 2020, Nature, 585, 357, doi: 10.1038/s41586-020-2649-2
- Huber et al. (2011) Huber, D., Bedding, T. R., Stello, D., et al. 2011, ApJ, 743, 143, doi: 10.1088/0004-637X/743/2/143
- Hunter (2007) Hunter, J. D. 2007, Computing In Science & Engineering, 9, 90
- Iben et al. (1996) Iben, Icko, J., Tutukov, A. V., & Yungelson, L. R. 1996, ApJ, 456, 750, doi: 10.1086/176694
- Jermyn et al. (2023) Jermyn, A. S., Bauer, E. B., Schwab, J., et al. 2023, ApJS, 265, 15, doi: 10.3847/1538-4365/acae8d
- Jiang et al. (2018) Jiang, Y.-F., Cantiello, M., Bildsten, L., et al. 2018, Nature, 561, 498, doi: 10.1038/s41586-018-0525-0
- Karakas et al. (2015) Karakas, A. I., Ruiter, A. J., & Hampel, M. 2015, ApJ, 809, 184, doi: 10.1088/0004-637X/809/2/184
- Karambelkar et al. (2022) Karambelkar, V., Kasliwal, M. M., Tisserand, P., et al. 2022, A&A, 667, A84, doi: 10.1051/0004-6361/202142918
- Karambelkar et al. (2021) Karambelkar, V. R., Kasliwal, M. M., Tisserand, P., et al. 2021, ApJ, 910, 132, doi: 10.3847/1538-4357/abe5aa
- Kjeldsen & Bedding (1995) Kjeldsen, H., & Bedding, T. R. 1995, A&A, 293, 87, doi: 10.48550/arXiv.astro-ph/9403015
- Kluyver et al. (2016) Kluyver, T., Ragan-Kelley, B., Pérez, F., et al. 2016, in Positioning and Power in Academic Publishing: Players, Agents and Agendas: Proceedings of the 20th International Conference on Electronic Publishing, IOS Press, 87
- Kochanek et al. (2017) Kochanek, C. S., Shappee, B. J., Stanek, K. Z., et al. 2017, PASP, 129, 104502, doi: 10.1088/1538-3873/aa80d9
- Lauer et al. (2019) Lauer, A., Chatzopoulos, E., Clayton, G. C., Frank, J., & Marcello, D. C. 2019, MNRAS, 488, 438, doi: 10.1093/mnras/stz1732
- Lawson & Cottrell (1997) Lawson, W. A., & Cottrell, P. L. 1997, MNRAS, 285, 266, doi: 10.1093/mnras/285.2.266
- Lawson et al. (1994) Lawson, W. A., Cottrell, P. L., Kilkenny, D., et al. 1994, MNRAS, 271, 919, doi: 10.1093/mnras/271.4.919
- Lawson et al. (1990) Lawson, W. A., Cottrelll, P. L., Kilmartin, P. M., & Gilmore, A. C. 1990, MNRAS, 247, 91
- Marigo & Aringer (2009) Marigo, P., & Aringer, B. 2009, A&A, 508, 1539, doi: 10.1051/0004-6361/200912598
- Menon et al. (2013) Menon, A., Herwig, F., Denissenkov, P. A., et al. 2013, ApJ, 772, 59, doi: 10.1088/0004-637X/772/1/59
- Menon et al. (2019) Menon, A., Karakas, A. I., Lugaro, M., Doherty, C. L., & Ritter, C. 2019, MNRAS, 482, 2320, doi: 10.1093/mnras/sty2606
- Mosser et al. (2012a) Mosser, B., Goupil, M. J., Belkacem, K., et al. 2012a, A&A, 540, A143, doi: 10.1051/0004-6361/201118519
- Mosser et al. (2012b) —. 2012b, A&A, 548, A10, doi: 10.1051/0004-6361/201220106
- Mosser et al. (2013) Mosser, B., Dziembowski, W. A., Belkacem, K., et al. 2013, A&A, 559, A137, doi: 10.1051/0004-6361/201322243
- Munson et al. (2022) Munson, B., Chatzopoulos, E., & Denissenkov, P. A. 2022, ApJ, 939, 45, doi: 10.3847/1538-4357/ac9476
- Munson et al. (2021) Munson, B., Chatzopoulos, E., Frank, J., et al. 2021, ApJ, 911, 103, doi: 10.3847/1538-4357/abeb6c
- Osaki (1975) Osaki, Y. 1975, PASJ, 27, 237
- Paxton et al. (2011) Paxton, B., Bildsten, L., Dotter, A., et al. 2011, ApJS, 192, 3, doi: 10.1088/0067-0049/192/1/3
- Paxton et al. (2013) Paxton, B., Cantiello, M., Arras, P., et al. 2013, ApJS, 208, 4, doi: 10.1088/0067-0049/208/1/4
- Paxton et al. (2015) Paxton, B., Marchant, P., Schwab, J., et al. 2015, ApJS, 220, 15, doi: 10.1088/0067-0049/220/1/15
- Paxton et al. (2018) Paxton, B., Schwab, J., Bauer, E. B., et al. 2018, ApJS, 234, 34, doi: 10.3847/1538-4365/aaa5a8
- Paxton et al. (2019) Paxton, B., Smolec, R., Schwab, J., et al. 2019, ApJS, 243, 10, doi: 10.3847/1538-4365/ab2241
- Percy (2023) Percy, J. R. 2023, \jaavso, 51, 64
- Percy et al. (2004) Percy, J. R., Bandara, K., Fernie, J. D., Cottrell, P. L., & Skuljan, L. 2004, \jaavso, 33, 27
- Pérez & Granger (2007) Pérez, F., & Granger, B. E. 2007, Computing in Science & Engineering, 9, 21
- Rao & Lambert (2015) Rao, N. K., & Lambert, D. L. 2015, MNRAS, 447, 3664, doi: 10.1093/mnras/stu2748
- Rauer et al. (2014) Rauer, H., Catala, C., Aerts, C., et al. 2014, Experimental Astronomy, 38, 249, doi: 10.1007/s10686-014-9383-4
- Ricker et al. (2014) Ricker, G. R., Winn, J. N., Vanderspek, R., et al. 2014, in Society of Photo-Optical Instrumentation Engineers (SPIE) Conference Series, Vol. 9143, Space Telescopes and Instrumentation 2014: Optical, Infrared, and Millimeter Wave, ed. J. Oschmann, Jacobus M., M. Clampin, G. G. Fazio, & H. A. MacEwen, 914320, doi: 10.1117/12.2063489
- Ruiter et al. (2009) Ruiter, A. J., Belczynski, K., & Fryer, C. 2009, ApJ, 699, 2026, doi: 10.1088/0004-637X/699/2/2026
- Saio (2008) Saio, H. 2008, in Astronomical Society of the Pacific Conference Series, Vol. 391, Hydrogen-Deficient Stars, ed. A. Werner & T. Rauch, 69
- Saio (2009) Saio, H. 2009, Communications in Asteroseismology, 158, 245
- Saio et al. (1998) Saio, H., Baker, N. H., & Gautschy, A. 1998, MNRAS, 294, 622, doi: 10.1111/j.1365-8711.1998.01195.x
- Saio & Jeffery (2002) Saio, H., & Jeffery, C. S. 2002, MNRAS, 333, 121, doi: 10.1046/j.1365-8711.2002.05384.x
- Saio et al. (1984) Saio, H., Wheeler, J. C., & Cox, J. P. 1984, ApJ, 281, 318, doi: 10.1086/162102
- Samadi & Goupil (2001) Samadi, R., & Goupil, M. J. 2001, A&A, 370, 136, doi: 10.1051/0004-6361:20010212
- Schwab (2019) Schwab, J. 2019, ApJ, 885, 27, doi: 10.3847/1538-4357/ab425d
- Shappee et al. (2014) Shappee, B. J., Prieto, J. L., Grupe, D., et al. 2014, ApJ, 788, 48, doi: 10.1088/0004-637X/788/1/48
- Stello et al. (2016) Stello, D., Cantiello, M., Fuller, J., et al. 2016, Nature, 529, 364, doi: 10.1038/nature16171
- Stello et al. (2014) Stello, D., Compton, D. L., Bedding, T. R., et al. 2014, ApJ, 788, L10, doi: 10.1088/2041-8205/788/1/L10
- Takata (2006) Takata, M. 2006, PASJ, 58, 893, doi: 10.1093/pasj/58.5.893
- Tisserand et al. (2023) Tisserand, P., Crawford, C. L., Soon, J., et al. 2023, arXiv e-prints, arXiv:2309.10139, doi: 10.48550/arXiv.2309.10139
- Tisserand et al. (2009) Tisserand, P., Wood, P. R., Marquette, J. B., et al. 2009, A&A, 501, 985, doi: 10.1051/0004-6361/200911808
- Tisserand et al. (2020) Tisserand, P., Clayton, G. C., Bessell, M. S., et al. 2020, A&A, 635, A14, doi: 10.1051/0004-6361/201834410
- Tisserand et al. (2022) Tisserand, P., Crawford, C. L., Clayton, G. C., et al. 2022, A&A, 667, A83, doi: 10.1051/0004-6361/202142916
- Townsend et al. (2018) Townsend, R. H. D., Goldstein, J., & Zweibel, E. G. 2018, MNRAS, 475, 879, doi: 10.1093/mnras/stx3142
- Townsend & Teitler (2013) Townsend, R. H. D., & Teitler, S. A. 2013, MNRAS, 435, 3406, doi: 10.1093/mnras/stt1533
- Viani et al. (2017) Viani, L. S., Basu, S., Chaplin, W. J., Davies, G. R., & Elsworth, Y. 2017, ApJ, 843, 11, doi: 10.3847/1538-4357/aa729c
- Virtanen et al. (2020) Virtanen, P., Gommers, R., Oliphant, T. E., et al. 2020, Nature Methods, 17, 261, doi: 10.1038/s41592-019-0686-2
- Warner (1967) Warner, B. 1967, MNRAS, 137, 119, doi: 10.1093/mnras/137.2.119
- Webbink (1984) Webbink, R. F. 1984, ApJ, 277, 355, doi: 10.1086/161701
- Weiss (1987) Weiss, A. 1987, A&A, 185, 178
- Wolf & Schwab (2017) Wolf, B., & Schwab, J. 2017, wmwolf/py_mesa_reader: Interact with MESA Output, 0.3.0, Zenodo, doi: 10.5281/zenodo.826958
- Wood (1976) Wood, P. R. 1976, MNRAS, 174, 531, doi: 10.1093/mnras/174.3.531
- Yıldız et al. (2016) Yıldız, M., Çelik Orhan, Z., & Kayhan, C. 2016, MNRAS, 462, 1577, doi: 10.1093/mnras/stw1709
- Yu et al. (2020) Yu, J., Bedding, T. R., Stello, D., et al. 2020, MNRAS, 493, 1388, doi: 10.1093/mnras/staa300
- Yu et al. (2018) Yu, J., Huber, D., Bedding, T. R., et al. 2018, ApJS, 236, 42, doi: 10.3847/1538-4365/aaaf74
- Zinn et al. (2023) Zinn, J. C., Pinsonneault, M. H., Bildsten, L., & Stello, D. 2023, arXiv e-prints, arXiv:2308.09854. https://arxiv.org/abs/2308.09854