20XX Vol. X No. XX, 000–000
22institutetext: CSST Science Center for the Guangdong-Hong Kong-Macau Greater Bay Area, Zhuhai, 519082, China; huangzhq25@mail.sysu.edu.cn
\vs\noReceived 20XX Month Day; accepted 20XX Month Day
Cosmological constraints on neutrino masses in light of JWST red and massive candidate galaxies
Abstract
The overabundance of the red and massive candidate galaxies observed by the James Webb Space Telescope (JWST) implies efficient structure formation or large star formation efficiency at high redshift . In the scenario of a low star formation efficiency, because massive neutrinos tend to suppress the growth of structure of the universe, the JWST observation tightens the upper bound of the neutrino masses. Assuming cold dark matter cosmology and a star formation efficiency , we perform joint analyses of Planck+JWST and Planck+BAO+JWST, and obtain improved constraints and at 95% confidence level, respectively. The inverted mass ordering, which implies , is excluded by Planck+BAO+JWST at 92% confidence level.
keywords:
massive neutrinos — galaxies: abundances — galaxies: high-redshift1 Introduction
The standard hot big bang cosmology predicts a cosmic neutrino background (CB), which decoupled from the thermal bath in the early universe at a temperature . The subsequently redshifted momenta of CB follow an ultrarelativistic Fermi-Dirac distribution with negligible chemical potential and an effective temperature , where denotes the cosmological redshift. Although direct detection of CB is yet unrealistic, the existence of CB has been indirectly confirmed by the observations of primordial abundances of light elements and the cosmic microwave background (CMB).
The difference between the squares of the three mass eigenstates has been measured in neutrino flavor oscillation experiments (Fukuda et al. 1998; Abe et al. 2014). These experiments constrain the sum of masses of three neutrino species, , to be for the normal mass ordering , and for the inverted mass ordering . Distinguishing between the two mass-ordering scenarios, and hence accurate measurements of the sum of neutrino masses, are important for understanding the origin of neutrino masses.
At where primary CMB anisotropies are generated, the background temperature is . If , neutrino masses will have an impact on the primary CMB via the early integrated Sachs Wolfe effect. In the late universe, massive neutrinos act as a warm dark matter component, which tends to suppress the growth of large scale structure at small scales () and alter the CMB lensing effect. The third generation CMB experiment Planck mission constrained the total neutrino masses to be (TTTEEE + lowE + lensing) at 95% confidence level (CL) in the standard cold dark matter (CDM) model (Aghanim et al. 2020). Further including baryon acoustic oscillation (BAO) data , which breaks the degeneracy between neutrino masses and the background expansion history of the universe, pushes the upper limit of neutrino masses to (95% CL). This upper bound already puts inverted mass ordering under pressure.
The standard cosmological structure and galaxy formation is recently challenged by red and massive candidate galaxies from James Webb Space Telescope (JWST). Labbé et al. 2023 found six candidate massive galaxies (stellar mass solar masses) at . This finding suggests that either the star formation efficiency (SFE) significantly exceeds its typical values in low-redshift galaxies, or the halo mass function is about higher than the prediction of the standard CDM cosmology (Boylan-Kolchin 2023; Lovell et al. 2023; Haslbauer et al. 2022; Qin et al. 2023; Wang et al. 2023). Although at current stage a large SFE cannot be theoretically excluded (Zhang et al. 2022; Qin et al. 2023), a large SFE at tends to enhance the UV radiation from galaxies, causing a faster reionization process that is in tension with observation (Goto et al. 2021; Wold et al. 2022; Lin et al. 2023). For this reason, we shall take the more widely accepted conservative assumption of , and discuss the cosmological implications. Because massive neutrinos tend to suppress the number of massive halos in which massive galaxies are born, a large increases the tension between CDM model and JWST data. Thus, adding JWST data to the cosmological analysis, as the present work aims to do, helps to tighten the upper bound of neutrino masses.
This paper is organized as follows. Section 2 constructs the likelihood of massive galaxy counting and describes the numerical tool for the likelihood evaluation. In section 3 we apply the likelihood to the Labbé et al. 2023 data and obtain a Planck+JWST and Planck+BAO+JWST joint constraints on . Section 4 discusses and concludes.
2 Likelihood of massive galaxy counting
The aim of this section is to extend the likelihood of massive galaxy counting in Wang et al. 2023, which we sketch below, to massive neutrino models.
To assess the impact of massive neutrinos on galaxy formation, we adopt the extended Press-Schechter ellipsoidal collapse model(Press & Schechter 1974; Sheth et al. 2001; Sheth & Tormen 2002) to compute the expected abundance of dark matter halos. It predicts the halo mass function, which is the comoving halo number density per mass interval, to take the form
| (1) |
Here, is the average density of the background and , where corresponds to the critical linear overdensity and is the mass fluctuation at scale . The simulation-calibrated factor is given by
| (2) |
where , , and (Sheth & Tormen 1999). For massive halos we assume that the fraction of baryonic mass in a massive dark matter halo is , where and are the parameters of baryon and matter abundance. The stellar mass is then connected to the halo mass via , where is the SFE. This relation allows to convert a stellar-mass threshold to a halo-mass threshold . Assuming that each massive halo has a massive central galaxy, we can write the expected number of massive galaxies above the stellar-mass threshold and in a selected comoving volume as
| (3) |
where the selected comoving volume is defined by the redshift interval and the sky fraction . The comoving volume per redshift interval per solid angle, , is specified by the cosmology. For spatially flat CDM model, to a very good approximation, we have
| (4) |
where , and are the speed of light, the total matter (CDM + baryon + neutrinos) abundance parameter and the Hubble constant, respectively.
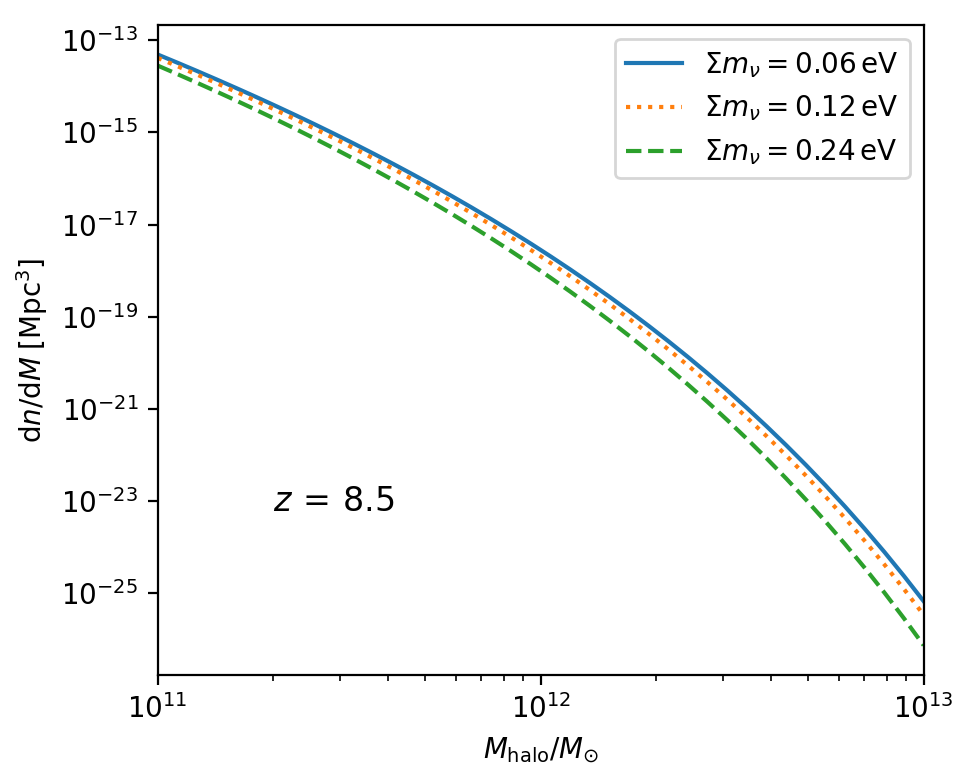
At , massive neutrinos behave as cold dark matter, while light neutrinos contribute very little to the total energy budget. In either case, the correction to equation (4) due to neutrino masses can always be ignored. The major impact of neutrino masses is on the matter power spectrum, integration of which gives in equation (1). Figure 2 shows the dependence of halo mass function, evaluated at (the center of the redshift bin used in the likelihood), on the sum of neutrino masses.
The stellar mass and the redshift uncertainties propagate to the uncertainty in , the number of observed galaxies above the stellar mass threshold and within the selected volume. Meanwhile, due to cosmic variance and Poisson shot noise, the theoretical prediction of (denoted as ) is also probabilistic. The likelihood of the theory is then characterized by the probability of finding , which is given by
| (5) |
The discrete distribution of , denoted as , is given by
| (6) |
where is the cosmic variance of . The discrete distribution is obtained by randomly sampling stellar masses and redshifts of the candidate galaxies with the summary statistics given in Labbé et al. 2023, and counting the number of galaxies in the selected volume. The precise values of rely on the functional form of the systematic errors of the stellar masses and redshifts of the galaxy candidates. We adopt the triangular distribution function, which is shown to be a more conservative estimation than smooth distributions, e.g., the skew-normal distribution.
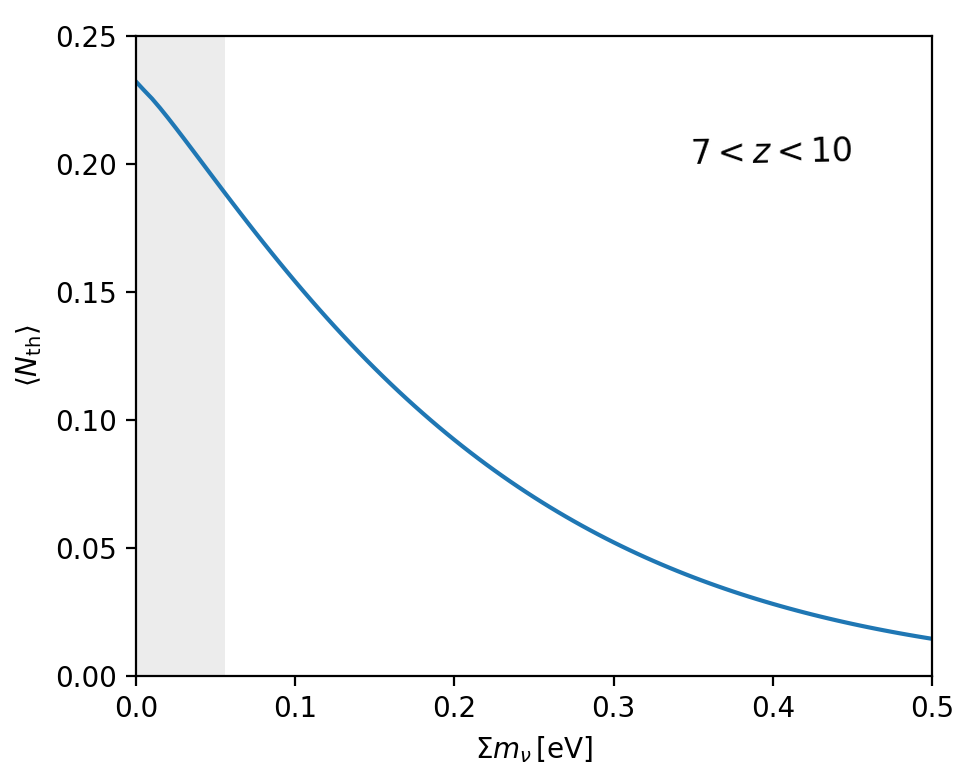
We integrate the cosmological linear perturbation Boltzmann solver CAMB (Howlett et al. 2012; Lewis et al. 2000) into the calculator in Wang et al. 2023. As shown in Figure 2, the expected number of massive galaxies decreases with the sum of neutrino masses, while the other cosmological parameters are fixed at the Planck best-fit values (Aghanim et al. 2020). Here the reduced Hubble constant is defined by ; and are the total matter (CDM + baryon + neutrinos) and baryon abundances; and are the amplitude and spectral index of the power spectrum of the primordial comoving curvature perturbations.
3 Results
The cosmology-dependent in equation (5) gives a likelihood of cosmological parameters. Following Wang et al. 2023 we take and . The survey area is , which gives . For more detailed information of the data set, such as the redshifts and stellar masses of the candidate galaxies, we refer the readers to Wang et al. 2023.
Since the lower-bound of SFE is unknown, we take a conservative approach by fixing the SFE to be instead of randomly sampling it in . Due to the degeneracy between cosmological parameters, JWST data alone cannot give a meaningful constraint on . We therefore analyze Planck+JWST and Planck+BAO+JWST jointly by performing importance sampling with the Planck and Planck+BAO Monte Carlo Markov chains from the Planck Legacy Archive (https://pla.esac.esa.int/pla/). The base parameters, on which flat priors are assumed, are the baryon density , the CDM density , the reionization optical depth , the angular extension of sound horizon on the last scattering surface , the sum of neutrino masses , and the primordial power spectrum parameters and .
The constraints on some key parameters (base or derived), before and after incorporating JWST likelihood, are shown in Table 1 for a comparison. The 95% CL upper bound of is improved by 10% (without BAO) and 6% (with BAO), respectively. Although the improvement is insignificant, the inclusion of JWST data pushes the upper bound to , very close to the limit implied by the inverted mass ordering. Integrating over the posterior distribution of , we find that the inverted mass ordering is excluded by Planck+BAO+JWST at 92% CL.
| Planck | Planck+JWST | Planck+BAO | Planck+BAO+JWST | |
|---|---|---|---|---|
| [eV] | ||||
| [km/s/Mpc] |
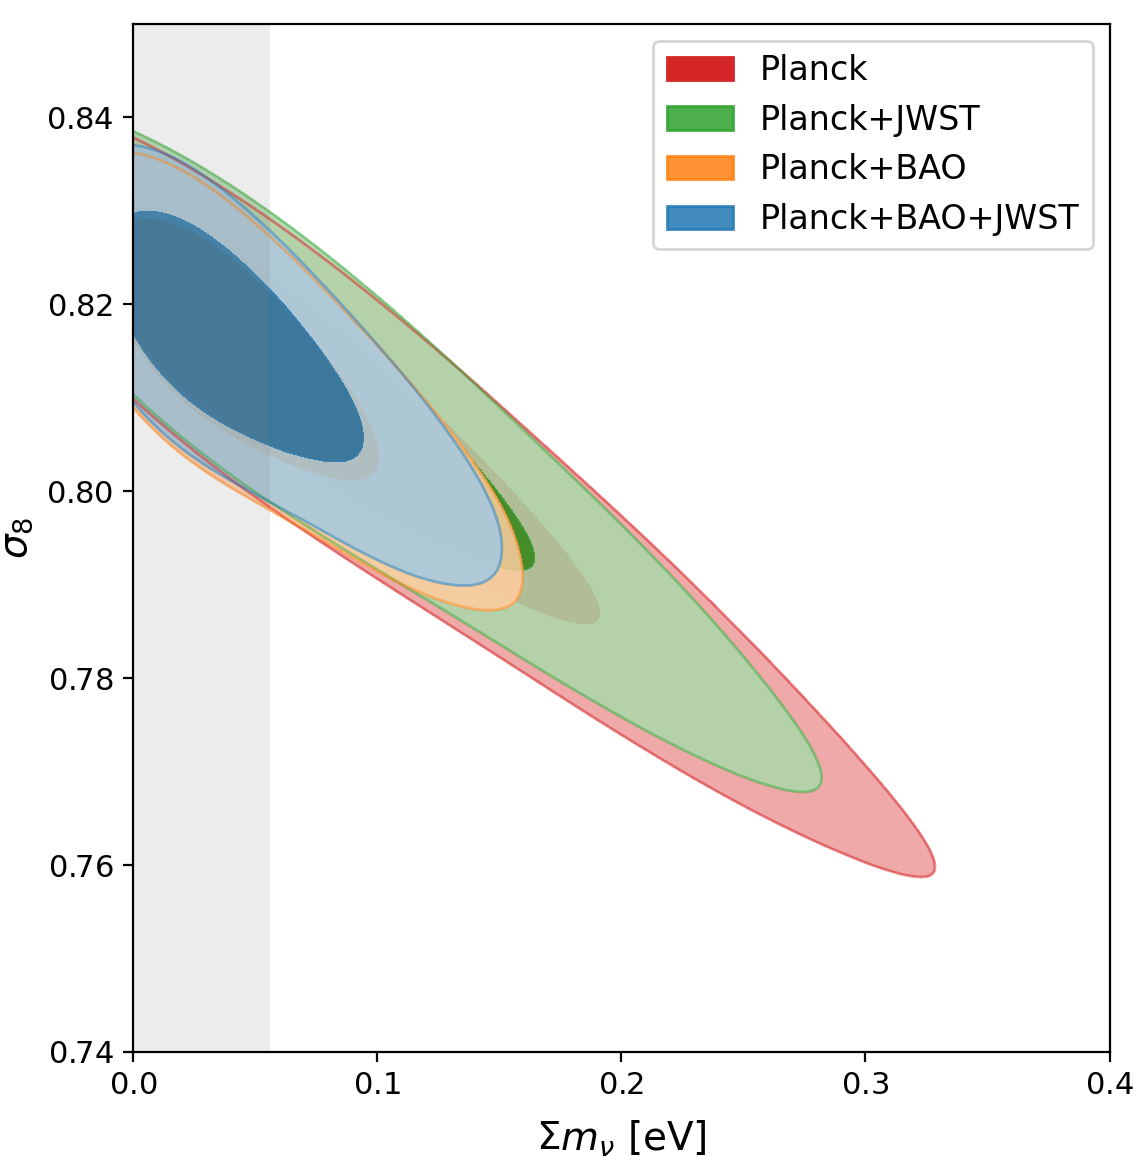
The addition of JWST data also has an impact on , the root mean square of density fluctuation in a top-hat spherical window with radius . This is because the suppression effect due to neutrino masses is degenerate with the amplitude of matter density fluctuations. This degeneracy can be clearly seen in Figure 3, which shows the marginalized and contours of and . The figure is made with the publicly available GetDist package (Lewis 2019)
4 Conclusions and Discussion
In this work, we incorporate massive neutrinos into the numerical tool in Wang et al. 2023 to evaluate the likelihood of massive galaxy counting. At the current stage, the JWST candidate galaxies alone cannot constrain cosmology. However, in joint analyses with Planck or Planck+BAO, the addition of JWST massive galaxy counting improves the upper bound of neutrino masses by about .
While the Planck+BAO+JWST constraint gives the most stringent upper bound on neutrino masses and puts the inverted mass ordering under more pressure (excluded at 92% CL), the results are yet very model-dependent. In particular, our results rely on the assumption that the SFE at follows its low-redshift bound (SFE). There are alternative scenarios where an enhanced SFE at high redshift does not accelerate the reionization process, and therefore is consistent with observations. For example, Lin et al. 2023 considered large SFE () at high redshift and warm dark matter in the mass range. In this picture, the warm dark matter has no impact on the abundance of very massive halos, and only suppresses the low-mass end of halo mass function. In other words, the warm dark matter reduces the number of low-mass galaxies that emit UV photons. This effect cancels the enhancement of UV radiation from each galaxy due to a large SFE, and keeps the cosmic reionization history in line with observations.
Acknowledgements.
This work is supported by National SKA Program of China No. 2020SKA0110402, the National Natural Science Foundation of China (NSFC) under Grant No. 12073088, and National key R&D Program of China (Grant No. 2020YFC2201600).References
- Abe et al. (2014) Abe, K., Adam, J., Aihara, H., et al. 2014, Phys. Rev. Lett., 112, 061802
- Aghanim et al. (2020) Aghanim, N., Akrami, Y., Ashdown, M., et al. 2020, Astronomy & Astrophysics, 641, A6
- Boylan-Kolchin (2023) Boylan-Kolchin, M. 2023, Nature Astronomy, 1
- Fukuda et al. (1998) Fukuda, Y., Hayakawa, T., Ichihara, E., et al. 1998, Phys. Rev. Lett., 81, 1562
- Goto et al. (2021) Goto, H., Shimasaku, K., Yamanaka, S., et al. 2021, ApJ, 923, 229
- Haslbauer et al. (2022) Haslbauer, M., Kroupa, P., Zonoozi, A. H., & Haghi, H. 2022, The Astrophysical Journal Letters, 939, L31
- Howlett et al. (2012) Howlett, C., Lewis, A., Hall, A., & Challinor, A. 2012, J. Cosmology Astropart. Phys, 1204, 027
- Labbé et al. (2023) Labbé, I., van Dokkum, P., Nelson, E., et al. 2023, Nature, 616, 266
- Lewis (2019) Lewis, A. 2019, GetDist: a Python package for analysing Monte Carlo samples, arXiv:1910.13970
- Lewis et al. (2000) Lewis, A., Challinor, A., & Lasenby, A. 2000, ApJ, 538, 473
- Lin et al. (2023) Lin, H., Gong, Y., Yue, B., & Chen, X. 2023, Implications of the Stellar Mass Density of High- Massive Galaxies from JWST on Warm Dark Matter, arXiv:2306.05648
- Lovell et al. (2023) Lovell, C. C., Harrison, I., Harikane, Y., Tacchella, S., & Wilkins, S. M. 2023, Monthly Notices of the Royal Astronomical Society, 518, 2511
- Press & Schechter (1974) Press, W. H., & Schechter, P. 1974, The Astrophysical Journal, 187, 425
- Qin et al. (2023) Qin, Y., Balu, S., & Wyithe, J. S. B. 2023, Monthly Notices of the Royal Astronomical Society, 526, 1324
- Sheth et al. (2001) Sheth, R. K., Mo, H., & Tormen, G. 2001, Monthly Notices of the Royal Astronomical Society, 323, 1
- Sheth & Tormen (1999) Sheth, R. K., & Tormen, G. 1999, Monthly Notices of the Royal Astronomical Society, 308, 119
- Sheth & Tormen (2002) Sheth, R. K., & Tormen, G. 2002, Monthly Notices of the Royal Astronomical Society, 329, 61
- Wang et al. (2023) Wang, J., Huang, Z., Huang, L., & Liu, J. 2023, arXiv e-prints, arXiv:2311.02866
- Wold et al. (2022) Wold, I. G. B., Malhotra, S., Rhoads, J., et al. 2022, ApJ, 927, 36
- Zhang et al. (2022) Zhang, Z., Wang, H., Luo, W., et al. 2022, A&A, 663, A85