Evaluating LLM Agent Group Dynamics against Human Group Dynamics: A Case Study on Wisdom of Partisan Crowds
Abstract
This study investigates the potential of Large Language Models (LLMs) to simulate human group dynamics, particularly within politically charged contexts. We replicate the Wisdom of Partisan Crowds phenomenon using LLMs to role-play as Democrat and Republican personas, engaging in a structured interaction akin to human group study. Our approach evaluates how agents’ responses evolve through social influence. Our key findings indicate that LLM agents role-playing detailed personas and without Chain-of-Thought (CoT) reasoning closely align with human behaviors, while having CoT reasoning hurts the alignment. However, incorporating explicit biases into agent prompts does not necessarily enhance the wisdom of partisan crowds. Moreover, fine-tuning LLMs with human data shows promise in achieving human-like behavior but poses a risk of overfitting certain behaviors. These findings show the potential and limitations of using LLM agents in modeling human group phenomena.
Evaluating LLM Agent Group Dynamics against Human Group Dynamics: A Case Study on Wisdom of Partisan Crowds
Yun-Shiuan Chuang, Siddharth Suresh†, Nikunj Harlalka†, Agam Goyal Robert Hawkins, Sijia Yang, Dhavan Shah, Junjie Hu, Timothy T. Rogers University of Wisconsin-Madison {yunshiuan.chuang,siddharth.suresh,nharlalka,agoyal25}@wisc.edu {rdhawkins, syang84, dshah, junjie.hu, ttrogers}@wisc.edu † equal contribution
1 Introduction
Understanding how individuals change their opinions under other people’s social influences is critical across multiple domains, from politics to marketing Flache et al. (2017); Lu et al. (2015); Budak et al. (2011). For example, phenomena such as opinion bi-polarization, extremization, and the formation of echo chambers arise from these social influences. A particularly concerning consequence is the spread of misinformation Budak et al. (2011), such as false narratives about vaccinations, which has serious implications for public health Loomba et al. (2021); Ginossar et al. (2022). By comprehensively modeling these dynamics, we can not only forecast future trends, such as potential polarization on social media platforms but also devise intervention strategies to alleviate negative societal impacts (e.g., devise messages to contain the spread of misinformation).
Building on the importance of modeling opinion dynamics, Agent-Based Models (ABMs) emerge as a cornerstone approach Flache et al. (2017); Lorenz et al. (2021); Chuang and Rogers (2023). ABMs represent individuals as agents with mathematical equations, determining opinion shifts upon inter-agent communications. As these agents exchange opinions, simulations can predict the evolution of group opinions. However, traditional ABMs have critical limitations. ABMs often require beliefs and messages to be mapped to numerical values, excluding the use of natural language in real-life social interactions. Moreover, they often do not incorporate vital human cognitive aspects, such as memory and personality. This gap limits the application of ABMs in social simulation.
Is LLM Group Dynamics Human-like?
Recent advancements in Large Language Models (LLMs) have opened new avenues for creating social simulacra, where agents powered by LLMs can engage in interactions on social platforms. Park et al. (2022) demonstrate the potential of LLMs to generate social interactions that participants could hardly distinguish from real conversations on Reddit. In another study, Park et al. (2023) use LLM to construct generative agents to simulate believable human behavior in a digital environment. These agents interact with each other and the environment, initiating conversations, spreading information, remembering past events, and planning future actions. However, what remains unclear is how human-like these social interactions are. Without a benchmark, it is hard to quantify the alignment between LLM group dynamics and human group dynamics.
Our research takes this further by applying LLMs to replicate a known human group dynamics phenomenon—the Wisdom of Partisan Crowds Becker et al. (2019). The study contains data from 1120 subjects, who interact with one another in group settings. This provides a benchmark to test the degree to which the dynamics of the LLM group reflect interactions between human groups. Becker et al. (2019) conduct two web-based experiments involving individuals from politically homogeneous networks (a group that consists of either 35 Republicans or 35 Democrats) answering factual questions known to elicit partisan bias (e.g., estimating the US unemployment rate at the end of Barack Obama’s presidential administration). Each subject provided an initial estimate, observed the average belief of their peers, and was asked again to provide their estimate. The procedure is repeated twice and results in three estimates per subject. Their findings show that social information exchange not only increases accuracy but also reduces polarization. This demonstration of collective intelligence, even in the presence of partisan bias, stood as the basis for our replication experiment with LLMs.
In our LLM group simulation, we replicate the three-round structure of the original study, where agents first provide independent responses, and then adjust their answers after each exposure to their peers’ averaged beliefs. By leveraging the detailed methodology of Becker et al. (2019), our research aims to evaluate the human-likeness of LLM group dynamics.
2 Methods
2.1 Experimental Procedure
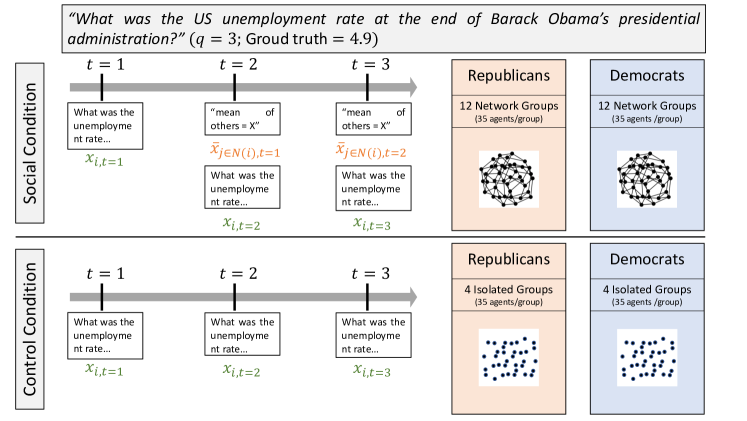
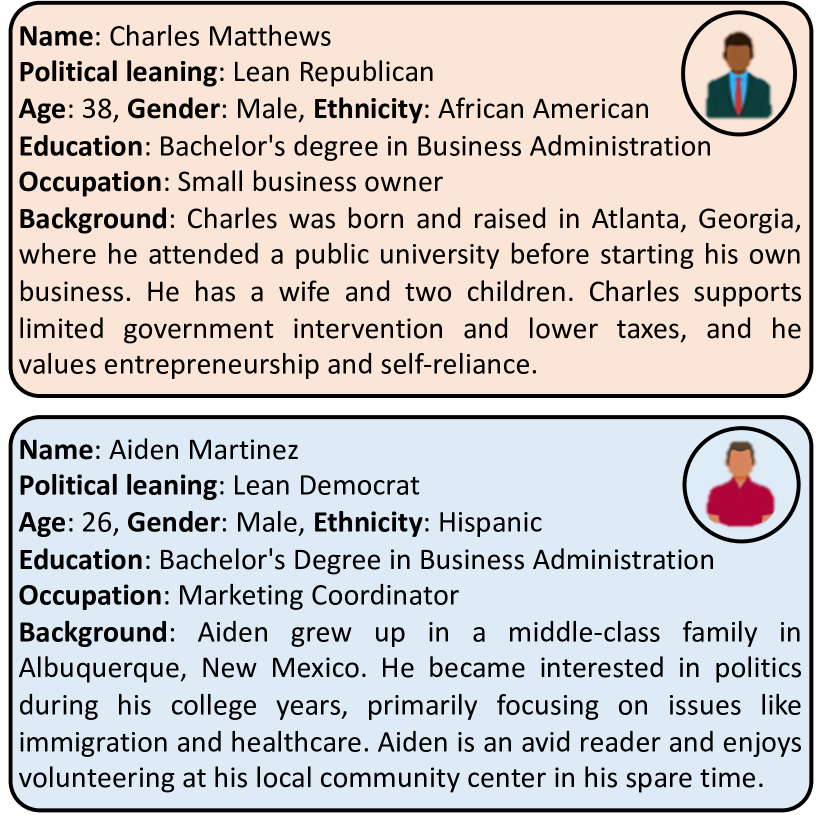
In this study, we follow the experimental design of Becker et al. (2019) using an LLM to role-play Democrat and Republican personas (examples shown in Figure 1). As shown in Figure 2, an LLM agent is embedded in a network structure for interaction, where each agent is connected to four others sharing the same political leaning (all agents have node degree ), reflecting the homogeneous group structures in human studies. The LLM agent, powered by LangChain Chase (2022) and OpenAI’s ChatGPT (gpt-3.5-turbo), maintains the continuity of each persona’s memory throughout the experiment. Over three rounds, these agents are prompted to answer the same eight fact-based questions with known partisan biases, such as "What was the US unemployment rate at the end of Barack Obama’s presidential administration?". After each round, agents are exposed to the average estimates of their connected peers and are asked to provide their estimates again. At the end of the three rounds, each agent will have three estimates for each of the eight questions. These questions are divided between two experiments: the first four questions belong to the first experiment, and the last four questions to the second experiment, where the questions in the second experiment demonstrated a larger wisdom of crowds effect in the original study Becker et al. (2019). The full list of questions is provided in Appendix C. Each question is conducted 12 times for each group to mirror the 12 groups of human participants in the social conditions in Becker et al. (2019), alongside four times for the control group that operates without exposure to the neighbors’ estimates. Temperate sampling (temperature = 0.7) is used to allow variability in responses. Appendix E shows the actual prompts.
Formal Notation
We denote each agent in the experiment as , where indexes the agent within a specific run, denotes political leaning (Democrat or Republican; abbreviated as Dem and Rep hereafter), indicates the condition (Social or Control), and specifies the run index with for Social and for Control conditions. During each run, agents answer eight questions across three time steps, generating a series of estimates for question at time . Since all eight questions are fact-based, each has a ground-truth value, denoted as .
In the Social condition, starting at , agents are shown the average estimate from their politically homogeneous neighbors before making their own estimates. The average estimate from neighbors for agent at time for question is , where is the set of indices for the agent’s neighbors who share the same political leaning . We set the number of neighbors to in this setup. For Control condition agents, is not applicable, as they generate their estimates without peer influence. In the Control condition, agents do not receive and must provide their three estimates alone.
| Method | Persona | CoT | Extreme % | ||||||
| Zero-shot Role-playing | Detailed | CoT | 10.54 | 1.11 | -0.11 | 1.23 | -10.65 | 0.98 | 0.00 |
| No CoT | -5.86 | 4.31 | -7.86 | 3.21 | -2.00 | 5.41 | 0.00 | ||
| Simple | CoT | 13.79 | -11.97 | 0.83 | -15.91 | -12.96 | -8.02 | 0.00 | |
| No CoT | -7.63 | -16.71 | -3.07 | -15.41 | 4.56 | -18.0 | 0.02 | ||
| Role-playing with Induced Bias | Simple | CoT | 2.40 | 3.29 | 3.25 | 4.81 | 0.85 | 1.76 | 0.00 |
| No CoT | 1.52 | -15.58 | -1.01 | -24.22 | -2.53 | -6.92 | 0.00 | ||
| Human | - | - | -35.51 | 10.73 | -26.12 | 11.63 | 9.39 | 9.82 | 0.64 |
2.2 Personas and Agent Specification
In developing agents, we focused on three key dimensions:
Persona Detail:
Different personas are created with varying levels of background detail in order to introduce variability in responses. Using Simple Personas specified as “a typical Democrat/Republican” relies on temperature sampling to elicit slightly different biased views. Meanwhile, Detailed Personas with comprehensive backstories, including demographics and personal background (examples shown in Figure 1), introduce individual differences based on demographics and personal background. It is important to have individual differences in initial estimates, as this is the underlying mechanism for convergence towards ground truth in human crowds Becker et al. (2017). 111Becker et al. (2017) show that crowds converge towards the truth in number estimating task because the more accurate an individual’s initial estimate, the less they will change it based on others’ estimates. Thus, other individuals with less accurate estimates will be drawn towards the more accurate ground truth estimates. Appendix B shows the full list of personas.
Chain-of-thought Reasoning (CoT):
Another factor is to decide whether to encourage the agent to employ chain-of-thought reasoning. Recent work shows that the use of CoT may lead to stereotypes and biases Shaikh et al. (2022). Therefore, we examine whether CoT allows the agent to assume human-like bias according to their political leanings.
Induced Bias:
We also consider explicitly introducing the expected partisan biases into the personas’ prompts. This serves as a validation to see if one can control the partisan bias directly in the prompt. For example, a Republican persona may be reminded of a belief that Obama’s presidency was ineffective in reducing unemployment. The induced bias encourages the agents to behave according to known human biases as in Becker et al. (2019). Appendix D shows the full list of induced biases.
2.3 Fine-Tuning the LLMs with Human Data
In addition to in-context learning through prompting, we also perform supervised fine-tuning using human response data from the experiment in Becker et al. (2019) to encourage alignment between LLM agents and humans. Our fine-tuning methodology is inspired by Binz and Schulz (2023), showing that through supervised learning, LLMs can be adapted to modeling human decision-making behavior in an unseen task. We aim to investigate if fine-tuning would also increase the human-AI alignment in the group interaction setting. The training data consists of responses to questions , while using questions as the testing set. The fine-tuned model is then evaluated separately on the train set and the test set. Details on the fine-tuning process can be found in the Appendix G.
| Method | Extreme % | ||||||
| Fine-tuned Role-playing | |||||||
| Test set () | -10.95 | 0.63 | -13.83 | 1.00 | -2.88 | 0.37 | 25.84 |
| Train set () | -14.30 | -2.19 | -13.16 | 15.76 | 1.14 | 17.95 | 0.03 |
| Human | |||||||
| Test set () | -8.84 | 12.18 | -12.66 | 9.83 | -3.82 | 14.52 | 0.46 |
| Train set () | -62.19 | 9.28 | -39.58 | 13.43 | 22.61 | 5.13 | 0.81 |
2.4 Evaluation Metrics
Our evaluation metrics aim to assess the alignment between LLM agent group dynamics and human group behavior:
Wisdom of Partisan Crowds Effect
We measure the ability of LLM agents to refine their estimates through social interaction as humans do Becker et al. (2019). For each question , run , condition , and political leaning , we compute the group mean and normalized group error . Formally, , where is the total number of agents in a group. The normalized group error is then defined as , where is the ground truth value for question . We also denote as the average normalized group error in each condition at time , the average of across all questions, runs, and political groups within the Social or Control condition.
Group Error Reduction per question is . We then average group error reductions across all political leanings, runs, and questions within each condition to calculate the Average Group Error Reduction for the Social () and Control () conditions, respectively. The discrepancy gauges the wisdom of partisan crowds effect in LLM agents. The more negative is, the stronger the effect is, i.e., the stronger the reduction in group error through social interaction. Please refer to Appendix H for detailed definitions of each term mentioned above.
Partisan Bias:
To evaluate the human-like partisan biases in LLM agents, we define Conditional Partisan Bias as the mean difference in normalized group errors between Democrat and Republican groups, aligned with expected human bias directions. The conditional partisan bias for condition is: , where represents the time steps, the questions, the number of runs for Social Condition and 4 for Control Condition, and indicates the human partisan bias direction, with if Republicans typically estimate higher than Democrats, as per human data in Becker et al. (2019), if the other way around, and if there is no expected difference (see Appendix B for of each question). A positive indicates an alignment with the direction of human bias, while a negative value suggests a misalignment. The overall Overall Partisan Bias across both Social and Control conditions is denoted as . We will use this overall metric to quantify the LLM agents’ adherence to human-like partisan biases.
Extreme %:
To assess the prevalence of extreme values in LLM agent responses, we introduce the Extreme % metric. This metric calculates the percentage of responses that fall outside a realistic range, as defined in the criteria for each experiment. For questions in Experiment 1 (), responses are considered extreme if they are greater than one order of magnitude above the true value or if they are negative values. For instance, for the unemployment rate question, any value above 47% (4.7% x 10) is deemed extreme. The criteria for questions in Experiment 2 () are detailed in the Appendix F. When computing the Average Group Error Reduction and Conditional Partisan Bias metrics, these extreme values are excluded to reduce their impact on the overall metrics. The Extreme % metric quantifies the tendency of LLM agents to produce responses that are considered unrealistic. 222Becker et al. (2019) use a log function to normalize the responses for experiment 1. In our study, we do not do this since LLM agents may occasionally return negative values. Instead, we follow their alternative normalization outlined in their supplementary materials. They show that different normalization procedures do not yield significant differences.
3 Results
3.1 Effect of Persona Detail, CoT Reasoning, and Induced Bias on Agent Alignment
Our study focuses on evaluating how well LLM agents, simulating Democrat and Republican personas, align with human group dynamics in group error reduction and partisan bias. The human-AI agent alignment findings are detailed in Table 1.
Role-Playing without Chain-of-Thought Reasoning:
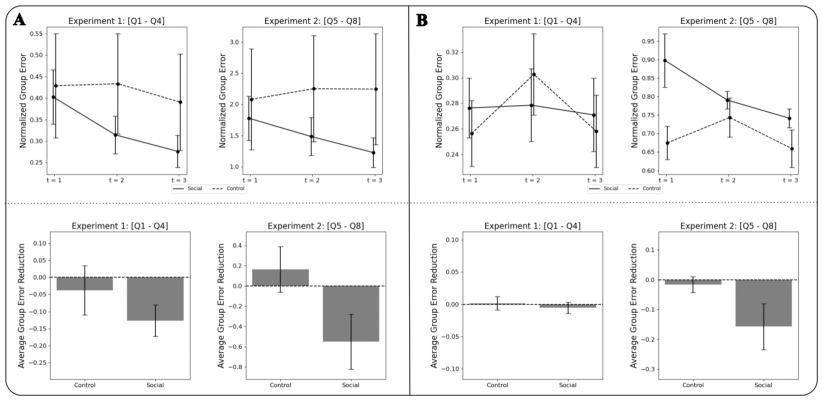
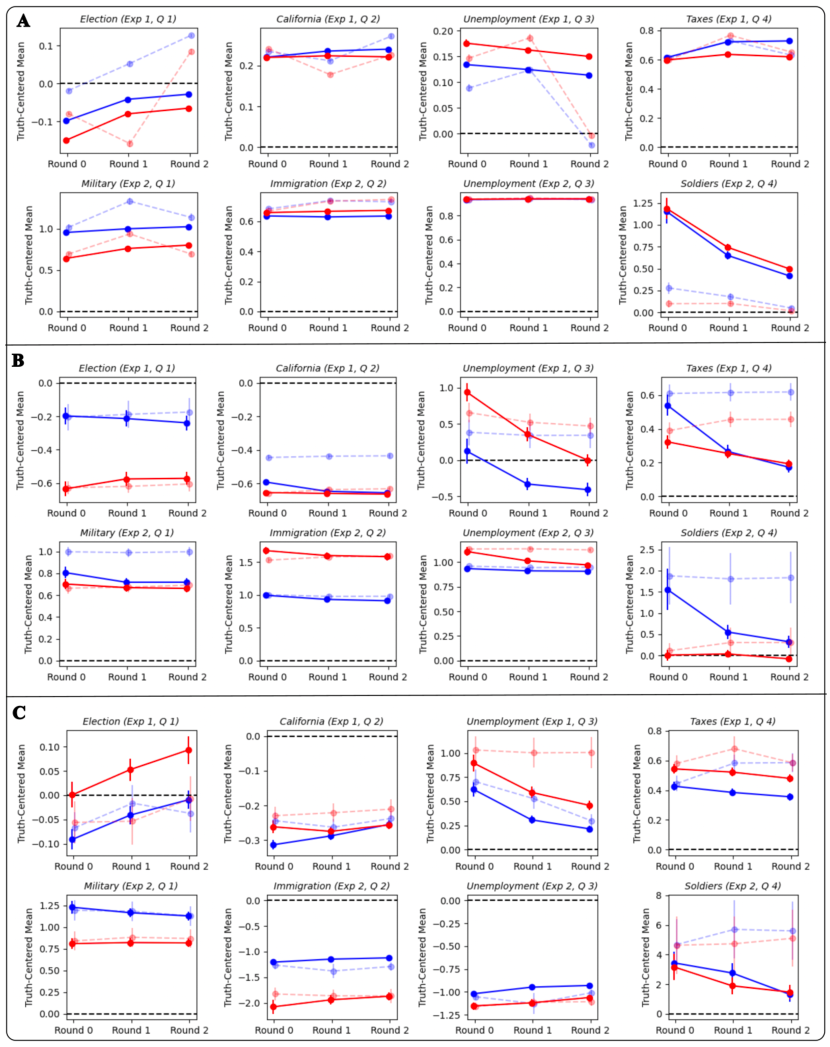
LLM agents with detailed personas, but without Chain-of-Thought (CoT) reasoning, align most closely with human group dynamics. These agents demonstrate a notable wisdom of partisan crowd ( = -5.86) and a significant partisan bias ( = 4.31). Figure 3 shows the wisdom of partisan crowd results, where under the Social condition, the group of agents converges towards the ground truth after social interaction. Please refer to Figure 4a for the detailed result for each question.
Influence of Persona Detail and CoT:
The results highlight that the depth of persona detail significantly influences the LLM agents’ alignment with humans in terms of the partisan bias . Detailed personas enable a more human-like partisan bias. On the other hand, in the Social condition, CoT reasoning diminishes the reduction of group error, as measured by . In the Control condition, CoT reasoning also shows a large reduction of group error, , differing from human behaviors.
Results of Role-playing with Induced Bias:
Adding induced bias to the agents shows mixed results. While it increases alignment in terms of the partisan bias , especially when compared to zero-shot role-playing with simple personas, it does not enhance alignment in terms of the wisdom of partisan crowds . This suggests that while induced biases can steer agents towards more pronounced partisan positions, they do not necessarily lead to better group dynamics as seen in human dynamics.
3.2 Fine-Tuning’s Influence on Human-like Behavior in LLM Agents
We also investigate whether fine-tuning LLM agents with human response data enhances their alignment with human group dynamics. As Table 2 shows, this approach generally leads to more human-like behaviors based on error reduction and partisan bias, but also risks overfitting. Figure 4 shows the detailed result for each question.
Behavioral Alignment in Train and Test Sets:
In the training set (questions ), fine-tuned LLM agents demonstrate a significant shift, achieving an of 15.76, indicating an effective replication of human decision-making nuances. Conversely, in the test set (questions ), these agents also display notable alignment, with a of -13.83 and an of 1.00, reflecting similar trends as observed in the training set.
Overfitting Concerns:
However, the fine-tuned LLMs, especially in the testing data, exhibited an excess of extreme values compared to human data, indicating potential over-fitting to the training data.
4 Related Work
LLMs in Social Dynamics Simulation.
Research in applying Large Language Models (LLMs) for social dynamics is expanding. Li et al. (2023); Luitse and Denkena (2021); Weidinger et al. (2021); Zhao et al. (2023). Törnberg et al. (2023) demonstrates the use of LLMs for social media simulations. Additionally, Park et al. (2022) highlights LLMs’ ability to mimic realistic social interactions on platforms like Reddit. These studies collectively advance our understanding of LLMs in simulating human social behavior and cognitive processes.
5 Conclusion
This study highlights the significant potential of Large Language Models (LLMs) in simulating human group dynamics, particularly in politically sensitive contexts. Our research underscores the influence of persona detail and Chain-of-Thought (CoT) reasoning on the alignment of LLM agents with human behaviors. Agents with detailed personas, without employing CoT reasoning, show a closer alignment with human group dynamics, suggesting nuanced persona development as a key factor in accurately replicating human decision-making and biases. On the other hand, the use of explicit induced bias, while increasing partisan bias, does not correspondingly enhance the wisdom of partisan crowds. Additionally, fine-tuning LLMs with human data, although promising, results in overfitting the training data. These findings contribute insights to the development of LLM agents, particularly for applications in computational social science research.
References
- Becker et al. (2017) Joshua Becker, Devon Brackbill, and Damon Centola. 2017. Network dynamics of social influence in the wisdom of crowds. Proceedings of the National Academy of Sciences of the United States of America, 114(26):E5070.
- Becker et al. (2019) Joshua Becker, Ethan Porter, and Damon Centola. 2019. The wisdom of partisan crowds. Proceedings of the National Academy of Sciences of the United States of America, 116(22):10717–10722.
- Binz and Schulz (2023) Marcel Binz and Eric Schulz. 2023. Turning large language models into cognitive models. arXiv preprint arXiv:2306.03917.
- Budak et al. (2011) Ceren Budak, Divyakant Agrawal, and Amr El Abbadi. 2011. Limiting the spread of misinformation in social networks. In Proceedings of the 20th international conference on World wide web, pages 665–674.
- Chase (2022) Harrison Chase. 2022. Langchain.
- Chuang and Rogers (2023) Yun-Shiuan Chuang and Timothy T Rogers. 2023. Computational agent-based models in opinion dynamics: A survey on social simulations and empirical studies. arXiv preprint arXiv:2306.03446.
- Flache et al. (2017) Andreas Flache, Michael Mäs, Thomas Feliciani, Edmund Chattoe-Brown, Guillaume Deffuant, Sylvie Huet, and Jan Lorenz. 2017. Models of social influence: Towards the next frontiers. Journal of Artificial Societies and Social Simulation, 20(4).
- Ginossar et al. (2022) Tamar Ginossar, Iain J Cruickshank, Elena Zheleva, Jason Sulskis, and Tanya Berger-Wolf. 2022. Cross-platform spread: vaccine-related content, sources, and conspiracy theories in youtube videos shared in early twitter covid-19 conversations. Human vaccines & immunotherapeutics, 18(1):1–13.
- Li et al. (2023) Chao Li, Xing Su, Chao Fan, Haoying Han, Cong Xue, and Chunmo Zheng. 2023. Quantifying the impact of large language models on collective opinion dynamics. arXiv preprint arXiv:2308.03313.
- Loomba et al. (2021) Sahil Loomba, Alexandre de Figueiredo, Simon J Piatek, Kristen de Graaf, and Heidi J Larson. 2021. Measuring the impact of covid-19 vaccine misinformation on vaccination intent in the uk and usa. Nature human behaviour, 5(3):337–348.
- Lorenz et al. (2021) Jan Lorenz, Martin Neumann, and Tobias Schröder. 2021. Individual attitude change and societal dynamics: Computational experiments with psychological theories. Psychological Review, 128(4):623.
- Lu et al. (2015) Wei Lu, Wei Chen, and Laks VS Lakshmanan. 2015. From competition to complementarity: comparative influence diffusion and maximization. Proceedings of the VLDB Endowment, 9(2):60–71.
- Luitse and Denkena (2021) Dieuwertje Luitse and Wiebke Denkena. 2021. The great transformer: Examining the role of large language models in the political economy of ai. Big Data & Society, 8(2):20539517211047734.
- Park et al. (2023) Joon Sung Park, Joseph C O’Brien, Carrie J Cai, Meredith Ringel Morris, Percy Liang, and Michael S Bernstein. 2023. Generative agents: Interactive simulacra of human behavior. arXiv preprint arXiv:2304.03442.
- Park et al. (2022) Joon Sung Park, Lindsay Popowski, Carrie Cai, Meredith Ringel Morris, Percy Liang, and Michael S Bernstein. 2022. Social simulacra: Creating populated prototypes for social computing systems. In Proceedings of the 35th Annual ACM Symposium on User Interface Software and Technology, pages 1–18.
- Shaikh et al. (2022) Omar Shaikh, Hongxin Zhang, William Held, Michael Bernstein, and Diyi Yang. 2022. On second thought, let’s not think step by step! bias and toxicity in zero-shot reasoning. arXiv preprint arXiv:2212.08061.
- Törnberg et al. (2023) Petter Törnberg, Diliara Valeeva, Justus Uitermark, and Christopher Bail. 2023. Simulating social media using large language models to evaluate alternative news feed algorithms. arXiv preprint arXiv:2310.05984.
- Weidinger et al. (2021) Laura Weidinger, John Mellor, Maribeth Rauh, Conor Griffin, Jonathan Uesato, Po-Sen Huang, Myra Cheng, Mia Glaese, Borja Balle, Atoosa Kasirzadeh, et al. 2021. Ethical and social risks of harm from language models. arXiv preprint arXiv:2112.04359.
- Zhao et al. (2023) Wayne Xin Zhao, Kun Zhou, Junyi Li, Tianyi Tang, Xiaolei Wang, Yupeng Hou, Yingqian Min, Beichen Zhang, Junjie Zhang, Zican Dong, et al. 2023. A survey of large language models. arXiv preprint arXiv:2303.18223.
Appendix A Aggregated Analysis Plots
Appendix B List of Personas
B.1 Detailed Persona Condition
In this section, we list the personas of the agents interacting in our experiment. 35 personas were used in the experiment for both Democrats and Republicans. For brevity purposes, a subset of them is included here. The full set of personas will be released along with the codebase at the time of publication.
Democrats
Political leaning: Strong Democrat
Age: 67
Gender: Female
Ethnicity: White
Education: Bachelor’s Degree in Education
Occupation: Retired Teacher Background: Isabella is from Portland, Oregon, and spent her career advocating for public education and teachers’ rights. She is passionate about social justice, healthcare, and environmental issues. Isabella is widowed with two grown children and enjoys birdwatching and painting in her free time.
Political leaning: Lean Democrat
Age: 51
Gender: Male
Ethnicity: African American
Education: Bachelor’s Degree in Finance
Occupation: Financial Analyst Background: Jamal grew up in Detroit, Michigan, and became politically active during the 2008 recession. He supports policies promoting economic fairness and equal opportunities. Jamal is divorced with one child and enjoys playing golf and attending jazz concerts.
Political leaning: Moderate Democrat
Age: 34
Gender: Female
Ethnicity: Indian American
Education: Master’s Degree in Computer Science
Occupation: Software Engineer
Background: Karen was born in San Jose, California, and is a strong advocate for affordable housing and tech industry regulations. She also supports women’s rights and STEM education. Karen is married with two young children and enjoys hiking and coding projects in her free time.
Political leaning: Strong Democrat
Age: 42
Gender: Male
Ethnicity: White
Education: Bachelor’s Degree in Sociology
Occupation: Nonprofit Fundraiser
Background: Larry hails from Madison, Wisconsin, and is deeply involved in local politics. He is passionate about income inequality, racial justice, and LGBTQ+ rights. Larry is married with no children and enjoys traveling and volunteering for progressive causes.
Political leaning: Lean Democrat
Age: 48
Gender: Female
Ethnicity: Puerto Rican
Education: Associate Degree in Nursing
Occupation: Registered Nurse
Background: Monica grew up in New York City, New York, and supports policies that improve healthcare access and quality. She is also concerned about affordable housing and education reform. Monica is a single mother of two and enjoys salsa dancing and cooking.
Republicans
Political leaning: Lean Republican
Age: 38
Gender: Male
Ethnicity: African American
Education: Bachelor’s degree in Business Administration
Occupation: Small business owner
Background: Charles was born and raised in Atlanta, Georgia, where he attended a public university before starting his own business. He has a wife and two children. Charles supports limited government intervention and lower taxes, and he values entrepreneurship and self-reliance.
Political leaning: Moderate Republican
Age: 29
Gender: Female
Ethnicity: Caucasian
Education: Master’s degree in Public Health
Occupation: Epidemiologist
Background: Alice grew up in a small town in Ohio before moving to Philadelphia for her studies. She is passionate about public health and believes in data-driven policies. She leans Republican due to her fiscal conservatism and support for individual rights.
Political leaning: Strong Republican
Age: 45
Gender: Male
Ethnicity: Hispanic
Education: High school diploma
Occupation: Construction worker
Background: Juan, originally from Mexico, migrated to Texas with his family when he was a child. A father of three, he believes in traditional family values, hard work, and limited government. He is a staunch advocate for securing the nation’s borders.
Political leaning: Lean Republican
Age: 23
Gender: Female
Ethnicity: Asian American
Education: Bachelor’s degree in Environmental Science
Occupation: Environmental Consultant
Background: Sarah was born and raised in California. She supports free-market solutions to environmental issues and believes in responsible resource management. Sarah leans Republican due to her fiscally conservative views and her opposition to excessive government regulation.
Political leaning: Moderate Republican
Age: 64
Gender: Male
Ethnicity: Caucasian
Education: Bachelor’s degree in Engineering
Occupation: Retired engineer
Background: Robert, a native of Pennsylvania, worked for a major manufacturing company for over 30 years. He is a Vietnam War veteran and a strong supporter of the Second Amendment. Robert believes in fiscal responsibility, limited government, and a strong national defense.
B.2 Simple Persona Condition
Democrats
Republicans
Appendix C Full List of Questions
Below is the full list of questions in the experiment, along with the sign of human partisan bias direction observed in human data Becker et al. (2019).
Questions for Experiment 1
()
-
1.
In the 2004 election, individuals gave $269.8 million to Republican candidate George W. Bush. How much did they give to Democratic candidate John Kerry? (Answer in millions of dollars—e.g., 1 for $1 million.) Ground truth: 224.6,
-
2.
According to 2010 estimates, what percentage of people in the state of California identify as Black/African-American, Hispanic, or Asian? (Give a number from 0 to 100.) Ground truth: 60.2,
-
3.
What was the US unemployment rate at the end of Barack Obama’s presidential administration—i.e., what percentage of people were unemployed in December 2016? (Give a number from 0 to 100.) Ground truth: 4.9,
-
4.
In 1980, tax revenue was 18.5% of the economy (as a proportion of GDP). What was tax revenue as a percentage of the economy in 2010? (Give a number from 0 to 100.) Ground truth: 14.6,
Questions for Experiment 2
()
-
5.
For every dollar the federal government spent in fiscal year 2016, about how much went to the Department of Defense (US Military)? Answer with a number between 0 and 100. Ground truth: 15,
-
6.
In 2007, it was estimated that 6.9 million unauthorized immigrants from Mexico lived in the United States. How much did this number change by 2016, before President Trump was elected? Express your answer as a percentage of change. Ground truth: -27.8,
-
7.
How much did the unemployment rate in the United States change from the beginning to the end of Democratic President Barack Obama’s term in office? Express your answer as a percentage of change. Ground truth: -46,
-
8.
About how many US soldiers were killed in Iraq between the invasion in 2003 and the withdrawal of troops in December 2011? Ground truth: 4486,
Appendix D List of Induced Biases
Below is the full list of induced biases corresponding to the questions in the experiment. We did not induce a bias for certain questions because Becker et al. (2019) found that there is no significant human partisan bias for those questions.
Induced Biases for Experiment 1
()
-
1.
Did not induce a bias for this question.
-
2.
Did not induce a bias for this question.
-
3.
Republicans tend to estimate a higher unemployment rate than democrats.
-
(a)
Democrats: "You believe that Barack Obama did a good job in reducing the US unemployment rate."
-
(b)
Republicans: "You believe that Barack Obama did a poor job in reducing the US unemployment rate."
-
(a)
-
4.
Republicans tend to estimate higher tax revenue than democrats.
-
(a)
Democrats: "You believe that tax rates are not as high as they should be in general."
-
(b)
Republicans: "You believe that tax rates are too high in general."
-
(a)
Induced Biases for Experiment 2
()
-
1.
Democrats tend to estimate a higher military budget than Republicans.
-
(a)
Democrats: "You believe that the US federal budget spent on the US military is too high in general."
-
(b)
Republicans: "You believe that the US federal budget spent on the US military is not as high as it should be in general."
-
(a)
-
2.
Republicans tend to estimate higher number of immigrants than democrats
-
(a)
Democrats: "You believe that the unauthorized immigrants from Mexico were not a major national crisis before President Trump was elected."
-
(b)
Republicans: "You believe that the US federal budget spent on the US military is not as high as it should be in general."
-
(a)
-
3.
Republicans tend to estimate a higher unemployment rate than democrats.
-
(a)
Democrats: "You believe that Barack Obama did a good job in reducing the US unemployment rate."
-
(b)
Republicans: "You believe that Barack Obama did a poor job in reducing the US unemployment rate."
-
(a)
-
4.
Did not induce a bias for this question.
Appendix E Full list of Prompts
In this section, we detail the prompts we use at each time step in the experiments.
{INDUCED_BIAS} Let’s play a game where you’ll be asked a single question, and you must provide an answer. This game has 3 trials, allowing you 2 chances to revise your response. {SOCIAL_SETUP_MESSAGE}At the end of the game, the more accurate your final answer is compared to the actual truth, the more money you will earn. Now, {AGENT_NAME}, in this first round of the game, you are asked to answer the following question. {QUESTION_CONTENT} You must give an answer even if you are not sure. Use the following format: My Reasoning: [YOUR ({AGENT_NAME}’s) REASONING] My Final Answer: [YOUR ({AGENT_NAME}’s) ESTIMATE (A REAL NUMBER)]
In the prompt outline above, the highlighted sections are subject to change based on the configuration of the prompt:
AGENT_PERSONA:
If we are using the detailed personas condition for a prompt, this placeholder is replaced with one of the descriptions from Appendix B.
INDUCED_BIAS:
This placeholder is replaced with a bias corresponding to the party of the agent and the question. A list of these biases can be found in Appendix D.
SOCIAL_SETUP_MESSAGE:
When conducting the experiment with the social condition, this placeholder is replaced with "Keep in mind that it’s a group game, played concurrently with other participants. After you submit your first answer, you’ll be given the average of other players’ initial responses. Following your second submission, you’ll receive the average of their second-round responses.". For the control condition, this placeholder is omitted.
AGENT_NAME:
For the detailed persona condition, this placeholder is derived from the agent persona. For the simple persona condition, this is replaced with a generic name such as "r_1" for republicans and "d_1" for democrats.
QUESTION_CONTENT:
This placeholder is replaced with one of the question from Appendix C.
SOCIAL_FEEDBACK_MESSAGE:
When conducting the experiment with the social condition, this placeholder is replaced with "This time, you are provided with other players in the first round of the game, who are all {AGENT_PARTY}. Their average answer: {FEEDBACK}". The {AGENT_PARTY} can be derived from the persona. For the control condition, this placeholder is omitted.
Appendix F Criteria for Extreme Values in Experiment 2
For questions in Experiment 2 (), the criteria used to determine extreme values are as follows:
-
•
Military spending answers should range between 0% to 100%. Answers outside this range are considered extreme.
-
•
Soldier deaths: Answers above 1 million and answers below 0 are extreme.
-
•
Immigration rate changes: Answers above 1000% or below -1000% are extreme.
-
•
Unemployment rate changes: Answers above 1000% are deemed extreme (no answers fell below -1000%).
These criteria are based on the realistic ranges expected for these measures, as per the guidelines in Becker et al. (2019).
Appendix G Fine-tuning Details
OpenAI’s ChatGPT (gpt-3.5-turbo) was fine-tuned using the human data from Becker et al. (2019) to investigate the change in human-AI alignment in a group interaction setting. 4 models were fine-tuned: a democrat and republican model for the social and control conditions.
Social:
Human data was collected for 12 groups for the social condition. For each agent , a list of 4 neighbours was provided. We recreated the feedback provided to agents in rounds 2 and 3 by taking the average of their neighbours’ estimates in the previous round, given by . The data for each agent was separated into 3 prompt-response pairs, corresponding to a specific round in the experiment. Each pair included the prompt and its corresponding response from the respective round, as well as those from earlier rounds.
Control:
Human data was collected for 4 groups for the control condition. The process for creating fine-tuning pairs mirrored that of the social condition, however, feedback was excluded.
These pairs were passed into OpenAI’s fine-tuning API and the experiment was run on the resulting models.
Appendix H Reduction in Group Error Through Social Interaction
The primary indicator of human-like performance in group settings is the ability to improve estimates over time through social interaction, as per Becker et al. (2019). For this purpose, we define several key terms:
Group Mean ():
For each run , within each condition , and for each political leaning , the group mean at each time step for question is denoted as . It represents the average of the estimates provided by all agents in the group at that time step and is expressed as , where is the total number of agents in the group.
Normalized Group Error ():
The normalized group error, , measures the deviation of the group mean from the ground truth value. It is defined as , where is the ground truth value for question .
Average Normalized Group Error ():
To evaluate group performance across different conditions and time steps, we calculate the average normalized group error, denoted as , for both the Social and Control conditions. This metric represents the average normalized group error at a specific time step in each condition. Formally, for each condition (Social or Control), , where represents the number of political leanings, is the total number of runs in condition ( for Social and for Control), and is the number of questions.
Group Error Reduction ():
The change in normalized group error from the initial to the final estimate is quantified as , indicating error reduction for each run.
Average Group Error Reduction ():
For both the Social and Control conditions, we calculate the average group error reduction. For each condition (Social or Control), the average group error reduction is denoted as and calculated by averaging across all runs, questions, and political leanings. Formally, , where represents the number of political leanings, is the total number of runs in condition ( for Social and for Control), and is the number of questions. This metric quantifies the change in group error over the course of the experiment for each condition.
Wisdom of Partisan Crowds Effect ():
The discrepancy between the Social and Control conditions, calculated as , reflects the wisdom of partisan crowds effect in LLM agents. A more negative value of indicates a stronger wisdom of partisan crowds effect.