Multi-View Spectrogram Transformer for Respiratory Sound Classification
Abstract
Deep neural networks have been applied to audio spectrograms for respiratory sound classification. Existing models often treat the spectrogram as a synthetic image while overlooking its physical characteristics. In this paper, a Multi-View Spectrogram Transformer (MVST) is proposed to embed different views of time-frequency characteristics into the vision transformer. Specifically, the proposed MVST splits the mel-spectrogram into different-sized patches, representing the multi-view acoustic elements of a respiratory sound. These patches and positional embeddings are then fed into transformer encoders to extract the attentional information among patches through a self-attention mechanism. Finally, a gated fusion scheme is designed to automatically weigh the multi-view features to highlight the best one in a specific scenario. Experimental results on the ICBHI dataset demonstrate that the proposed MVST significantly outperforms state-of-the-art methods for classifying respiratory sounds.
Index Terms— Respiratory sound classification, Mel-spectrogram, Vision Transformer, ICBHI dataset
1 Introduction
Respiratory disease has become one of the leading causes of death and disability worldwide. Automatic auscultation of respiratory sounds helps doctors for early diagnosis of lung diseases with adventitious breathing sounds such as crackles and/or wheezes [1]. Many systems have been developed for automated respiratory sound classification. One approach is to transform an audio signal to a time-frequency representation using short-time Fourier transform (STFT) [2, 3, 4, 5, 6, 7, 8, 9, 10], and adapt convolutional neural networks (CNNs) on the mel-spectrogram, a synthetic image, for robust respiratory sound classification [11, 12, 13], e.g., ResNet [2, 4, 5, 6, 3], ResNeSt [7], Temporal Convolutional Network [8] and VGGish-BiGRU [9].
However, existing methods often ignore the differences between spectrograms and natural images, e.g., spectrograms do not contain the visual semantic in natural images [14, 15]. In particular, the two axes of spectrograms represent time and frequency, which are completely different from the two spatial coordinates in natural images. Consequently, we can treat the two dimensions differently based on the different physical meanings to solve the problem more effectively. In literature, Vision Transformer (ViT) has been widely used in many applications [16, 17, 18, 19, 20, 21, 22], which splits an image into a sequence of image patches and extract the attention information from patches using self-attention [16]. Inspired by these methods, a Multi-View Spectrogram Transformer (MSVT) is proposed to capture the acoustic characteristics.
The proposed MSVT is motivated by two factors. 1) The mel spectrogram provides fine resolution for lower frequencies but coarser resolution for higher frequencies [23], while the square patches in audio spectrograms [21, 22] often results in limited spectral information of high-frequency patches. 2) The same type of respiratory sounds may contain significant frequency changes [12], which leads to misalignment of patches in frequency if the patch is too small, or losing the critical frequency information if the patch is too large. To address these two challenges, the proposed MVST embeds different views of spectral characteristics into ViTs using a novel patching scheme that treats the time and frequency axes differently. Specifically, the input mel spectrogram is split into patches of shape varying from as in the ViT [16] to by increasing the bandwidth while reducing the time interval. This partially solves the issue of frequency misalignment. More importantly, patches of a specific size capture a unique view of the mel spectrogram, and collectively these multi-view spectrograms capture different spectral views of a given audio signal. All the patches are then embedded with positional information and fed into the transformer encoders to perform multi-head self-attention, which deeply exploits the spectral characteristics of the audio signal. A gated fusion scheme [24] is then designed to automatically highlight the most suitable view of spectral features for final classification.
Our main contributions can be summarized as follows. 1) The proposed MVST better captures the spectral characteristics of audio signals in different views, and automatically highlights the most suitable spectral view through the gated fusion mechanism. 2) The proposed MVST is evaluated on the ICBHI challenge dataset [1]. It significantly outperforms state-of-the-art methods for respiratory sound classification.
2 Proposed Multi-View Spectrogram Transformer
2.1 Overview of Proposed MVST
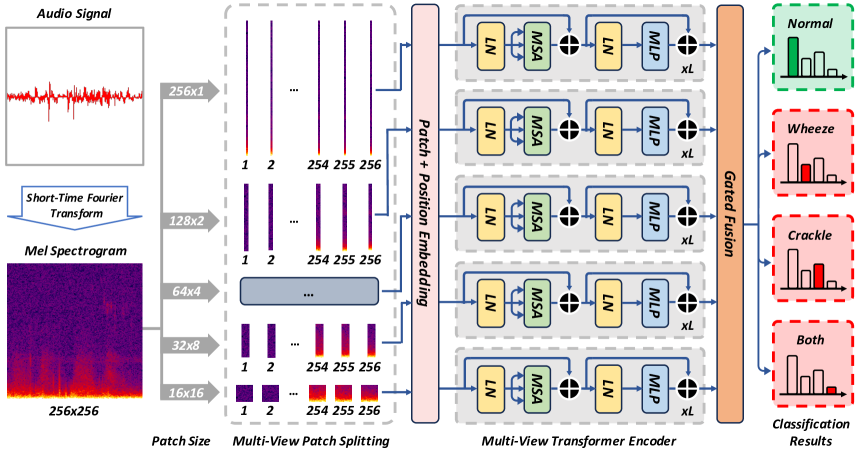
The proposed MVST for respiratory sound classification is shown in Fig. 1. The raw audio signal is first converted into a mel spectrogram using STFT. To capture the multi-view spectral characteristics embedded in different frequency bands at different time intervals, the spectrogram is split into different-sized patches as described in Sec. 2.2. These patches together with the position embeddings are then fed into the transformer encoders, in which the multi-head self-attention (MSA) [16] is utilized to exploit the audio characteristics residing in patches and the long-range interactions between patches as described in Sec. 2.3. As a result, patches with bare spectral information will be less weighed while patches with rich spectral information will be weighed with a greater attentive importance. The recurrent spectral patterns can be more effectively captured across patches. Lastly, the spectral features of different views are fused through the gated fusion scheme for final classification as described in Sec. 2.4.
Specifically, a raw audio signal is divided into overlapping fragments , where each fragment . The spectrogram , , is formed by applying STFT as,
| (1) |
A linear transformation is then applied on the spectrogram to convert it into mel scale to derive the mel spectrogram.
2.2 Multi-View Patch Splitting
The spectrogram is first resized to . The multi-view patch splitting then divides it into patches of size to obtain the set of patches , which represent token vectors of dimension . In the standard ViT [16], a common choice is a square with . The proposed multi-view patch splitting generates patches of different shapes from the spectrogram by considering the time and frequency differently, e.g., for a patch of size , . Each group of patches represent a unique view of audio spectral characteristics, e.g., square patches represent the spectral information in a specific frequency band at a specific time interval while slim and long patches of size represent the entire frequency response at a specific time instance. In practice, five groups of patches are generated from the spectrogram of size , whose size ranges from , , , to , as shown in Fig. 1.
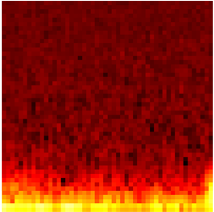
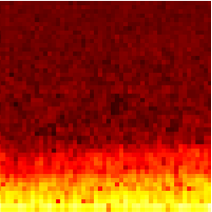
The proposed multi-view patch splitting is motivated by the audio characteristics of respiratory sounds. Fig. 2 shows two example spectrograms derived from the segments of the same crackling breathing cycle but at different time intervals. These two spectrograms should look similar but there is a clear frequency shift in critical components, i.e., the frequency of critical components in Fig. 2(b) are higher than that in Fig. 2(a). If the original patching scheme applies, the audio characteristics in a patch of one spectrogram may not align well to that of another spectrogram, causing misalignment of critical frequency components. In contrast, the newly generated patches have an increasing bandwidth and a reduced time interval, as shown in Fig. 1. These slim and long patches are more tolerant of the frequency shift in respiratory sounds.
2.3 Multi-view Transformer Encoder
As shown in Fig. 1, there are five groups of transformer encoders, one for each view of spectrograms. Each transformer encoder takes the -th group of patches as the input and embeds them into dimensions using an affine transformation to obtain token vectors as in [16]. A positional encoding is added to , i.e., , to supplement the positional information for each token, i.e., the frequency band and the time interval of the audio spectrogram. Next, successive transformer blocks are adopted to extract the attentional features, with each block taking the output of the previous block as the input, i.e., , where . The input to the first block is and the output of the last block is taken as the final feature map.
For each transformer block , as shown in Fig. 1, a multi-head self attention (MSA) [16] is utilized, followed by a multi-layer perceptron (MLP), where the MSA computes the global relations between patch tokens as in [16],
| (2) |
where represents the layer normalization [25]. Then, the MLP with a GELU (Gaussian Error Linear Unit) activiation function derives the output of the -th block as in [16],
| (3) |
2.4 Gated Fusion Scheme
In our specific task, five groups of different-sized patches generate five groups of feature maps through the transformer encoders, each representing a unique view of acoustic characteristics. To constitute a complete view of audio spectrograms from various aspects, the multi-view features are fused using the gated fusion scheme [24], which weighs the feature map using the gated coefficients ,
| (4) |
where indicates the Hadamard (element-wise) product. The gated coefficients are derived as,
| (5) |
where is the learnable weight matrices and is the sigmoid function. The final prediction for a spectrogram is derived using a MLP as . This gated fusion scheme could automatically highlight the most suitable view of spectral characteristics for respiratory sound classification.
3 Experimental Results
3.1 Experimental Settings
The proposed MVST is evaluated on the largest publicly available respiratory sound dataset, the ICBHI dataset [1], which contains 6,898 respiratory cycles, including 3,642 normal breathing, 1,864 crackling breathing, 886 wheezing breathing and 506 breathing with both crackling & wheezing. The sampling rate is 4kHz, 10kHz or 44.1kHz, with a recording duration between 10 and 90 seconds. Each recording includes an average of seven breathing cycles. Following the official experimental settings in [1, 2], 60% of the recordings are randomly selected for training and the remaining 40% for testing. Standard evaluation metrics [1] such as specificity (SP), sensitivity (SE) and average score (AS) are used. For the proposed MVST, the cross-entropy loss function is used with an initial learning rate of . The AdamW optimizer is used with a fixed weight decay of . To ensure the convergence and the efficiency of the model, the maximum number of epochs is set to and the batch size is .
3.2 Ablation Study
An ablation study is carried out to evaluate the effectiveness of the proposed MVST. For the five compared single-view methods, the spectrograms are divided into patches of the specific size and fed into the ViT for classification. The results are summarized in Table 1. It can be observed that: 1) Many other views like , and perform better than the baseline method, which shows the limitation of the baseline method. 2) The patching scheme produces the highest AS of 63.91% among single-view methods, which demonstrates the effectiveness of generating slim and long patches by reducing the time interval while increasing the bandwidth, as this design partially alleviates the problem of frequency misalignment in respiratory sounds. 3) The proposed MVST produces significantly better SP, SE and AS than all single-view methods, which is attributed to the multi-view spectrograms in effectively capturing the audio characteristics, and the gated fusion scheme in combining the multi-view spectrogram features for robust respiratory classification.
| Patch size | SP(%) | SE(%) | AS(%) |
|---|---|---|---|
| (Baseline) | 78.48 | 46.62 | 62.55 |
| 78.55 | 47.50 | 63.02 | |
| 79.70 | 46.10 | 62.90 | |
| 78.12 | 49.71 | 63.91 | |
| 80.92 | 43.75 | 62.33 | |
| Proposed MVST | 81.99 | 51.10 | 66.55 |
3.3 Comparison to State-of-the-art Methods
Many deep neural networks have been utilized as the backbone for respiratory sound classification, e.g., bi-ResNet in LungBRN [4], ResNet-Att in LungAttn [5], ResNeSt [7], ResNet-34 in RespireNet [6], bi-ResNet-Att in ARSC-Net [3], CNN6 [10], Co-tuned ResNet-50 [2] and audio spectrogram transformer with patch-mix and contrastive learning (AST + patch-mix CL) [22]. The comparison with these state-of-the-art methods are summarized in Table 2.111The results of all the compared methods are obtained from here. It can be observed that: 1) Many models utilize traditional CNN models for respiratory classification [2, 4, 5, 6, 3, 7, 10], while the most recent work [22] utilizes audio spectrogram transformer [21] and achieves the previous best results on the ICBHI dataset. This partially motivates us to utilize the ViT as the backbone network. 2) The proposed MVST significantly outperforms all the compared methods in terms of all three criteria SP, SE and AS. Specifically, it outperforms the second-best approach AST + patch-mix CL [22] by 0.33%, 8.09% and 4.18% in terms of SP, SE and AS respectively. Compared to the second best results by Co-tuned ResNet-50 [2], the proposed MVST achieves a performance gain as high as 8.26% in terms of the key metric AS.
| Methods | SP(%) | SE(%) | AS(%) |
|---|---|---|---|
| LungBRN [4] | 69.20 | 31.10 | 50.16 |
| LungAttn [5] | 71.44 | 36.36 | 53.90 |
| ResNeSt [7] | 70.40 | 40.20 | 55.30 |
| RespireNet [6] | 72.30 | 40.10 | 56.20 |
| ARSC-Net [3] | 67.13 | 46.38 | 56.76 |
| CNN6 [10] | 75.95 | 39.15 | 57.55 |
| Co-tuned ResNet-50 [2] | 79.34 | 37.24 | 58.29 |
| AST + patch-mix CL [22] | 81.66 | 43.01 | 62.37 |
| Proposed MVST | 81.99 | 51.10 | 66.55 |
The performance gain of the proposed MVST is attributed to two major factors. 1) The ViT backbone could better extract spectrogram features. Specifically, the ViT partitions the spectrograms into patches with explainable physical meanings, which correspond to the frequency response in a specific frequency band at a particular time interval. The subsequent attention blocks then could utilize the MSA mechanism to better extract the global interactions among patches. 2) The proposed MVST addresses the challenges of frequency misalignment in spectrograms by splitting an audio spectrogram into different-sized patches, capturing the spectral characteristics from different views, and alleviating the problem of frequency shift in respiratory sounds. The ablation study shows that using different patch sizes is beneficial for classifying respiratory sounds, and the gated fusion integrates the discriminative information extracted from different views, leading to the superior performance of the proposed MVST.
4 Conclusion
In this paper, a Multi-View Spectrogram Transformer is proposed to deal with the challenges of classifying respiratory sounds. Different from natural image, we treat the two axes of the synthetic image, mel-spectrogram, differently based on their different physical meanings. The proposed multi-view patch splitting scheme captures different views of the frequency response of audio signals, better comprehends the acoustic elements of respiratory sounds and overcomes the problem of potential frequency shifts. The transformer encoders better extract the spectral characteristics within each patches and the global interaction among patches. These multi-view features are then effectively aggregated by the gated fusion scheme to automatically highlight the most discriminant features in a specific scenario. Experimental results show that the proposed MVST significantly outperforms all the state-of-the-art methods on the ICBHI dataset.
REFERENCES
- [1] Bruno M Rocha, Dimitris Filos, et al., “An open access database for the evaluation of respiratory sound classification algorithms,” Physiological Measurement, vol. 40, no. 3, pp. 035001, 2019.
- [2] Truc Nguyen and Franz Pernkopf, “Lung sound classification using co-tuning and stochastic normalization,” IEEE Transactions on Biomedical Engineering, vol. 69, no. 9, pp. 2872–2882, 2022.
- [3] Lei Xu, Jianhong Cheng, Jin Liu, Hulin Kuang, Fan Wu, and Jianxin Wang, “ARSC-Net: Adventitious respiratory sound classification network using parallel paths with channel-spatial attention,” in IEEE International Conference on Bioinformatics and Biomedicine (BIBM), 2021, pp. 1125–1130.
- [4] Yi Ma, Xinzi Xu, Qing Yu, et al., “LungBRN: A smart digital stethoscope for detecting respiratory disease using Bi-ResNet deep learning algorithm,” in IEEE Biomedical Circuits and Systems Conference (BioCAS), 2019, pp. 1–4.
- [5] Jizuo Li, Jiajun Yuan, Hansong Wang, et al., “LungAttn: advanced lung sound classification using attention mechanism with dual TQWT and triple STFT spectrogram,” Physiological Measurement, vol. 42, no. 10, pp. 105006, 2021.
- [6] Siddhartha Gairola, Francis Tom, Nipun Kwatra, and Mohit Jain, “RespireNet: A deep neural network for accurately detecting abnormal lung sounds in limited data setting,” in 43rd Annual International Conference of the IEEE Engineering in Medicine & Biology Society (EMBC), 2021, pp. 527–530.
- [7] Zijie Wang and Zhao Wang, “A domain transfer based data augmentation method for automated respiratory classification,” in ICASSP, 2022, pp. 9017–9021.
- [8] Ziping Zhao et al., “Automatic respiratory sound classification via multi-branch temporal convolutional network,” in ICASSP, 2022, pp. 9102–9106.
- [9] Dongmin Huang, Lingwei Wang, et al., “A contrastive embedding-based domain adaptation method for lung sound recognition in children community-acquired pneumonia,” in ICASSP, 2023, pp. 1–5.
- [10] Ilyass Moummad and Nicolas Farrugia, “Pretraining respiratory sound representations using metadata and contrastive learning,” in IEEE Workshop on Applications of Signal Processing to Audio and Acoustics, 2023.
- [11] Hendrik Purwins, Bo Li, Tuomas Virtanen, Jan Schlüter, Shuo-Yiin Chang, and Tara Sainath, “Deep learning for audio signal processing,” IEEE Journal of Selected Topics in Signal Processing, vol. 13, no. 2, pp. 206–219, 2019.
- [12] Qiuqiang Kong, Yin Cao, Turab Iqbal, Yuxuan Wang, Wenwu Wang, and Mark D Plumbley, “PANNs: Large-scale pretrained audio neural networks for audio pattern recognition,” IEEE/ACM Transactions on Audio, Speech, and Language Processing, vol. 28, pp. 2880–2894, 2020.
- [13] Jianqiang Li et al., “Explainable CNN with fuzzy tree regularization for respiratory sound analysis,” IEEE Transactions on Fuzzy Systems, vol. 30, no. 6, pp. 1516–1528, 2022.
- [14] Jianfeng Ren and Xudong Jiang, “Regularized 2-D complex-log spectral analysis and subspace reliability analysis of micro-Doppler signature for UAV detection,” Pattern Recognition, vol. 69, pp. 225–237, 2017.
- [15] Jianfeng Ren and Xudong Jiang, “A three-step classification framework to handle complex data distribution for radar UAV detection,” Pattern Recognition, vol. 111, pp. 107709, 2021.
- [16] Alexey Dosovitskiy et al., “An image is worth 16x16 words: Transformers for image recognition at scale,” in ICLR, 2021.
- [17] Wentao He, Jialu Zhang, Jianfeng Ren, Ruibin Bai, and Xudong Jiang, “Hierarchical ConViT with attention-based relational reasoner for visual analogical reasoning,” in AAAI, 2023, vol. 37, pp. 22–30.
- [18] Henghui Ding, Chang Liu, Suchen Wang, and Xudong Jiang, “VLT: Vision-language transformer and query generation for referring segmentation,” IEEE Transactions on Pattern Analysis and Machine Intelligence, vol. 45, no. 6, pp. 7900–7916, 2023.
- [19] Shiliang Chen, Wentao He, Jianfeng Ren, and Xudong Jiang, “Attention-based dual-stream vision transformer for radar gait recognition,” in ICASSP, 2022, pp. 3668–3672.
- [20] Ran Ji, Jiarui Li, Wentao He, Jianfeng Ren, and Xudong Jiang, “Dual-stream siamese vision transformer with mutual attention for radar gait verification,” in ICASSP, 2023, pp. 1–5.
- [21] Yuan Gong, Cheng-I Lai, Yu-An Chung, and James Glass, “SSAST: Self-supervised audio spectrogram transformer,” in AAAI, 2022, vol. 36, pp. 10699–10709.
- [22] Sangmin Bae, June-Woo Kim, Won-Yang Cho, Hyerim Baek, Soyoun Son, Byungjo Lee, Changwan Ha, Kyongpil Tae, Sungnyun Kim, and Se-Young Yun, “Patch-mix contrastive learning with audio spectrogram transformer on respiratory sound classification,” in INTERSPEECH, 2023, pp. 5436–5440.
- [23] Jianfeng Ren, Xudong Jiang, Junsong Yuan, and Nadia Magnenat-Thalmann, “Sound-event classification using robust texture features for robot hearing,” IEEE Transactions on Multimedia, vol. 19, no. 3, pp. 447–458, 2016.
- [24] Jiandong Liu, Jianfeng Ren, Zheng Lu, Wentao He, Menglin Cui, Zibo Zhang, and Ruibin Bai, “Cross-document attention-based gated fusion network for automated medical licensing exam,” Expert Systems With Applications, vol. 205, pp. 117588, 2022.
- [25] Jimmy Ba, Jamie Ryan Kiros, and Geoffrey E Hinton, “Layer normalization,” in NIPS – Deep Learning Symposium, 2016.