From Scroll to Misbelief: Modeling the Unobservable Susceptibility to Misinformation on Social Media
Weiyan Shi
yanchenliu@g.harvard.edu, {wennaqin, amysz, weiyans, diyiy}@cs.stanford.edu,
{ma, weiwang}@cs.ucla.edu, jiaaochen@gatech.edu
Abstract
Susceptibility to misinformation describes the extent to believe unverifiable claims, which is hidden in people’s mental process and infeasible to observe. Existing susceptibility studies heavily rely on the self-reported beliefs, making any downstream applications on susceptability hard to scale. To address these limitations, in this work, we propose a computational model to infer users’ susceptibility levels given their activities. Since user’s susceptibility is a key indicator for their reposting behavior, we utilize the supervision from the observable sharing behavior to infer the underlying susceptibility tendency. The evaluation shows that our model yields estimations that are highly aligned with human judgment on users’ susceptibility level comparisons. Building upon such large-scale susceptibility labeling, we further conduct a comprehensive analysis of how different social factors relate to susceptibility. We find that political leanings and psychological factors are associated with susceptibility in varying degrees. 111We are committed to releasing all the code from our paper, along with our trained model and all collected data.
1 Introduction
False claims spread on social media platforms, such as conspiracy theories, fake news, and unreliable health information, mislead people’s judgment, promote societal polarization, and decrease protective behavior intentions Pennycook and Rand (2021); Nan et al. (2021). The harm is especially significant in various contentious events including elections, religious persecution, and the global response to the COVID-19 pandemic Ecker et al. (2022). Many works have investigated the observable behavior of information propagation such as where the information propagates Taylor et al. (2023), how people share it Yang et al. (2021), and what people discuss about it Gupta et al. (2023). However, it is still crucial but challenging to understand the unobservable mental and cognitive processes when individuals believe misinformation Ecker et al. (2022). Users’ susceptibility (i.e., the likelihood of individuals believing misinformation) plays a pivotal role in this context. If a person is more susceptible to misinformation, they are not only more likely to share false claims but also more prone to being misled by them Scherer and Pennycook (2020).
Existing works have investigated the psychological, demographic and other factors that may contribute to the high susceptibility of a population Brashier and Schacter (2020); Pennycook and Rand (2020). However, previous susceptibility studies heavily rely on self-reported belief towards false claims collected from questionnaire-based participant survey Escolà-Gascón et al. (2021); Rosenzweig et al. (2021), which presents several limitations. For instance, different participants might interpret the believing levels in different ways. Moreover, the data collection process is labor-heavy, and thus limits the scale of downstream research on size, scope and diversity of the target population Nan et al. (2022a).
The unobservance of people’s beliefs makes it infeasible to model susceptibility directly. Luckily, existing psychological literature bridges unobservable beliefs and observable behaviors, showing that the sharing behavior is largely influenced by whether users believe the misinformation Altay et al. (2022); Atske (2019), the attributes of the sharing content Pennycook and Rand (2021); Van Der Linden (2022), and users’ internal mental motives Brady et al. (2020a); Islam et al. (2020). Motivated by these prior works, we formulate the relationship between believing and sharing described in social science literature into a machine learning task. Concretely, we propose to infer people’s susceptibility level given their re/posting behaviors. To parameterize the model, we wrap the susceptibility level as input for the prediction model of the observable reposting behavior. We perform multi-task learning to simultaneously learn to classify whether a user would share a post, and rank susceptibility scores among similar and dissimilar users when the same content is seen. Note that our model does not aim to predict any ground-truth susceptibility for individuals. Instead, we use users’ reposting behaviors towards misinformation as a proxy for their susceptibility level for better interpretability. Our model design enables unobservable modeling with supervision signals for observable behavior, unlocks the scales of misinformation-related studies, and provides a novel perspective to reveal the users’s belief patterns.
We conduct comprehensive evaluations to validate the proposed susceptability measurement and find that that the estimations from our model are highly aligned with human judgment. Building upon such large-scale susceptibility labeling, we further conduct a set analysis of how different social factors relate to susceptibility. We find that political leanings and psychological factors are associated with susceptibility in varying degrees. Moreover, our analysis based on these inferred susceptability scores corroborates the findings of previous studies based on self-reported beliefs, e.g. stronger analytical thinking is an indicator of low susceptibility. The results of our analysis extend findings in existing literature in a significant way. For example, we demonstrate that, susceptibility distribution in the U.S. exhibits a certain degree of correlation with political leanings. To sum up, our contributions are:
-
•
We propose a computational model to infer people’s susceptibility towards misinformation in the context of COVID-19, by modeling unobservable latent susceptibility through observable sharing activities.
-
•
Evaluation shows that our model effectively models unobservable belief, and the predictions highly correlate with human judgment.
-
•
We conduct a large-scale analysis to uncover the underlying factors contributing to susceptibility across a diverse user population from various professional fields and geographical regions, presenting important implications for related social science studies.
2 Related Work
Measure of Susceptibility.
The common practice to measure susceptibility is to collect self-reported absolute or relative agreement or disagreement with (or perceived accuracy, credibility, reliability, or validity of) one or more claims verified to be false from a group of individuals Roozenbeek et al. (2020a); Escolà-Gascón et al. (2021); Rosenzweig et al. (2021); Nan et al. (2022b). A small number of studies indirectly assess the susceptibility by its impact, however they can only capture behaviors rather than people’s belief Loomba et al. (2021). Instead of using expensive and limited self-reported beliefs, we propose a computational model to estimate susceptibility at scale.
Contributing Factors and Application of Susceptibility
Relying on the manually collected susceptibility annotation, previous research investigates the psychological, demographic and more factors that contribute to users’s susceptibility Bringula et al. (2022); van der Linden (2022). These factors include emotion Sharma et al. (2023) (e.g. anger and anxiety; Weeks, 2015), analytic thinking Li et al. (2022), partisan bias Roozenbeek et al. (2022a), source credibility Traberg and van der Linden (2022), and repetition Foster et al. (2012). Many theories have been proposed about the reason behind suscetibility Scherer et al. (2021a), including limited knowledge acquiring and literacies capabilities Brashier and Schacter (2020), strong preexisting beliefs Mis , neglecting to sufficiently reflect about the truth Pennycook and Rand (2020) or overconfidence Salovich et al. (2021).
Better understandings of the phenomenon and mechanism of susceptibility promote application in bots spread analysis Himelein-Wachowiak et al. (2021), revealing community properties in information pathways Taylor et al. (2023); Ma et al. (2023), and combating misinformation by emphasizing publisher Dias et al. (2020) and prebunking interventions based on inoculation Roozenbeek et al. (2020b, 2022b). However, a significant limitation in current susceptibility research is the absence of a computational modeling framework. To address this, we propose a model capable of inferring people’s susceptibility scores using their reposting behaivor, which facilitates susceptibility mechanisms understanding for large-scale populations.
Inferring Unobservables from Observables
Latent constructs/variables refer to the concepts extracted from various theories that cannot be observed directly. Many studies have shown that unobservable variables can be inferred indirectly through a model from other observable variables Bollen (2002); Borsboom et al. (2003). The unobservable variables can be inferred by using models like nonlinear mixed-effects models, hidden Markov models or latent class models. We use a neural network-based architecture to represent the latent variable, which then serves as part of the input to predict observable variable.
3 Believing is a Driver for Sharing
Definition of Susceptibility Score
We define misinformation as the information that is false, inaccurate, or misleading, which could be created deliberately or accidentally Pennycook and Rand (2021). Susceptibility to misinformation is defined as the belief in misinformation and related constructs, including discernment between true and false claims and the extent to which exposure to misinformation misleads subsequent decisions Nan et al. (2022b).
Observable Perceiving and Disseminating Behaviors vs Unobservable Believing Beliefs
The definition of susceptibility focuses on believing misinformation, while excluding people’s tendency to disseminate misinformation or the extent of exposure to misinformation. Perceiving is a pre-condition of believing Altay et al. (2023), but believing and sharing do not hold a containment relationship due to their distinct underlying psychological, demographic, or behavioral factors Pennycook and Rand (2021); Ecker et al. (2022). Both perceiving and sharing are observable actions while believing is an unobservable event. Data for the sharing behavior is relatively easy to obtain as it is reflected directly in users’ repost and reply data. Obtaining perceiving-related data is constrained by social media platforms. Furthermore, it is impossible to obtain users’ belief data without interviewing users as believing is an internal mental event.
Relationship between Believing and Disseminating
Believing a piece of misinformation is an important driver to trigger the sharing action. Studies suggest that people are likely to share things they genuinely believe Altay et al. (2022). Most people report that they would need to be paid to share the news that is regarded as false by them due to the concern of possible reputation costs; even when stories favor their political views Atske (2019).
Moreover, the sharing behavior is also influenced by many other factors. On the one hand, sharing action is heavily related to the content itself. The inattention or “classical reasoning” account contends that people are committed to sharing accurate information even though the unique context of social media disrupts their capacity to critically assess the accuracy of news Pennycook and Rand (2021); Van Der Linden (2022). Additionally, sharing is also often dictated by what captures attention, such as moral-emotional and arousing words Brady et al. (2020b), content triggering angry mood can also boost misinformation sharing Han et al. (2020). On the other hand, internal psychological motives, which could be reflected in peoples’ profiles, are also important factors for sharing Brady et al. (2020a); Islam et al. (2020).
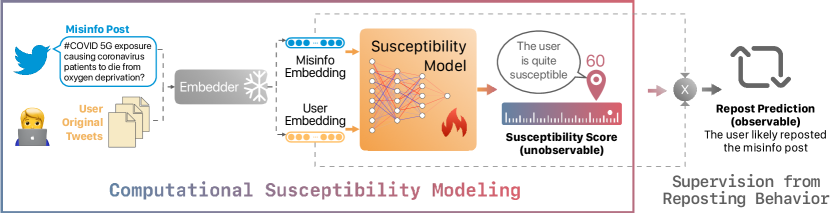
4 Computational Susceptibility Modeling
Inspired by the existing studies indicating that believing is an essential driver for disseminating, we propose to model susceptibility, which reflects users’ beliefs, as a driver for the sharing behavior, while considering characteristics of the sharing content and user profile. We propose a computational model to infer a user’s unobservable susceptibility score based on their historical activities (§4.1) as shown in Figure 1, and further train the model with signals from the observable disseminating behavior (§4.2). We construct approximate contrastive user-post pairs as the training data (§5). This design would allow us to explore the best parameters for the computational model of an unobservable and data-hungry susceptibility variable using the rich data resources available on social media platforms.
4.1 Modeling Unobservable Susceptibility
Content-Sensitive Susceptibility
We compute the user’s susceptibility when a particular piece of misinformation is perceived (i.e. ). This allows us to account for the fact that an individual’s susceptibility can vary across different content, influenced by factors such as topics and linguistic styles. By focusing on the susceptibility to specific pieces of misinformation, we aim to create a more nuanced, fine-grained and accurate representation of how users interact with and react to different COVID-19 misinformation.
User and Misinfo Post Embeddings
As a component of the computational model, we use SBERT Reimers and Gurevych (2019) developed upon RoBERTa-large Liu et al. (2019) to produce a fixed-sized vector to represent the semantic information contained in the posts and user profiles. We consider the misinformation post as a sentence and produce its representation with SBERT. For the user profile, we calculate the average of sentence representations for the user’s recent original posts. More specifically, for every user-post pair , we gather the historical posts written by user within a 10-day window preceding the creation time of the misinformation post , to learn a representation of user at that specific time22210 days is a period that has enough data to reflect a user’s behavior and is also recent enough to capture their dynamics..
Computational Model for Susceptibility
Given the input of user profile for the user and the content for misinformation post , the susceptibility computational model is expected to produce the susceptibility score as shown in Equation 1, reflecting the susceptibility of when is perceived.
| (1) |
We first obtain the embeddings and for post and user profile , where is represented by the user’s historical tweets and is the frozen SBERT sentence embedding function. The susceptibility score is calculated by the function , which is implemented as a multi-layer neural network, taking the concatenation of the user and post embeddings as inputs. In the training phase, we keep the sentence embedder frozen and learn the weights for the function that could be used to produce reasonable susceptibility scores. We expect to produce susceptibility scores for novel and pairs using the learned function during inference. Additionally, we normalize the resulting susceptibility scores into the -100 to 100 range for better interpretability.
4.2 Training with Supervision from Observable Behavior
Susceptibility is not easily observable, thus it is infeasible to apply supervision on directly as only the user themselves know their belief towards content . Thus, we propose to utilize the supervision signal for sharing a piece of misinformation, which is an observable behavior. We consider susceptibility as an essential factor of sharing behavior and use the susceptibility computational model’s output to predict the repost behavior.
To produce the probability for user to share post , we calculate the dot product of the embeddings of the user profile and post content and consider the susceptibility score for the same pair of and as a weight factor, and passing the result through a sigmoid function, as illustrated in Fig. 1.
| (2) |
Note that we do not directly employ the susceptibility score to compute the probability of sharing because the sharing behavior depends not only on the susceptibility level but also on other potential confounding factors. It is possible that a user possesses a notably high susceptibility score for a piece of misinformation yet chooses not to repost it. Hence, we incorporate a dot product of the user and post embedding in our model involve the misinformation post content and user profiles into the consideration of predicting the sharing behavior.
| (3) |
Objectives
We perform multi-task learning to utilize different supervision signals. We first consider a binary classification task of predicting repost or not with a cross-entropy loss. Additionally, we perform the triplet ranking task Chen et al. (2009); Hoffer and Ailon (2015) to distinguish the subtle differences among the susceptibility scores of multiple users when the same false content is present.
During each forward pass, our model is provided with three user-post pairs: the anchor pair , the similar pair , and the dissimilar pair . We determine the similar user as the user who reposted if and only if user reposted . Conversely, the dissimilar user is determined by reversing this relationship. When multiple potential candidate users exist for either or , we randomly select one. However, if there are no suitable candidate users available, we randomly sample one user from the positive (for “reposted” cases) or negative examples (for “did not repost” cases) and pair this randomly chosen user with this misinformation post .
In Eq. 3, we elaborate on the definition of our loss function. Here, takes the value of 1 if and only if user reposted misinformation post . The parameter corresponds to the margin employed in the triplet loss, serving as a hyperparameter that determines the minimum distance difference needed between the anchor and the similar or dissimilar sample for the loss to equal zero. Additionally, we introduce the control hyperparameter , which governs the weighting of the binary cross-entropy and triplet loss components.
5 Dataset and Experiment Setup
We use Twitter data because it hosts an extensive and diverse collection of users, the accessibility of its data, and its popularity for computational social science research Zhang and Counts (2015). Additionally, it provides users’ free-text personal and emotional expression with crucial metadata, including timestamps and location data, which are useful for our subsequent analytical endeavors.
Misinformation Tweets
We consider two misinformation tweet datasets: the ANTi-Vax dataset Hayawi et al. (2022) was collected and annotated specifically for COVID-19 vaccine misinformation tweets. On the other hand, CoAID (Covid-19 Healthcare Misinformation Dataset; Cui and Lee, 2020) encompasses a broader range of misinformation related to COVID-19 healthcare, including fake news on websites and social platforms. The former dataset contains 3,775 instances of misinformation tweets, while the latter contains 10,443.
However, a substantial number of tweets within these two datasets do not have any retweets. Consequently, we choose to retain only those misinformation tweets that have been retweeted by valid users. Finally, we have collected a total of 1,271 misinformation tweets for our study.
Positive Examples
We define the positive examples for modeling as pairs, where user viewed and retweeted the misinformation tweet . We obtained all retweeters for each misinformation tweet through the Twitter API.333https://developer.twitter.com/en/docs/twitter-api
Negative Examples
Regarding negative examples, we define them as pairs where user viewed but did not retweet misinformation post . However, obtaining these negative examples poses a substantial challenge, because the Twitter API does not provide information on the “being viewed” activities of a specific tweet. To tackle this issue, we infer potential users that highly likely viewed a given tweet following the heuristics: 1) should be a follower of the author of the misinformation tweet , 2) should not retweet , and 3) was active on Twitter within 10 days before and 2 days after the timestamp of .
We have collected a total of 3,811 positive examples and 3,847 negative examples, resulting in a dataset comprising 7,658 user-post pairs in total. We divide the dataset into three subsets with an 80% - 10% - 10% split for train, validation, and test purposes, respectively. The detailed statistics of the collected data are illustrated in Tab. 1. We provide the training details of our model in Appendix A.
| Total | Positive | Negative | |
| # Example | 7658 | 3811 | 3847 |
| \hdashline# User | 6908 | 3669 | 3255 |
| # Misinfo tweet | 1271 | 787 | 1028 |
6 Evaluation
| Our | Baseline | ChatGPT | |
| Agreement |
In this section, we demonstrate the effectiveness of our susceptibility modeling by directly comparing our estimations with human judgment (§6.1) and indirectly evaluating its performance for predicting sharing behavior (§6.2 and §6.3).
6.1 Validation with Human Judgement
Due to the abstract nature of susceptibility and the lack of concrete ground truth, we face challenges in directly evaluating our susceptibility modeling. We use human evaluations to validate the effectiveness of our inferred susceptibility. Given the subjectivity inherent in the concept of susceptibility, and to mitigate potential issues arising from variations in individual evaluation scales, we opt not to request humans to annotate a user’s susceptibility directly. Instead, we structure the human evaluation as presenting human evaluators with pairs of users along with their historical tweets and requesting them to determine which user appears more susceptible to overall COVID-19 misinformation. We provide more details regarding the human judgment framework and the utilized interface in Appendix B.
Subsequently, we compared the predictions made by our model with the human-annotated predictions. To obtain predictions from our model, we compute each user’s susceptibility to overall COVID-19 misinformation by averaging their susceptibility scores to each COVID-19 misinformation tweet in our dataset. As presented in Tab. 2, our model achieves an average agreement of 73.06% with human predictions, indicating a solid alignment with the annotations provided by human evaluators. Additionally, we consider a baseline that directly calculates susceptibility scores as the cosine similarity between the user and misinformation tweet embeddings. Compared to this baseline, our susceptibility modeling brings a 10.06% improvement. Moreover, we compare the performance with ChatGPT prompting with the task description of the susceptibility level comparison setting as instruction in a zero-shot manner (more details are in Appendix C). We observe that our model also outperforms predictions made by ChatGPT. The results from the human judgment validate the effectiveness of our susceptibility modeling and its capability in reliably assessing user susceptibility to COVID-19 misinformation.
6.2 Susceptibility Score Distribution
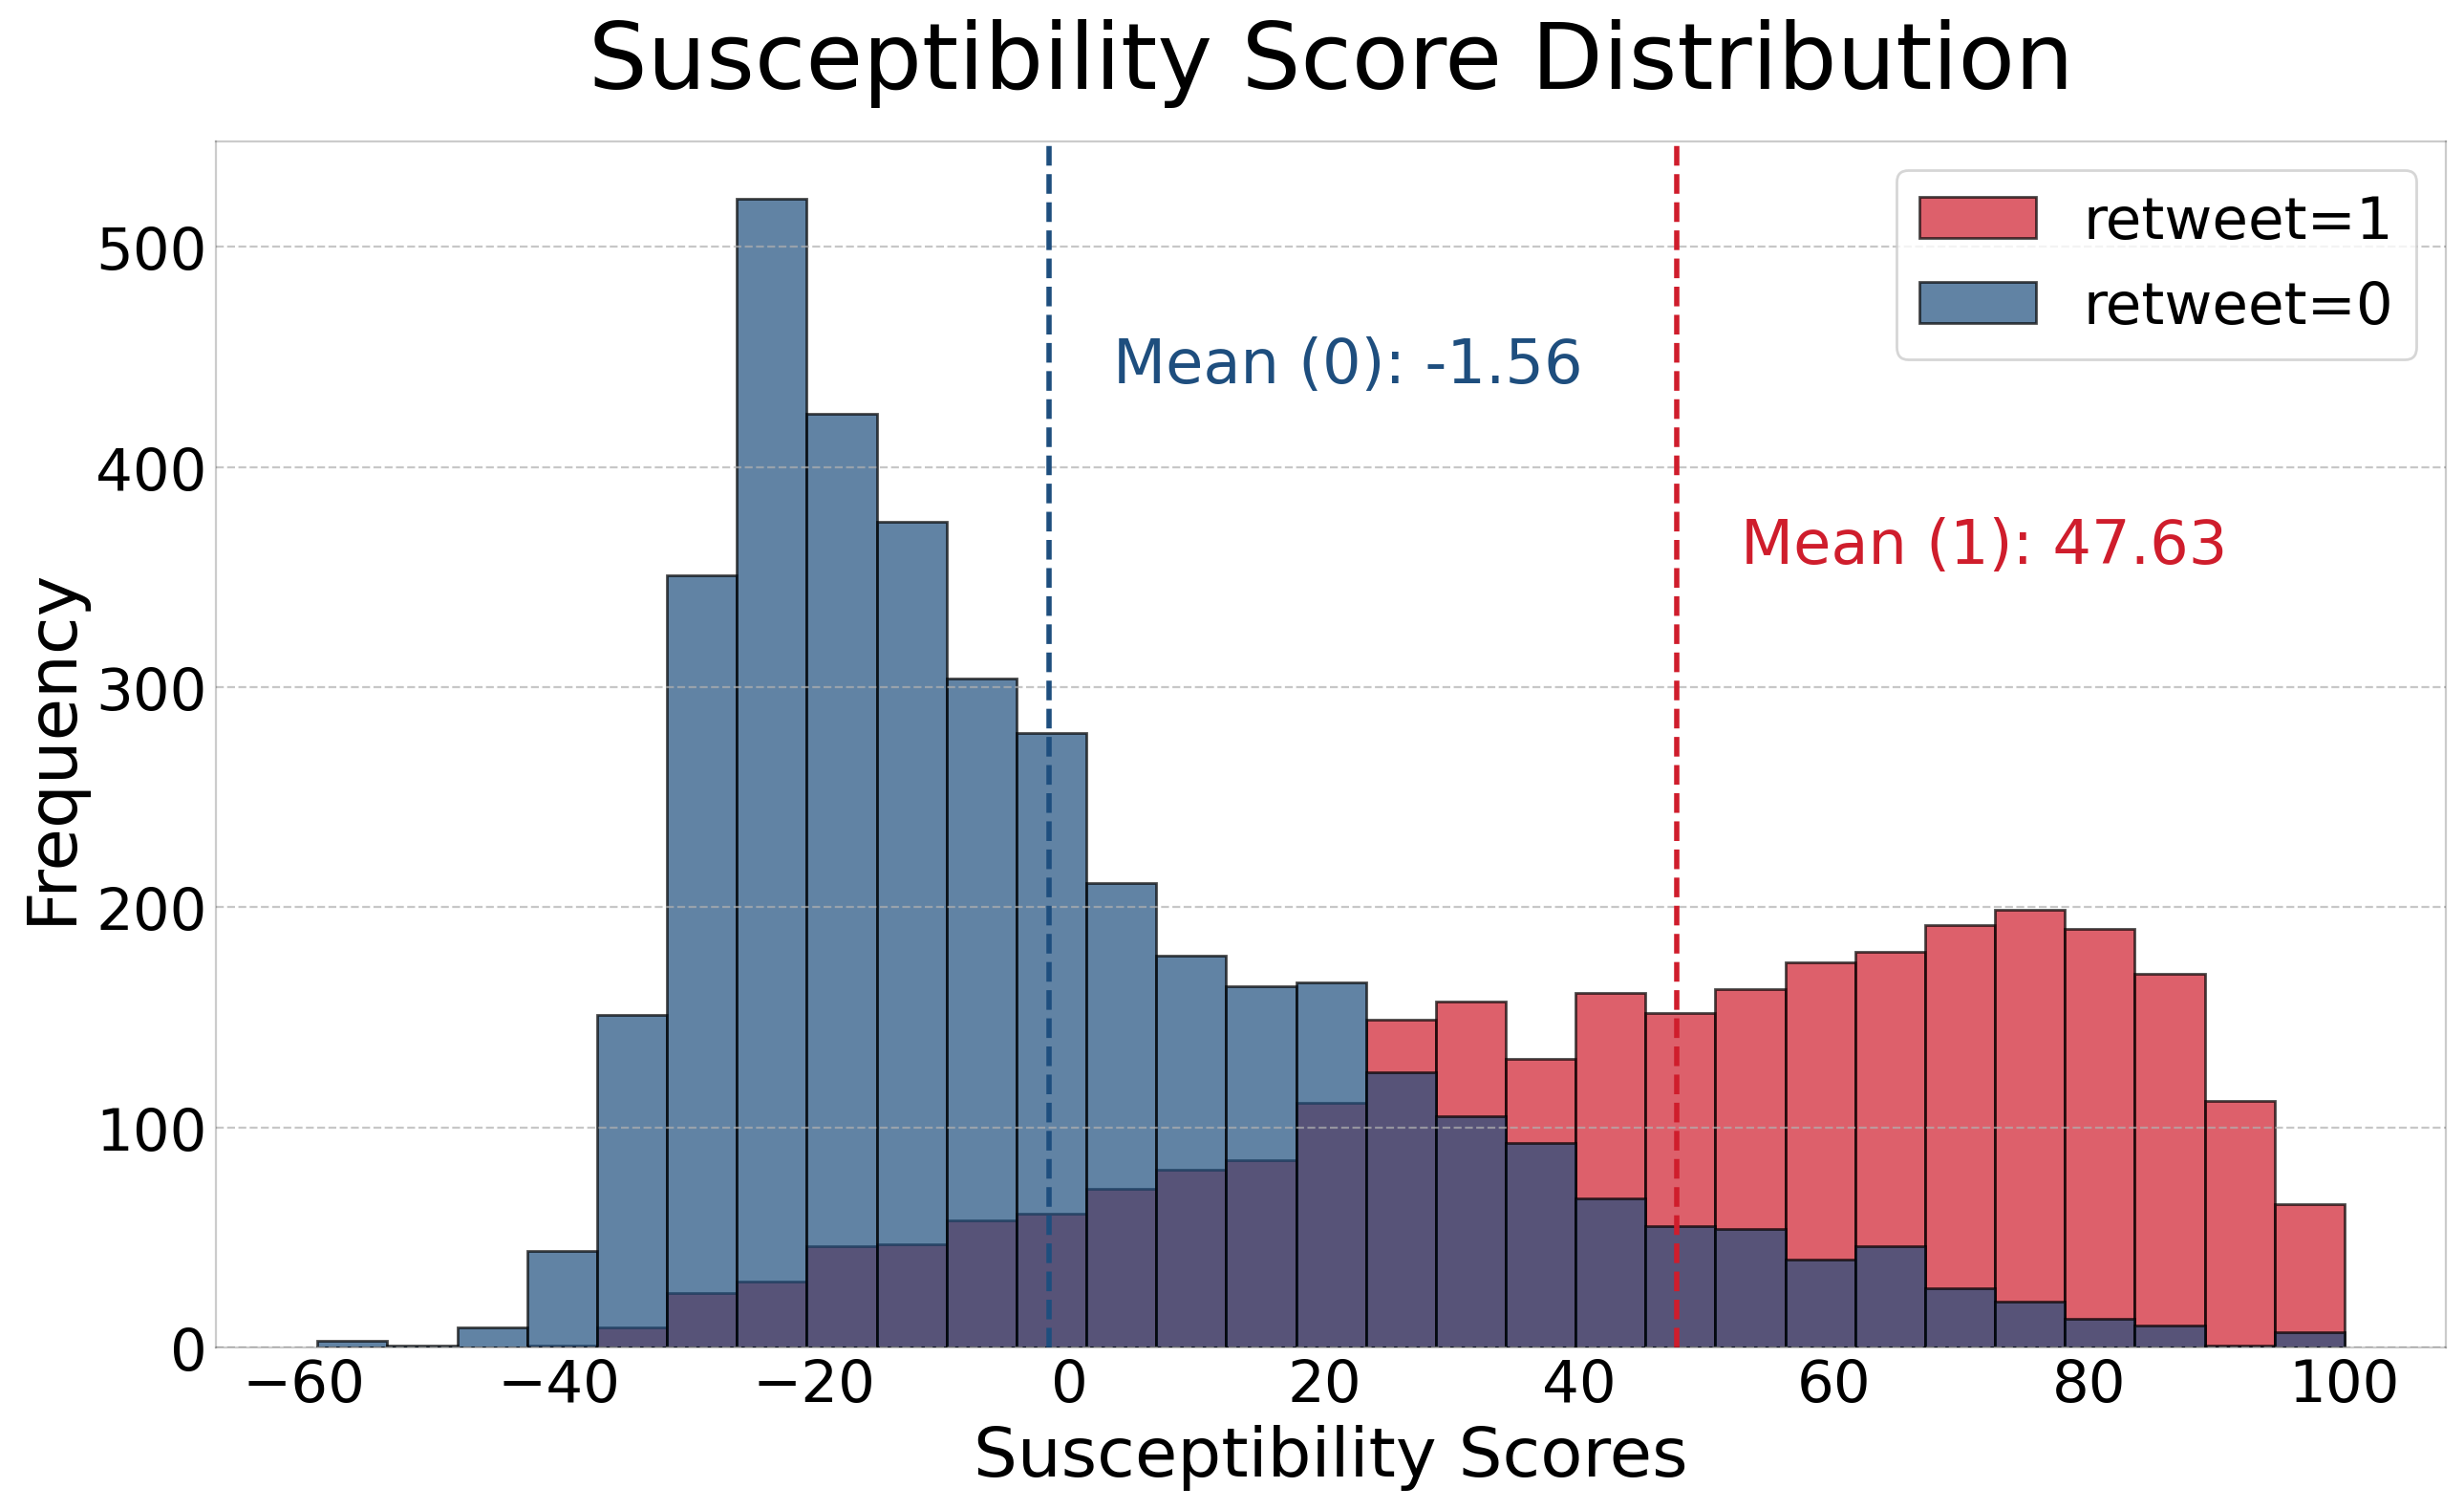
We provide a visualization of the distribution of susceptibility scores within positive and negative examples produced by our model on the training data. As depicted in Fig. 2, there is a notable disparity in the distribution between positive and negative examples, verifying our assumption that believing is an essential driver for the sharing behavior. The difference in the means of the positive and negative groups is statistically significant, with a p-value of less than 0.001.
6.3 Sharing Behavior Prediction
Furthermore, as detailed in §3, holding a belief is highly likely to result in subsequent sharing behavior. We demonstrated that our trained model possesses a strong ability for sharing behavior prediction. When tested on the held-out test dataset, our model achieves a test accuracy of 78.11% and an F1 score of 77.93. These results indirectly demonstrate the reliable performance of our model for susceptibility modeling.
7 Analysis
In this section, we show the potential of our inferred susceptibility scores in expanding the scope of susceptibility research. Our analysis not only aligns with the findings of previous survey-based studies (§7.1) but also goes a step further by extending and enriching their conclusions (§7.2).
7.1 Correlation with Psychological Factors
Previous research on human susceptibility to health and COVID-19 misinformation has been primarily based on questionnaire surveys Scherer et al. (2021b); Nan et al. (2022c); Van Der Linden (2022). These studies have identified several psychological factors that influence individuals’ susceptibility to misinformation. For instance, analytical thinking (as opposed to intuitive thinking), trust in science, and positive emotions have been linked to a greater resistance to health misinformation. Conversely, susceptibility to health misinformation is associated with factors such as conspiracy thinking, religiosity, conservative ideology, and negative emotions. In this part, we analyze the correlation coefficients between our modeled susceptibility scores and the aforementioned factors to determine if our results align with previous research findings.
To achieve this, we compute factor scores for each user in our dataset based on their historical tweets using LIWC Analysis.444https://www.liwc.app/. We calculate the average value across all the user’s historical tweets as the final factor score. However, for emotional factors such as anxiety and anger with less frequent appearance, we opt for the maximum value instead to more effectively capture these emotions. We primarily consider the following factors: Analytic Thinking, Emotions (Positive emotions, Anxious, Angery and Sad), Swear, Political Leaning, Ethnicity, Technology, Religiosity, Illness and Wellness. These factors have been extensively studied in previous works and can be inferred from a user’s historical tweets. We calculate and plot the pearson correlation coefficients between each factor and the susceptibility predicted by our model in Tab. 3.
According to our analysis, correlations are consistent with previous social science studies based on surveys on health susceptibility. For instance, Analytic Thinking is a strong indicator of low susceptibility, with a correlation coefficient of -0.31. Conversely, certain features such as Swear, Political Leaning and Angery exhibit a weak correlation with a high susceptibility score. These results not only corroborate the conclusions drawn from previous survey-based studies Van Der Linden (2022); Nan et al. (2022b) but also provide further validation for the effectiveness of our computational modeling for susceptibility.
| Factors | Coeff. | Factors | Coeff. |
| Analytic Thinking | -0.31 | Emotion - Positive | -0.08 |
| Political Leaning | 0.13 | Emotion - Anxious | 0.08 |
| Ethnicity | 0.09 | Emotion - Angry | 0.16 |
| Religiosity | 0.10 | Emotion - Sad | 0.14 |
| Technology | -0.09 | Swear | 0.18 |
| Illness | 0.09 | Wellness | -0.02 |
7.2 Community Differences
We further leverage our model to investigate how susceptibility differs and compares between different community groups on social networks. We consider two different types of communities: professional and geographical communities. To perform a robust analysis among different communities, a substantial user dataset is needed. To address this requirement, we sample 100,000 users across the world from the existing COVID-19 Tweet Dataset Taylor et al. (2023) which contains all COVID-19-related tweets for a certain time period, each of whom has posted more than 100 historical tweets between January 2020 and April 2021. We utilize the Twitter API to collect their description and location information, and extract their occupations from their self-reported user descriptions. We operationalize the valid range of susceptibility scores of an individual as -100 to 100, where -100 indicates the individual holds the most resistance to misinformation, and 100 means the individual is easiest to believe in misinformation when they perceive false claims. To obtain an aggregated susceptibility score for a community, we calculate the mean of individual susceptibility scores for all users in the community. Note that we focus on susceptibility towards COVID-19-related public health misinformation in this section.
| Occupation | Suscep. | # Users |
| None | 4.6201 | 35145 |
| Arts and Media | -0.1504 | 12635 |
| Science and Technology | -2.2076 | 7170 |
| Finance and Business | -5.4192 | 5844 |
| Health and Medicine | -5.4762 | 6272 |
| Society and Public | -6.7747 | 10973 |
| Education | -7.8070 | 5261 |
Occuptation and Professional Community
We first explore how susceptibility varies among users with different occupations. There is a social consensus on the susceptibility of the community of practitioners of a specific occupation. For example, susceptibility scores towards health misinformation are expected to be significantly lower among experts in health-related fields compared to the general population Van Der Linden (2022); Nan et al. (2022c). We consider the following professional communities and compare their average susceptibility scores: Eduction (Edu), Society and Public (S&P), Health and Medicine (H&M), Finance and Bussiness (F&B), Science and Technology (S&T), Arts and Media (A&M), as well as None for Twitter users who do not specify their occupation in their user description. The results are presented in Tab. 4. We note that professions closely associated with S&T, H&M, and Edu tend to display lower susceptibility to COVID-19 misinformation. In contrast, occupations within the A&M sector demonstrate comparatively higher susceptibility, likely due to their heightened exposure to misinformation. This aligns with our expectations and reinforces previous findings that expertise and knowledge in relevant fields serve as protective factors against misinformation Nan et al. (2022c).
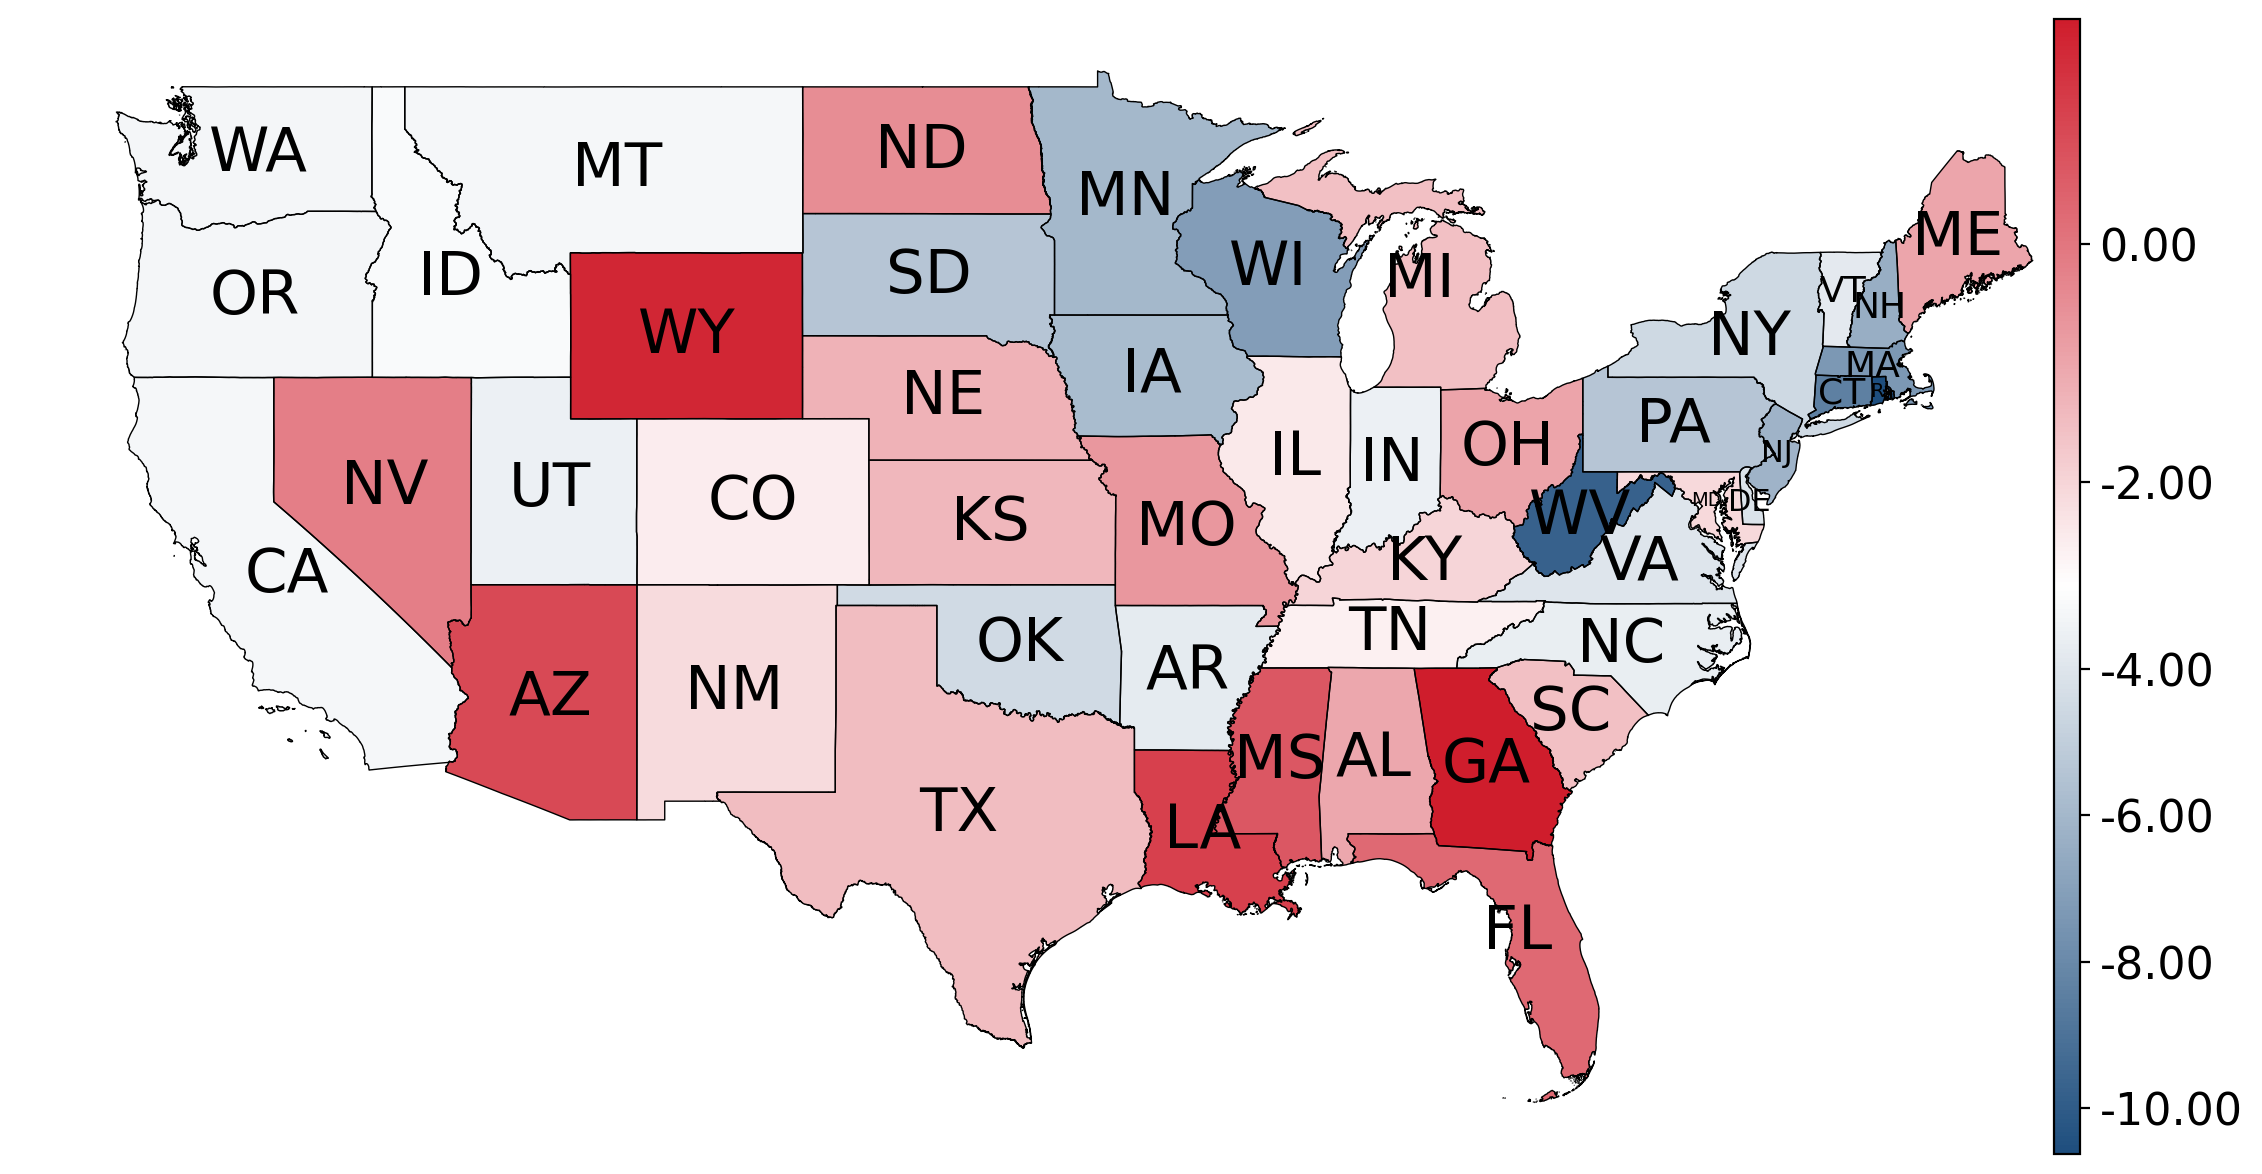
Geographical Community
Next, we delve into the geographical distribution of susceptibility.555Given the significant imbalance in the number of users from different U.S. states, we calculate the average susceptibility scores for each state using bayesian smoothing. We use the overall mean susceptibility score and overall standard deviation as our priors and the more the users in the group, the less the overall mean will affect the group’s score. We explore the susceptibility distribution among different U.S. states, considering the influence of political ideology associated with different states Gelman (2009). Out of the 100,000 users sampled from around the world, 25,653 users are from U.S. states with more than 200 users for each state. As illustrated in Fig. 3, the susceptibility distribution across U.S. states is imbalanced and exhibits a certain degree of correlation with political leanings, where generally, states known to have a more conservative population tend to have relatively higher susceptibility scores, while states that are considered more liberal have lower scores. Specifically, the average susceptibility score for users in blue or red states is -3.66 and -2.82 respectively.666Red or blue states refer to US states whose voters vote predominantly for the Republican or Democratic Party. We determine blue/red states according to the 2020 presidential election result. We observe that 60% of the ten states with the highest susceptibility scores are red states, and 90% of the ten states with the lowest susceptibility scores are blue states. This is a trend that has been observed in various research where political ideology influences the perception of scientific information McCright et al. (2013); Baptista et al. (2021); Imhoff et al. (2022). However, it is crucial to acknowledge the limitations of our analysis, as it solely reflects the susceptibility distribution of the sampled users within each state.
We present the average susceptibility scores calculated based on our sampled users for each U.S. state, along with the corresponding number of users in Appendix D.
8 Conclusion
In this work, we propose a computational approach to model people’s “unobservable” susceptibility to misinformation. While previous research on susceptibility is heavily based on self-reported beliefs collected from questionnaire-based surveys, our model trained in a multi-task manner can approximate user’s susceptibility scores from their reposting behavior. When compared with human judgment, our model shows highly aligned predictions on a susceptibility comparison evaluation task. To demonstrate the potential of our computational model in extending the scope of previous misinformation-related studies, we leverage susceptibility scores generated by our model to analyze factors contributing to misinformation susceptibility. This thorough analysis encompasses a diverse U.S. population from various professional and geographical backgrounds. The results of our analysis algin, corroborate and expand upon the conclusions drawn from previous survey-based computational social science studies.
Limitations
Besides investigating the underlying mechanism of misinformation propagation at a large scale, the susceptibility scores produced by our model have the potential to be used to visualize and interpret individual and community vulnerability in information propagation paths, identify users with high risks of believing in false claims and take preventative measures, and use as predictors for other human behavior such as following and sharing. However, while our research represents a significant step in modeling susceptibility to misinformation, several limitations should be acknowledged.
First, our model provides insights into susceptibility based on the available data and the features we have incorporated. However, it’s important to recognize that various other factors, both individual and contextual, may influence susceptibility to misinformation. These factors, such as personal experiences and offline social interactions, have not been comprehensively incorporated into our model and should be considered in future research.
Moreover, the susceptibility scores modeled by our model represent an estimation of an individual’s likelihood to engage with misinformation. These scores may not always align perfectly with real-world susceptibility levels. Actual susceptibility is a complex interplay of cognitive, psychological, and social factors that cannot be entirely captured through computational modeling. Our model should be seen as a valuable tool for understanding trends and patterns rather than providing definitive individual susceptibility assessments.
Finally, our study’s findings are based on a specific dataset and may not be fully generalizable to all populations, platforms, or types of misinformation. For example, due to the high cost of data collection, not all countries or U.S. states have a sufficient amount of Twitter data available for analysis, especially when we examine the geographical distribution of susceptibility. Furthermore, platform-specific differences and variations in the types of misinformation can potentially impact the effectiveness of our model and the interpretation of susceptibility scores.
Ethics Statement
Analyzing and modeling susceptibility to misinformation can potentially raise several ethical concerns, particularly when applied at an individual level. Due to its dual nature, our model can not only be used to identify users with a high risk of believing in false claims and taking preventative measures to reduce harm, but it also holds the potential for misuse by malicious actors, leading to privacy violations, stigmatization, and targeted attacks. To minimize the risk, we refrained from using any personally identifiable information (PII) data in our work. Nevertheless, it is of paramount importance to consider the ethical implications associated with the deployment of computational models like ours, enhance regulatory oversight, and ensure responsible and transparent utilization.
We acknowledge the need for ongoing ethical scrutiny and are committed to the responsible release of our model, and this includes requiring users to sign a Data Use Agreement that explicitly prohibits any malicious or harmful use of our model. Within this agreement, researchers and practitioners will also be required to acknowledge the limitations (§Limitations), that our model may not fully or accurately represent an individual’s real susceptibility level.
References
- (1) Misinformation and Its Correction: Continued Influence and Successful Debiasing - Stephan Lewandowsky, Ullrich K. H. Ecker, Colleen M. Seifert, Norbert Schwarz, John Cook, 2012.
- Altay et al. (2023) Sacha Altay, Manon Berriche, and Alberto Acerbi. 2023. Misinformation on Misinformation: Conceptual and Methodological Challenges. Social Media + Society, 9(1):20563051221150412.
- Altay et al. (2022) Sacha Altay, Anne-Sophie Hacquin, and Hugo Mercier. 2022. Why do so few people share fake news? It hurts their reputation. New Media & Society, 24(6):1303–1324.
- Atske (2019) Sara Atske. 2019. Many Americans Say Made-Up News Is a Critical Problem That Needs To Be Fixed.
- Baptista et al. (2021) João Pedro Baptista, Elisete Correia, Anabela Gradim, and Valeriano Piñeiro-Naval. 2021. The influence of political ideology on fake news belief: The portuguese case. Publications, 9(2):23.
- Bollen (2002) Kenneth A. Bollen. 2002. Latent Variables in Psychology and the Social Sciences. Annual Review of Psychology, 53(1):605–634.
- Borsboom et al. (2003) Denny Borsboom, Gideon J. Mellenbergh, and Jaap van Heerden. 2003. The theoretical status of latent variables. Psychological Review, 110(2):203–219.
- Brady et al. (2020a) William J. Brady, M. J. Crockett, and Jay J. Van Bavel. 2020a. The MAD Model of Moral Contagion: The Role of Motivation, Attention, and Design in the Spread of Moralized Content Online. Perspectives on Psychological Science: A Journal of the Association for Psychological Science, 15(4):978–1010.
- Brady et al. (2020b) William J. Brady, Ana P. Gantman, and Jay J. Van Bavel. 2020b. Attentional capture helps explain why moral and emotional content go viral. Journal of Experimental Psychology. General, 149(4):746–756.
- Brashier and Schacter (2020) Nadia M. Brashier and Daniel L. Schacter. 2020. Aging in an Era of Fake News. Current Directions in Psychological Science, 29(3):316–323.
- Bringula et al. (2022) Rex P Bringula, Annaliza E Catacutan-Bangit, Manuel B Garcia, John Paul S Gonzales, and Arlene Mae C Valderama. 2022. “who is gullible to political disinformation?”: predicting susceptibility of university students to fake news. Journal of Information Technology & Politics, 19(2):165–179.
- Chen et al. (2009) Wei Chen, Tie-Yan Liu, Yanyan Lan, Zhi-Ming Ma, and Hang Li. 2009. Ranking measures and loss functions in learning to rank. Advances in Neural Information Processing Systems, 22.
- Cui and Lee (2020) Limeng Cui and Dongwon Lee. 2020. Coaid: Covid-19 healthcare misinformation dataset.
- Dias et al. (2020) Nicholas Dias, Gordon Pennycook, and David G. Rand. 2020. Emphasizing publishers does not effectively reduce susceptibility to misinformation on social media. Harvard Kennedy School Misinformation Review, 1(1).
- Ecker et al. (2022) Ullrich K. H. Ecker, Stephan Lewandowsky, John Cook, Philipp Schmid, Lisa K. Fazio, Nadia Brashier, Panayiota Kendeou, Emily K. Vraga, and Michelle A. Amazeen. 2022. The psychological drivers of misinformation belief and its resistance to correction. Nature Reviews Psychology, 1(1):13–29.
- Escolà-Gascón et al. (2021) Álex Escolà-Gascón, Neil Dagnall, and Josep Gallifa. 2021. Critical thinking predicts reductions in Spanish physicians’ stress levels and promotes fake news detection. Thinking Skills and Creativity, 42:100934.
- Foster et al. (2012) Jeffrey L. Foster, Thomas Huthwaite, Julia A. Yesberg, Maryanne Garry, and Elizabeth F. Loftus. 2012. Repetition, not number of sources, increases both susceptibility to misinformation and confidence in the accuracy of eyewitnesses. Acta Psychologica, 139(2):320–326.
- Gelman (2009) Andrew Gelman. 2009. Red state, blue state, rich state, poor state: Why Americans vote the way they do-expanded edition. Princeton University Press.
- Gupta et al. (2023) Samrat Gupta, Gaurav Jain, and Amit Anand Tiwari. 2023. Polarised social media discourse during COVID-19 pandemic: Evidence from YouTube. Behaviour & Information Technology, 42(2):227–248.
- Han et al. (2020) Jiyoung Han, Meeyoung Cha, and Wonjae Lee. 2020. Anger contributes to the spread of COVID-19 misinformation. Harvard Kennedy School Misinformation Review, 1(3).
- Hayawi et al. (2022) Kadhim Hayawi, Sakib Shahriar, Mohamed Adel Serhani, Ikbal Taleb, and Sujith Samuel Mathew. 2022. Anti-vax: a novel twitter dataset for covid-19 vaccine misinformation detection. Public health, 203:23–30.
- Himelein-Wachowiak et al. (2021) McKenzie Himelein-Wachowiak, Salvatore Giorgi, Amanda Devoto, Muhammad Rahman, Lyle Ungar, H. Andrew Schwartz, David H. Epstein, Lorenzo Leggio, and Brenda Curtis. 2021. Bots and Misinformation Spread on Social Media: Implications for COVID-19. Journal of Medical Internet Research, 23(5):e26933.
- Hoffer and Ailon (2015) Elad Hoffer and Nir Ailon. 2015. Deep metric learning using triplet network. In Similarity-Based Pattern Recognition: Third International Workshop, SIMBAD 2015, Copenhagen, Denmark, October 12-14, 2015. Proceedings 3, pages 84–92. Springer.
- Imhoff et al. (2022) Roland Imhoff, Felix Zimmer, Olivier Klein, João HC António, Maria Babinska, Adrian Bangerter, Michal Bilewicz, Nebojša Blanuša, Kosta Bovan, Rumena Bužarovska, et al. 2022. Conspiracy mentality and political orientation across 26 countries. Nature human behaviour, 6(3):392–403.
- Islam et al. (2020) A. K. M. Najmul Islam, Samuli Laato, Shamim Talukder, and Erkki Sutinen. 2020. Misinformation sharing and social media fatigue during COVID-19: An affordance and cognitive load perspective. Technological Forecasting and Social Change, 159:120201.
- Li et al. (2022) Ming-Hui Li, Zhiqin Chen, and Li-Lin Rao. 2022. Emotion, analytic thinking and susceptibility to misinformation during the COVID-19 outbreak. Computers in Human Behavior, 133:107295.
- Liu et al. (2019) Yinhan Liu, Myle Ott, Naman Goyal, Jingfei Du, Mandar Joshi, Danqi Chen, Omer Levy, Mike Lewis, Luke Zettlemoyer, and Veselin Stoyanov. 2019. Roberta: A robustly optimized bert pretraining approach. arXiv preprint arXiv:1907.11692.
- Loomba et al. (2021) Sahil Loomba, Alexandre de Figueiredo, Simon J. Piatek, Kristen de Graaf, and Heidi J. Larson. 2021. Measuring the impact of COVID-19 vaccine misinformation on vaccination intent in the UK and USA. Nature Human Behaviour, 5(3):337–348.
- Ma et al. (2023) Mingyu Derek Ma, Alexander K. Taylor, Nuan Wen, Yanchen Liu, Po-Nien Kung, Wenna Qin, Shicheng Wen, Azure Zhou, Diyi Yang, Xuezhe Ma, Nanyun Peng, and Wei Wang. 2023. MIDDAG: Where Does Our News Go? Investigating Information Diffusion via Community-Level Information Pathways.
- McCright et al. (2013) Aaron M McCright, Katherine Dentzman, Meghan Charters, and Thomas Dietz. 2013. The influence of political ideology on trust in science. Environmental Research Letters, 8(4):044029.
- Nan et al. (2021) Xiaoli Nan, Yuan Wang, and Kathryn Thier. 2021. Health Misinformation. In The Routledge Handbook of Health Communication, 3 edition. Routledge.
- Nan et al. (2022a) Xiaoli Nan, Yuan Wang, and Kathryn Thier. 2022a. Why do people believe health misinformation and who is at risk? A systematic review of individual differences in susceptibility to health misinformation. Social Science & Medicine, 314:115398.
- Nan et al. (2022b) Xiaoli Nan, Yuan Wang, and Kathryn Thier. 2022b. Why do people believe health misinformation and who is at risk? A systematic review of individual differences in susceptibility to health misinformation. Social Science & Medicine, 314:115398.
- Nan et al. (2022c) Xiaoli Nan, Yuan Wang, and Kathryn Thier. 2022c. Why people believe health misinformation and who are at risk? a systematic review of individual differences in susceptibility to health misinformation. Social Science & Medicine, page 115398.
- Pennycook and Rand (2020) Gordon Pennycook and David G. Rand. 2020. Who falls for fake news? The roles of bullshit receptivity, overclaiming, familiarity, and analytic thinking. Journal of Personality, 88(2):185–200.
- Pennycook and Rand (2021) Gordon Pennycook and David G Rand. 2021. The psychology of fake news. Trends in cognitive sciences, 25(5):388–402.
- Reimers and Gurevych (2019) Nils Reimers and Iryna Gurevych. 2019. Sentence-BERT: Sentence embeddings using Siamese BERT-networks. In Proceedings of the 2019 Conference on Empirical Methods in Natural Language Processing and the 9th International Joint Conference on Natural Language Processing (EMNLP-IJCNLP), pages 3982–3992, Hong Kong, China. Association for Computational Linguistics.
- Roozenbeek et al. (2022a) Jon Roozenbeek, Rakoen Maertens, Stefan M. Herzog, Michael Geers, Ralf Kurvers, Mubashir Sultan, and Sander van der Linden. 2022a. Susceptibility to misinformation is consistent across question framings and response modes and better explained by myside bias and partisanship than analytical thinking. Judgment and Decision Making, 17(3):547–573.
- Roozenbeek et al. (2020a) Jon Roozenbeek, Claudia R. Schneider, Sarah Dryhurst, John Kerr, Alexandra L. J. Freeman, Gabriel Recchia, Anne Marthe van der Bles, and Sander van der Linden. 2020a. Susceptibility to misinformation about COVID-19 around the world. Royal Society Open Science, 7(10):201199.
- Roozenbeek et al. (2022b) Jon Roozenbeek, Sander van der Linden, Beth Goldberg, Steve Rathje, and Stephan Lewandowsky. 2022b. Psychological inoculation improves resilience against misinformation on social media. Science Advances, 8(34):eabo6254.
- Roozenbeek et al. (2020b) Jon Roozenbeek, Sander van der Linden, and Thomas Nygren. 2020b. Prebunking interventions based on “inoculation” theory can reduce susceptibility to misinformation across cultures. Harvard Kennedy School Misinformation Review, 1(2).
- Rosenzweig et al. (2021) Leah R. Rosenzweig, Bence Bago, Adam J. Berinsky, and David G. Rand. 2021. Happiness and surprise are associated with worse truth discernment of COVID-19 headlines among social media users in Nigeria. Harvard Kennedy School Misinformation Review.
- Salovich et al. (2021) Nikita A. Salovich, Amalia M. Donovan, Scott R. Hinze, and David N. Rapp. 2021. Can confidence help account for and redress the effects of reading inaccurate information? Memory & Cognition, 49(2):293–310.
- Scherer et al. (2021a) Laura D. Scherer, Jon McPhetres, this link will open in a new tab Link to external site, Gordon Pennycook, Allison Kempe, Larry A. Allen, this link will open in a new tab Link to external site, Christopher E. Knoepke, this link will open in a new tab Link to external site, Channing E. Tate, this link will open in a new tab Link to external site, and Daniel D. Matlock. 2021a. Who is susceptible to online health misinformation? A test of four psychosocial hypotheses. Health Psychology, 40(4):274–284.
- Scherer et al. (2021b) Laura D Scherer, Jon McPhetres, Gordon Pennycook, Allison Kempe, Larry A Allen, Christopher E Knoepke, Channing E Tate, and Daniel D Matlock. 2021b. Who is susceptible to online health misinformation? a test of four psychosocial hypotheses. Health Psychology, 40(4):274.
- Scherer and Pennycook (2020) Laura D. Scherer and Gordon Pennycook. 2020. Who Is Susceptible to Online Health Misinformation? American Journal of Public Health, 110(Suppl 3):S276–S277.
- Sharma et al. (2023) Prerika R. Sharma, Kimberley A. Wade, and Laura Jobson. 2023. A systematic review of the relationship between emotion and susceptibility to misinformation. Memory (Hove, England), 31(1):1–21.
- Taylor et al. (2023) Alexander K. Taylor, Nuan Wen, Po-Nien Kung, Jiaao Chen, Violet Peng, and Wei Wang. 2023. Where Does Your News Come From? Predicting Information Pathways in Social Media. In Proceedings of the 46th International ACM SIGIR Conference on Research and Development in Information Retrieval, SIGIR ’23, pages 2511–2515, New York, NY, USA. Association for Computing Machinery.
- Traberg and van der Linden (2022) Cecilie Steenbuch Traberg and Sander van der Linden. 2022. Birds of a feather are persuaded together: Perceived source credibility mediates the effect of political bias on misinformation susceptibility. Personality and Individual Differences, 185:111269.
- Van Der Linden (2022) Sander Van Der Linden. 2022. Misinformation: susceptibility, spread, and interventions to immunize the public. Nature Medicine, 28(3):460–467.
- van der Linden (2022) Sander van der Linden. 2022. Misinformation: Susceptibility, spread, and interventions to immunize the public. Nature Medicine, 28(3):460–467.
- Weeks (2015) Brian E. Weeks. 2015. Emotions, Partisanship, and Misperceptions: How Anger and Anxiety Moderate the Effect of Partisan Bias on Susceptibility to Political Misinformation: Emotions and Misperceptions. Journal of Communication, 65(4):699–719.
- Yang et al. (2021) Kai-Cheng Yang, Francesco Pierri, Pik-Mai Hui, David Axelrod, Christopher Torres-Lugo, John Bryden, and Filippo Menczer. 2021. The COVID-19 Infodemic: Twitter versus Facebook. Big Data & Society, 8(1):20539517211013861.
- Zhang and Counts (2015) Amy X. Zhang and Scott Counts. 2015. Modeling ideology and predicting policy change with social media: Case of same-sex marriage. In Proceedings of the 33rd Annual ACM Conference on Human Factors in Computing Systems, CHI ’15, page 2603–2612, New York, NY, USA. Association for Computing Machinery.
Appendix A Training Details
We train our model with a learning rate of 3e-5, control hyperparameter as 0.9 and margin as 1 for 100 epochs on the training subset, as described in §4. We choose the model with the lowest validation loss and evaluate it on the test set.
Appendix B Human Judgement Interface
Here, we provide detailed information regarding the human judgment framework in our work.
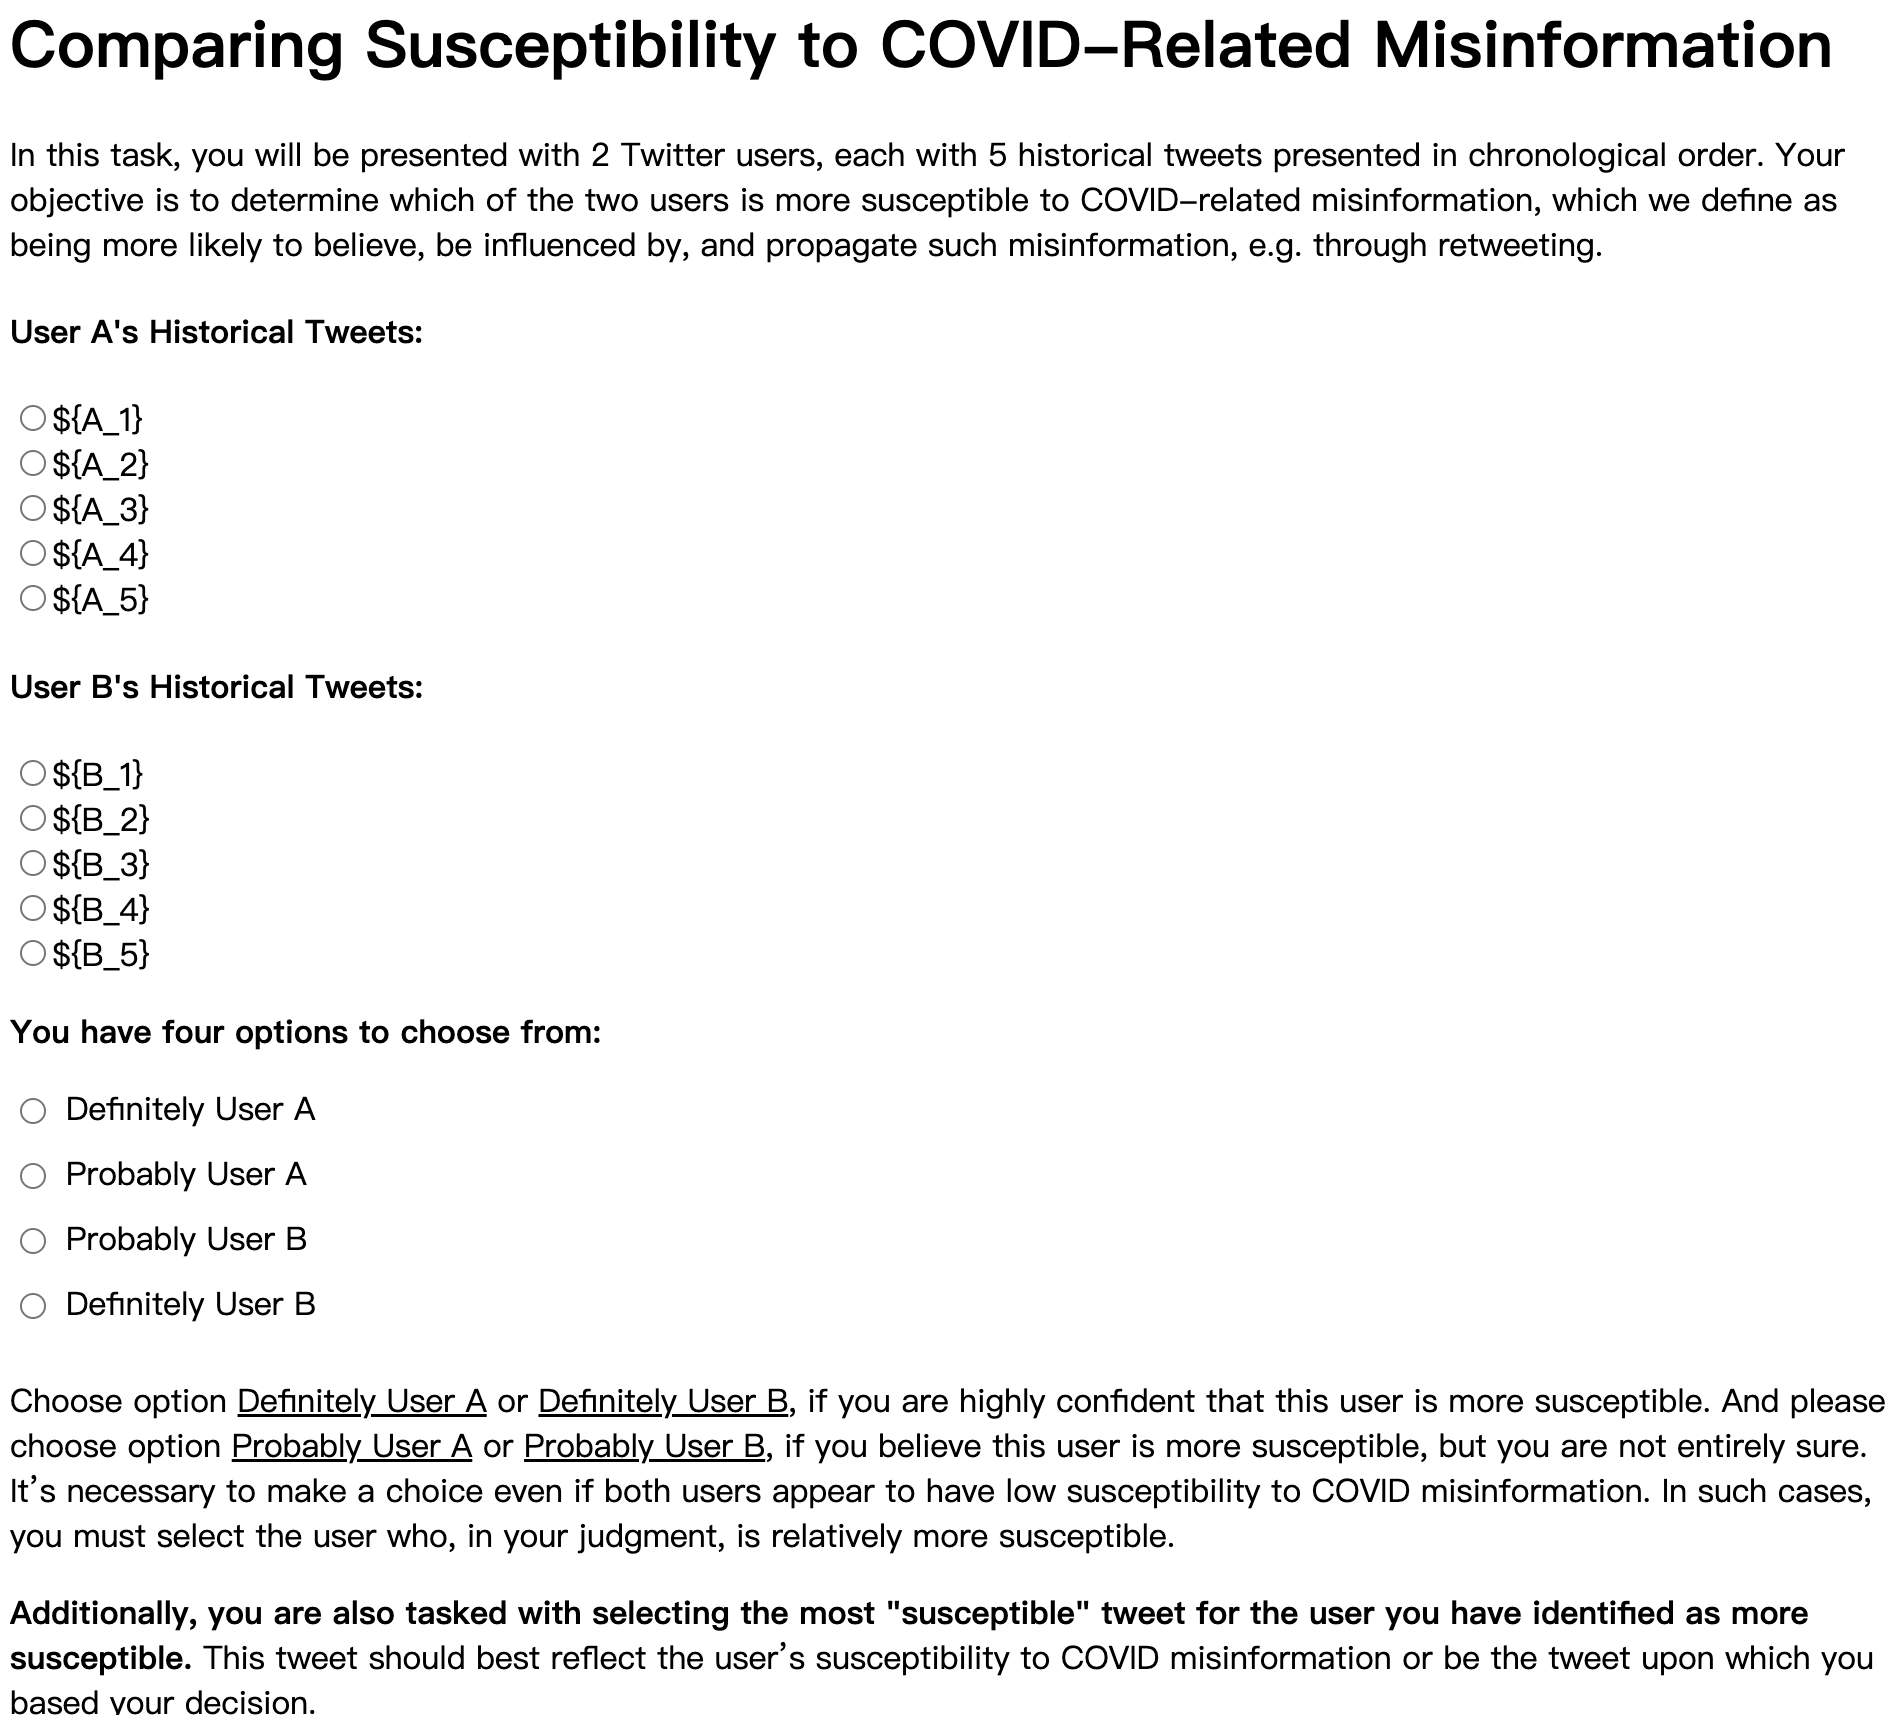
During human judgment, annotators are tasked with selecting the more susceptible user based on five historical tweets for each user. We offer the user interface used for human judgment in Figure 4. We describe susceptibility as being more likely to believe, be influenced by, and propagate COVID-19 misinformation. To account for annotator uncertainty, we provide four options: Definitely User A, Probably User A, Definitely User B, and Probably User B. To enhance the reliability of annotations, we also request annotators to identify the “most susceptible tweet” for the user they selected. This tweet should best exemplify the user’s susceptibility to COVID-19 misinformation or be the basis for the annotator’s decision.
It’s important to note that even if both users appear to have low susceptibility to COVID-19 misinformation, we still ask the annotator to make a choice. This is because our objective is to rank users based on their relative susceptibility, providing a comparative assessment rather than an absolute determination.
In total, we randomly selected 110 user pairs and collected three annotations for each user pair. To determine the gold label for each user pair, we applied a weighted majority voting approach, where Probably User X is assigned a value of 0.5 and Definitely User X is assigned a value of 1. We exclude user pairs with tied annotations, resulting in a final dataset of 107 user pairs. The kappa score for interrater agreement among the annotators is 0.74
Appendix C ChatGPT Prompt Template
Appendix D Average Susceptibility Scores and User Counts by U.S. State
In Tab.5, we provide the average susceptibility scores computed in §7.2 for each U.S. state, along with the respective number of sampled users.
| State | Suscep. | # Users | State | Suscep. | # Users |
| Georgia | 0.3935 | 669 | Idaho | -3.2296 | 265 |
| Florida | -0.2404 | 1592 | Washington | -3.2577 | 526 |
| Arizona | -0.5566 | 499 | Montana | -3.2590 | 543 |
| Louisiana | -1.3878 | 202 | Oregon | -3.2612 | 260 |
| Ohio | -1.6120 | 679 | Utah | -3.3324 | 206 |
| Texas | -1.7478 | 1627 | Vermont | -3.3548 | 556 |
| Missouri | -1.9076 | 308 | Indiana | -3.3901 | 270 |
| Nevada | -1.9857 | 294 | Delaware | -3.4139 | 359 |
| Michigan | -2.0996 | 575 | Arkansas | -3.4179 | 418 |
| Alabama | -2.3902 | 377 | North Carolina | -3.5324 | 635 |
| Maryland | -2.4763 | 527 | South Dakota | -3.6020 | 351 |
| South Carolina | -2.5456 | 298 | Virginia | -3.7276 | 528 |
| Mississippi | -2.5886 | 257 | Oklahoma | -3.7577 | 291 |
| Maine | -2.6193 | 208 | New Hampshire | -4.1011 | 399 |
| Illinois | -2.6294 | 816 | Iowa | -4.1603 | 249 |
| Nebraska | -2.6339 | 324 | New York | -4.4226 | 2835 |
| Kansas | -2.6541 | 328 | West Virginia | -4.8056 | 285 |
| Kentucky | -2.7774 | 469 | Minnesota | -4.8423 | 372 |
| Colorado | -2.8109 | 363 | Pennsylvania | -4.8700 | 873 |
| Tennessee | -2.8554 | 397 | Rhode Island | -5.0661 | 488 |
| New Mexico | -2.9178 | 518 | Wisconsin | -5.2446 | 279 |
| Wyoming | -2.9401 | 319 | New Jersey | -5.2594 | 598 |
| North Dakota | -2.9789 | 331 | Connecticut | -5.6912 | 242 |
| California | -3.2206 | 2849 | Massachusetts | -6.3191 | 761 |