Disentangling the Potential Impacts of Papers into Diffusion, Conformity, and Contribution Values
Abstract.
The potential impact of an academic paper is determined by various factors, including its popularity and contribution. Existing models usually estimate original citation counts based on static graphs and fail to differentiate values from nuanced perspectives. In this study, we propose a novel graph neural network to Disentangle the Potential impacts of Papers into Diffusion, Conformity, and Contribution values (called DPPDCC). Given a target paper, DPPDCC encodes temporal and structural features within the constructed dynamic heterogeneous graph. Particularly, to capture the knowledge flow, we emphasize the importance of comparative and co-cited/citing information between papers and aggregate snapshots evolutionarily. To unravel popularity, we contrast augmented graphs to extract the essence of diffusion and predict the accumulated citation binning to model conformity. We further apply orthogonal constraints to encourage distinct modeling of each perspective and preserve the inherent value of contribution. To evaluate models’ generalization for papers published at various times, we reformulate the problem by partitioning data based on specific time points to mirror real-world conditions. Extensive experimental results on three datasets demonstrate that DPPDCC significantly outperforms baselines for previously, freshly, and immediately published papers. Further analyses confirm its robust capabilities. We will make our datasets and codes publicly available.
1. Introduction
In paper retrieval and recommendation, ranking papers based on their scientific impact can aid researchers to delve into intricate research efforts. This is particularly significant considering the exponential annual growth in the number of published papers (Lo et al., 2020; Chu and Evans, 2021; Xue et al., 2023). Given the inherent difficulties in quantifying the precise numerical value of scientific impact, citation count is regularly employed as a rough approximation (Evans and Reimer, 2009; Sinatra et al., 2016; Jiang et al., 2021). Nevertheless, the current ranking depends on the cumulative number of citations received to date, which merely represents the impact within the prior research environment. Therefore, it becomes imperative to cultivate a sophisticated model that can assess the potential impact of a research paper, placing significant emphasis on the future (Wang et al., 2013).
At a given point in time (e.g., at present), estimating the anticipated increment in citations can effectively facilitate a fair comparison of the potential impact between long-published papers and newly published ones. Actually, the citations received by papers are not solely derived from the influence of their contributions, but are also affected by a multitude of other factors (Bornmann and Daniel, 2008; Case and Higgins, 2000). Hence, rather than directly forecasting original citation counts, it is more effective to disentangle citation increments received from extrinsic factors and the actual contributing factor, making impact prediction more practical and interpretable. Afterwards, we can identify exceptional works amidst the vast array of publications by discerning the potential contributing impact. In this work, we emphasize the popularity factor of a paper as a prominent extrinsic factor affecting the increase of citations. More precisely, when referring to the popularity factor of a paper, we are considering its citation diffusion patterns and the collective conformity degree within the citation network.
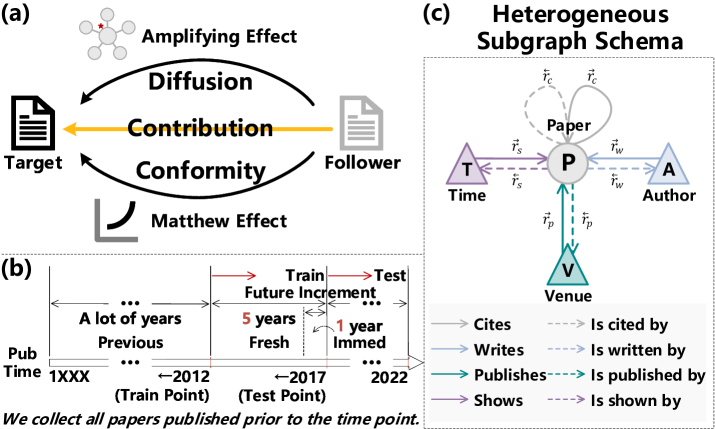
Regarding citation diffusion, we posit that influential papers assume an amplifying effect in shaping the process of information dissemination within the citation network (Page et al., 1998; Wu et al., 2019). This leads to increased visibility of papers connected to them. In other words, papers cited by highly-cited papers will receive significantly more citations than others. The statistics of the dataset provides empirical support. For instance, in the field of Computer Science, the former papers will receive an average of 1.5475 citations (after applying a logarithmic transformation), while the latter ones will only receive an average of 0.8580 citations. Towards collective conformity, existing studies have found that some researchers may tend to cite papers associated with well-known entities, irrespective of their actual relevance or genuine contribution (Thornley et al., 2015). This phenomenon is substantiated by the future disparity (2.1917 vs. 0.8009) in papers with different accumulated citations, which aligns with the concept of Matthew effect in the academic domain (Allison and Stewart, 1974).
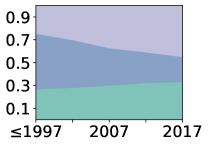
Therefore, by separating out the influence of the popularity, i.e., citation diffusion and collective conformity, we can gain a closer approximation to the genuine contributing impacts of papers. In essence, we aim to disentangle the citation increment into diffusion, conformity, and contribution values (as shown in Figure 1 (a)).
Typically, conventional research (Li et al., 2017; Cao et al., 2017; Yang et al., 2022; Chen et al., 2022; Xu et al., 2022) on citation prediction imposes stringent constraints to select favorable samples by removing lowly-cited papers. Moreover, the division of these data into training, validation, and testing is carried out randomly, disregarding the chronological order of paper publications (Ruan et al., 2020; Abrishami and Aliakbary, 2019; Huang et al., 2022; Xue et al., 2023). However, this problem setting deviates from real-world scenarios, possibly causing a substantial distribution shift. Hence, the model may face challenges in handling recently published papers. Random data partitioning disregards new citation network updates, hampering the model’s practicality and robustness in upcoming real-world test. This limitation impedes the exploration of the potential value of papers reactivated in the evolved context (Van Raan, 2004).
In contrast, our work emulates reality by performing a novel problem setting. We include all papers without strict filtering to maintain consistency with the data distribution of real-world citation network. As illustrated in Figure 1 (b), we partition the dataset based on particular observation time points. This can introduce fresh papers that are not part of the training set (previous papers) into the test set. We further consider immediate papers (published at the test time point) that closely align with cold-start scenarios to validate the robustness of our model. Thus, papers in the test set can be divided into previous, fresh, and immediate papers, facilitating a more practical evaluation. Notably, previous papers have different contexts and future increments at the train and test time points. By employing this approach, our model is incentivized to fit the dynamic citation context, thereby enhancing its generalization.
Existing graph disentanglement studies usually aim at decomposing abstractive hidden factors from either static or homogeneous graphs (see Section 2) (Ma et al., 2019a; Yang et al., 2020; Wang et al., 2020). Instead, our focus lies in disentangling the categorical characteristics of citation behaviors within dynamic and heterogeneous citation graphs. In this study, tailored to each target paper, we construct a Dynamic Heterogeneous Graph from the citation network. The graph consists of a sequence of heterogeneous snapshots (see Figure 1 (c)). This graph retains both the content of the paper and its dynamic citation context. Based on the proposed graph, we devise a model that could Disentangle the Potential impacts of Papers into Diffusion, Conformity, and Contribution Values (called DPPDCC). This model utilizes Citation-aware Relational Graph Convolutional Networks (R-GCNs) to capture the structural features of the input sequence of snapshots. The outputs are then passed through a Transformer Encoder, which allows for the incorporation of temporal information. Specially, we design a novel module in modified R-GCN to integrate the comparative and co-cited/citing information between paper nodes. Furthermore, we propose a Type-specific Attention Readout mechanism to aggregate information from each snapshot effectively. Upon acquiring the final representation of the target paper, we proceed to disentangle the predicted citation increment into diffusion, conformity, and contribution values individually. For the diffusion, we employ Triplet Citation-aware Graph Contrastive Learning to capture the popularity influence inherent in the information diffusion process within the citation network. For the conformity, we introduce an auxiliary task to classify bins of accumulated citations. Additionally, we impose an orthogonal constraint on the representations of disentangled perspectives in pair, guaranteeing that they encode distinct features without overlap. Extensive experiments are conducted on three fields of the real-world scientific dataset S2AG (Kinney et al., 2023). The results illustrate the superior performance of DPPDCC compared to baseline models across previous, fresh, and immediate papers. Ablation tests further highlight the significance of the proposed components. Additionally, visualizations offer insights into the model’s interpretability.
To sum up, the contributions of this research are as follows:
We revise the problem formulation of impact prediction to better align with real-world scenarios. Without filtering the predicted samples by their citation counts, we partition the datasets based on specific time points to maintain the dynamics of the citation context. Moreover, we employ disentangled representation learning to extract the contributing impacts of papers.
We propose a novel model called DPPDCC that first encodes comparative and co-cited/citing information evolutionarily within the Dynamic Heterogeneous Graph through Citation-aware Graph Neural Network Encoder for potential impact prediction. It further disentangles the citation increment into diffusion, conformity, and contribution values.
Experimental results show significantly superior to existing baselines for previous, fresh, and immediate papers. Further analyses illustrate that our model can reasonably make predictions.
2. Related Work
We review three lines of related work: Citation/Cascade Prediction, Dynamic and Heterogeneous Graph Neural Network (GNN), and Disentangled Representation Learning.
2.1. Citation/Cascade prediction
Citation prediction is a vital sub-task of automated academic evaluation as it enables the estimation of potential impact. It is closely examined within cascade prediction tasks, which share analogous graph structures and objectives (Zhou et al., 2021). The primary goal of cascade prediction is to anticipate the popularity of a post based on the interactions between users. Similarly, in the context of citation networks, the paper can serve as the post, while the authors can serve as the users. Citation count prediction places a focus on the content and distinctive features of individual papers, heavily relying on comprehensive feature extraction techniques. In contrast, cascade prediction delves into the intricate relationships between various entities, including papers and authors, directly exploiting the information of graph structure.
Their approaches can be broadly classified into three categories: stochastic models, feature-based models, and deep learning models. Stochastic models can predict future citation counts by fitting the curve of citation counts (Glänzel and Schubert, 1995), following Zipf-Mandelbrot’s law (Silagadze, 1997). Recently, machine learning models have shown promising results by utilizing manually extracted features from various meta-data (Yan et al., 2011; Yu et al., 2014; Ruan et al., 2020; Guille et al., 2013; Tatar et al., 2014). More presently, deep neural networks have dominated this task by applying advanced Natural Language Processing (NLP) and Computer Vision (CV) methods to extract abstractive representations from paper content (Abrishami and Aliakbary, 2019; Huang et al., 2022; Xue et al., 2023). For cascade prediction, graph embeddings, sequence models, and GNN models are employed to extract structural information from the underlying graph, and then temporal information is encoded with sequence models (Li et al., 2017; Cao et al., 2017; Yang et al., 2022; Chen et al., 2022; Xu et al., 2022).
However, existing models for citation and cascade prediction exhibit sub-optimal performance. They fail to fully exploit the valuable information presented in paper content and scientific context within the citation network simultaneously. Furthermore, their strict data selection and random data splitting strategies may hinder their practicality. Many valuable samples will be filtered and the temporal information within dynamic context will be neglected. Thus, models in this setting are more prone to face distribution shift issues. In contrast, our study proposes to specifically revise these settings and utilize both content and dynamic context for impact estimation. We also emphasize retaining genuine contributions to bolster the robustness of our models.
2.2. Dynamic/Heterogeneous Graph Neural Networks
GNNs (Sperduti and Starita, 1997; Gori et al., 2005; Scarselli et al., 2008; Wu et al., 2020) are widely applied to handle non-Euclidean data like graphs. Recently, research interest has surged in dynamic graphs, which incorporate temporal information, as well as in heterogeneous graphs, which involve multiple node types or edge types. These types of graphs are more prevalent in practical scenarios and encapsulate more intricate information, compared to static homogeneous graphs, driving the formulation and refinement of diverse methodologies within the academic realm.
The dynamic graph can be divided into multiple snapshots at different time points. Previous models like DGCN (Manessi et al., 2020), Dysat (Sankar et al., 2020), and ROLAND (You et al., 2022) typically encode the snapshots with static GCN as the structural encoder, followed by sequential models like Recurrent Neural Networks (RNN) or Transformer Encoder. Moreover, certain models incorporate GCN into RNN models by configuring the parameters within RNN cells as GCN parameters (Pareja et al., 2020). Within heterogeneous graphs, on one side, R-GCN serves as a prominent model with its separate message-passing architecture (Schlichtkrull et al., 2018). It conducts independent message passing within different relations and aggregates them to update node representations. On the other side, the relation-learning method transforms heterogeneous graphs into homogeneous ones, while retaining node and edge type indicators to preserve heterogeneous information (Hu et al., 2020; You et al., 2022). An example of this technique is HGT (Hu et al., 2020), which utilizes multi-head attention modules with specific parameters tailored to different node and edge types, effectively modeling the complexity of heterogeneous graphs.
Citation network can be regarded as dynamic and heterogeneous graphs, as it evolves over time and encompasses diverse entities such as papers, authors, and venues. Addressing the complexities within this network involves two primary challenges: (1) How to encode the temporal target-centric information within a single snapshot? (2) How to model distinct characteristics of information diffusion in citation networks? To overcome these challenges, our study proposes a Citation-aware GNN Encoder that effectively models both dynamic and heterogeneous graphs of target papers. These graphs are constructed from the citation network on an annual basis and incorporate multiple metadata nodes beyond papers themselves. (1) To encode the temporal target-centric information within a single snapshot, we employ a type-aware attention readout. It aggregates snapshot information considering paper type and publication time. (2) To model distinct characteristics of information diffusion in citation networks, we propose a novel GCN module CompGAT. This module focuses on capturing comparisons and co-cited/citing information between papers, drawing inspiration from bibliometrics theories (Wu et al., 2019).
2.3. Disentangled Representation Learning
Disentangled representation learning, aiming to discern and separate fundamental explanatory factors (Bengio et al., 2013), stands as a pivotal method within deep learning. It strives to produce resilient, manageable, and interpretable representations. Existing research predominantly focuses on the field of CV, often employing methods like Variational Autoencoders (VAEs) and Generative Adversarial Networks (GANs) to disentangle relevant latent factors (Ma et al., 2019b; Locatello et al., 2019; Cai et al., 2019; Denton et al., 2017; Lee et al., 2021). Researchers explore techniques to align distinct representations with specific factors through explicit and implicit guidance, employing approaches like direct labeling, loss penalties, and regularization. For instance, DR-GAN (Tran et al., 2017) utilizes an adversarial network to generate diverse facial poses, aiming to disentangle pose information from facial attributes. In NLP, disentangled representation learning finds applications in various tasks like generation. For example, John et al. (John et al., 2018) leverage VAE to disentangle text semantics from its writing style, enabling independent manipulation of text semantics and style. This separation allows precise control over content and style in text generation.
Recently, there has been a growing interest in applying disentangled representation learning to graph learning tasks. Given that graph data encompasses both structural and attributed information, numerous new methodologies have emerged to address this complexity. In the feature space, inspired by capsule networks, approaches have emerged to partition node features into multiple hidden channels (Ma et al., 2019a). Some methods introduce additional constraints to enable effective separation (Liu et al., 2020). Moving into the structural space, subsequent models strive to factorize the input graphs into multiple subgraphs, to facilitate distinct message-passing strategies (Yang et al., 2020; Li et al., 2021). Recent models have expanded their scope to isolate causal and biased information presented in both the graph structure and node features, with a particular emphasis on causal effects (Sui et al., 2022; Fan et al., 2022). These models commonly employ techniques to generate masks within the adjacency matrix and node features. This process aims to identify the crucial elements of the graph within the structural and attributed spaces. In addition, certain studies extend disentangled GNNs to specialized scenarios such as recommendation systems, handling intricate graph structures in heterogeneous or dynamic graphs (Wang et al., 2020; Zhang et al., 2022; Wen et al., 2022). Besides the masking strategy considering solely the graph structures and node features, they integrate classical methods like VAE and adversarial attack learning from CV and NLP to handle task-specific information from a broader perspective.
In contrast to previous studies, our approach acknowledges that the potential impact within the citation network is influenced not only by the paper’s contribution but also by factors related to its popularity. These popularity factors encompass the amplifying effect owing to the highly-cited paper nodes in information diffusion and the manifestation of the Matthew effect through collective conformity. Based on the dynamic heterogeneous graph, we disentangle the potential impact into diffusion, conformity, and contribution values, seeking a more comprehensive estimation. Specifically, we devise dedicated auxiliary tasks aimed at extracting values associated with these respective factors.
3. Methodology
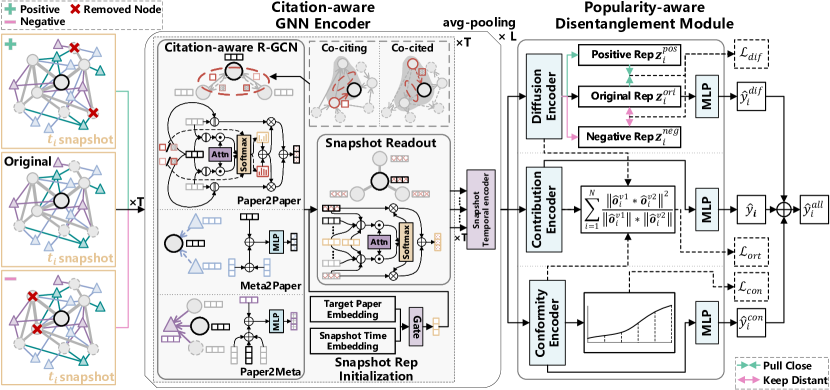
In this section, we present a detailed exposition of our proposed model, DPPDCC. Initially, we formulate the constructed dynamic heterogeneous and the potential impact prediction task. Following this, we provide an in-depth elucidation of DPPDCC’s core components: the Citation-aware GNN Encoder (CGE) and the Popularity-aware Disentanglement Module (PDM), as depicted in Figure 2. The CGE integrates multiple layers of structural and temporal encoders, aimed at capturing intricate high-order temporal and structural information within the network. Concurrently, the PDM comprises three distinct modules, each targeting a distinct perspective of citation increment, all trained in parallel. Lastly, we delineate the training and optimization strategies employed for DPPDCC.
3.1. Problem Formulation and Notations
Before presenting our approach, we first introduce the problem formulation and notations. In practice, the citation network comprises diverse entities and relations that evolve dynamically each year. To capture the entity-aware and time-variant characteristics, of each target paper, we construct a dynamic heterogeneous graph from the citation network to predict its potential impact.
3.1.1. Dynamic Heterogeneous Graph
Given a target paper at the time step , its heterogeneous subgraph is defined as . Here, denotes the set of nodes surrounding the target paper at the time step . And represents the set of edges among . Each node and edge are associated with their type mapping functions and , where and denote the types of nodes and edges (see Figure 1 (c)), respectively.
The backbone of the heterogeneous subgraph primarily consists of the cited and citing relations. We collect -hop cited/citing neighbors of the target paper at the specific time . For each -th hop, to maintain the most recent and significant information, we select the newest published and then most highly cited papers, for references and citations respectively. To address the potential lack of global information, we incorporate metadata nodes associated with the papers (authors, venue, and publication time). Prior to the observation time point, we consider a total of such subgraphs, each serving as a snapshot captured at distinct time steps. These subgraphs organized into a sequence collectively constitute the dynamic heterogeneous graph of the target paper.
3.1.2. Potential Impact Prediction
We assess the potential impact of the given target paper by estimating its citation increment. It is quantified as the increased citation number years after the observation time point. Given a paper, we try to learn a function to predict the number of citation increments.
3.2. Initialization
The initial embedding of the paper node is derived from the text embedding obtained by encoding the combination of title and abstract. Metadata node embeddings in each snapshot are the average embeddings over all papers associated with them in the global citation network at the corresponding time step. Specifically, the extraction of text embeddings is accomplished using Sentence-BERT (Reimers and Gurevych, 2019). For -th node at the -th time step, we have:
| (1) |
where denotes the node type, denotes the text representation model, and is the count of metadata node’s connected papers.
To initialize the -th layer representation of the snapshot of the -th target paper at the -th time step , we mainly consider the contextual information from the corresponding time embedding at time step . Since the time embedding only preserves the global features, we utilize a gate module to approach specific information based on the -th target paper embedding . The snapshot representation of -th layer will then be the proxy to aggregate the particular heterogeneous subgraph:
| (2) |
3.3. Citation-aware GNN Encoder
Citation-aware GNN Encoder (CGE) aims to capture distinct structural and temporal features from the dynamic heterogeneous graph, which is facilitated by leveraging knowledge diffusion theories derived from bibliometrics. To be specific, the backbone of CGE consists of modified R-GCNs as the structural encoder and a Transformer Encoder as the temporal encoder. We stack integrated layers to encode them alternately instead of separate modeling. This allows us to exploit higher-order interactions between space and time. To elaborate, we first employ distinct Citation-aware R-GCNs to model structural information for subgraphs at different time points individually. Afterwards, a Type-specific Attention Snapshot Readout is employed to summarize the information from these subgraphs established on the snapshot representations. Simultaneously, the snapshot information mixer integrates global and temporal information from snapshot representations into the local and structural representations of paper nodes, fostering interactions among various feature spaces. The aggregated snapshot representations are then input into the temporal encoder (Encoder of the Transformer) to capture the intricate temporal relationships between different time points. By integrating structural and temporal encoding, our approach could extract valuable insights from the dynamic heterogeneous graph.
3.3.1. Citation-aware R-GCNs
Citation-aware R-GCNs, as the core component of the structural encoder, are utilized to encode node hidden states within the dynamic heterogeneous graph. Following the manner of R-GCN (Schlichtkrull et al., 2018), we deliver message passing in each relation separately for modeling attentively. Moreover, we replace the original GCNs in R-GCN with more powerful GNN modules to sensitively encode intricate information.
| (3) |
where is the set of all edges in the graph, is the subgraph with relation , and is the relation aggregation function. Here, we adopt sum-pooling as the relation aggregation function for efficiency and performance.
For ”cites” and ”is cited by” edge subgraphs of paper nodes, inspired by Disruption-index (Wu et al., 2019), we introduce co-cited/citing strengths to integrate multi-hop citation information. The Disruption-index categorizes papers as disruptive or developmental based on the metric related to their betweenness centrality. Disruptive papers play a critical role in altering typical citation diffusion. We adapt this subgraph-focused metric to estimate node-pair closeness by considering co-cited/citing strengths. We aim to discern the varying significance of citation behaviors during message passing and distinguish crucial references and citations within ”is cited by” and ”cites” edges for the target paper. On one side, within ”is cited by” edges, when the source (reference) and target (citation) papers share more similar references, the influence of the source paper on the target paper might diminish. From the viewpoint of the target paper, the source paper could be considered as merely developmental, exerting a potentially negative impact on message passing. Moreover, since the information from this source paper is already conveyed through other original disruptive references, the negative co-citing effect might amplify attention toward these disruptive source papers. On the other side, within “cites” edges, if the source (citation) and target (reference) paper have more identical citations, they may share more commonness and are more closely connected, leading to a positive effect. Unlike co-citing relationships, citations are expansive and continuously growing, making it challenging to differentiate disruptive papers based on co-cited relationships alone. Therefore, we employ a normalized score of co-cited strength that considers both similarity and accumulated count to identify highly-related developmental citations. It’s crucial to note that the co-cited/citing strengths are dynamic scores that evolve over time. As new papers emerge, the values of normalized co-cited/citing strengths undergo changes not only due to the direct influence of new citations but also because of alterations in numerical values and maximum values. Leveraging these co-cited/citing strengths can help uncover the dynamics inherent in multi-hop information diffusion. Overall, we introduce CompGAT, a novel module based on GATv2 (Brody et al., 2021), to encode comparative and co-cited/citing features between paper nodes. To capture the discrepancy between source and target nodes, we encode the concatenation of their representations. Besides the basic attention scores of GATv2, we incorporate co-cited or co-citing strengths by assessing the normalized similarity of their references or citations in the global citation network. Based on the adjacent matrix , it is calculated as , which represents 2-hop relationships connected with intermediate paper nodes. Finally, the attention is a mixed distribution resembling CopyNet (Gu et al., 2016). For -th paper node in -th layer , we have:
| (4) |
where is the normalized co-cited/citing strength, is to balance the sum distribution of co-cited/citing strengths and basic attention weights, and is the attention vector.
For other edges in the R-GCN, we apply GIN (Xu et al., 2018) with sum-pooling as the GNN encoder:
| (5) |
where is the hyper-parameter to decide the retained original information, is the set including all edges in classic GIN, and is the neighborhood aggregation function of the GIN. In our model, we opt for sum-pooling as the aggregation method, as it can preserve crucial structural information including node degrees.
3.3.2. Type-specific Attention Snapshot Readout
To represent the time-aware information and filter noisy information of a single snapshot , we design an attention-based readout mechanism. It extracts the evolved temporal information of different types of paper nodes (reference, citation, and target paper) based on the publication age of the target paper.
| (6) |
where denotes the paper nodes within -th 1-hop subgraph, and are snapshot and paper type embeddings. The snapshot type is determined by binning the time interval between the time step and the publication time of the target paper. In this study, we categorize snapshot types based on temporal segments across all datasets: years, years, and years. To enhance relevance across diverse fields of study, a potential refinement could involve tailoring these segments to align with the half-life of literature aging within specific domains.
3.3.3. Snapshot Information Mixer
To foster interactions between temporal and spatial dimensions, as well as between global and local information, we amalgamate the representations of paper nodes with the updated snapshot representation:
| (7) |
where integrates and condenses the information from both the current paper node and the snapshot. leveraging the temporal information embedded in the snapshot representations through the mixer, we introduce extra temporal signals, enriching the structural encoder beyond sole reliance on graph structures.
3.3.4. Snapshot Temporal Encoder
To encode the temporal information across various snapshot times, we utilize a 4-layer Transformer Encoder. Compared with classic sequential models like RNN, the self-attention mechanism captures more intricate relationships that extend beyond strict ordinal dependencies:
| (8) |
3.3.5. Final Output
We obtain the target paper representation by avg-pooling across the layers and then sum-pooling across the time steps, to maintain high-order temporal information:
| (9) |
3.4. Popularity-aware Disentanglement Module
Based on the encoded representation of the target paper from CGE, we design the Popularity-aware Disentanglement Module (PDM) to disentangle the citation count potentially received from different perspectives, including citation diffusion, collective conformity, and actual contribution. Overall, we sum up the individual predicted values to obtain the total citation increment and apply different auxiliary tasks to help the disentanglement. This approach enables the model to learn distinctive compositions for diverse papers, thereby facilitating the identification and utilization of their authentic contributions. We employ distinct Multilayer Perceptrons (MLPs) as encoders to process information within the target perspectives, and then feed them into another MLP separately to predict the corresponding citation increment :
| (10) |
where encodes specific aspects of the information and predicts the citation increment from the target perspective. It is noteworthy that the three dedicated components are separately modeled to disentangle distinct perspectives, and they are trained simultaneously to facilitate comprehensive and concurrent learning.
3.4.1. Diffusion Encoder
The diffusion encoder extracts the popularity influence according to information diffusion, which is represented as diversity affected by spreading nodes’ degrees. We propose a Citation-aware Triplet Graph Contrastive Learning method to extract the trunk of spreading in the dynamic graph. In various snapshots, except for the target paper node, all other paper nodes are selectively omitted with probability, which is weighted by their normalized global citations within the local subgraph. Lowly-cited paper nodes are more likely to be dropped for the positive view , as they contribute less to spreading. Conversely, for the negative view , highly-cited paper nodes are more likely to be dropped, as they significantly impact the graph semantics. For every sample, we contrast them solely with their augmented views to preserve their unique characteristics from the diffusion perspective. We augment the subgraphs in every training epoch to enhance the robustness of learning. Through this approach, we amplify diffusion influence in the graph structure. Contrasted with original sample , the diffusion loss is:
| (11) |
where is the similarity function like dot product and is the temperature parameter.
3.4.2. Conformity Encoder
The conformity encoder extracts the popularity attributed to the reputation of associated entities. Commonly, researchers tend to cite papers with significant accumulated citations instead of other potentially more relevant papers. In our work, we leverage the accumulated citations of the target paper at the predicted time as a signal of conformity. To extract its influence, we divide the predicted samples into equal frequency bins to quantify the Matthew effect. By predicting the binning label , we prompt the model to learn the group differences resulting from the accumulated citations. Here, the conformity loss is:
| (12) |
where is the number of bins for equal frequency binning.
3.4.3. Contribution Encoder
After disentangling the popularity influences, the remaining citation increment can serve as the genuine contribution. To further encourage distinct encoding of various aspects for better approximation of contribution, we apply an orthogonal regularization for each pair of perspectives:
| (13) |
where is L2-norm, and are each pair of three perspectives.
3.4.4. Disentanglement Loss
We can obtain the final disentanglement loss by gathering the losses of all perspectives:
| (14) |
3.5. Training
Our task is to forecast the future increase in citations for the -th paper. Considering that the distribution of citation count is skew distribution, we apply logarithmization to normalize the distribution. Thus, the main loss function of the potential impact prediction task is the mean squared error (MSE) between the logarithmized target and predicted citation increments: and .
| (15) |
The final loss function includes the main regression loss (MSE) and the disentangled learning loss:
| (16) |
where controls the strength of disentanglement tasks.
4. Experimental Settings
In this section, we conduct extensive experiments and analyses on three subsets extracted from the real-world scientific dataset S2AG to validate DPPDCC 111We will make our datasets and codes publicly available on Github.. Particularly, we plan to answer the following research questions (RQs):
RQ1: Can DPPDCC improve the potential impact prediction task?
RQ2: What is the role of each component in DPPDCC?
RQ3: How sensitive is DPPDCC to hyper-parameters?
RQ4: How does DPPDCC conduct the prediction?
4.1. Datasets
Our dataset is constructed using S2AG (Kinney et al., 2023), a comprehensive repository housing roughly 100 million scientific publications, offering extensive metadata and unique identifiers. To enhance experimental efficiency and accommodate the diverse characteristics across domains, we organize these publications into subsets based on their respective fields of study. To establish the global citation network, we locate English papers with complete metadata (title, abstract, author IDs, and venue ID), or those of high impact despite lacking venue information. From the dataset, we select three fields: computer science (CS), chemistry (CHM), and psychology (PSY). Relevant statistics are summarized in Table 1.
| dataset | CS | CHM | PSY | |
| ground-truth sample (paper) | 2,513,197 | 1,818,138 | 1,857,277 | |
| node | paper | 1,628,853 | 1,376,599 | 1,297,771 |
| author | 1,598,925 | 1,946,073 | 1,585,595 | |
| venue | 12,524 | 8,389 | 13,775 | |
| time | 147 | 187 | 202 | |
| edge | cite | 11,534,431 | 10,382,698 | 13,401,112 |
| write | 5,123,460 | 6,355,630 | 4,813,135 | |
| publish | 1,566,442 | 1,318,158 | 1,230,440 | |
| have | 1,628,853 | 1,376,599 | 1,297,771 | |
| sample | train (2012) | 183,105 | 227,304 | 219,499 |
| val (2014) | 224,086 | 256,403 | 250,229 | |
| test (2017) | 300,000 | 300,000 | 300,000 | |
| qualified pool | 1,112,611 | 1,093,660 | 1,015,579 | |
To select samples for testing, we target papers published before the test observation point (see Figure 1 (b)). These papers should be written in English, have complete metadata, and include at least one reference, without imposing constraints on the number of citations received, to maintain the integrity of the data distribution. From the eligible pool, we randomly sampled 300,000 papers to compose the test set. Additionally, we gather all the associated metadata for these papers, encompassing titles, abstracts, authors, venues, and publication times. To imitate the practical scenario, the training observation point is set 5 years before the test observation point (equal to the observation time window and predicted interval ) for non-overlapping. The validation observation point precedes the test observation point by 3 years. It is crucial to underscore that though predicted samples in the training set reappear in the test set, their input graphs and predicted values undergo significant variations due to dynamic contextual changes. This intrinsic challenge renders the task both complex and critical. Moreover, we meticulously categorize the papers in the results for thorough and detailed analysis.
4.2. Baseline Models
The baseline models are mainly divided into citation/cascade prediction models, dynamic GNN models, and disentangled GNN models:
Citation/Cascade prediction models: We apply classic and recent citation/cascade prediction models to estimate the potential impacts of papers based on content, citation graphs, or citation cascade graphs.
-
-
SciBERT (Beltagy et al., 2019) is a BERT-based model pretrained on scientific corpus. We fine-tune it to encode paper titles and abstracts, predicting with the [CLS] token for citation prediction.
-
-
HINTS (Jiang et al., 2021) tackles the cold-start problem by employing R-GCN on pseudo meta-data heterogeneous graphs. It then feeds the node (paper) representations into GRU for sequential modeling and employs a stochastic model for predictions. To integrate content information from PLMs, we replace node ID embeddings and adjust the model to encode subgraphs instead of the entire graph, mitigating memory issues.
-
-
MUCas (Chen et al., 2022) first uses time-aware sampling to extract dynamic graph snapshots and generate node embeddings from the graph structure. Then, it utilizes MUG-caps, a hierarchical capsule network, to encode snapshots in different levels (order, node, and graph) and aggregate the final representations with the attention mechanism.
Dynamic GNN models: We employ recent dynamic GNN models to extract paper representations from the dynamic graphs collected the same as our model, taking the potential impact prediction as a graph regression task. Similar to HINTS, we adapt these models to concentrate on target-centric subgraphs rather than the entire graph.
-
-
EvolveGCN (Pareja et al., 2020) integrates RNN structure within GNN modules. It regards graph structures as hidden states within the GRU. It adopts GRU parameters as GCN parameters.
-
-
Dysat (Sankar et al., 2020) incorporates multiple self-attention modules to encode structural and temporal information. It first applies a shared GAT to encode subgraphs separately across different years. Subsequently, a vanilla transformer encoder models the temporal information of the graph representation sequence.
-
-
ROLAND (You et al., 2022) is a novel dynamic heterogeneous GCN model that inherits static GCN methods. It retains the hierarchical information of GCNs’ different layers and then applies a GRU-like updater to iteratively update representations.
Disentangled GNN models: We apply recent disentangled GNN models to extract critical representations from the multi-hop subgraphs.
-
-
DisenGCN (Ma et al., 2019a) partitions the feature vector into K channels and uses neighborhood routing from capsule networks for disentanglement.
-
-
DisenHAN (Wang et al., 2020) adapts DisenGCN to heterogeneous graphs for recommendation. It employs DisenGCNs in different homogeneous graphs for intra-aggregation. It then employs the attention mechanism to aggregate information from different relationships under various channels.
-
-
CAL (Sui et al., 2022) employs attention modules to estimate the causal and trivial masks for structures and attributes. It encodes them with specific GCNs separately and applies causal intervention by randomly swapping the trivial part of the whole embeddings.
-
-
DisC (Fan et al., 2022) first estimates the causal/bias masks and then employs causal/bias-aware loss functions. It further generates counterfactual unbiased samples in the embedding space by swapping the biased part of the representations.
-
-
DIDA (Zhang et al., 2022) discovers invariant patterns within dynamic graphs by generating soft masks using the self-attention mechanism. It then applies random variant pattern swapping in both temporal and spatial dimensions as the causal intervention.
4.3. Implementation Details
All baselines and our proposed model are implemented with PyTorch and DGL/PyG. They are trained on an NVIDIA A800 80GB GPU and optimized with the Adam optimizer (Kingma and Ba, 2014). As for the baselines, we implement them directly using or referring to the official source codes. We develop the models with the training and validation sets and choose the final model with the best main metric on the validation set. Each dataset is divided into previous papers (included in the training set), fresh papers (new additions in the test set), and immediate papers (published at the test time point) for detailed analysis. We adhere to the recommended settings for all baselines. In our model across all datasets, the hop order is set to 2, corresponding top limits and are set to 100 and 20, the learning rate is set to 1e-4, the number of layers is set to 4, the co-cited/citing weight is set to 0.5, and the categories of equal frequency bins are set to 5. Additionally, the batch size is set to 64 for CS and CHM, and 32 for PSY, the disentanglement weight is set to 0.5 for CS and PSY, and 1.0 for CHM, and the hidden dimension is set to 128 for CS and PSY, and 192 for CHM.
4.4. Evaluation Metric
In our evaluation, we utilize two metrics: MALE (Mean Absolute Logarithmic Error) and LogR2 (Logarithmic R-squared). MALE calculates the absolute error between the target and predicted values post-logarithm transformation, reflecting the direct predictive capability:
| (17) |
Regarding LogR2, it evaluates the coefficient of determination, calculated as the proportion of the dependent variable’s variation predictable from the independent variable, following logarithm transformation for both variables:
| (18) |
LogR2 assumes a negative value when the model’s predictions fall short of the data’s mean value, indicating an inability to capture the underlying trend within the dataset. In our problem context, mirroring practical scenarios within dynamic contexts that require extrapolative abilities, encountering negative values is both frequent and expected due to inherent complexities. Consequently, by integrating MALE and LogR2, we holistically gauge the model’s accuracy in direct predictions for individual samples and its aptness in capturing broader trends across groups.
5. Results
5.1. Performance Comparison (RQ1)
To answer RQ1, we evaluate the performance of DPPDCC and other baselines. The comparison results are reported in Table 2 (Computer Science), 3 (Chemistry), and 4 (Psychology). We have the following observations:
| CS | model | all | prev | fresh | immed | ||||
| MALE | LogR2 | MALE | LogR2 | MALE | LogR2 | MALE | LogR2 | ||
| C&C | SciBERT | 0.6847 | 0.3558 | 0.6077 | 0.4424 | 0.8054 | 0.1108 | 0.7860 | 0.0843 |
| HINTS | 0.6799 | 0.2773 | 0.6429 | 0.2028 | 0.7378 | 0.2268 | 0.7387 | 0.1718 | |
| MUCas | 0.5079 | 0.6063 | 0.4331 | 0.6757 | 0.6250 | 0.4352 | 0.8261 | -0.1079 | |
| Dynamic | EGCN | 0.8157 | 0.1174 | 0.8008 | 0.0531 | 0.8392 | 0.0210 | 0.8387 | -0.1460 |
| Dysat | 0.6248 | 0.4355 | 0.5489 | 0.5029 | 0.7437 | 0.2321 | 0.8073 | 0.0089 | |
| ROLAND | 0.5814 | 0.5245 | 0.5166 | 0.5634 | 0.6828 | 0.3764 | 0.7157 | 0.2511 | |
| Disen | DisenGCN | 0.8215 | 0.1428 | 0.7816 | 0.1022 | 0.8841 | 0.0206 | 0.8485 | 0.0236 |
| DisenHAN | 0.8138 | 0.0054 | 0.7411 | 0.1003 | 0.9276 | -0.3220 | 1.0686 | -0.8032 | |
| CAL | 0.7323 | 0.2298 | 0.6859 | 0.2264 | 0.8050 | 0.0768 | 0.7940 | 0.0427 | |
| DisC | 0.6687 | 0.3434 | 0.6144 | 0.3908 | 0.7536 | 0.1472 | 0.7900 | -0.0735 | |
| DIDA | 0.5941 | 0.4703 | 0.5018 | 0.5642 | 0.7387 | 0.2391 | 0.8181 | -0.0207 | |
| ours | DPPDCC | 0.4473 | 0.6871 | 0.3783 | 0.7236 | 0.5553 | 0.5754 | 0.6035 | 0.4512 |
| #improve (%) | 11.93∗ | 13.32∗ | 12.65∗ | 7.09∗ | 11.15∗ | 32.22∗ | 15.68∗ | 79.67∗ | |
| CHM | model | all | prev | fresh | immed | ||||
| MALE | LogR2 | MALE | LogR2 | MALE | LogR2 | MALE | LogR2 | ||
| C&C | SciBERT | 0.5451 | 0.4648 | 0.4987 | 0.4709 | 0.6903 | 0.1477 | 0.6452 | 0.1653 |
| HINTS | 0.6024 | 0.3795 | 0.5848 | 0.3119 | 0.6574 | 0.2253 | 0.6449 | 0.1633 | |
| MUCas | 0.4691 | 0.6168 | 0.4314 | 0.6306 | 0.5869 | 0.3624 | 0.8073 | -0.3479 | |
| Dynamic | EGCN | 0.6424 | 0.2684 | 0.6177 | 0.1913 | 0.7196 | 0.0791 | 0.6976 | 0.0035 |
| Dysat | 0.5442 | 0.4573 | 0.5029 | 0.4411 | 0.6733 | 0.1998 | 0.6846 | 0.0582 | |
| ROLAND | 0.5001 | 0.5410 | 0.4592 | 0.5374 | 0.6280 | 0.2942 | 0.6406 | 0.1800 | |
| Disen | DisenGCN | 0.6405 | 0.2735 | 0.6079 | 0.2151 | 0.7427 | 0.0332 | 0.6987 | 0.0387 |
| DisenHAN | 0.6132 | 0.3793 | 0.5817 | 0.3683 | 0.7118 | 0.0630 | 0.7313 | -0.1466 | |
| CAL | 0.5864 | 0.3928 | 0.5541 | 0.3707 | 0.6873 | 0.1158 | 0.6535 | 0.1135 | |
| DisC | 0.5393 | 0.4770 | 0.5037 | 0.4578 | 0.6505 | 0.2387 | 0.6409 | 0.1719 | |
| DIDA | 0.4978 | 0.5760 | 0.4642 | 0.5689 | 0.6028 | 0.3587 | 0.6426 | 0.1669 | |
| ours | DPPDCC | 0.4355 | 0.6503 | 0.4071 | 0.6329 | 0.5243 | 0.5042 | 0.5802 | 0.3247 |
| #improve (%) | 7.16∗ | 5.44∗ | 5.64∗ | 0.36∗ | 10.67∗ | 39.13∗ | 9.42∗ | 80.39∗ | |
| PSY | model | all | prev | fresh | immed | ||||
| MALE | LogR2 | MALE | LogR2 | MALE | LogR2 | MALE | LogR2 | ||
| C&C | SciBERT | 0.6395 | 0.4308 | 0.6025 | 0.5041 | 0.7402 | 0.0068 | 0.7116 | -0.1095 |
| HINTS | 0.7749 | 0.1988 | 0.7799 | 0.2007 | 0.7614 | -0.0259 | 0.7064 | -0.0804 | |
| MUCas | 0.5207 | 0.6175 | 0.4804 | 0.6846 | 0.6306 | 0.2669 | 0.7708 | -0.3521 | |
| Dynamic | EGCN | 0.7424 | 0.2305 | 0.7375 | 0.2469 | 0.7560 | -0.0388 | 0.7102 | -0.1386 |
| Dysat | 0.6861 | 0.2998 | 0.6607 | 0.3342 | 0.7555 | -0.0170 | 0.7439 | -0.2377 | |
| ROLAND | 0.5643 | 0.5540 | 0.4996 | 0.6601 | 0.7406 | 0.0429 | 0.7926 | -0.3765 | |
| Disen | DisenGCN | 0.6557 | 0.3945 | 0.6316 | 0.4364 | 0.7213 | 0.0758 | 0.7081 | -0.0846 |
| DisenHAN | 0.7763 | 0.2455 | 0.8077 | 0.2187 | 0.6906 | 0.1387 | 0.6476 | 0.0522 | |
| CAL | 0.5631 | 0.5646 | 0.5469 | 0.5975 | 0.6073 | 0.3256 | 0.6285 | 0.1166 | |
| DisC | 0.5415 | 0.5915 | 0.5159 | 0.6343 | 0.6113 | 0.3233 | 0.6369 | 0.0963 | |
| DIDA | 0.5878 | 0.5118 | 0.5604 | 0.5620 | 0.6624 | 0.1950 | 0.6681 | -0.0092 | |
| ours | DPPDCC | 0.4463 | 0.7037 | 0.4138 | 0.7454 | 0.5349 | 0.4701 | 0.5633 | 0.2733 |
| #improve (%) | 14.29∗ | 13.96∗ | 13.86∗ | 8.87∗ | 11.92∗ | 44.38∗ | 10.38∗ | 134.40∗ | |
(1) All models perform well on previous papers presented in the training set but experience degradation when dealing with fresh and immediate papers in the test set, particularly in terms of the LogR2. Many models fail to figure out the overall trend of immediate papers, which results in negative values in LogR2. Even the best baseline, MUCas, struggles with immediate papers due to limited graph structures, as it is a cascade prediction model designed for papers with sufficient citations. However, dynamic GNN models can effectively encode multi-hop information to complement the lack of cascade structures. Disentangled GNNs, in particular, effectively uncover crucial insights within both multi-hop graph structures and node representations, notably beneficial for datasets like Psychology, which are denser. Moreover, models such as SciBERT and HINTS leverage prior knowledge, like content information or citation distribution, to tackle these challenges. Comparatively, while SciBERT outperforms HINTS in fitting the increments of previous papers (SciBERT ¿ HINTS), it faces greater difficulty with fresh papers (SciBERT ¡ HINTS). This implies that graph structures exhibit better generality and transferability to unseen samples, while shared content information remains robust for immediate papers with limited graph structures, both alleviating issues related to data distribution shifts.
(2) Both dynamic and heterogeneous graphs are important for our task. On one side, since temporal information within dynamic graphs exposes the evolved trend, it plays a crucial role. Dynamic GNNs possess comparable performance across all datasets for almost all categories of papers. In particular, DIDA, which considers dynamic graphs, stands out among the disentangled GNNs, closely matching MUCas’ performance across all datasets. On the other side, leveraging heterogeneous information can further enhance the performance of dynamic GNNs, as demonstrated by ROLAND. This general dynamic GNN framework achieves competitive performance akin to MUCas by integrating heterogeneous information. However, proper modeling of heterogeneous information is crucial; otherwise, it might lead to performance degradation. For instance, DisenHAN, compared to its backbone DisenGCN, struggles to encode valuable information within heterogeneous graphs, notably within the complex dataset Psychology.
(3) While Disentanglement methods offer performance improvements, their adaptation to dynamic heterogeneous graphs is essential to achieve optimal flexibility. Notably, DIDA exhibits superior outcomes than ROLAND in LogR2 for Chemistry, even when relying solely on homogeneous graphs. Moreover, within the densest dataset, Psychology, Disentangled GNN models showcase impressive performance. Among them, CAL outperforms both MUCas and ROLAND in predicting fresh and immediate papers. However, in other scenarios, apart from DIDA, these methods face challenges in competing with task-specific models and dynamic GNNs.
(4) Our proposed model surpasses all baselines, by effectively modeling the dynamic heterogeneous graph and incorporating task-adjusted disentanglement. This leads to an average improvement of about 10% in MALE across all categories, along with a substantial advancement of over 30% in LogR2 for fresh and immediate papers. First, compared with traditional citation/cascade prediction models, it exhibits superior generalization and practicability through the fusion of content and context information within citation networks, as well as the disentanglement power. Content information aids in discerning the impact of previous papers and fortifies robustness towards immediate papers. Moreover, its adeptness in handling fresh and immediate papers stems from the rich information embedded within graph structures. Furthermore, we consider the unique properties of citation networks to encode complex high-order structural and temporal information, thereby outperforming common dynamic models. The proposed CGE facilitates the identification of influential papers related to the target paper based on comparative and multi-hop information. More importantly, our model introduces interpretability from disentanglement models without compromising performance and further adapts to the task for enhanced improvement. It excels in predicting precise citation increments and approaches the genuine contribution of papers by disentangling values derived from information diffusion and collective conformity, thus providing insights into the papers’ authentic impact.
5.2. Ablation Test (RQ2)
To answer RQ2, ablation tests are performed on both CGE and PDM, highlighting the significance of various modules. As demonstrated in Table 5, for CGE, (-co-cited/citing) removes the proposed co-cited/citing strengths and only uses the original attention scores, (-CompGAT) replaces the CompGAT with original GATv2 (Brody et al., 2021), and (-readout) simply obtains the snapshot representation through avg-pooling over all paper nodes without filtering. For PDM, (-diffusion) removes the diffusion disentanglement, (-conformity) omits the conformity disentanglement, (-orthog) disregards the orthogonal constraints, and (-disen) eliminates all perspectives and replaces with a single MLP for prediction.
| model | CS | CHM | PSY | |
| ours | 0.4473 | 0.4355 | 0.4463 | |
| CGE | -co-cited/citing | 0.4650 | 0.5014 | 0.4528 |
| -CompGAT | 0.4722 | 0.4990 | 0.4582 | |
| -readout | 0.5116 | 0.4404 | 0.4932 | |
| PDM | -diffusion | 0.4593 | 0.4530 | 0.4573 |
| -conformity | 0.5177 | 0.4747 | 0.4580 | |
| -orthog | 0.4930 | 0.4388 | 0.4502 | |
| -disen | 0.4606 | 0.4447 | 0.4670 | |
We observe that: (1) All modules within DPPDCC play pivotal roles, as evidenced by the decrease in performance when any module is removed. Their significance varies across datasets due to diverse graph characteristics. (2) For CGE, the removal of type-specific attention readout may cause a notable performance drop. That could be attributed to the presence of excessive noisy information within multi-hop snapshots, which necessitates the filtering of aggregated information for better concentration. Specially, in chemistry, where subgraphs are sparser, simple avg-pooling might suffice to extract meaningful information. Furthermore, our proposed CompGAT effectively captures distinct comparative information, surpassing the original GATv2 in computer science and psychology. The incorporation of co-cited/citing strengths further enhances multi-hop information beyond the local neighborhood, resulting in improved performance. (3) Eliminating any disentanglement task adversely affects performance. Moreover, an evident decline is observed after removing the whole disentanglement module, especially in Psychology. Conformity rises as the paramount task among all disentanglement tasks. It focuses on the Matthew effect, pervasive and discernible in reality, thus significantly contributing to model performance.
5.3. Hyper-parameters Test (RQ3)
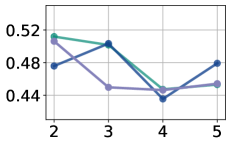
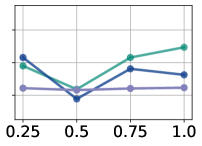
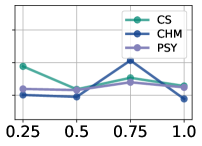
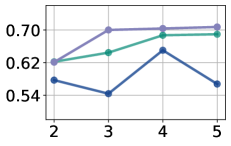
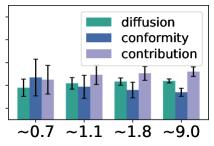
To address RQ3, we conduct experiments to assess the influence of three critical hyper-parameters in our model design: the stacked layer number , the importance of co-cited/citing strengths , and the weight of the disentanglement tasks . To ensure robust experimental outcomes, we focus on tuning these specific hyper-parameters while keeping other hyper-parameters fixed at their optimal values. In the following section, we report the corresponding results when tuning other important hyper-parameters. The experiment results are described in Figure 3 and 4.
5.3.1. The Impact of Model Depth
The number of layers serves as a pivotal hyperparameter for GNN-based models. Within this study, we explore values of in the range of 2, 3, 4, 5. For GNN-based models, increasing the number of layers facilitates the capture of higher-order connectivity within the graph during information propagation and aggregation. However, it also introduces the challenge of over-smoothing, a trend we’ve observed. As the layer count increases, model performance typically exhibits an initial rise followed by a decline—a phenomenon attributed to the interplay between increased connectivity capturing and eventual over-smoothing effects. In DPPDCC, besides GNN’s inherent challenges, the incorporated multi-hop co-cited/citing information and the intricate interaction between time and space dimensions could contribute to this phenomenon. Achieving the optimal hyperparameter requires finding a delicate balance between the GNN’s depth and its multi-hop/multi-dimensional information, ensuring an equilibrium that maximizes performance.
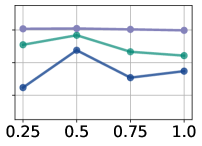
5.3.2. The Impact of Co-cited/citing Strengths
The weight parameter of co-cited/citing strengths governs the proportion of co-cited/citing strengths in the sum distributions relative to the original attention scores. Our study investigates optimal values of within the range 0.25, 0.5, 0.75, 1.0. Setting to 1.0 essentially disregards attention mechanisms, replacing them with fixed weights and reducing the model to a weighted GCN. Higher weights can potentially dominate significant signals learned by the model, while lower weights may inadequately incorporate additional information. Hence, a moderate value such as 0.5 might represent a suitable setting adaptable across various datasets, balancing the incorporation of additional information without overshadowing the model’s learned signals.
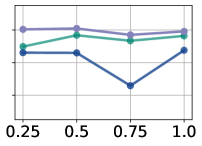
5.3.3. The Impact of Disentanglement Loss
The weight of disentanglement loss controls the importance of the disentanglement tasks relative to the main task. Our study explores optimal values of within the range 0.25, 0.5, 0.75, 1.0. Notably, the disentanglement weight exhibits greater stability in comparison to and , indicating consistent influence and effectiveness of the disentanglement task as an auxiliary task. Selecting an appropriate value can further enhance overall model performance, underscoring the significance of this parameter in refining the model’s effectiveness.
5.4. Visualization (RQ4)
To answer RQ4, we visualize both CGE and PDM in the test set of Chemistry to delve deeper into our model’s mechanisms. For CGE, we employ linear regressions to uncover relationships among the sum distribution , original attention distribution , and co-cited/citing distribution . This analysis aims to elucidate the interplay and dependencies among these distributions. For PDM, we first calculate correlations between predicted/ground-truth values and the perspective values/proportions. Next, we visualize the comprehensive compositions of disentangled values concerning time, category, and value. Subsequently, we delve into the representation distribution of conformity perspective to validate its rationality. This process offers insights into how different perspectives contribute to predictions.
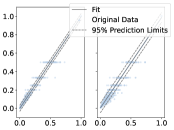
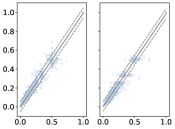
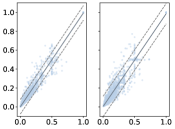
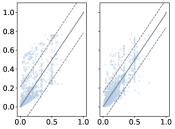
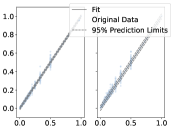
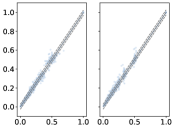
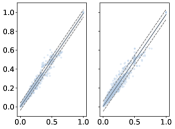
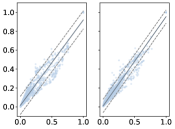
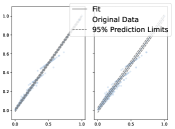
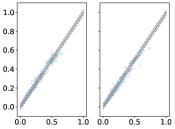
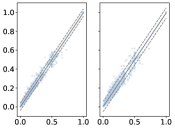
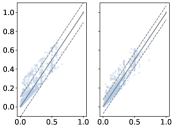
5.4.1. Weighting Score Visualization
 |
| (6.48/16.74) |
c
 |
| (17.60/17.05) |
 |
| (40.76/73.79) |
 |
| (299.40/152.78) |
 |
| (1.52/4.35) |
 |
| (4.15/4.36) |
 |
| (9.28/18.01) |
 |
| (58.70/36.62) |
 |
| (1.67/4.17) |
 |
| (4.53/4.28) |
 |
| (10.67/19.02) |
 |
| (85.97/40.87) |
To effectively visualize the connections between distributions, we gather all scores subsequent to applying softmax based on the target node. These scores are flattened to observe the overarching trend within the latest year. The original attention scores are averaged across all heads for ease of interpretation. Notably, for the negative effect in the co-citing relationship, we employ reversed values via , rendering them positive to reflect the trend. In Figure 5, robustly positive relationships are observed among the sum distribution , original attention distribution , and the distribution of co-cited/citing strengths . It is reasonable to note that the sum distribution closely resembles either of the sourced distributions. When compared to the co-cited/citing distribution, the sum distribution demonstrates greater similarity to the original attention distribution. Intriguingly, within the initial layers of the model, minimal disparities are evident between the original attention scores and the co-cited/citing strengths. This phenomenon is attributed to both the averaging across all heads and the model’s adaptation to the co-cited/citing information during the learning process. Moreover, while the overall trend is evident, a finer examination of the samples reveals that for instances with varying co-cited/citing strengths, their original attention scores tend to be equal, resulting in the displayed horizontal and vertical distribution evident in Figures 5a and 5e. This equal might arise due to the initial state of the attention mechanism in the Graph Attention Network (GAT). However, as the model progresses in depth, noticeable disparities emerge between these distributions in both ”cites” and ”is cited by” edges. In the upper layers, attention scores exhibit a tendency to concentrate on a select few nodes, while in the lower layers, they disperse attention across a wider array of nodes. Co-cited/citing strengths represent 2-hop information conveyed through intermediate nodes, resembling lower-hop information within GNNs. Therefore, continuously incorporating the co-cited/citing distribution across all layers reinforces signals originating from pivotal nodes across a broader spectrum. It can alleviate the over-smoothing issues by preventing the dominance of a select few nodes within aggregated information. This approach serves to explain why a layer count of 4 emerges as optimal—it encapsulates higher-order information beyond the 2-hop range, allowing the co-cited/citing information to complement the original attention scores. This collaboration achieves multi-hop information integration, mitigating both forgetting and overemphasis within the learning process.
5.4.2. Disentanglement Correlation Analysis
| dif | con | contri | dif (%) | con (%) | contri (%) | citations | pred | real | |
| dif | – | 0.9463 | 0.9675 | 0.6177 | -0.5847 | 0.3845 | 0.2159 | 0.9947 | 0.7804 |
| con | 0.9463 | – | 0.8787 | 0.5178 | -0.3892 | 0.1889 | 0.2765 | 0.9479 | 0.7501 |
| contri | 0.9675 | 0.8787 | – | 0.5182 | -0.6342 | 0.5124 | 0.1909 | 0.9828 | 0.7790 |
| dif (%) | 0.6177 | 0.5178 | 0.5182 | – | -0.6870 | 0.2795 | 0.0651 | 0.5641 | 0.3965 |
| con (%) | -0.5847 | -0.3892 | -0.6342 | -0.6870 | – | -0.8897 | -0.0157 | -0.5760 | -0.4305 |
| contri (%) | 0.3845 | 0.1889 | 0.5124 | 0.2795 | -0.8897 | – | -0.0201 | 0.4067 | 0.3197 |
| citations | 0.2159 | 0.2765 | 0.1909 | 0.0651 | -0.0157 | -0.0201 | – | 0.2226 | 0.2025 |
| pred | 0.9947 | 0.9479 | 0.9828 | 0.5641 | -0.5760 | 0.4067 | 0.2226 | – | 0.7895 |
| real | 0.7804 | 0.7501 | 0.7790 | 0.3965 | -0.4305 | 0.3197 | 0.2025 | 0.7895 | – |
In Table 6, we depict the correlations among all disentangled perspective values/proportions and the predicted/real values, focusing on samples with all positively predicted values within the Chemistry test set. For papers containing negative disentangled values, they always have nearly no increased citations. Remarkably, over 80% of them feature negative because their contribution values are the lowest across all perspectives, demonstrating the rationality of our proposed method. Among the correlations observed among the values of all three perspectives, ”conformity” stands out as particularly distinct. Its correlation with ”contribution” is notably the lowest, falling below 0.9. Additionally, its correlation with the predicted/real values also demonstrates a significant gap (-0.05/-0.03) when compared to other perspectives. Despite this, it emerges as the most closely associated perspective with accumulated citations, implying its significance in representing information linked to a paper’s reputation. The predicted increment appears as the most influential predictor of the real increment. Its aggregated value outperforms individual perspectives, highlighting the effectiveness of the proposed disentangled learning approach. Moreover, the real increment demonstrates minimal correlation with the paper’s accumulated citations. This revelation underscores two key points: (1) Citation increment proves to be an effective metric in portraying a paper’s potential impact, with accumulated citation accounting for only a fraction of the future increment. (2) The DPPDCC model adeptly captures the trend in a paper’s citation increment, validating its substantial potential and reliability. In our calculations of the proportions of all three perspectives within predicted values, a notable finding emerges: conformity diffusion stands out as the only perspective with numerous negative correlations. This observation suggests that in the field of Chemistry, papers solely characterized by accumulated citations tend to attract fewer new citations. Moreover, it shows an almost negative correlation with the proportion of contribution (-0.89), indicating their mutual exclusivity. Consequently, conformity and contribution have learned entirely distinct facets of citation increments. Overall, the diffusion perspective can be seen as the most pivotal factor for prediction, as it showcases the highest correlations in both values and proportions. This prominence aligns with the intuitive connection between citation increments and the information diffusion process. Conversely, the secondary perspective, contribution, likely delves into factors beyond the graph structure, aiming to uncover additional crucial elements. As a complement to the numerical citation increment, it offers a more objective evaluation, potentially aiding in the identification of valuable papers by encompassing diverse and complementary information.
5.4.3. Disentangled Composition Visualization
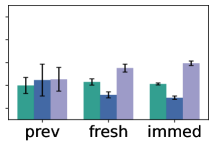
We visualize the disentanglement composition with all positive values in the test set of Chemistry. For the stacked plot associated with time in Figure 6a, a clear trend emerges: the contribution proportion gradually increases, while the conformity proportion undergoes a significant drop. This trend is sensible since old papers tend to accumulate substantial citations, thus attracting more researchers to cite them due to inertia. Additionally, the diffusion proportion appears to be more stable across different times, as it represents the potential hidden properties within diffusion. This stability becomes more pronounced when papers are categorized into previous, fresh, and immediate ones in Figure 6b. Diffusion proportions remain steady in both mean and standard deviation. Moreover, contribution emerges as the most critical perspective, with its dominant proportion. It further holds particular significance for fresh and immediate papers. For immediate papers receiving almost no citations, both the diffusion and conformity perspectives struggle to offer predictive insights. However, the contribution enables the model to anticipate the potential of samples in advance by analyzing their citation context. This capability enhances the model’s robustness, particularly for challenging samples close to cold-start scenarios. Furthermore, in Figure 6c, when we bin the samples based on the predicted logarithmic values, we observe a descending trend for conformity and a growing trend for contribution. Notably, within the lowest bin group, the conformity proportion surpasses the contribution proportion for the first time. The alignment between time and impact groups can unveil an overall trend: in dynamic contexts, previous papers tend to attract fewer new citations and may primarily owe to their conformity, whereas recent and immediate papers are more likely to garner increased citations owing to their genuine contributions.
5.4.4. Disentangled Conformity Representation Visualization
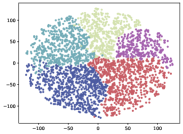
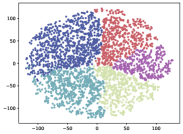
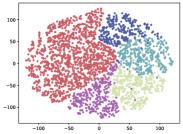
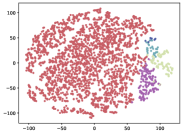
To validate that disentangled perspectives learn distinct aspects of the features, we visualize the representations extracted from the conformity encoder with T-SNE employed by scikit-learn (Pedregosa et al., 2011), as this perspective is the only one with available labels. Initially, the T-SNE algorithm is executed on the complete test sets of each category. Subsequently, 3000 points are randomly sampled to generate the figures. The points are color-coded based on the binning labels of the cumulative citations at the test time point. Figure 7 illustrates a consistent and structured distribution of points across all figures, indicating our model’s effective capture of group discrepancies across various binning labels in all categories. Across different categories, variations in the distribution of binning labels are evident due to differences in cumulative citations over time. Fresh Papers published within the last five years, particularly immediate ones, tend to fall under the lowest accumulated citation label (red), dominating a significant area. Nevertheless, discernible boundaries persist between distinct binning labels within these categories. This suggests the model’s capacity to generalize and transfer learned group differences to unseen samples, showcasing its potential applicability in real-world scenarios.
5.5. Case Study (RQ4)
| id | meta | disentangled values | disentangled proportions | potential impact | |||||||
| pub time | refs | citations | dif | con | contri | dif | con | contri | pred | real | |
| 242481 | 2012 | 28 | 43 | 1.2272 | 0.8977 | 1.4735 | 34.10% | 24.95% | 40.95% | 3.5984 | 3.0445 |
| 15676 | 2001 | 19 | 103 | 1.2151 | 0.9443 | 1.4569 | 33.60% | 26.11% | 40.29% | 3.6163 | 3.0445 |
| 374215 | 2015 | 60 | 26 | 1.1949 | 0.8409 | 1.6318 | 32.58% | 22.93% | 44.49% | 3.6675 | 3.2189 |
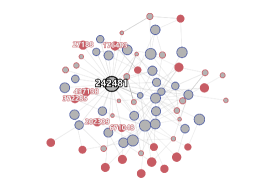
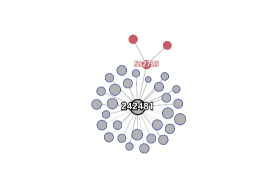
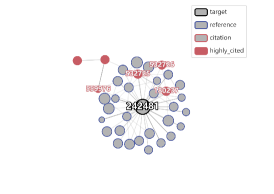
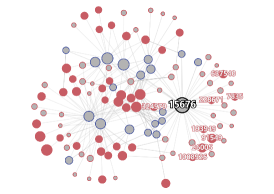
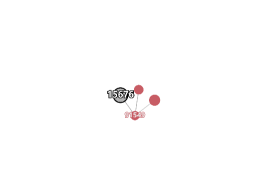
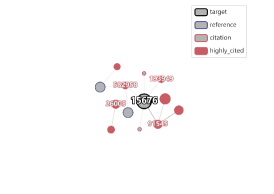
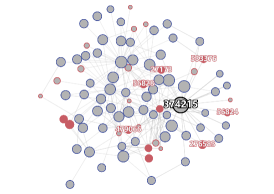
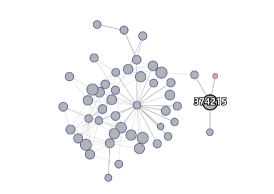
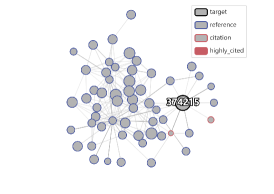
To delve into the intricate workings of our proposed model in addressing RQ4, we select three representative papers for each perspective. These papers should be co-cited or citing papers with similar topics, reflecting comparable predicted and real potential impact. Our approach involves contrasting their metadata, disentangled values, perspective proportions, and predicted/real potential impact. In this section, we visualize graph structures organized by co-cited strengths , average original attention scores , and sum scores within ”cites” edge subgraphs of the selected papers. To maintain clarity, we focus on graphs extracted from the latest year of the snapshots and the final layer of DPPDCC. We then filter the edges in 2-hop graphs based on the top 30% accumulated weights, resulting in sparser graphs. To create target-centric connected graphs, we retain only the direct citations and references of the target paper. Highly-cited papers, representing papers that provide the top 80% of citations within their respective fields of the whole datasets, are highlighted by filling in red within the graphs. Our labeling strategy encompasses the target paper and its directly connected highly-cited citations.
As outlined in Table 7, 242481, 15676, and 374215 respectively embody the diffusion, conformity, and contribution perspectives. Despite their near-identical predicted and real increments, their disentangled value compositions differ from one another. Notably, 374215 stands as a recent paper not encountered during the training phase, while 242481 and 15673 are earlier publications, each with varying years since publication and distinct accumulated citations. These papers exhibit perspective proportions aligning with all trends discussed in Section 5.4.3. As depicted in Figure 8, subgraphs manifest as the densest, while and subgraphs appear considerably sparser, featuring fewer interconnected nodes. In the higher layers of DPPDCC, the model tends to concentrate on specific nodes, resulting in sparsity in these graphs. The introduced co-cited strengths serve as a complementary factor to the original attention scores , aiding in identifying valuable citations from highly-cited papers. Notably, consistently incorporates highly-cited papers overlooked in subgraphs. For instance, Figures 8b and 8e consider only one highly-cited paper each (532725 and 91549). However, in Figures 8c and 8f, three additional highly-cited papers (559976, 532726, 180237 and 26005, 582958, 193949) - initially presented in Figures 8a and 8d - are taken into account.
For 242481, within the test set, it stands as a recent publication with limited citations due to its relatively short existence. Despite its lower accumulated citations compared to 15676, 242481 has garnered significant attention from four highly-cited papers, equaling the number received by 15676. Consequently, its average influential citation surpasses that of 15676, leading to a higher proportion of the diffusion perspective in its incremental source. Furthermore, since subgraphs depicted in Figure 8 are based on the ”cites” edge, only edges from valuable citations are retained. In contrast to 15676, 242481 boasts numerous connections from references, indicating its significance as an important citation from the perspective of its references. Consequently, it emerges as a pivotal element in the information diffusion process, contributing to its high diffusion values. For 15767, being the oldest paper with a publication span of over 10 years by the test time point (2017), its conformity value stands out as the highest among all cases, contributing significantly to a larger proportion of its incremental impact. Despite its extensive citation count, considering the evolving context of the citation network, its significance has diminished. Over time, citations toward this paper tend to lean more towards its established reputation rather than other factors. For 374215, it is the most recent paper with limited citations. Because it has neither highly-cited citations nor enough accumulated citations, compared to either 242481 or 15767, both its diffusion and conformity perspectives are low in values and proportions. Conversely, its contribution perspective appears as the most pivotal, showcasing the largest values and proportion. Benefiting from its contribution, 374215 successfully surpasses the other two papers in predicted/real potential impact. Interestingly, beyond the factors highlighted in the graph structures or accumulated citation counts, something intrinsic to its contribution stands out, as delineated by DPPDCC. This factor distinguishes itself from mere popularity, emphasizing DPPDCC’s substantial potential for practical application and impact.
Indeed, our proposed DPPDCC effectively disentangles citation increments derived from various factors for the target paper. This disentanglement, reflected in the values and proportions assigned to distinct perspectives, provides more comparable metrics for identifying valuable papers. In future work, we aim to extend this framework and assess its practical application in uncovering novel insights within real-world contexts. This ongoing exploration will enable us to delve deeper into new discoveries and applications facilitated by our disentanglement approach.
6. Conclusion
In this study, we propose a novel model named DPPDCC that disentangles the potential impacts of papers into diffusion, conformity, and contribution values. To better align with real-world conditions, we reformulate the problem by partitioning the datasets based on the observation time point, without excluding lowly-cited papers. Further, DPPDCC comprises two principal components: Citation-aware GNN Encoder (CGE) and Popularity-aware Disentanglement Module (PDM). Given the dynamic heterogeneous graph of a target paper, CGE employs CompGAT to encode the comparative and co-cited/citing information between papers and utilizes Type-specific Snapshot Readout to aggregate the information from each snapshot in an evolutionary manner. Subsequently, PDM identifies amplifying effects in information diffusion and addresses the Matthew effect stemming from accumulated citations from a collective conformity perspective. Finally, it constrains each perspective to address distinct aspects for preserving the genuine contribution. Experimental results on three datasets demonstrate that DPPDCC significantly outperforms alternative approaches for previous, fresh, and immediate papers. Disentanglement visualizations and a detailed case study provide additional evidence supporting DPPDCC’s reliable predictive capabilities.
In our future endeavors, we intend to develop extensive datasets spanning diverse fields of study to simulate practical scenarios. This initiative is geared towards significantly enhancing the practicality and relevance of our approach. Additionally, we plan to incorporate additional factors that account for citation intent, thereby enabling a more precise evaluation of the genuine contributions made by academic papers. Furthermore, we will conduct a thorough analysis of the model’s performance in identifying novel papers within specific domains. Importantly, we’ll validate these findings by comparing results with relevant studies, elucidating the practical implications of our proposed methodology.
References
- (1)
- Abrishami and Aliakbary (2019) Ali Abrishami and Sadegh Aliakbary. 2019. Predicting citation counts based on deep neural network learning techniques. Journal of Informetrics 13, 2 (2019), 485–499.
- Allison and Stewart (1974) Paul D Allison and John A Stewart. 1974. Productivity differences among scientists: Evidence for accumulative advantage. American sociological review (1974), 596–606.
- Beltagy et al. (2019) Iz Beltagy, Kyle Lo, and Arman Cohan. 2019. SciBERT: A Pretrained Language Model for Scientific Text. In Proceedings of the 2019 Conference on Empirical Methods in Natural Language Processing and the 9th International Joint Conference on Natural Language Processing (EMNLP-IJCNLP). 3615–3620.
- Bengio et al. (2013) Yoshua Bengio, Aaron Courville, and Pascal Vincent. 2013. Representation learning: A review and new perspectives. IEEE transactions on pattern analysis and machine intelligence 35, 8 (2013), 1798–1828.
- Bornmann and Daniel (2008) Lutz Bornmann and Hans-Dieter Daniel. 2008. What do citation counts measure? A review of studies on citing behavior. Journal of documentation 64, 1 (2008), 45–80.
- Brody et al. (2021) Shaked Brody, Uri Alon, and Eran Yahav. 2021. How Attentive are Graph Attention Networks? International Conference on Learning Representations (2021).
- Cai et al. (2019) Ruichu Cai, Zijian Li, Pengfei Wei, Jie Qiao, Kun Zhang, and Zhifeng Hao. 2019. Learning disentangled semantic representation for domain adaptation. In IJCAI: proceedings of the conference, Vol. 2019. NIH Public Access, 2060.
- Cao et al. (2017) Qi Cao, Huawei Shen, Keting Cen, Wentao Ouyang, and Xueqi Cheng. 2017. Deephawkes: Bridging the gap between prediction and understanding of information cascades. In Proceedings of the 2017 ACM on Conference on Information and Knowledge Management. 1149–1158.
- Case and Higgins (2000) Donald O Case and Georgeann M Higgins. 2000. How can we investigate citation behavior? A study of reasons for citing literature in communication. Journal of the American Society for Information Science 51, 7 (2000), 635–645.
- Chen et al. (2022) Xueqin Chen, Fengli Zhang, Fan Zhou, and Marcello Bonsangue. 2022. Multi-scale graph capsule with influence attention for information cascades prediction. International Journal of Intelligent Systems 37, 3 (2022), 2584–2611.
- Chu and Evans (2021) Johan SG Chu and James A Evans. 2021. Slowed canonical progress in large fields of science. Proceedings of the National Academy of Sciences 118, 41 (2021).
- Denton et al. (2017) Emily L Denton et al. 2017. Unsupervised learning of disentangled representations from video. Advances in neural information processing systems 30 (2017).
- Evans and Reimer (2009) James A Evans and Jacob Reimer. 2009. Open access and global participation in science. Science 323, 5917 (2009), 1025–1025.
- Fan et al. (2022) Shaohua Fan, Xiao Wang, Yanhu Mo, Chuan Shi, and Jian Tang. 2022. Debiasing graph neural networks via learning disentangled causal substructure. Advances in Neural Information Processing Systems 35 (2022), 24934–24946.
- Glänzel and Schubert (1995) Wolfgang Glänzel and András Schubert. 1995. Predictive aspects of a stochastic model for citation processes. Information processing & management 31, 1 (1995), 69–80.
- Gori et al. (2005) Marco Gori, Gabriele Monfardini, and Franco Scarselli. 2005. A new model for learning in graph domains. In Proceedings. 2005 IEEE international joint conference on neural networks, Vol. 2. 729–734.
- Gu et al. (2016) Jiatao Gu, Zhengdong Lu, Hang Li, and Victor OK Li. 2016. Incorporating Copying Mechanism in Sequence-to-Sequence Learning. Proceedings of the 54th Annual Meeting of the Association for Computational Linguistics (Volume 1: Long Papers) (2016), 1631–1640.
- Guille et al. (2013) Adrien Guille, Hakim Hacid, Cecile Favre, and Djamel A Zighed. 2013. Information diffusion in online social networks: A survey. ACM Sigmod Record 42, 2 (2013), 17–28.
- Hu et al. (2020) Ziniu Hu, Yuxiao Dong, Kuansan Wang, and Yizhou Sun. 2020. Heterogeneous graph transformer. In Proceedings of the web conference 2020. 2704–2710.
- Huang et al. (2022) Shengzhi Huang, Yong Huang, Yi Bu, Wei Lu, Jiajia Qian, and Dan Wang. 2022. Fine-grained citation count prediction via a transformer-based model with among-attention mechanism. Information Processing & Management 59, 2 (2022), 102799.
- Jiang et al. (2021) Song Jiang, Bernard Koch, and Yizhou Sun. 2021. HINTS: citation time series prediction for new publications via dynamic heterogeneous information network embedding. In Proceedings of the Web Conference 2021. 3158–3167.
- John et al. (2018) Vineet John, Lili Mou, Hareesh Bahuleyan, and Olga Vechtomova. 2018. Disentangled representation learning for non-parallel text style transfer. arXiv preprint arXiv:1808.04339 (2018).
- Kingma and Ba (2014) Diederik P Kingma and Jimmy Ba. 2014. Adam: A method for stochastic optimization. arXiv preprint arXiv:1412.6980 (2014).
- Kinney et al. (2023) Rodney Kinney, Chloe Anastasiades, Russell Authur, Iz Beltagy, Jonathan Bragg, Alexandra Buraczynski, Isabel Cachola, Stefan Candra, Yoganand Chandrasekhar, Arman Cohan, et al. 2023. The semantic scholar open data platform. arXiv preprint arXiv:2301.10140 (2023).
- Lee et al. (2021) Jungsoo Lee, Eungyeup Kim, Juyoung Lee, Jihyeon Lee, and Jaegul Choo. 2021. Learning debiased representation via disentangled feature augmentation. Advances in Neural Information Processing Systems 34 (2021), 25123–25133.
- Li et al. (2017) Cheng Li, Jiaqi Ma, Xiaoxiao Guo, and Qiaozhu Mei. 2017. Deepcas: An end-to-end predictor of information cascades. In Proceedings of the 26th international conference on World Wide Web. 577–586.
- Li et al. (2021) Haoyang Li, Xin Wang, Ziwei Zhang, Zehuan Yuan, Hang Li, and Wenwu Zhu. 2021. Disentangled contrastive learning on graphs. Advances in Neural Information Processing Systems 34 (2021), 21872–21884.
- Liu et al. (2020) Yanbei Liu, Xiao Wang, Shu Wu, and Zhitao Xiao. 2020. Independence promoted graph disentangled networks. In Proceedings of the AAAI Conference on Artificial Intelligence, Vol. 34. 4916–4923.
- Lo et al. (2020) Kyle Lo, Lucy Lu Wang, Mark Neumann, Rodney Kinney, and Daniel S Weld. 2020. S2ORC: The Semantic Scholar Open Research Corpus. In Proceedings of the 58th Annual Meeting of the Association for Computational Linguistics. 4969–4983.
- Locatello et al. (2019) Francesco Locatello, Stefan Bauer, Mario Lucic, Gunnar Raetsch, Sylvain Gelly, Bernhard Schölkopf, and Olivier Bachem. 2019. Challenging common assumptions in the unsupervised learning of disentangled representations. In international conference on machine learning. PMLR, 4114–4124.
- Ma et al. (2019a) Jianxin Ma, Peng Cui, Kun Kuang, Xin Wang, and Wenwu Zhu. 2019a. Disentangled graph convolutional networks. In International conference on machine learning. PMLR, 4212–4221.
- Ma et al. (2019b) Jianxin Ma, Chang Zhou, Peng Cui, Hongxia Yang, and Wenwu Zhu. 2019b. Learning disentangled representations for recommendation. Advances in neural information processing systems 32 (2019).
- Manessi et al. (2020) Franco Manessi, Alessandro Rozza, and Mario Manzo. 2020. Dynamic graph convolutional networks. Pattern Recognition 97 (2020), 107000.
- Page et al. (1998) Lawrence Page, Sergey Brin, Rajeev Motwani, and Terry Winograd. 1998. The pagerank citation ranking: Bring order to the web. Technical Report. Technical report, stanford University.
- Pareja et al. (2020) Aldo Pareja, Giacomo Domeniconi, Jie Chen, Tengfei Ma, Toyotaro Suzumura, Hiroki Kanezashi, Tim Kaler, Tao Schardl, and Charles Leiserson. 2020. Evolvegcn: Evolving graph convolutional networks for dynamic graphs. In Proceedings of the AAAI Conference on Artificial Intelligence, Vol. 34. 5363–5370.
- Pedregosa et al. (2011) F. Pedregosa, G. Varoquaux, A. Gramfort, V. Michel, B. Thirion, O. Grisel, M. Blondel, P. Prettenhofer, R. Weiss, V. Dubourg, J. Vanderplas, A. Passos, D. Cournapeau, M. Brucher, M. Perrot, and E. Duchesnay. 2011. Scikit-learn: Machine Learning in Python. Journal of Machine Learning Research 12 (2011), 2825–2830.
- Reimers and Gurevych (2019) Nils Reimers and Iryna Gurevych. 2019. Sentence-BERT: Sentence Embeddings using Siamese BERT-Networks. Proceedings of the 2019 Conference on Empirical Methods in Natural Language Processing and the 9th International Joint Conference on Natural Language Processing (EMNLP-IJCNLP) (2019), 3982–3992.
- Ruan et al. (2020) Xuanmin Ruan, Yuanyang Zhu, Jiang Li, and Ying Cheng. 2020. Predicting the citation counts of individual papers via a BP neural network. Journal of Informetrics 14, 3 (2020), 101039.
- Sankar et al. (2020) Aravind Sankar, Yanhong Wu, Liang Gou, Wei Zhang, and Hao Yang. 2020. Dysat: Deep neural representation learning on dynamic graphs via self-attention networks. In Proceedings of the 13th international conference on web search and data mining. 519–527.
- Scarselli et al. (2008) Franco Scarselli, Marco Gori, Ah Chung Tsoi, Markus Hagenbuchner, and Gabriele Monfardini. 2008. The graph neural network model. IEEE transactions on neural networks 20, 1 (2008), 61–80.
- Schlichtkrull et al. (2018) Michael Schlichtkrull, Thomas N Kipf, Peter Bloem, Rianne Van Den Berg, Ivan Titov, and Max Welling. 2018. Modeling relational data with graph convolutional networks. In European semantic web conference. Springer, 593–607.
- Silagadze (1997) ZK Silagadze. 1997. Citations and the Zipf–Mandelbrot Law. Complex Systems 11 (1997), 487–499.
- Sinatra et al. (2016) Roberta Sinatra, Dashun Wang, Pierre Deville, Chaoming Song, and Albert-László Barabási. 2016. Quantifying the evolution of individual scientific impact. Science 354, 6312 (2016), aaf5239.
- Sperduti and Starita (1997) Alessandro Sperduti and Antonina Starita. 1997. Supervised neural networks for the classification of structures. IEEE Transactions on Neural Networks 8, 3 (1997), 714–735.
- Sui et al. (2022) Yongduo Sui, Xiang Wang, Jiancan Wu, Min Lin, Xiangnan He, and Tat-Seng Chua. 2022. Causal attention for interpretable and generalizable graph classification. In Proceedings of the 28th ACM SIGKDD Conference on Knowledge Discovery and Data Mining. 1696–1705.
- Tatar et al. (2014) Alexandru Tatar, Marcelo Dias De Amorim, Serge Fdida, and Panayotis Antoniadis. 2014. A survey on predicting the popularity of web content. Journal of Internet Services and Applications 5, 1 (2014), 1–20.
- Thornley et al. (2015) Clare Thornley, Anthony Watkinson, Dave Nicholas, Rachel Volentine, Hamid R Jamali, Eti Herman, Suzie Allard, Kenneth Levine, and Carol Tenopir. 2015. The role of trust and authority in the citation behaviour of researchers. Information research (2015).
- Tran et al. (2017) Luan Tran, Xi Yin, and Xiaoming Liu. 2017. Disentangled representation learning gan for pose-invariant face recognition. In Proceedings of the IEEE conference on computer vision and pattern recognition. 1415–1424.
- Van Raan (2004) Anthony FJ Van Raan. 2004. Sleeping beauties in science. Scientometrics 59, 3 (2004), 467–472.
- Wang et al. (2013) Dashun Wang, Chaoming Song, and Albert-László Barabási. 2013. Quantifying long-term scientific impact. Science 342, 6154 (2013), 127–132.
- Wang et al. (2020) Yifan Wang, Suyao Tang, Yuntong Lei, Weiping Song, Sheng Wang, and Ming Zhang. 2020. Disenhan: Disentangled heterogeneous graph attention network for recommendation. In Proceedings of the 29th ACM international conference on information & knowledge management. 1605–1614.
- Wen et al. (2022) Qianlong Wen, Zhongyu Ouyang, Jianfei Zhang, Yiyue Qian, Yanfang Ye, and Chuxu Zhang. 2022. Disentangled dynamic heterogeneous graph learning for opioid overdose prediction. In Proceedings of the 28th ACM SIGKDD Conference on Knowledge Discovery and Data Mining. 2009–2019.
- Wu et al. (2019) Lingfei Wu, Dashun Wang, and James A Evans. 2019. Large teams develop and small teams disrupt science and technology. Nature 566, 7744 (2019), 378–382.
- Wu et al. (2020) Zonghan Wu, Shirui Pan, Fengwen Chen, Guodong Long, Chengqi Zhang, and S Yu Philip. 2020. A comprehensive survey on graph neural networks. IEEE transactions on neural networks and learning systems 32, 1 (2020), 4–24.
- Xu et al. (2018) Keyulu Xu, Weihua Hu, Jure Leskovec, and Stefanie Jegelka. 2018. How Powerful are Graph Neural Networks? International Conference on Learning Representations (2018).
- Xu et al. (2022) Xovee Xu, Fan Zhou, Kunpeng Zhang, and Siyuan Liu. 2022. CCGL: Contrastive Cascade Graph Learning. IEEE Transactions on Knowledge and Data Engineering (2022).
- Xue et al. (2023) Zhikai Xue, Guoxiu He, Jiawei Liu, Zhuoren Jiang, Star Zhao, and Wei Lu. 2023. Re-examining lexical and semantic attention: Dual-view graph convolutions enhanced BERT for academic paper rating. Information Processing & Management 60, 2 (2023), 103216.
- Yan et al. (2011) Rui Yan, Jie Tang, Xiaobing Liu, Dongdong Shan, and Xiaoming Li. 2011. Citation count prediction: learning to estimate future citations for literature. In Proceedings of the 20th ACM international conference on Information and knowledge management. 1247–1252.
- Yang et al. (2022) Caipiao Yang, Peng Bao, Rong Yan, Jianian Li, and Xuanya Li. 2022. A Graph Temporal Information Learning Framework for Popularity Prediction. In Companion Proceedings of the Web Conference 2022. 239–242.
- Yang et al. (2020) Yiding Yang, Zunlei Feng, Mingli Song, and Xinchao Wang. 2020. Factorizable graph convolutional networks. Advances in Neural Information Processing Systems 33 (2020), 20286–20296.
- You et al. (2022) Jiaxuan You, Tianyu Du, and Jure Leskovec. 2022. ROLAND: graph learning framework for dynamic graphs. In Proceedings of the 28th ACM SIGKDD Conference on Knowledge Discovery and Data Mining. 2358–2366.
- Yu et al. (2014) Tian Yu, Guang Yu, Peng-Yu Li, and Liang Wang. 2014. Citation impact prediction for scientific papers using stepwise regression analysis. Scientometrics 101, 2 (2014), 1233–1252.
- Zhang et al. (2022) Zeyang Zhang, Xin Wang, Ziwei Zhang, Haoyang Li, Zhou Qin, and Wenwu Zhu. 2022. Dynamic graph neural networks under spatio-temporal distribution shift. In Advances in Neural Information Processing Systems.
- Zhou et al. (2021) Fan Zhou, Xovee Xu, Goce Trajcevski, and Kunpeng Zhang. 2021. A survey of information cascade analysis: Models, predictions, and recent advances. ACM Computing Surveys (CSUR) 54, 2 (2021), 1–36.