LEAVE UNSET \jmlryear2023 \jmlrsubmittedLEAVE UNSET \jmlrpublishedLEAVE UNSET \jmlrworkshopMachine Learning for Health (ML4H) 2023
Causal prediction models for medication safety monitoring: The diagnosis of vancomycin-induced acute kidney injury
Abstract
The current best practice approach for the retrospective diagnosis of adverse drug events (ADEs) in hospitalized patients relies on a full patient chart review and a formal causality assessment by multiple medical experts. This evaluation serves to qualitatively estimate the probability of causation (PC); the probability that a drug was a necessary cause of an adverse event. This practice is manual, resource intensive and prone to human biases, and may thus benefit from data-driven decision support. Here, we pioneer a causal modeling approach using observational data to estimate a lower bound of the PC (PClow). This method includes two key causal inference components: (1) the target trial emulation framework and (2) estimation of individualized treatment effects using machine learning. We apply our method to the clinically relevant use-case of vancomycin-induced acute kidney injury in intensive care patients, and compare our causal model-based PClow estimates to qualitative estimates of the PC provided by a medical expert. Important limitations and potential improvements are discussed, and we conclude that future improved causal models could provide essential data-driven support for medication safety monitoring in hospitalized patients.
keywords:
Probability of causation, adverse drug event, intensive care unit, counterfactual1 Introduction
Adverse drug events (ADEs) are common in hospitalized patients, affecting up to three in ten patients (Bates et al., 1995; Klopotowska et al., 2013b). Although the diagnosis of ADEs (i.e., detection after the fact) is of vital importance for patient safety and outcomes, ADEs often remain undetected (Bates et al., 2023; Klopotowska et al., 2013a). The current best practice approach for ADE diagnosis relies on a full patient chart review and a formal causality assessment by multiple medical experts to qualitatively estimate the probability of causation (PC); the probability that a drug was a necessary cause of an adverse event (Klopotowska et al., 2013b; WHO-UMC, 2018; Naranjo et al., 1981). This approach is manual and resource intensive, thereby hampering large scale medication safety monitoring and its use in daily, often busy, clinical practice. Furthermore, this approach suffers from low inter-rater reliability and a high risk of bias (Varallo et al., 2017). Novel methods for the diagnosis of ADEs are therefore urgently needed, and artificial intelligence may aid through data-driven approaches (Bates et al., 2023). However, a recent systematic review on prediction models for the diagnosis (and prognosis) of ADEs in hospitalized patients noticed a lack of studies addressing the causal aspect of ADEs in their modeling approach (Yasrebi-de Kom et al., 2023). Importantly, addressing this causal aspect could alleviate the above mentioned biases from human assessors.
The PC answers the following counterfactual question: Given a patient that received a drug and subsequently developed an adverse event, what is the probability that the patient would not have developed the adverse event if the patient had not received the drug? Past seminal work uncovered that the PC is non-identifiable from epidemiological data (Robins and Greenland, 1989; Greenland and Robins, 1988). Nonetheless, an informative lower bound on the PC (PClow) is identifiable given strong assumptions (Robins and Greenland, 1989; Suzuki et al., 2012; Tian and Pearl, 2000).
Here, we pioneer a data-driven method to estimate the PClow using causal prediction models, which may support the current best practice approach. To the best of our knowledge, the PClow is a novel estimand in the setting of causal model-based ADE diagnosis. Our method combines two important causal inference concepts: the target trial emulation (TTE) framework (Hernán and Robins, 2016) and individualized treatment effect (ITE) estimation using machine learning. The TTE framework serves to support causal inference using observational data through the design of a hypothetical randomized controlled trial. This process aids in the identification and avoidance of biases and limitations related to the approach and the data. Estimation of ITEs using machine learning shows promising results (Bica et al., 2021; Künzel et al., 2019). Given that we expect the adverse effects of drugs to vary across individuals (Kim et al., 2022), obtaining individualized PClow estimates seems to be necessary for ADE diagnosis.
We apply our method in the clinically relevant and frequently occurring use-case of vancomycin-induced acute kidney injury (VAKI) in intensive care unit (ICU) patients (Kan et al., 2022). Vancomycin - an antibiotic - can be nephrotoxic (i.e. toxic for the kidneys), and thereby cause a rapid decline in kidney function, also known as acute kidney injury (AKI) (Kellum et al., 2012). Although we use VAKI as our use-case, the presented approach may be applicable for any other ADE.
2 Methods
2.1 The Probability of Causation
Previous work uncovered the assumptions needed to estimate the PClow (Robins and Greenland, 1989; Suzuki et al., 2012; Tian and Pearl, 2000). These assumptions largely overlap with those commonly described in causal inference literature regarding the estimation of average treatment effects on the treated: the stable unit treatment value assumption (VanderWeele and Hernan, 2013; Rubin, 1980), weak positivity (Imbens, 2004) and conditional ignorability for controls (Imbens, 2004; Heckman et al., 1997). However, additional strong assumptions are needed concerning the biological mechanisms that connect the treatment with the outcome, censoring events and competing risks: a monotonic relationship between the treatment and the outcome conditional on the covariates, and a non-preventive relationship between the treatment and censoring events and competing risks (Robins and Greenland, 1989; Suzuki et al., 2012) (\appendixrefapd:first).
Our retrospective observational data consists of ICU admissions, each with covariates , a treatment indicator (whose values denote an alternative antibiotic and vancomycin, respectively) and an outcome indicator (denoting no AKI and AKI, respectively).
Given the above assumptions, the PClow is given by the excess-risk-ratio (ERR) when it yields a positive value (Robins and Greenland, 1989; Tian and Pearl, 2000; Suzuki et al., 2012):
| (1) |
where the ERR is given by one minus the inverse of the risk ratio (RR):
| (2) |
Henceforth, we denote and with and , respectively.
2.2 Target Trial Emulation
Although the TTE framework has mostly been applied for the estimation of average treatment effects, e.g. by Hoffman et al. (2022) and De Bus et al. (2020), we deem the framework to be equally useful and relevant in rigorously defining the relevant population and control group needed for estimating the PClow. We define a hypothetical trial comparing the risk of AKI in the ICU between eligible ICU admissions initiated on vancomycin and eligible ICU admissions initiated on one of several alternative, minimally nephrotoxic antibiotics with overlapping indications. We specify the trial protocol components: eligibility criteria, treatment strategies, assignment procedure, follow-up period, outcome, causal contrast of interest and analysis plan (Hernán and Robins, 2016; Fu, 2023). For each of the components, we identify limitations associated with our data and approach, and attempt to mitigate these through our trial emulation. See \appendixrefapd:second for our TTE protocol.
2.3 Data
We utilize a retrospective observational data set consisting of electronic health record (EHR) data of 176,489 consecutive admissions to 15 Dutch ICUs between January 1, 2010 and December 31, 2019. The data consist of two linked parts: (1) The Dutch National Intensive Care Evaluation (NICE) quality registry (van de Klundert et al., 2015) and (2) data directly collected from the 15 ICUs. See \appendixrefapd:third for a more elaborate description of our data.
2.4 Modeling
We estimate and using T-learners, which are a type of meta-learners commonly applied for ITE estimation (Künzel et al., 2019). This approach involves fitting two base models that predict the outcome (AKI): one using the ICU admissions that received an alternative antibiotic (0), and one using the ICU admissions that received vancomycin (1). Next, these base models are applied to estimate and for all ICU admissions, thereby estimating the counterfactuals. We develop three T-learners, each with different base models: Bayesian additive regression trees (BART) (Chipman et al., 2010), random forests (RF) (Breiman, 2001; O’Brien and Ishwaran, 2019) and logistic regression (LR). We choose the BART and RF base learners as they are commonly used and compared in ITE estimation tasks using T-learners (Künzel et al., 2019; Caron et al., 2022), and add the LR base learner (without interaction terms) to investigate the relative performance of a ‘simple’ linear approach.
Using the T-learner and estimates, we calculate the PClow for all ICU admissions that received vancomycin and subsequently developed AKI. Additionally, we calculate the average treatment effect on the treated (ATT) by averaging the and estimates and subsequently calculating the absolute risk difference (ARD) and RR for the ICU admissions that received vancomycin.
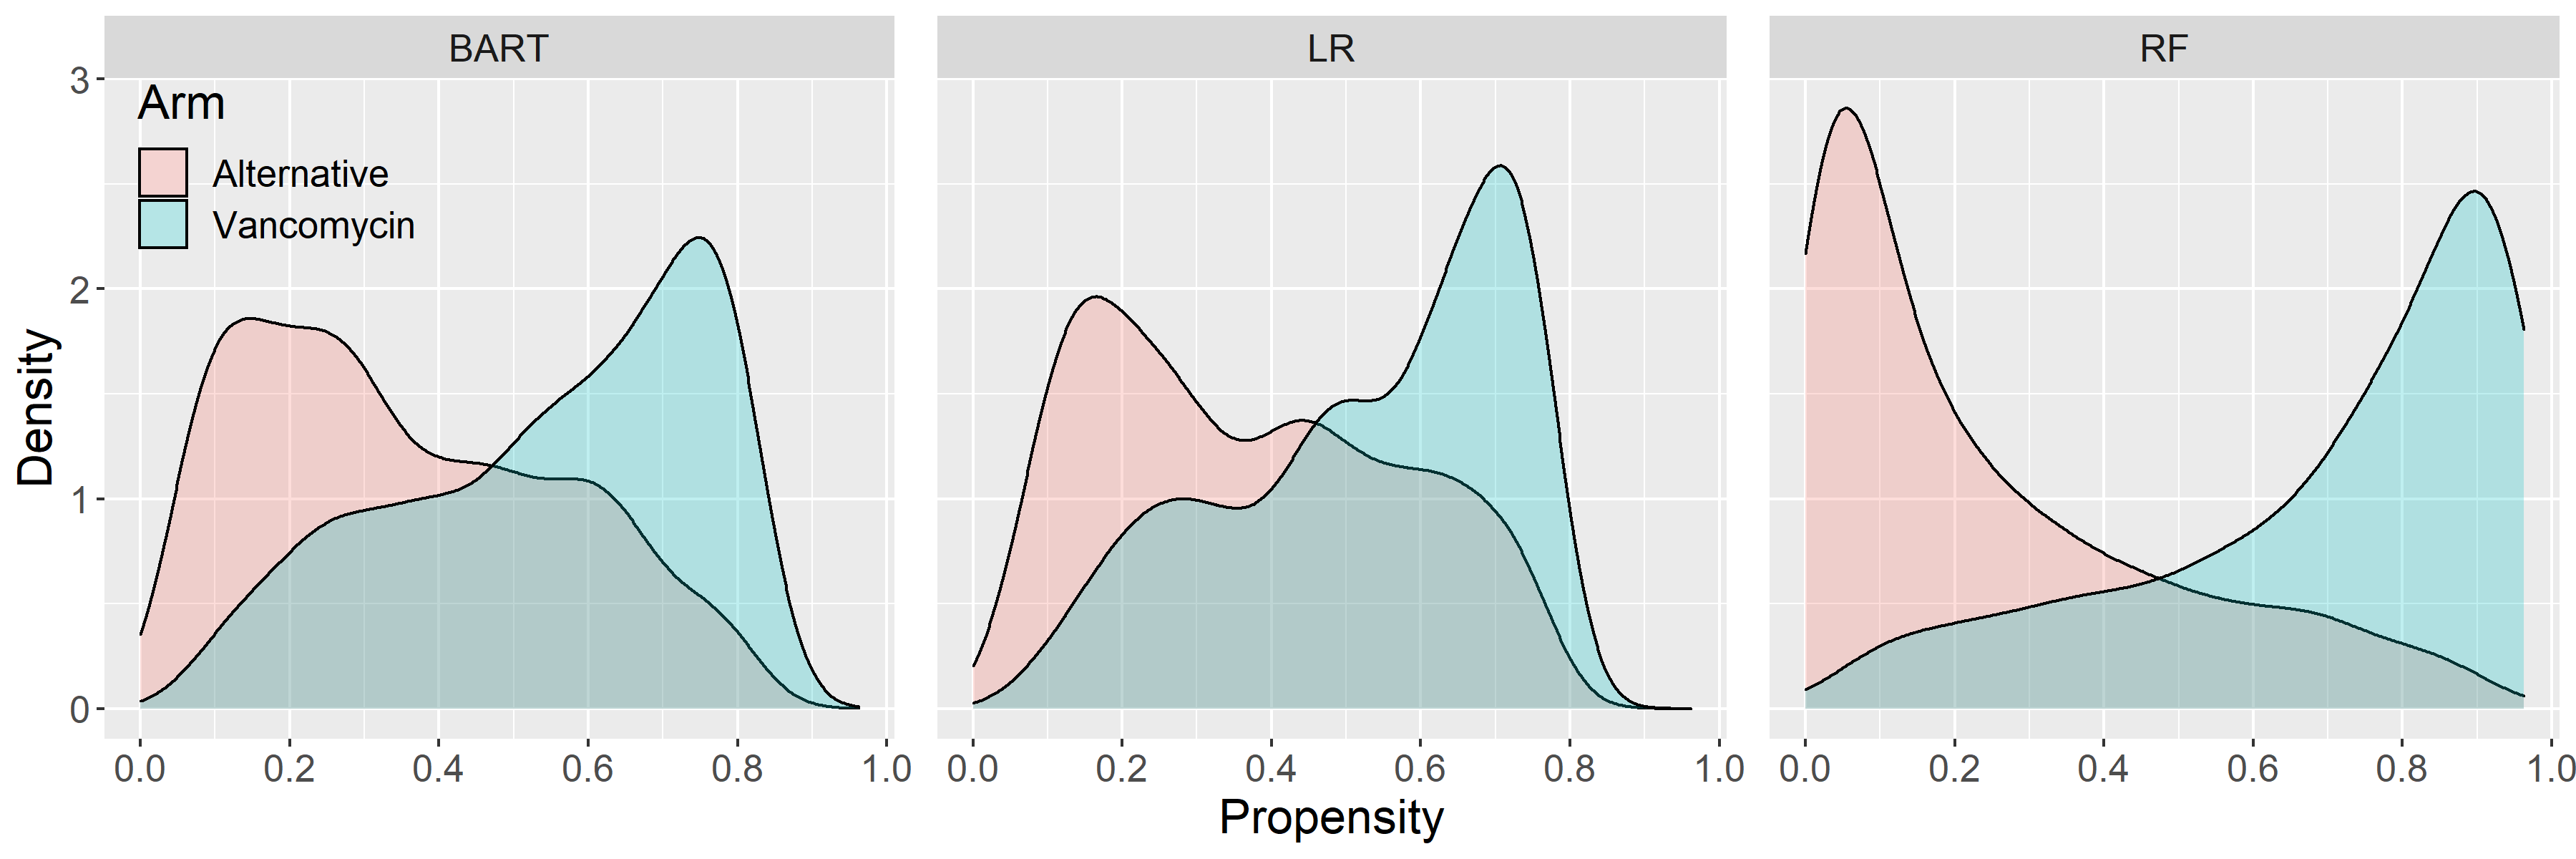
We compare these ATTs to estimates obtained through inverse probability of treatment weighting (IPTW), for which we calculate the propensity scores with three different methods: BART, RF and LR. To ensure that the positivity assumption is not violated, we assess the overlap of the treatment probabilities between the treatment groups and exclude the ICU admissions outside the area of common support (Bergstra et al., 2019). As this assumption is equally important for the T-learners, we also apply this selection before fitting these. See \appendixrefapd:third for additional details about our methods.
fig:pc

2.5 Evaluation
We randomly split our data into a train set (90%) and a test set (10%). All models are developed using the train set. We evaluate both the factual AKI and the counterfactual PClow predictions of the T-learners using the test set. For the evaluation of the factual AKI predictions, we calculate the area under the receiver operating characteristic curve (AUC) of the T-learner base models on their respective treatment arm. We evaluate the T-learners’ counterfactual PClow predictions using the test set’s ICU admissions that received vancomycin and subsequently developed AKI. For these admissions, one medical expert conducted formal causality assessments using the WHO-UMC criteria tailored to drug-induced AKI (WHO-UMC, 2018; Mehta et al., 2015). These assessments result in a qualitative estimate of the PC by labeling each case with an unassessable, unlikely, possible, probable or nearly certain causal relationship between vancomycin and AKI. We assign the following probabilities to the latter categories: 0.5, 0.25, 0.5, 0.75 and 0.9, respectively, and calculate the mean squared error (MSE). A probability of 0.5 is assigned to the unassessable category in line with a recent systematic review that reported the attributable fraction for patients treated with vancomycin and a subsequent AKI (Ray et al., 2016). Next, we dichotomize the qualitative estimates to a value of 1 for an unassessible, possible, probable and nearly certain, and a value of 0 for an unlikely causal relationship, and calculate the AUC and the positive predictive value (PPV). For the latter, we dichotomize each predicted PClow with a threshold of 0.5, as this threshold represents the idea that it was more likely than not that vancomycin was a necessary cause of the AKI. Lastly, we calculate the correlation between the PClow predictions of the three T-learners to inspect the agreement between the predictions of the models.
We obtain 95% confidence intervals (CIs) for the ATT and evaluation metrics through a cluster bootstrap procedure with 500 replications, where the clusters are the ICUs. The code for the analyses is available on GitHub.
3 Results
Of the 176,489 ICU admissions in our data set, 1,638 ICU admissions meet our eligibility criteria. Of these 1,638 admissions, 1,474 are assigned to the train set and 164 to the test set. See \appendixrefapd:fourth for the baseline characteristics. AKI incidences in the vancomycin and alternative treatment groups are 21.8 and 14.5%, respectively.
The distribution of the PClow predictions by the BART and LR models are similar, with about 25% of the ICU admissions assigned a PClow of zero and about 50% of the ICU admissions assigned a PClow between 0.5 and 1. In contrast, the distribution of the PClow predictions of the RF T-learner is skewed towards high PClow estimates (\figurereffig:pc).
On average, vancomycin confers an increase in AKI risk compared to the alternative antibiotics in patients that were treated with vancomycin. However, the CIs include the null hypothesis (no average causal effect) in all estimates, except in that of the RF T-learner (\appendixrefapd:fifth).
The BART T-learner shows the highest AUC in the evaluation of the factual AKI predictions, followed by the RF and LR models (\appendixrefapd:sixth). The test set contains 15 patients that were exposed to vancomycin and subsequently developed AKI. The evaluation of the counterfactual PClow predictions reveals a relatively low agreement with the medical expert for all T-learner models (\tablereftab:eval). Overall, the LR T-learner shows the best agreement.
The overlap in the predicted propensity score distributions between the two treatment groups is relatively high for the BART and LR propensity models, but relatively low for the RF model (\appendixrefapd:seventh). Lastly, agreement on the PClow predictions is relatively high between the BART and LR T-learners, but relatively low between the RF T-learner and the latter (\appendixrefapd:eighth).
tab:eval
| Model | AUC | PPV | MSE |
|---|---|---|---|
| BART | 0.57 (0.32 - 0.76) | 0.40 (0.25 - 0.67) | 0.17 (0.10 - 0.28) |
| RF | 0.62 (0.42 - 0.87) | 0.41 (0.22 - 0.67) | 0.18 (0.12 - 0.29) |
| LR | 0.62 (0.38 - 0.81) | 0.43 (0.25 - 0.67) | 0.15 (0.10 - 0.28) |
4 Discussion
Using a combination of the PClow estimand, the TTE framework and ITE estimation, we present a novel data-driven approach for ADE diagnosis to monitor medication safety.
The estimates of all three T-learners show a relatively low agreement with the assessments by the medical expert. Three important limitations of our method became apparent after consulting with the medical expert. First, supratherapeutic vancomycin blood levels are an important factor suggestive of VAKI. Second, an improvement of the AKI marker (serum creatinine, SCr) after discontinuation of vancomycin is also an important suggestive factor. Third, an upward trend in SCr before vancomycin initiation may signal a pre-existing AKI. While the first two limitations are not (directly) addressable by our method as they concern post-initiation information, the third limitation could be addressed by adding more information on pre-initiation SCr trends in constructed variables. Providing more information about such variables to the models may improve the individualization of the PClow estimates.
Our relatively stringent inclusion and exclusion criteria severely restrict the number of included ICU admissions. Although most exclusions are due to not initiating vancomycin or an alternative antibiotic, our cohort of 1,638 ICU admissions comprises of roughly 10% of the population of interest. It is important to take into account the baseline characteristics of our cohort when aiming to generalize the estimated ATT to different populations. The estimated ATT would likely not be transportable to populations with different distributions of effect modifying patient characteristics.
Inspection of the propensity score distributions and the agreement between the T-learner PClow predictions reveal that RF may be inferior in this use-case, possibly due to overfitting and inadequate calibration. The risk of overfitting RF propensity score models has been reported previously, and may be higher in smaller sample size settings (Ferri-García and Rueda, 2020). Inadequate calibration may especially be a risk for RF models (Gutman et al., 2022). The more extreme propensity scores predicted by the RF propensity model may result in biased estimates (Zhu et al., 2021; Zhou et al., 2020). Careful assessment of the causal inference assumptions is of critical importance in the assessment of the models and the identification of optimal modeling techniques. As no gold standard is available for estimated ITEs in real-world settings, standard discrimination and calibration measures of factual outcome predictions are not sufficient for assessing model performance.
It is important to note that the goal of causal model-based ADE diagnosis is not the emulation of the current best practice, given the known risk of bias associated with human assessors. Instead, the aim is to reliably estimate the individualized PClow to aid the human assessor. The current best practice approach does - however - provide the best available comparator. An important limitation of this comparison is the arbitrary mapping of the qualitative causality assessment outcome categories to probabilities.
Future work may address the limitations of our study, including the ones we describe above, the relatively small sample size and our limited capability to emulate the defined hypothetical trial (e.g. by improving the identification of eligible patients). Furthermore, more work is needed on the identification of optimal modeling strategies (e.g. base learner choices) and methods to more objectively compare the qualitative outcomes of causality assessments to model based PClow estimates. Importantly, addressing these issues may enable the development of accurate, data-driven causal prediction models capable of supporting ADE diagnosis, thereby providing the needed improvement in medication safety monitoring.
References
- Bates et al. (1995) David W Bates, David J Cullen, Nan Laird, Laura A Petersen, Stephen D Small, Deborah Servi, Glenn Laffel, Bobbie J Sweitzer, Brian F Shea, Robert Hallisey, et al. Incidence of adverse drug events and potential adverse drug events: implications for prevention. Jama, 274(1):29–34, 1995.
- Bates et al. (2023) David W Bates, David M Levine, Hojjat Salmasian, Ania Syrowatka, David M Shahian, Stuart Lipsitz, Jonathan P Zebrowski, Laura C Myers, Merranda S Logan, Christopher G Roy, et al. The safety of inpatient health care. New England Journal of Medicine, 388(2):142–153, 2023.
- Bergstra et al. (2019) Sytske Anne Bergstra, Alexandre Sepriano, Sofia Ramiro, and Robert Landewé. Three handy tips and a practical guide to improve your propensity score models. RMD open, 5(1):e000953, 2019.
- Bica et al. (2021) Ioana Bica, Ahmed M Alaa, Craig Lambert, and Mihaela Van Der Schaar. From real-world patient data to individualized treatment effects using machine learning: current and future methods to address underlying challenges. Clinical Pharmacology & Therapeutics, 109(1):87–100, 2021.
- Breiman (2001) Leo Breiman. Random forests. Machine learning, 45:5–32, 2001.
- Brookhart et al. (2006) M Alan Brookhart, Sebastian Schneeweiss, Kenneth J Rothman, Robert J Glynn, Jerry Avorn, and Til Stürmer. Variable selection for propensity score models. American journal of epidemiology, 163(12):1149–1156, 2006.
- Caron et al. (2022) Alberto Caron, Gianluca Baio, and Ioanna Manolopoulou. Estimating individual treatment effects using non-parametric regression models: A review. Journal of the Royal Statistical Society Series A: Statistics in Society, 185(3):1115–1149, 2022.
- Carrero et al. (2023) Juan Jesus Carrero, Edouard L Fu, Søren V Vestergaard, Simon Kok Jensen, Alessandro Gasparini, Viyaasan Mahalingasivam, Samira Bell, Henrik Birn, Uffe Heide-Jørgensen, Catherine M Clase, et al. Defining measures of kidney function in observational studies using routine health care data: methodological and reporting considerations. Kidney international, 103(1):53–69, 2023.
- Cartin-Ceba et al. (2012) Rodrigo Cartin-Ceba, Markos Kashiouris, Maria Plataki, Daryl J Kor, Ognjen Gajic, Edward T Casey, et al. Risk factors for development of acute kidney injury in critically ill patients: a systematic review and meta-analysis of observational studies. Critical care research and practice, 2012, 2012.
- Chipman et al. (2010) Hugh A. Chipman, Edward I. George, and Robert E. McCulloch. BART: Bayesian additive regression trees. The Annals of Applied Statistics, 4(1):266–298, 2010. 10.1214/09-AOAS285. URL https://doi.org/10.1214/09-AOAS285.
- De Bus et al. (2020) Liesbet De Bus, Pieter Depuydt, Johan Steen, Sofie Dhaese, Ken De Smet, Alexis Tabah, Murat Akova, Menino Osbert Cotta, Gennaro De Pascale, George Dimopoulos, et al. Antimicrobial de-escalation in the critically ill patient and assessment of clinical cure: the diana study. Intensive Care Medicine, 46(7):1404–1417, 2020.
- Ferri-García and Rueda (2020) Ramón Ferri-García and María del Mar Rueda. Propensity score adjustment using machine learning classification algorithms to control selection bias in online surveys. PloS one, 15(4):e0231500, 2020.
- Fu (2023) Edouard L Fu. Target trial emulation to improve causal inference from observational data: what, why, and how? Journal of the American Society of Nephrology, 34(8):1305–1314, 2023.
- Gray et al. (2022) Matthew P Gray, Erin F Barreto, Diana J Schreier, John A Kellum, Kangho Suh, Kianoush B Kashani, Andrew D Rule, and Sandra L Kane-Gill. Consensus obtained for the nephrotoxic potential of 167 drugs in adult critically ill patients using a modified delphi method. Drug Safety, 45(4):389–398, 2022.
- Greenland (1999) Sander Greenland. Relation of probability of causation to relative risk and doubling dose: a methodologic error that has become a social problem. American journal of public health, 89(8):1166–1169, 1999.
- Greenland and Robins (1988) Sander Greenland and James M Robins. Conceptual problems in the definition and interpretation of attributable fractions. American journal of epidemiology, 128(6):1185–1197, 1988.
- Gutman et al. (2022) Rom Gutman, Ehud Karavani, and Yishai Shimoni. Propensity score models are better when post-calibrated, 2022.
- Heckman et al. (1997) James J Heckman, Hidehiko Ichimura, and Petra E Todd. Matching as an econometric evaluation estimator: Evidence from evaluating a job training programme. The review of economic studies, 64(4):605–654, 1997.
- Hernán and Robins (2016) Miguel A Hernán and James M Robins. Using big data to emulate a target trial when a randomized trial is not available. American journal of epidemiology, 183(8):758–764, 2016.
- Hoffman et al. (2022) Katherine L Hoffman, Edward J Schenck, Michael J Satlin, William Whalen, Di Pan, Nicholas Williams, and Iván Díaz. Comparison of a target trial emulation framework vs cox regression to estimate the association of corticosteroids with covid-19 mortality. JAMA Network Open, 5(10):e2234425–e2234425, 2022.
- Imbens (2004) Guido W Imbens. Nonparametric estimation of average treatment effects under exogeneity: A review. Review of Economics and statistics, 86(1):4–29, 2004.
- Kan et al. (2022) Wei-Chih Kan, Yi-Chih Chen, Vin-Cent Wu, and Chih-Chung Shiao. Vancomycin-associated acute kidney injury: a narrative review from pathophysiology to clinical application. International Journal of Molecular Sciences, 23(4):2052, 2022.
- Kellum et al. (2012) John A Kellum, Norbert Lameire, Peter Aspelin, Rashad S Barsoum, Emmanuel A Burdmann, Stuart L Goldstein, Charles A Herzog, Michael Joannidis, Andreas Kribben, Andrew S Levey, et al. Kidney disease: improving global outcomes (kdigo) acute kidney injury work group. kdigo clinical practice guideline for acute kidney injury. Kidney international supplements, 2(1):1–138, 2012.
- Kim et al. (2022) Jee Yun Kim, Jeong Yee, Ha Young Yoon, Ji Min Han, and Hye Sun Gwak. Risk factors for vancomycin-associated acute kidney injury: A systematic review and meta-analysis. British Journal of Clinical Pharmacology, 88(9):3977–3989, 2022.
- Klopotowska et al. (2013a) Joanna E Klopotowska, Peter C Wierenga, Susanne M Smorenburg, Clementine CM Stuijt, Lambertus Arisz, Paul FM Kuks, Marcel GW Dijkgraaf, Loraine Lie-A-Huen, Sophia E de Rooij, and WINGS study group. Recognition of adverse drug events in older hospitalized medical patients. European journal of clinical pharmacology, 69:75–85, 2013a.
- Klopotowska et al. (2013b) Joanna E Klopotowska, Peter C Wierenga, Clementine CM Stuijt, Lambertus Arisz, Marcel GW Dijkgraaf, Paul FM Kuks, Henk Asscheman, Sophia E de Rooij, Loraine Lie-A-Huen, Susanne M Smorenburg, et al. Adverse drug events in older hospitalized patients: results and reliability of a comprehensive and structured identification strategy. PloS one, 8(8):e71045, 2013b.
- Künzel et al. (2019) Sören R Künzel, Jasjeet S Sekhon, Peter J Bickel, and Bin Yu. Metalearners for estimating heterogeneous treatment effects using machine learning. Proceedings of the national academy of sciences, 116(10):4156–4165, 2019.
- Mehta et al. (2015) Ravindra L Mehta, Linda Awdishu, Andrew Davenport, Patrick T Murray, Etienne Macedo, Jorge Cerda, Raj Chakaravarthi, Arthur L Holden, and Stuart L Goldstein. Phenotype standardization for drug-induced kidney disease. Kidney international, 88(2):226–234, 2015.
- Naranjo et al. (1981) Cláudio A Naranjo, Usoa Busto, Edward M Sellers, P Sandor, I Ruiz, EA Roberts, E Janecek, C Domecq, and DJ Greenblatt. A method for estimating the probability of adverse drug reactions. Clinical Pharmacology & Therapeutics, 30(2):239–245, 1981.
- Neugarten and Golestaneh (2018) Joel Neugarten and Ladan Golestaneh. Female sex reduces the risk of hospital-associated acute kidney injury: a meta-analysis. BMC nephrology, 19(1):1–11, 2018.
- O’Brien and Ishwaran (2019) Robert O’Brien and Hemant Ishwaran. A random forests quantile classifier for class imbalanced data. Pattern recognition, 90:232–249, 2019.
- Patrick et al. (2011) Amanda R Patrick, Sebastian Schneeweiss, M Alan Brookhart, Robert J Glynn, Kenneth J Rothman, Jerry Avorn, and Til Stürmer. The implications of propensity score variable selection strategies in pharmacoepidemiology: an empirical illustration. Pharmacoepidemiology and drug safety, 20(6):551–559, 2011.
- Perazella (2012) Mark A Perazella. Drug use and nephrotoxicity in the intensive care unit. Kidney international, 81(12):1172–1178, 2012.
- R Core Team et al. (2013) R R Core Team et al. R: A language and environment for statistical computing. 2013.
- Ray et al. (2016) Abhisekh Sinha Ray, Ammar Haikal, Kassem A Hammoud, and SL Alan. Vancomycin and the risk of aki: a systematic review and meta-analysis. Clinical journal of the American Society of Nephrology: CJASN, 11(12):2132, 2016.
- Robins and Greenland (1989) James Robins and Sander Greenland. The probability of causation under a stochastic model for individual risk. Biometrics, pages 1125–1138, 1989.
- Rubin (1980) Donald B Rubin. Randomization analysis of experimental data: The fisher randomization test comment. Journal of the American statistical association, 75(371):591–593, 1980.
- Schwarz and Heider (2019) Johanna Schwarz and Dominik Heider. Guess: projecting machine learning scores to well-calibrated probability estimates for clinical decision-making. Bioinformatics, 35(14):2458–2465, 2019.
- Suzuki et al. (2012) Etsuji Suzuki, Eiji Yamamoto, and Toshihide Tsuda. On the relations between excess fraction, attributable fraction, and etiologic fraction. American journal of epidemiology, 175(6):567–575, 2012.
- Tian and Pearl (2000) Jin Tian and Judea Pearl. Probabilities of causation: Bounds and identification. Annals of Mathematics and Artificial Intelligence, 28(1-4):287–313, 2000.
- van de Klundert et al. (2015) Nick van de Klundert, Rebecca Holman, Dave A Dongelmans, and Nicolette F de Keizer. Data resource profile: the dutch national intensive care evaluation (nice) registry of admissions to adult intensive care units. International journal of epidemiology, 44(6):1850–1850h, 2015.
- VanderWeele and Hernan (2013) Tyler J VanderWeele and Miguel A Hernan. Causal inference under multiple versions of treatment. Journal of causal inference, 1(1):1–20, 2013.
- Varallo et al. (2017) Fabiana Rossi Varallo, Cleopatra S Planeta, Maria Teresa Herdeiro, and Patricia de Carvalho Mastroianni. Imputation of adverse drug reactions: Causality assessment in hospitals. PloS one, 12(2):e0171470, 2017.
- WHO-UMC (2018) WHO-UMC. The use of the who-umc system for standardised case causality assessment, 2018. URL https://www.who.int/docs/default-source/medicines/pharmacovigilance/whocausality-assessment.pdf.
- Wiedermann et al. (2017) Christian J Wiedermann, Wolfgang Wiedermann, and Michael Joannidis. Causal relationship between hypoalbuminemia and acute kidney injury. World journal of nephrology, 6(4):176, 2017.
- Yasrebi-de Kom et al. (2023) Izak AR Yasrebi-de Kom, Dave A Dongelmans, Nicolette F de Keizer, Kitty J Jager, Martijn C Schut, Ameen Abu-Hanna, and Joanna E Klopotowska. Electronic health record-based prediction models for in-hospital adverse drug event diagnosis or prognosis: a systematic review. Journal of the American Medical Informatics Association, 30(5):978–988, 2023.
- Zhou et al. (2020) Yunji Zhou, Roland A Matsouaka, and Laine Thomas. Propensity score weighting under limited overlap and model misspecification. Statistical methods in medical research, 29(12):3721–3756, 2020.
- Zhu et al. (2021) Yaqian Zhu, Rebecca A Hubbard, Jessica Chubak, Jason Roy, and Nandita Mitra. Core concepts in pharmacoepidemiology: Violations of the positivity assumption in the causal analysis of observational data: Consequences and statistical approaches. Pharmacoepidemiology and drug safety, 30(11):1471–1485, 2021.
Appendix A Assumptions
We let be the counterfactual outcome that would have been observed under treatment . The assumptions are as follows:
The stable unit treatment value assumption. There are no multiple versions of the treatment within treatment indicators that could lead to different outcomes, and an individual’s outcome under treatment does not depend on the treatment assignment of other individuals. This assumption also includes the consistency assumption; the counterfactual outcome under an observed treatment is equal to the observed outcome under that treatment: (VanderWeele and Hernan, 2013; Rubin, 1980).
Weak positivity. Conditional on the covariates, the probability to receive the alternative option is nonzero: (Imbens, 2004).
Conditional ignorability for controls. Conditional on the covariates, for ICU admissions that received vancomycin, the counterfactual outcome under the alternative treatment is equal to the factual outcome of ICU admissions treated with the alternative treatment. In other words, the counterfactual outcome under the alternative treatment is independent of the treatment conditional on the covariates: . Note that this is a weaker version of the ‘regular’ conditional ignorability assumption, where one would assume the joint independence of the counterfactual outcomes and the treatment: (Imbens, 2004; Heckman et al., 1997).
Monotonicity. Conditional on the covariates, the relationship between the treatment and the outcome is monotonic. Additionally, vancomycin never prevents censoring events or competing risks compared to the alternative arm (Robins and Greenland, 1989; Suzuki et al., 2012).
Violations of one or multiple of the above assumptions would lead to upward or downward biased PClow estimates. If the conditional monotonicity assumption regarding the relationship between the treatment and the outcome is violated, the PClow estimates provide a worse lower bound as excess cases are compensated by prevented cases (Suzuki et al., 2012; Greenland and Robins, 1988; Greenland, 1999). If vancomycin prevents censoring events or competing risks compared to the alternative arm, the PClow may no longer be a lower bound and instead overestimate the PC. For example, if the alternative antibiotics would instantly lead to death for nearly all patients and vancomycin would not, nearly all AKI cases in the vancomycin arm would be excess cases, and the ERR would approach 1.
Appendix B Target Trial Emulation protocol
| Protocol component | Hypothetical trial | Main limitations of our observational data | Mitigations of limitations |
|---|---|---|---|
| Eligibility criteria | Adult, non-dialysis dependent AKI-free ICU admissions with a confirmed bacterial infection that is treatable with vancomycin or one of the following alternative antibiotics: Clindamycin, linezolid, teicoplanin, meropenem, cefazolin, daptomycin or metronidazole. | No data on infection type and susceptibility of bacteria to vancomycin or alternatives. Very few admissions received linezolid, teicoplanin or daptomycin. Limited data on pre-admission AKI. Number of admissions in ICU decreases over time, so lower counts of vancomycin and alternative initiations as length of stay increases. | Use different eligibility criteria: Adult, non-dialysis dependent AKI-free ICU admissions. In daily clinical practice, antibiotics are often started empirically, which means that the infection type and susceptibility of the bacteria is not yet known (it often takes 24 to 48 hours before this is known). |
| Exclusion criteria | Exclude admission if another treatment option is initiated after initiation of the main treatment. Exclude admission if treatment initiated in first 24 hours or after first 7 days of the ICU admission (see ‘Treatment strategies’, ‘Assignment procedures’ and ‘Eligibility criteria’ for motivations). | ||
| Treatment strategies | Initiate vancomycin or one of the alternatives at baseline (when eligibility criteria are met), and follow standard therapy procedures for the respective initiated antibiotic (e.g. until 48 hours post negative blood culture). | Some patients switched between the different treatment options. Treatment effect might depend on treatment effect in other admissions (e.g. due to antibiotic resistance). Within-treatment group treatments may not be consistent between similar admissions. | Exclude admission if another treatment option is initiated after initiation of the main treatment. Assume stable unit of treatment value (SUTVA) and consistency. |
| Assignment procedures | Randomized, non-blinded assignment into vancomycin or alternative treatment arms at baseline. | Assignment into vancomycin or alternative treatment arm not random, but based on admission characteristics. No data available on prevalent users. Unclear timing of some admission characteristics in the first 24 hours of the ICU admission (e.g. acute heart failure, APACHE IV mortality probability). Limited number of admissions within each arm. | Condition on the admission characteristics before treatment initiation and assume ignorability. Exclude admission if treatment is initiated within the first 24 hours of ICU admission. |
| Follow-up period | Follow up starts at initiation of vancomycin or alternative (at baseline) and ends at AKI diagnosis, loss to follow-up (i.e. discharge), death or 14 days after treatment initiation, whichever occurs first. | Serum creatinine (SCr) is a lagged indicator of AKI. AKI according to this indicator shortly after treatment initiation is likely not the result of the treatment. In the hypothetical trial this is not a problem given appropriate randomization, because baseline rates of AKI would then be equal across treatment arms. | |
| Outcome | AKI during ICU admission according to the KDIGO SCr or urine output (UO) criteria. | Relative SCr increase should be calculated using a historical SCr baseline, but not available in our data. UO data is incomplete, heterogeneous across ICUs and lacks resolution for applying KDIGO criteria (daily totals instead of 6 hour totals). Note that these limitations are common in studies utilizing retrospective EHR data (Carrero et al., 2023). | Use the first SCr in the first 24 hours of the ICU admission as the SCr baseline. Apply the UO data for the inclusion criteria to aid the recognition of pre-existing AKIs, but do not apply it to diagnose AKI during follow up as the data is too unreliable. |
| Causal contrasts of interest | Per protocol effect for vancomycin-treated cases with AKI conditioned on each admission’s characteristics; Conditional probability of AKI under factual vancomycin treatment () vs conditional probability of AKI under counterfactual alternative treatment (). From these two probabilities we calculate the excess-risk-ratio, which provides a lower bound of the probability of causation (PClow). | Positivity must be assessed to ascertain a nonzero probability of receiving an alternative treatment option. Additionally, for patients treated with vancomycin, there may not have been an effective treatment among the alternative antibiotics. | Assume weak positivity. Assume the alternative antibiotics include an effective alternative treatment. |
| Analysis plan | We estimate and using the T-learner causal inference approach. We utilize three different base learners: Bayesian additive regression trees, random forests and logistic regression. | Relations between the treatment and AKI may not be monotonic conditional on the patient characteristics (leading to an underestimation of the PClow) and vancomycin might prevent censoring events (discharge) or competing risks (death) (leading to an overestimation of the PClow). | Assume a monotonic relationship between treatment and AKI conditional on the admission characteristics, and assume vancomycin never prevents censoring events or competing risks. |
Appendix C Additional methods
This study is part of the project “Towards a leaRning mEdication Safety system in a national network of intensive Care Units—timely detection of adverse drug Events” (RESCUE). All analyses are conducted in R version 4.0.3 (R Core Team et al., 2013).
C.1 Data
From the NICE registry we obtain demographics, (chronic) comorbidities at ICU admission, Acute Physiology and Chronic Health Evaluation IV (APACHE IV) admission diagnoses and disease severity scores, physiology measurements and sequential organ failure assessment (SOFA) scores. Via direct data extractions from the 15 ICUs we additionally obtain timed-stamped drug administrations, laboratory findings, arterial blood pressure measurements and renal replacement therapy initiations.
C.2 Identification of potential confounders
We identify potential confounders using previous literature on AKI (Kellum et al., 2012; Perazella, 2012; Cartin-Ceba et al., 2012; Neugarten and Golestaneh, 2018; Wiedermann et al., 2017), and construct variables using our data where needed to optimally represent the confounders. We include the following variables: acute heart failure, burns, graft and transplant surgery, hypoalbuminemia, hypotension, hypovolemia, major surgery, mechanical ventilation, sepsis, trauma, age, sex, alcohol abuse, chronic carviovascular disease, chronic kidney disease, chronic pulmonary disease, diabetes mellitus, chronic liver disease, malignancy, obesity, the APACHE IV predicted mortality probability, serum creatinine (SCr) baseline and estimated glomerular filtration rate (eGFR). We additionally include longitudinally measured pre-baseline patient parameters, including the mean arterial blood pressure (MAP), urine output rate (UO), serum albumin, leukocyte count, temperature and SOFA scores. We summarize longitudinal values of the latter variables to one value by clinically relevant aggregation functions (e.g. the maximum SOFA score, see \appendixrefapd:fourth). Moreover, we calculate a variable specifying the time between ICU admission and the initiation of treatment. Lastly, we include nephrotoxic co-medications: we identify individual nephrotoxic drugs by their World Health Organization Anatomical Therapeutic Chemical (ATC) code in a recent consensus-based list of nephrotoxins in the ICU setting (Gray et al., 2022). We include all drugs associated with a nephrotoxicity rating of at least 0.5 (”possible”). For each of these nephrotoxins, we create a variable that indicates whether the ICU admission received the drug or not before or at baseline. In total, we include 107 variables, of which 77 are nephrotoxic drugs.
C.3 Missing data imputation
Missing data are imputed with the mean or median for continuous or categorical data, respectively. We do not impute the outcome.
C.4 Variable selection
We apply automated variable selection during each bootstrap iteration. First, binary variables with a prevalence of less than 2% are removed (Patrick et al., 2011). Second, we remove the longitudinally measured parameters and nephrotoxins with a univariable association with AKI with (Brookhart et al., 2006).
C.5 Model recalibration
The propensity score models and T-learner base learners are all recalibrated on the training data during each bootstrap iteration. We apply the recently developed GUESS recalibration algorithm (Schwarz and Heider, 2019).
C.6 Funding
This study was funded by The Netherlands Organization for Health Research and Development (ZonMw), project number 848018004. ZonMw had no role in the design of the study, the collection, analysis and interpretation of the data, or in writing the manuscript.
C.7 Ethics approval and patient consent
This study was exempted from requiring ethics approval (waiver W19_433 # 19.499) on 14 November 2019 by the Medical Ethics Committee of the Amsterdam University Medical Centers, location University of Amsterdam, The Netherlands, as it did not fall within the scope of the Dutch Medical Research Involving Human Subjects Act (WMO). Due to the large number of patients in our data, approaching all individuals to obtain informed consent would require an unreasonable effort. Under Dutch law, this study was therefore exempted from the requirement to obtain informed consent.
C.8 Data availability
The data is not publicly available due to the data sharing agreements with the participating ICUs. Access to the data might only be provided after explicit consent from each separate participating ICU. For conditions under which access is allowed, please see: https://uvaauas.figshare.com/articles/dataset/RESCUE_Metadata/22309996.
Appendix D Baseline characteristics
| Characteristic |
Alternative
(n = 856) |
Vancomycin
(n = 618) |
|
|---|---|---|---|
| Age (Years), median (Q1 - Q3) | 63.0 (53.0 - 73.0) | 66.0 (55.2 - 74.0) | |
| Male sex, No. (%) | 518 (60.5) | 374 (60.5) | |
| Planned admission, No. (%) | 94 (11.0) | 106 (17.2) | |
| Admission type | |||
| Medical, No. (%) | 630 (73.8) | 381 (61.7) | |
| Emergency surgical, No. (%) | 112 (13.1) | 124 (20.1) | |
| Elective surgical, No. (%) | 112 (13.1) | 113 (18.3) | |
| APACHE IV score, median (Q1 - Q3) | 52.5 (36.0 - 70.0) | 55.0 (44.0 - 70.0) | |
| APACHE IV mortality probability, median (Q1 - Q3) | 0.2 (0.1 - 0.4) | 0.2 (0.1 - 0.4) | |
| SCr baseline (mg/dL), median (Q1 - Q3) | 0.8 (0.7 - 1.2) | 0.9 (0.7 - 1.2) | |
| eGFR baseline (mL/min/1.73 m²), median (Q1 - Q3) | 82.5 (56.4 - 108.9) | 80.8 (56.4 - 107.7) | |
| Highest SCr during admission (g/dL), median (Q1 - Q3) | 0.9 (0.7 - 1.2) | 1.0 (0.7 - 1.2) | |
| Lowest urine output during admission (mL/kg/h), median (Q1 - Q3) | 0.9 (0.7 - 1.3) | 0.9 (0.7 - 1.3) | |
| Lowest serum albumin during admission (g/dL), median (Q1 - Q3) | 2.5 (2.1 - 2.7) | 2.4 (1.8 - 2.7) | |
| Lowest MAP during admission (mmHg), median (Q1 - Q3) | 59.0 (51.0 - 62.0) | 57.0 (50.0 - 62.0) | |
| Highest SOFA score during admission, median (Q1 - Q3) | 7.0 (5.0 - 9.0) | 8.0 (6.0 - 10.0) | |
| Highest temperature during admission (°C), median (Q1 - Q3) | 38.0 (37.9 - 38.8) | 38.2 (38.0 - 39.3) | |
| Highest leukocyte count during admission (10**9 cells/L), median (Q1 - Q3) | 15.6 (11.6 - 21.4) | 16.8 (11.6 - 23.0) | |
| Acute AKI risk factors | |||
| Acute heart failure, No. (%) | 114 (13.3) | 87 (14.1) | |
| Burns, No. (%) | 1 (0.1) | 0 (0.0) | |
| Graft or transplant surgery, No. (%) | 45 (5.3) | 53 (8.6) | |
| Hypoalbuminemia, No. (%) | 699 (81.7) | 525 (85.0) | |
| Hypotension, No. (%) | 223 (26.1) | 201 (32.5) | |
| Hypovolemia, No. (%) | 22 (2.6) | 13 (2.1) | |
| Major surgery, No. (%) | 209 (24.4) | 198 (32.0) | |
| Mechanical ventilation, No. (%) | 542 (63.3) | 470 (76.1) | |
| Sepsis - admission diagnosis, No. (%) | 112 (13.1) | 93 (15.0) | |
| Sepsis - longitudinal, No. (%) | 273 (31.9) | 239 (38.7) | |
| Trauma, No. (%) | 97 (11.3) | 14 (2.3) | |
| Chronic AKI risk factors | |||
| Alcohol abuse, No. (%) | 191 (22.3) | 141 (22.8) | |
| Cardiovascular disease, No. (%) | 232 (27.1) | 161 (26.1) | |
| Chronic kidney disease, No. (%) | 18 (2.1) | 19 (3.1) | |
| Chronic pulmonary disease, No. (%) | 154 (18.0) | 78 (12.6) | |
| Diabetes mellitus, No. (%) | 135 (15.8) | 97 (15.7) | |
| Liver disease, No. (%) | 14 (1.6) | 10 (1.6) | |
| Malignancy, No. (%) | 115 (13.4) | 104 (16.8) | |
| Obesity, No. (%) | 114 (13.3) | 103 (16.7) | |
| Nephrotoxin exposure | |||
| J01GB03 - Gentamicin, No. (%) | 123 (14.4) | 95 (15.4) | |
| J05AB01 - Aciclovir, No. (%) | 11 (1.3) | 22 (3.6) | |
| J01DC02 - Cefuroxime, No. (%) | 55 (6.4) | 109 (17.6) | |
| J01DD02 - Ceftazidime, No. (%) | 25 (2.9) | 45 (7.3) | |
| J01MA02 - Ciprofloxacin, No. (%) | 131 (15.3) | 160 (25.9) | |
| J01CR02 - Amoxicillin And Beta-Lactamase Inhibitor, No. (%) | 84 (9.8) | 42 (6.8) | |
| J01CR05 - Piperacillin And Beta-Lactamase Inhibitor, No. (%) | 45 (5.3) | 40 (6.5) | |
| S01EC01 - Acetazolamide, No. (%) | 37 (4.3) | 33 (5.3) | |
| C03CA01 - Furosemide, No. (%) | 284 (33.2) | 342 (55.3) | |
| N01AH03 - Sufentanil, No. (%) | 173 (20.2) | 143 (23.1) | |
| J01CF05 - Flucloxacillin, No. (%) | 43 (5.0) | 24 (3.9) | |
| J01CE01 - Benzylpenicillin, No. (%) | 20 (2.3) | 15 (2.4) | |
| A02BC05 - Esomeprazole, No. (%) | 154 (18.0) | 125 (20.2) | |
| J01EE01 - Sulfamethoxazole And Trimethoprim, No. (%) | 28 (3.3) | 38 (6.1) | |
| Time in ICU before initiation (Days), median (Q1 - Q3) | 1.9 (1.4 - 3.2) | 2.6 (1.7 - 4.2) | |
| AKI, No. (%) | 124 (14.5) | 135 (21.8) | |
| AKI stage | |||
| Stage 1, No. (%) | 76 (61.3) | 85 (63.0) | |
| Stage 2, No. (%) | 17 (13.7) | 18 (13.3) | |
| Stage 3, No. (%) | 31 (25.0) | 32 (23.7) | |
| RRT, No. (%) | 26 (21.0) | 23 (17.0) | |
| Length of stay (Days), median (Q1 - Q3) | 5.9 (3.4 - 10.2) | 8.1 (4.8 - 16.1) | |
| ICU mortality, No. (%) | 101 (11.8) | 93 (15.0) | |
| Hospital mortality, No. (%) | 149 (17.4) | 138 (22.3) |
Appendix E ATT estimates
tab:att AKI risk alternative AKI risk vancomycin ARD RR Unadjusted 0.15 (0.12 - 0.20) 0.22 (0.15 - 0.28) 0.07 (0.01 - 0.12) 1.44 (1.07 - 1.83) T-learner - BART 0.19 (0.14 - 0.26) 0.22 (0.15 - 0.28) 0.03 (-0.02 - 0.08) 1.16 (0.90 - 1.48) T-learner - RF 0.16 (0.11 - 0.24) 0.22 (0.15 - 0.28) 0.06 (0.00 - 0.10) 1.34 (1.03 - 1.77) T-learner - LR 0.18 (0.14 - 0.26) 0.22 (0.16 - 0.32) 0.03 (-0.01 - 0.12) 1.19 (0.94 - 1.68) IPTW - BART 0.19 (0.14 - 0.27) 0.22 (0.15 - 0.28) 0.03 (-0.04 - 0.08) 1.14 (0.85 - 1.52) IPTW - RF 0.19 (0.12 - 0.45) 0.22 (0.15 - 0.28) 0.03 (-0.23 - 0.09) 1.17 (0.59 - 2.27) IPTW - LR 0.18 (0.13 - 0.25) 0.22 (0.15 - 0.28) 0.03 (-0.02 - 0.09) 1.18 (0.91 - 1.55)
Appendix F Factual AKI prediction evaluation
predictions by the T-learner base models
| T-learner base model | AUC |
|---|---|
| Vancomycin - BART | 0.75 (0.52 - 0.86) |
| Vancomycin - RF | 0.72 (0.59 - 0.84) |
| Vancomycin - LR | 0.71 (0.50 - 0.84) |
| Alternative - BART | 0.74 (0.59 - 0.82) |
| Alternative - RF | 0.73 (0.62 - 0.83) |
| Alternative - LR | 0.72 (0.51 - 0.81) |
Appendix G Propensity score distributions
fig:prop
Appendix H Correlations between the T-learners’ predictions
predictions for the test set’s ICU admissions that
received vancomycin and subsequently developed AKI
(Pearson correlation coefficient)
| BART | RF | LR | |
|---|---|---|---|
| BART | 1 | ||
| RF | 0.55 (0.10 - 0.86) | 1 | |
| LR | 0.71 (0.19 - 0.93) | 0.44 (-0.08 - 0.78) | 1 |