XplainLLM: A QA Explanation Dataset for Understanding LLM Decision-Making
Abstract
Large Language Models (LLMs) have recently made impressive strides in natural language understanding tasks. Despite their remarkable performance, understanding their decision-making process remains a big challenge. In this paper, we look into bringing some transparency to this process by introducing a new explanation dataset for question answering (QA) tasks that integrates knowledge graphs (KGs) in a novel way. Our dataset includes 12,102 question-answer-explanation (QAE) triples. Each explanation in the dataset links the LLM’s reasoning to entities and relations in the KGs. The explanation component includes a why-choose explanation, a why-not-choose explanation, and a set of reason-elements that underlie the LLM’s decision. We leverage KGs and graph attention networks (GAT) to find the reason-elements and transform them into why-choose and why-not-choose explanations that are comprehensible to humans. Through quantitative and qualitative evaluations, we demonstrate the potential of our dataset to improve the in-context learning of LLMs, and enhance their interpretability and explainability. Our work contributes to the field of explainable AI by enabling a deeper understanding of the LLMs decision-making process to make them more transparent and thereby, potentially more reliable, to researchers and practitioners alike. Our dataset is available at: https://github.com/chen-zichen/XplainLLM_dataset.git
1 Introduction
Large Language Models (LLMs) (Kenton and Toutanova, 2019; Liu et al., 2019; Brown et al., 2020; Anil et al., 2023) have significantly influenced Natural Language Understanding (NLU) (Liu et al., 2021, 2023), leading to performance improvements in various tasks. As these models continue to make progress, it is important to understand the rationale behind their decision-making (Arrieta et al., 2020). A deeper comprehension of the LLM decision-making process is crucial to fostering trust in their predictions, enabling the design of more robust and reliable AI systems for end users.
Development of explainable AI (XAI) as an area of research has seen the emergence of a number of methods that seek to explain the decision-making processes of machine learning models. Such methods span from local explanation techniques such as LIME (Ribeiro et al., 2016) and SHAP (Lundberg and Lee, 2017), to global explanation strategies such as feature importance (Casalicchio et al., 2019). Despite substantial progress in explaining machine learning models, these methods under-perform when deployed for LLMs, particularly in complex tasks such as question-answering (QA), making the output difficult for humans to understand. The inherent complication and lack of transparency in LLMs (Wu et al., 2022), combined with context-rich commonsense reasoning, necessitates constructing more human-understandable and comprehensive explanations to faithfully interpret their predictions.
Current explanation methods for LLMs primarily focus on attention mechanisms (Clark et al., 2019; Bills et al., 2023) and feature-based interpretations (Jacovi et al., 2021). The former approach bases the explanations on self-attention weights in models like BERT (Kenton and Toutanova, 2019) and GPT-2 (Radford et al., 2019), and deduces correlations between input tokens and the model’s predictions. However, the relationships highlighted in these generated explanations are difficult to understand for humans. Moreover, attention can be difficult to interpret due to the typically complex inter-layer interactions, and may not align the relative importance of tokens in the model’s reasoning process (Hahn, 2020; Sajjad et al., 2022). Feature-based explanation methods, in contrast, aim to quantify the contribution of individual features or tokens to the model output, but they fail to capture the wider context and relations that are fundamental to understanding the model’s reasoning (Molnar et al., 2022).
We introduce XplainLLM, a dataset that addresses the growing need for transparency, explainability, and understandability in the decision-making processes of LLMs. By integrating knowledge graphs (KGs) and graph attention networks (GAT) (Veličković et al., 2018), our dataset provides a human-understandable explanation of LLM decision-making in QA tasks. We link the LLM reasoning process to the entities and relations within KGs to help provide an intuitive and interpretable representation of the LLM’s decision-making process. Through the linked connections, researchers can gain deeper insights into the underlying rationale for predictions. Our process can also help facilitate model tuning, debugging, robustness evaluation and demonstration in in-context learning. XplainLLM includes 12,102 question-answer-explanation (QAE) triples and aims to drive improvements in both the performance and explainability of LLMs. Our evaluation shows that LLMs with explanations enhance performance by an average of 2.4% when decision-making knowledge is transferred between LLMs. LLMs with explanations outperform the benchmark, with a performance gap extending to 17%. The overall quality of explanations achieves an average score of 0.87/1 by human evaluators, and an average of 0.89/1 by automated evaluators.
Contributions and significance of the dataset In this paper, we make several key contributions to the field of explainable AI for LLMs:
-
•
Bridging the Gap with Natural Language: To the best of our knowledge, XplainLLM is the first dataset to capture the most influential elements behind the model reasoning and present the decision-making process through human-understandable explanations. Our dataset extends beyond merely explaining the “why”; we emphasize the “why not”, introducing a novel paradigm in transparent AI explainability.
-
•
Comprehensive Understanding of Model Reasoning: XplainLLM incorporates reason-elements from KGs, top-ranked reason-elements, why-choose and why-not-choose explanations. The goal is to empower the community to delve deeper into the decision-making dynamics of LLMs. This work contributes to enhancing the knowledge and the transparency of LLM reasoning.
-
•
Aligning Human Understanding and Model Explainability: XplainLLM organizes the decision-influencing elements into coherent natural language sentences. Our explanations can be used in reinforcement learning from human feedback (RLHF) (Christiano et al., 2017), to support related research. We evaluate the quality of our explanations through both automated and human evaluations, and the results underscore our dataset’s quality on multiple metrics.
2 Related Work
Reasoning in LLMs
XAI aims to address the issue of interpreting the outcomes of language models (Li et al., 2023; Wiegreffe et al., 2021; Madsen et al., 2022). One of its goals is to generate explanations that enable humans to easily understand the decision-making process. Zelikman et al. (2022) introduce a method that iteratively generates the rationales step-by-step. Huang et al. utilize the chain-of-thought (CoT) to find the rationale and apply the reasoning capabilities of LLMs to robotic planning tasks. However, these explanations are inherently constrained in capturing prompt-specific reasoning, limiting generalization to out-of-distribution scenarios and potentially missing the decision-making process that our work focuses on.
Another goal is focused on explaining in a trustworthy way. Rajani et al. (2019a) introduces an explainable factor to minimize the risk of unreasonable explanation generation. Chen et al. (2021) integrate the external knowledge to generate why and why-not counterfactual explanations. Zelikman et al. (2022) apply self-checker mechanism to ensure trusted rationals. However, these methods, while enhancing performance or providing external explanations, fail to accurately capture the core reasoning of LLMs. In contrast, our work enhances LLM trustworthiness and deepens human understanding of its decision-making, improving the potential in end-user applications.
Explanation Datasets
The explainable datasets for language models can be categorized into three types (Wiegreffe and Marasovic, 2021): (1) highlights: provide input elements such as words and phrases, as explanations to a predicted output (Camburu et al., 2018; DeYoung et al., 2020; Yin et al., 2021; Bills et al., 2023); (2) free-text explanations: provide readable textual explanations in words or sentences (Rajani et al., 2019b; Sap et al., 2020; Brahman et al., 2021); (3) structured explanations: provide natural language explanation but are constrained by the explanation writing process (Aggarwal et al., 2021; Jhamtani and Clark, 2020; Inoue et al., 2020). Different from these, our explanation incorporates highlighted elements and guided instruction to generate a free-text explanation. This unique combination can enhance both the trustworthiness and comprehensiveness of the content. We present a comparison with prevalent explanation datasets ((Rajani et al., 2019b; Aggarwal et al., 2021; Bills et al., 2023)) in Table 1.
| Dataset | Size | Answer Format | Expl. Format | Source | Model Match? | Self-Explanatory? | "Why Not" Included? |
|---|---|---|---|---|---|---|---|
| CoS-E | 9,500 | MC | NL | Human | |||
| ECQA | 10,962 | MC | NL | Human | |||
| Neuron | 307,200 | Neuron | NL + Score | Model | |||
| XplainLLM | 12,102 | MC | NL | Model |
3 Methodology
We choose QA as the context for studying the decision-making process of LLMs, as questions facilitate an intuitive understanding of tasks and models. Given a pre-trained LLM , our input content includes question and a set of possible answer choices . We denote the answer chosen by the with . Our goal is to find an explanation for why chooses a certain answer, and an explanation for why does not choose the other options.
We introduce a GAT-based method to explain the decision-making process of . We first tokenize the combined sequence of and into a content elements set , where is the number of elements. Consider a graph with layers , and nodes , where denotes the number of layers and represents the node count. The nodes and edges are constructed by pruning the retrieved sub-graph from the KG, guided by the input content. We integrate and for the final decision. Through a GAT model , we obtain the decision representations and convert them into meaningful, human-understandable explanations. We delve into each step in the subsequent sections.
3.1 Explainer Model
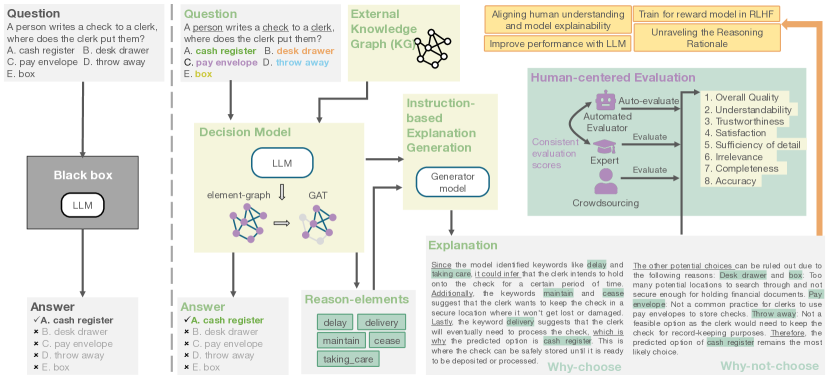
Our explainer model makes novel use of retrieved KG and GAT. Its architecture is illustrated in Figure 1, and consists of three major stages: (a) graph construction, (b) decision interpretation, and (c) controlled explanation generation. In this paper, interpretation refers to understanding of the model’s weights by humans, e.g., attentions of concrete nodes or elements, or the weights in the model. Explanation refers to explaining the model’s decision-making process in a manner comprehensible to humans.
Graph Construction. To capture the pivotal components that impact the reasoning of , we construct a multi-relational graph, which fuses knowledge of and . Given the input and , we follow (Yasunaga et al., 2021) to construct this graph, yielding an element-graph . We begin with question entities and answer entities , both subsets of , indicating their respective nodes can be located within . The is initially extracted from a KG, guided by and , and includes -hop neighbors. Subsequently, is pruned based on the relevance score to yield . Algorithm 1 (Appendix A.1) presents this procedure. serves as a compact and informative representation of the important elements and relations in the decision-making process.
Decision Interpretation. Given the , we use GAT model to obtain the representation of the decision-making process. Consider any node in , its neighboring nodes are denoted by , with a specific neighbor as . Each node has a feature-embedding at layer , representing its semantic features.
The feature-embedding of is computed by the relevance score and three kinds of node embeddings: (1) node type-embeddings ; (2) node feature-embeddings ; and (3) relation-embeddings . The is calculated as following:
| (1) |
where is the attention mechanism, is the message passing from . The is used to discern the critical connections in the decision-making process during the aggregation of message passing, following the approach in (Veličković et al., 2018). The is calculated as following:
| (2) |
The updated node features at the final layer of the are considered as the final representations for major reasoning. Further details of , , and can be found in Appendix B.2.
In the learning and inference stage, the probability of selecting an answer is defined as , where . Here, represents the attention-based pooling of , and denotes the embedding from . The representation of node serves as a depiction of the decision-making process. We identify as the reason-elements for the later explanation generation.
Controlled Explanation Generation. After obtaining the reason-elements, they are converted to human-understandable explanations by (1) extracting key reason-elements and (2) generating explanations through instructions.
(1) We use the input content , predicted answer of , the reason-elements , and attentions to identify explanation-critical nodes. The top nodes, ranked by , are selected and identified as key reason-elements set .
(2) We use to guide the generation of precise and human-understandable explanations. We introduce the generator model , which imposes a structured format on the explanations: (1) a why-choose part and (2) a why-not-choose part. The explanations provide the reasoning of , detailing why specific choices were made and others dismissed. The structures are defined as follows:
where , , , , , and are the predefined structure guiding the generation process. Additional details are elaborated in Appendix E.5.3.
3.2 Data Preparation
The selection of and the dataset plays an important role in studying the decision-making process of LLM. Ideally, we hope our dataset to mirror common daily usage, helping the XAI community in fostering future trust between humans and AI. As the first dataset explaining LLM decision-making process in a human-understandable way, we commence our study from a foundational LLM.
The input question and answer choices are from the CommonsenseQA dataset (Talmor et al., 2019). CommonsenseQA is a dataset about commonsense questions, sourced from human queries. We use RoBERTa-Large (Liu et al., 2019) as our , fine-tuning it on the official training set of CommonsenseQA. Given its foundational role in the LLM family (Zhou et al., 2023), understanding its reasoning process is valuable. We utilize ConceptNet (Speer et al., 2017) as our KG to obtain . This KG captures commonsense concepts and their interrelations. Our is structured as a 5-layer GNN model, and for , we leverage GPT-3.5-turbo (Ouyang et al., 2022) to provide a natural language explanation in a sentence or a paragraph. To ensure the quality of our dataset, we conduct a post-generation evaluation. All explanations undergo human review. Human evaluators identify inaccuracies, and any discrepancies in explanations, and return to for refinement. This procedure mitigates potential issues from model-generated explanations, guaranteeing clarity and relevance aligned with human understanding. Further experimental specifics and data collection procedures are provided in the Appendix E.5.1 and E.5.2.
3.3 Dataset Description
Schema. XplainLLM contains fields that correspond to the QA pair, the model’s predicted answer, the ground-truth label, and an explanation set.
Explanations Set. The explanation set includes a set of 50 reason-elements , e.g., words or phrases, sorted by attentions, a set of top-5 reason-elements , a why-choose explanation in free-text form, and a why-not-choose explanation also in free-text form. An example instance is shown in Appendix D.4.
Statistics. XplainLLM includes 12,102 instances of explanations, split according to the official CommonsenseQA’s partitioning into three sets: the training, development (dev), and testing sets. The average word count of and are 59.92 and 59.48 respectively, resulting in an aggregate count of approximately 119.39 words per whole explanation. A more detailed breakdown of the average word count is provided in Table 2. Additional statistics can be found in Appendix C.3.
Limitations. Committed to transparency and rigorous analysis, we acknowledge potential limitations in our dataset. Since our is originally derived from , any inherent limitations or inaccuracies within could influence the quality of our explanations. Additionally, using different might yield variations.
| Why-choose | Why-not-choose | Whole Explanation | |
|---|---|---|---|
| Overall | 59.92 | 59.48 | 119.39 |
| Training Set | 59.79 | 59.41 | 119.20 |
| Dev Set | 59.47 | 58.51 | 117.98 |
| Testing Set | 61.36 | 60.97 | 122.32 |
| #Examples | Cat. (1) | Cat. (2) | Cat. (3) | Cat. (4) | |
|---|---|---|---|---|---|
| Overall | 100 | 69.0% | 12.0% | 31.0% | 4.0% |
| CP | 74 | 71.6% | 10.8% | 27.0% | 1.3% |
| IP | 26 | 61.5% | 15.4% | 42.4% | 11.5% |
Categorization. To evaluate the limitations and enhance comprehension of XplainLLM for future applications, we classify the data into four categories according to the explanation set: (1) is effective for explanation generation; (2) additional knowledge is used in explanation generation; (3) is irrelevant in explanation generation; and (4) or indicates an incorrect . Table 3 presents the percentage distribution of the 4 categories among 100 examples randomly sampled from the testing set of XplainLLM, along with statistics for correct predicted answers (CP) and incorrect predicted answers (IP). Note that each example may fall into multiple categories. The percentage of Cat.(3) is lower for CP examples compared to IP examples, indicating the contribution of to the prediction performance. Additionally, Cat.(4) shows a similar distribution of real distribution, demonstrating the effectiveness of in improving model performance.
4 Experiments and Evaluation
4.1 Task Settings and Models
We demonstrate the XplainLLM dataset on two tasks: Task 1 (human-centered evaluation) - evaluating explanation quality, and Task 2 (objective evaluation) - transferring explanation knowledge in LLMs. Our baseline task is QA with no explanation.
Task 1: Evaluating Explanation Quality. Input = , Output = .
In this task, we engaged three human experts to evaluate the quality of explanations. Each expert has a graduate-level education (taught in English) and at least three years of research experience in natural language processing (NLP). Additionally, we conducted evaluations with 50 general users through crowdsourcing platforms to gauge their perception of the explanations and understand the potential significance of the explanations in future human-centric applications. Specifically, we utilized the Prolific platform (https://www.prolific.com) for these evaluations. Our participant pool was gender-balanced, comprised of native English speakers with at least a high school education. To mitigate human bias in evaluations, we adhered to the methodology outlined by (Hoffman et al., 2018). We provided detailed instructions and examples to participants, to ensure consistent rating standards. Details of these materials can be found in Appendix F.6. Inspired by EVAL111Evals is a framework introduced by OpenAI, designed for the automated evaluation of LLMs: https://github.com/openai/evals. , we introduce automated evaluator model as complement to this task. We select two automated evaluators, GPT-3.5-turbo and GPT-4, given their superior human-like comprehension and linguistic capabilities. Their evaluation settings are the same as humans, provided with , , , , , along with instructions and examples. The output is a set of normalized scores, standardized to maintain consistent rating standards across various metrics. For a specific score based on evaluation metric is computed as follows:
| (3) |
| (4) |
where is an original score given by or humans, is a normalization function, is the rating scale, and is the metric type. Specifically, implies a higher score indicates better performance, whereas suggests a lower score is preferable. In our study, the rating scale bounds are given by and .
Task 2: Transferring Explanation Knowledge in LLMs. Input = , Output = .
In this task, we investigate the potential of transferring explanation knowledge to improve the performance of other LLMs, denoted as . Given the , and , is to identify the correct answer choice . The task seeks to find
| (5) |
where is the probability of answer choice. The goal is to evaluate if the inclusion of decision-making explanations can enhance the accuracy of ’s answers. While models like GPT-3.5 are powerful in many tasks, they may fail in commonsense questions compared to the supervised models (Khashabi et al., 2020; Yasunaga et al., 2021; Zhang et al., 2022a). We evaluate under three settings: vanilla, CoT, and self-consistency (Wang et al., 2022). The vanilla approach processes QA pairs directly. In contrast, CoT leverages examples with human-labeled reasoning steps, and the self-consistency approach employs a majority voting strategy. For this task, we utilize GPT-3.5-turbo as our .
Baseline Task: Question Answering without Explanation. Input = , Output = .
In this task, we explore the capabilities of LLMs in a pure QA task. The input only consists of and . The LLM then produces a predicted answer . The problem is formulated as follows:
| (6) |
We use GPT-3.5, BLOOM 176B (Scao et al., 2022), GPT-NeoX (Black et al., 2022), Bloomberg GPT (Wu et al., 2023), and OPT 66B (Zhang et al., 2022b) as in this task.
4.2 Evaluation Metrics
We evaluate the quality of explanations from both human and objective perspectives. Our goal is a comprehensive and fair evaluation. We aim to present a thorough and fair evaluation of the explanations. These dual perspectives help us discern the strengths and weaknesses of the explanations, guiding potential directions for their improvement.
Human-centered Metrics. (Task 1) We follow (Hoffman et al., 2018) to measure the quality and relevance of the explanations. Each explanation is presented with eight evaluative questions, representing distinct evaluation dimensions. Our human-centered evaluation metrics encompass: overall quality, understandability, trustworthiness, satisfaction, detail sufficiency, irrelevance, completeness, and accuracy. Detailed definitions and the specific survey questions are provided in the Appendix F.6.2 and F.6.1. Evaluators allocate scores to these questions using a three-point Likert scale: 1 (disagree), 2 (neutral), and 3 (agree). Subsequently, scores are normalized by to the range [0, 1]. Higher scores suggest better quality.
Objective Metrics. (Task 2, Baseline Task) We use model accuracy, a foundational metric of performance, to evaluate the ability of LLMs or in selecting the correct answers. Accuracy is determined by the ratio of questions where the model’s selected answer aligns with the ground truth. A higher accuracy implies that the model is more capable of choosing the correct answer among alternatives.
5 Results and Discussion
5.1 Human-centered Evaluation
We conducted human-centered evaluations to go beyond the technical evaluation of the explanations and see how they are rated by humans, to determine potential for use in future human-centered applications. In this evaluation, participants were asked to evaluate a set of 20 QAE triples, randomly selected from our dataset.
5.1.1 Expert and Automated Evaluation
In this evaluation, the feedback from human experts highlighted the distinctiveness of our explanations compared to previous methods. One expert remarked, "In comparison to prior explanations, these explanations provide a more intuitive understanding of the model’s decision-making process. The explanations are cogent, and even in instances of erroneous predictions, the underlying reasoning remains transparent and comprehensible." This feedback underscores the clarity and transparency of our explanations.
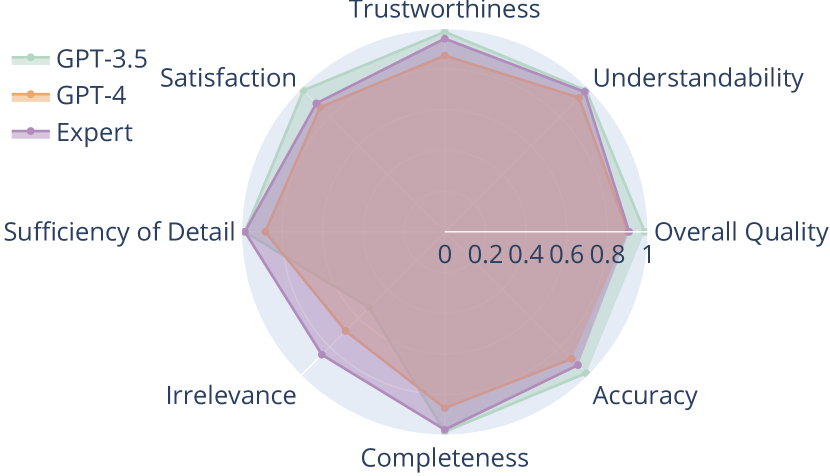
The detailed scores provided by human experts are shown in Table 4. Across eight evaluation metrics, the explanations received an impressive average score of 0.93. Notably, the metrics of “understandability” and “completeness” garnered the highest average scores, reflecting the success of our approach in delivering human-understandable insights into the LLM’s decision-making process. However, it’s worth noting that the metric of “irrelevance” received a slightly lower score of 0.85, suggesting that there might be instances where our explanations include some irrelevant details. This is an area we aim to refine in the future work.
| Overall Quality | Understandability | Trustworthiness | Satisfaction | Sufficiency of detail | Irrelevance | Completeness | Accuracy | |
|---|---|---|---|---|---|---|---|---|
| GPT-3.5 | 0.98 | 0.98 | 0.98 | 0.98 | 0.98 | 0.53 | 0.98 | 0.98 |
| GPT-4 | 0.90 | 0.93 | 0.87 | 0.87 | 0.88 | 0.69 | 0.87 | 0.88 |
| Human Expert | 0.91 | 0.97 | 0.95 | 0.89 | 0.98 | 0.85 | 0.97 | 0.93 |
| Expert - GPT-3.5 | Expert - GPT-4 | GPT-3.5 - GPT-4 | |
| 0.70 | 0.60 | 0.66 |
The automated evaluator follows in-context learning to simulate human expert evaluation. Both GPT-3.5 and GPT-4 demonstrated a commendable ability to discern the quality of explanations. The results show in Table 4 and Figure 2. Notably, the performance of these automated evaluators aligns closely with human expert evaluations across most dimensions.
Further insights into the human-like understanding of automated evaluators and their assessment of explanations are detailed in Table 5. This data shows a significant agreement between the automated evaluators and human experts. The scores assigned by correlate with those given by human experts, underscoring ’s adeptness in evaluating explanations. Such findings further support the credibility and value of our explanations.
5.1.2 Crowdsourcing Evaluation
The average scores from crowdsourcing on eight metrics are shown in Figure 3. We show the average score of the overall explanations, explanations for correct predictions (CP), and explanations for incorrect predictions (IP). The detailed analysis is shown below.
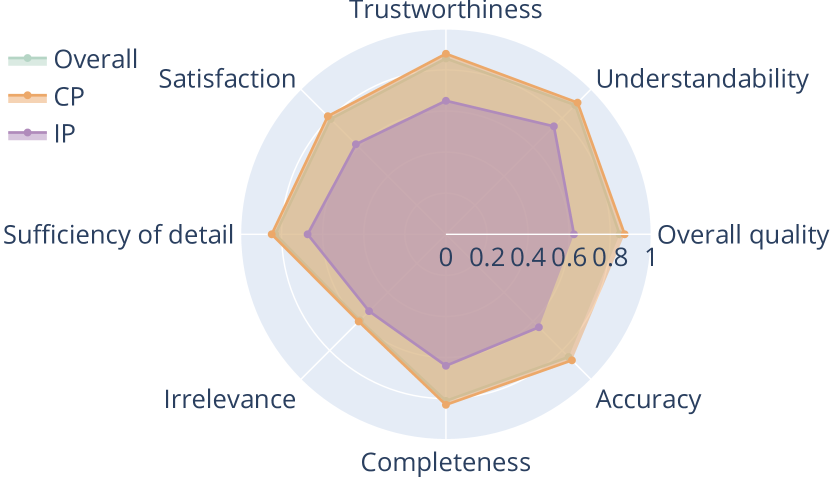
Participants rated our explanations with a high average score of 0.87 for overall quality, suggesting a favorable perception. As this score is closer to the maximum, it underscores the above-average quality of our explanations and highlights the efficacy of our method in clarifying the decision-making process of LLMs.
Our explanations achieved an average understandability score of 0.89, indicating a high level of clarity for participants. A variance score of 0.26 suggests consistent comprehension. However, a deeper dive reveals a disparity based on the LLM’s prediction accuracy. Correct predictions (CP) had a strong average score of 0.91 and a variance of 0.26, underscoring their clarity. In contrast, incorrect predictions (IP) had a lower average of 0.74 and a variance of 0.65, suggesting they were less clear and elicited more varied responses from participants.
Our explanations exhibited notable trustworthiness, averaging a score of 0.88 in CP. We also examined the correlation between trustworthiness and understandability. A Pearson coefficient of 0.71 indicates a strong positive relationship, suggesting that as participants better understood the explanations, their trust in the LLM’s output correspondingly increased.
Participants expressed broad satisfaction with our explanations, with 86% indicating they met or surpassed expectations. A notable 97.36% of explanations were deemed to have sufficient detail. While a minor 4.54% were viewed as containing irrelevant details, the majority consensus underscored the focus and relevance of our explanations.
Our completeness received an average score of 0.81, suggesting overall satisfactory coverage. Notably, the median score was the maximum of 1, meaning over half of participants deemed our explanations entirely complete. This split might reflect differences in evaluators’ AI backgrounds or occasional oversimplification by the model.
Our explanations achieved an accuracy score of 0.84, reflecting a positive perception. However, a deeper dive reveals a disparity: explanations for correct predictions (CP) scored 0.87, while incorrect predictions (IP) averaged 0.64. This highlights that the LLM’s prediction accuracy significantly influences explanation accuracy. Furthermore, a Pearson correlation of 0.68 between accuracy and trustworthiness suggests that more accurate explanations are deemed more trustworthy.
Crowdsourcing evaluations provide a robust validation of our explanations. The positive feedback highlights the effectiveness of our approach in conveying the complexities of the LLM’s decision-making in a manner that is clear, trustworthy, and satisfying to humans.
5.2 Objective Evaluation
| Accuracy | GPT-3.5 |
|
Improvement |
|
||||
|---|---|---|---|---|---|---|---|---|
| Vanilla | 72.3% | 75.0% | 2.7% | 77.3% | ||||
| CoT | 73.7% | 75.9% | 2.2% | —— | ||||
| Self-consistency | 75.2% | 77.4% | 2.2% | —— |
We introduce explanations representing the decision-making process of a LLM, as additional context to the evaluation LLMs. captures the reasoning behind selecting certain answers. We conducted the evaluation using the zero-shot setting.
We demonstrate the results in Table 6. When evaluating the impact of incorporating explanations, we observe substantial gains in model accuracy. Specifically, we note enhancements of 2.7%, 2.2%, and 2.2% under the vanilla, CoT, and self-consistency settings respectively. This increase is an indication that the understanding of decision-making processes can be effectively transferred between language models. We also compare the evaluation model with our fine-tuned KG+LM model (as shown in Figure 1). LLMs with explanations exhibit competitive performance compared to the fine-tuned KG+LM model, even within zero-shot settings. As demonstrated in the baseline benchmark (Table 7), LLMs with explanations outperform others, with an advantage reaching up to 17%.
| GPT-3.5 | GPT-NeoX | Bloomberg GPT | ||||
|---|---|---|---|---|---|---|
| Acc. | 72.3% | 64.2% | 60.4% | 65.5% | 66.4% | |
|
5.1% | 13.2% | 17.0% | 11.9% | 11.0% |
6 Conclusion
In this work, we pioneer a knowledge-enhanced method to explain the decision-making process of LLMs. This innovative approach not only generates reasoning explanations but also deepens our understanding of how LLMs operate. Based on this method, we create XplainLLM, a comprehensive dataset that comprises 12,102 commonsense questions, each accompanied by a why-choose and a why-not-choose explanation that reveals the LLM’s reasoning behind its response. Furthermore, our work provides a human-centered and objective evaluation, confirming the quality and faithfulness of the generated explanations. The results demonstrate the value of our explanations in revealing the LLMs’ decision-making processes.
Our work opens up new avenues for improving the explainability of LLMs and aligning their decision-making to something that is more human-understandable. We believe that XplainLLM, combined with our knowledge-enhanced approach, will prove to be a valuable resource for further research in these directions, fostering increased transparency and understanding of LLM decision-making processes.
References
- Kenton and Toutanova (2019) Jacob Devlin Ming-Wei Chang Kenton and Lee Kristina Toutanova. Bert: Pre-training of deep bidirectional transformers for language understanding. In Proceedings of NAACL-HLT, pages 4171–4186, 2019.
- Liu et al. (2019) Yinhan Liu, Myle Ott, Naman Goyal, Jingfei Du, Mandar Joshi, Danqi Chen, Omer Levy, Mike Lewis, Luke Zettlemoyer, and Veselin Stoyanov. Roberta: A robustly optimized bert pretraining approach. arXiv preprint arXiv:1907.11692, 2019.
- Brown et al. (2020) Tom Brown, Benjamin Mann, Nick Ryder, Melanie Subbiah, Jared D Kaplan, Prafulla Dhariwal, Arvind Neelakantan, Pranav Shyam, Girish Sastry, Amanda Askell, et al. Language models are few-shot learners. Advances in neural information processing systems, 33:1877–1901, 2020.
- Anil et al. (2023) Rohan Anil, Andrew M Dai, Orhan Firat, Melvin Johnson, Dmitry Lepikhin, Alexandre Passos, Siamak Shakeri, Emanuel Taropa, Paige Bailey, Zhifeng Chen, et al. Palm 2 technical report. arXiv preprint arXiv:2305.10403, 2023.
- Liu et al. (2021) Xiao Liu, Yanan Zheng, Zhengxiao Du, Ming Ding, Yujie Qian, Zhilin Yang, and Jie Tang. Gpt understands, too. arXiv preprint arXiv:2103.10385, 2021.
- Liu et al. (2023) Pengfei Liu, Weizhe Yuan, Jinlan Fu, Zhengbao Jiang, Hiroaki Hayashi, and Graham Neubig. Pre-train, prompt, and predict: A systematic survey of prompting methods in natural language processing. ACM Computing Surveys, 55(9):1–35, 2023.
- Arrieta et al. (2020) Alejandro Barredo Arrieta, Natalia Díaz-Rodríguez, Javier Del Ser, Adrien Bennetot, Siham Tabik, Alberto Barbado, Salvador García, Sergio Gil-López, Daniel Molina, Richard Benjamins, et al. Explainable artificial intelligence (xai): Concepts, taxonomies, opportunities and challenges toward responsible ai. Information fusion, 58:82–115, 2020.
- Ribeiro et al. (2016) Marco Tulio Ribeiro, Sameer Singh, and Carlos Guestrin. " why should i trust you?" explaining the predictions of any classifier. In Proceedings of the 22nd ACM SIGKDD international conference on knowledge discovery and data mining, pages 1135–1144, 2016.
- Lundberg and Lee (2017) Scott M Lundberg and Su-In Lee. A unified approach to interpreting model predictions. Advances in neural information processing systems, 30, 2017.
- Casalicchio et al. (2019) Giuseppe Casalicchio, Christoph Molnar, and Bernd Bischl. Visualizing the feature importance for black box models. In Machine Learning and Knowledge Discovery in Databases: European Conference, ECML PKDD 2018, Dublin, Ireland, September 10–14, 2018, Proceedings, Part I 18, pages 655–670. Springer, 2019.
- Wu et al. (2022) Tongshuang Wu, Michael Terry, and Carrie Jun Cai. Ai chains: Transparent and controllable human-ai interaction by chaining large language model prompts. In Proceedings of the 2022 CHI Conference on Human Factors in Computing Systems, pages 1–22, 2022.
- Clark et al. (2019) Kevin Clark, Urvashi Khandelwal, Omer Levy, and Christopher D Manning. What does bert look at? an analysis of bert’s attention. In Proceedings of the 2019 ACL Workshop BlackboxNLP: Analyzing and Interpreting Neural Networks for NLP, pages 276–286, 2019.
- Bills et al. (2023) Steven Bills, Nick Cammarata, Dan Mossing, Henk Tillman, Leo Gao, Gabriel Goh, Ilya Sutskever, Jan Leike, Jeff Wu, and William Saunders. Language models can explain neurons in language models. https://openaipublic.blob.core.windows.net/neuron-explainer/paper/index.html, 2023.
- Jacovi et al. (2021) Alon Jacovi, Swabha Swayamdipta, Shauli Ravfogel, Yanai Elazar, Yejin Choi, and Yoav Goldberg. Contrastive explanations for model interpretability. In Proceedings of the 2021 Conference on Empirical Methods in Natural Language Processing, pages 1597–1611, 2021.
- Radford et al. (2019) Alec Radford, Jeffrey Wu, Rewon Child, David Luan, Dario Amodei, Ilya Sutskever, et al. Language models are unsupervised multitask learners. OpenAI blog, 1(8):9, 2019.
- Hahn (2020) Michael Hahn. Theoretical limitations of self-attention in neural sequence models. Transactions of the Association for Computational Linguistics, 8:156–171, 2020.
- Sajjad et al. (2022) Hassan Sajjad, Nadir Durrani, and Fahim Dalvi. Neuron-level interpretation of deep nlp models: A survey. Transactions of the Association for Computational Linguistics, 10:1285–1303, 2022.
- Molnar et al. (2022) Christoph Molnar, Gunnar König, Julia Herbinger, Timo Freiesleben, Susanne Dandl, Christian A Scholbeck, Giuseppe Casalicchio, Moritz Grosse-Wentrup, and Bernd Bischl. General pitfalls of model-agnostic interpretation methods for machine learning models. In xxAI-Beyond Explainable AI: International Workshop, Held in Conjunction with ICML 2020, July 18, 2020, Vienna, Austria, Revised and Extended Papers, pages 39–68. Springer, 2022.
- Veličković et al. (2018) Petar Veličković, Guillem Cucurull, Arantxa Casanova, Adriana Romero, Pietro Liò, and Yoshua Bengio. Graph attention networks. In International Conference on Learning Representations, 2018. URL https://openreview.net/forum?id=rJXMpikCZ.
- Christiano et al. (2017) Paul F Christiano, Jan Leike, Tom Brown, Miljan Martic, Shane Legg, and Dario Amodei. Deep reinforcement learning from human preferences. Advances in neural information processing systems, 30, 2017.
- Li et al. (2023) Bo Li, Peng Qi, Bo Liu, Shuai Di, Jingen Liu, Jiquan Pei, Jinfeng Yi, and Bowen Zhou. Trustworthy ai: From principles to practices. ACM Computing Surveys, 55(9):1–46, 2023.
- Wiegreffe et al. (2021) Sarah Wiegreffe, Ana Marasović, and Noah A Smith. Measuring association between labels and free-text rationales. In Proceedings of the 2021 Conference on Empirical Methods in Natural Language Processing, pages 10266–10284, 2021.
- Madsen et al. (2022) Andreas Madsen, Siva Reddy, and Sarath Chandar. Post-hoc interpretability for neural nlp: A survey. ACM Computing Surveys, 55(8):1–42, 2022.
- Zelikman et al. (2022) Eric Zelikman, Yuhuai Wu, Jesse Mu, and Noah Goodman. STar: Bootstrapping reasoning with reasoning. In Alice H. Oh, Alekh Agarwal, Danielle Belgrave, and Kyunghyun Cho, editors, Advances in Neural Information Processing Systems, 2022. URL https://openreview.net/forum?id=_3ELRdg2sgI.
- (25) Wenlong Huang, Fei Xia, Ted Xiao, Harris Chan, Jacky Liang, Pete Florence, Andy Zeng, Jonathan Tompson, Igor Mordatch, Yevgen Chebotar, et al. Inner monologue: Embodied reasoning through planning with language models. In 6th Annual Conference on Robot Learning.
- Rajani et al. (2019a) Nazneen Fatema Rajani, Bryan McCann, Caiming Xiong, and Richard Socher. Explain yourself! leveraging language models for commonsense reasoning. In Proceedings of the 57th Annual Meeting of the Association for Computational Linguistics, pages 4932–4942, Florence, Italy, July 2019a. Association for Computational Linguistics. doi:10.18653/v1/P19-1487. URL https://aclanthology.org/P19-1487.
- Chen et al. (2021) Qianglong Chen, Feng Ji, Xiangji Zeng, Feng-Lin Li, Ji Zhang, Haiqing Chen, and Yin Zhang. KACE: Generating knowledge aware contrastive explanations for natural language inference. In Proceedings of the 59th Annual Meeting of the Association for Computational Linguistics and the 11th International Joint Conference on Natural Language Processing (Volume 1: Long Papers), pages 2516–2527, Online, August 2021. Association for Computational Linguistics. doi:10.18653/v1/2021.acl-long.196. URL https://aclanthology.org/2021.acl-long.196.
- Wiegreffe and Marasovic (2021) Sarah Wiegreffe and Ana Marasovic. Teach me to explain: A review of datasets for explainable natural language processing. In Thirty-fifth Conference on Neural Information Processing Systems Datasets and Benchmarks Track (Round 1), 2021. URL https://openreview.net/forum?id=ogNcxJn32BZ.
- Camburu et al. (2018) Oana-Maria Camburu, Tim Rocktäschel, Thomas Lukasiewicz, and Phil Blunsom. e-snli: Natural language inference with natural language explanations. In S. Bengio, H. Wallach, H. Larochelle, K. Grauman, N. Cesa-Bianchi, and R. Garnett, editors, Advances in Neural Information Processing Systems, volume 31. Curran Associates, Inc., 2018. URL https://proceedings.neurips.cc/paper_files/paper/2018/file/4c7a167bb329bd92580a99ce422d6fa6-Paper.pdf.
- DeYoung et al. (2020) Jay DeYoung, Sarthak Jain, Nazneen Fatema Rajani, Eric Lehman, Caiming Xiong, Richard Socher, and Byron C. Wallace. ERASER: A benchmark to evaluate rationalized NLP models. In Proceedings of the 58th Annual Meeting of the Association for Computational Linguistics, pages 4443–4458, Online, July 2020. Association for Computational Linguistics. doi:10.18653/v1/2020.acl-main.408. URL https://aclanthology.org/2020.acl-main.408.
- Yin et al. (2021) Kayo Yin, Patrick Fernandes, Danish Pruthi, Aditi Chaudhary, André F. T. Martins, and Graham Neubig. Do context-aware translation models pay the right attention? In Proceedings of the 59th Annual Meeting of the Association for Computational Linguistics and the 11th International Joint Conference on Natural Language Processing (Volume 1: Long Papers), pages 788–801, Online, August 2021. Association for Computational Linguistics. doi:10.18653/v1/2021.acl-long.65. URL https://aclanthology.org/2021.acl-long.65.
- Rajani et al. (2019b) Nazneen Fatema Rajani, Bryan McCann, Caiming Xiong, and Richard Socher. Explain yourself! leveraging language models for commonsense reasoning. In Proceedings of the 57th Annual Meeting of the Association for Computational Linguistics, pages 4932–4942, 2019b.
- Sap et al. (2020) Maarten Sap, Saadia Gabriel, Lianhui Qin, Dan Jurafsky, Noah A. Smith, and Yejin Choi. Social bias frames: Reasoning about social and power implications of language. In Proceedings of the 58th Annual Meeting of the Association for Computational Linguistics, pages 5477–5490, Online, July 2020. Association for Computational Linguistics. doi:10.18653/v1/2020.acl-main.486. URL https://aclanthology.org/2020.acl-main.486.
- Brahman et al. (2021) Faeze Brahman, Vered Shwartz, Rachel Rudinger, and Yejin Choi. Learning to rationalize for nonmonotonic reasoning with distant supervision. Proceedings of the AAAI Conference on Artificial Intelligence, 35(14):12592–12601, May 2021. doi:10.1609/aaai.v35i14.17492. URL https://ojs.aaai.org/index.php/AAAI/article/view/17492.
- Aggarwal et al. (2021) Shourya Aggarwal, Divyanshu Mandowara, Vishwajeet Agrawal, Dinesh Khandelwal, Parag Singla, and Dinesh Garg. Explanations for commonsenseqa: New dataset and models. In Proceedings of the 59th Annual Meeting of the Association for Computational Linguistics and the 11th International Joint Conference on Natural Language Processing (Volume 1: Long Papers), pages 3050–3065, 2021.
- Jhamtani and Clark (2020) Harsh Jhamtani and Peter Clark. Learning to explain: Datasets and models for identifying valid reasoning chains in multihop question-answering. In Proceedings of the 2020 Conference on Empirical Methods in Natural Language Processing (EMNLP), pages 137–150, Online, November 2020. Association for Computational Linguistics. doi:10.18653/v1/2020.emnlp-main.10. URL https://aclanthology.org/2020.emnlp-main.10.
- Inoue et al. (2020) Naoya Inoue, Pontus Stenetorp, and Kentaro Inui. R4C: A benchmark for evaluating RC systems to get the right answer for the right reason. In Proceedings of the 58th Annual Meeting of the Association for Computational Linguistics, pages 6740–6750, Online, July 2020. Association for Computational Linguistics. doi:10.18653/v1/2020.acl-main.602. URL https://aclanthology.org/2020.acl-main.602.
- Yasunaga et al. (2021) Michihiro Yasunaga, Hongyu Ren, Antoine Bosselut, Percy Liang, and Jure Leskovec. Qa-gnn: Reasoning with language models and knowledge graphs for question answering. In Proceedings of the 2021 Conference of the North American Chapter of the Association for Computational Linguistics: Human Language Technologies, pages 535–546, 2021.
- Talmor et al. (2019) Alon Talmor, Jonathan Herzig, Nicholas Lourie, and Jonathan Berant. Commonsenseqa: A question answering challenge targeting commonsense knowledge. In Proceedings of the 2019 Conference of the North American Chapter of the Association for Computational Linguistics: Human Language Technologies, Volume 1 (Long and Short Papers), pages 4149–4158, 2019.
- Zhou et al. (2023) Ce Zhou, Qian Li, Chen Li, Jun Yu, Yixin Liu, Guangjing Wang, Kai Zhang, Cheng Ji, Qiben Yan, Lifang He, et al. A comprehensive survey on pretrained foundation models: A history from bert to chatgpt. arXiv preprint arXiv:2302.09419, 2023.
- Speer et al. (2017) Robyn Speer, Joshua Chin, and Catherine Havasi. Conceptnet 5.5: An open multilingual graph of general knowledge. In Proceedings of the AAAI conference on artificial intelligence, volume 31, 2017.
- Ouyang et al. (2022) Long Ouyang, Jeffrey Wu, Xu Jiang, Diogo Almeida, Carroll Wainwright, Pamela Mishkin, Chong Zhang, Sandhini Agarwal, Katarina Slama, Alex Ray, et al. Training language models to follow instructions with human feedback. Advances in Neural Information Processing Systems, 35:27730–27744, 2022.
- Hoffman et al. (2018) Robert R Hoffman, Shane T Mueller, Gary Klein, and Jordan Litman. Metrics for explainable ai: Challenges and prospects. arXiv preprint arXiv:1812.04608, 2018.
- Khashabi et al. (2020) Daniel Khashabi, Sewon Min, Tushar Khot, Ashish Sabharwal, Oyvind Tafjord, Peter Clark, and Hannaneh Hajishirzi. Unifiedqa: Crossing format boundaries with a single qa system. In Findings of the Association for Computational Linguistics: EMNLP 2020, pages 1896–1907, 2020.
- Zhang et al. (2022a) X Zhang, A Bosselut, M Yasunaga, H Ren, P Liang, C Manning, and J Leskovec. Greaselm: Graph reasoning enhanced language models for question answering. In International Conference on Representation Learning (ICLR), 2022a.
- Wang et al. (2022) Xuezhi Wang, Jason Wei, Dale Schuurmans, Quoc Le, Ed Chi, and Denny Zhou. Self-consistency improves chain of thought reasoning in language models. arXiv preprint arXiv:2203.11171, 2022.
- Scao et al. (2022) Teven Le Scao, Angela Fan, Christopher Akiki, Ellie Pavlick, Suzana Ilić, Daniel Hesslow, Roman Castagné, Alexandra Sasha Luccioni, François Yvon, Matthias Gallé, et al. Bloom: A 176b-parameter open-access multilingual language model. arXiv preprint arXiv:2211.05100, 2022.
- Black et al. (2022) Sidney Black, Stella Biderman, Eric Hallahan, Quentin Anthony, Leo Gao, Laurence Golding, Horace He, Connor Leahy, Kyle McDonell, Jason Phang, et al. Gpt-neox-20b: An open-source autoregressive language model. In Proceedings of BigScience Episode# 5–Workshop on Challenges & Perspectives in Creating Large Language Models, pages 95–136, 2022.
- Wu et al. (2023) Shijie Wu, Ozan Irsoy, Steven Lu, Vadim Dabravolski, Mark Dredze, Sebastian Gehrmann, Prabhanjan Kambadur, David Rosenberg, and Gideon Mann. Bloomberggpt: A large language model for finance. arXiv preprint arXiv:2303.17564, 2023.
- Zhang et al. (2022b) Susan Zhang, Stephen Roller, Naman Goyal, Mikel Artetxe, Moya Chen, Shuohui Chen, Christopher Dewan, Mona Diab, Xian Li, Xi Victoria Lin, et al. Opt: Open pre-trained transformer language models. arXiv preprint arXiv:2205.01068, 2022b.
- Lu et al. (2022) Pan Lu, Swaroop Mishra, Tanglin Xia, Liang Qiu, Kai-Wei Chang, Song-Chun Zhu, Oyvind Tafjord, Peter Clark, and Ashwin Kalyan. Learn to explain: Multimodal reasoning via thought chains for science question answering. Advances in Neural Information Processing Systems, 35:2507–2521, 2022.
Appendix A.1 Graph Construction Algorithm
Appendix B.2 Additional Details of Decision Interpretation
In section 3.1, we introduce the method for interpreting the decision-making process. We provide supplementary calculations in this section.
A -layers GAT is used to extract the representation from element-graph . As introduced in the main paper, the node feature is determined as follows:
| (7) |
The plays a role in updating a node feature by aggregating neighbours messages. The message is computed according to the node properties:
| (8) |
where is linear transformation, is the one-hot vector corresponding to the type of node , and is the relation embedding that indicates the relation information in the edge [Yasunaga et al., 2021]. is obtained by
| (9) |
where is an one-hot vector for the type of connection between and , and is the concatenation of and .
The attention of node is computed by a query vector and a key vector ,
| (10) |
where is the feature dimension. and are computes by:
| (11) |
where and are linear transformations, and represents the relevance score as computed in Algorithm 1.
Appendix C.3 Explanation Statistics
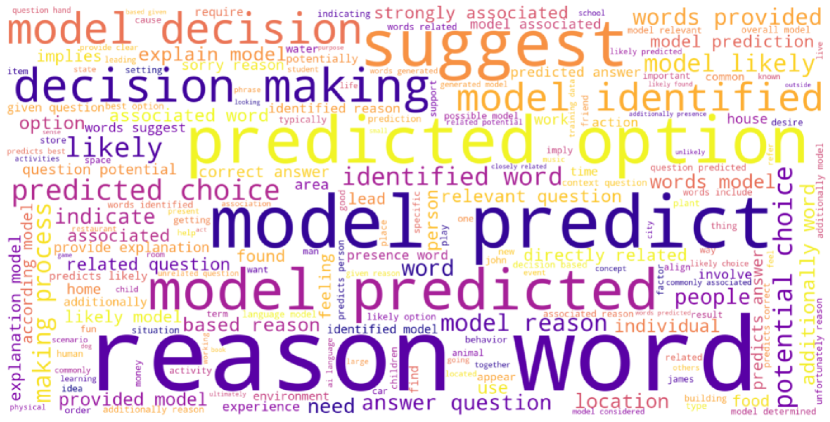
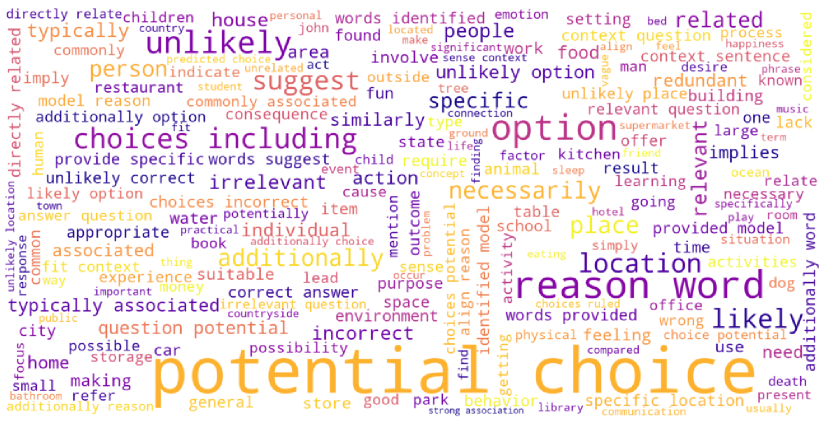
Figure 5 is a word cloud showing the most frequently appearing words in the why-choose explanations. From this figure, we have a clear indication that why-choose explanations focus on explaining, comprehension, and interpreting predictions made by the target model.
Figure 5 presents a word cloud for why-not-choose explanations. We note that these explanations outline the reasons behind the non-selection of specific options as predicted answers. Furthermore, why-not-choose explanations emphasize how the target model determines the likelihood of different answer choices. We also observe that the target model handles a wide array of topics, which can be crucial components in the “why not” reasoning process.
Appendix D.4 Instance Example
We present an example from our dataset to illustrate the data instance.
The format of our dataset is as follows:
Appendix E.5 Experiments
In this section, we describe the details of our evaluation that were omitted in Section 4 due to space constraints.
E.5.1 Model Parameters
To train our , we use a dropout rate of 0.2, a batch size of 64, and a learning rate of 1e-5, optimized with RAdam. The model is fine-tuned on a single NVIDIA A100 GPU for approximately 3 hours. Our containing 799,273 nodes and 2,487,810 edges. Our is pruned based on to retain 200 high-ranking nodes with a hop size of 2. The , specifically, consists of 200 dimensions and 5 layers. The learning rate in our experiments is 1e-3.
For GPT-3.5 and GPT-4, we set the temperature, the frequency penalty and the presence penalty to be 0.0, and the top probability to be 1.0. All experiments involving GPT-3.5/4 are conducted through the available online API. The example of in-context learning in the CoT setting (i.e. Table 6) follows the original work [Lu et al., 2022]. For self-consistency setting in Table 6, we sampled 5 possible answers for each question and picked the most likely one.
E.5.2 Data Collection
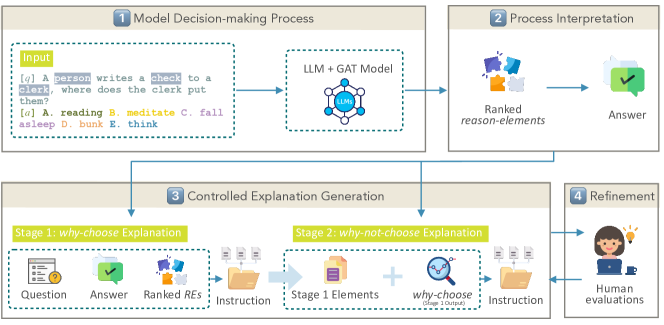
Figure 6 shows the process of data collection:
(1) Given a question, we retrieve its relevant knowledge using the KG. The retrieved graph is then pruned based on scores influenced by the LLM, resulting in what we term the element-graph. The element-graph is processed by a specialized GAT model (known formally as Decision Interpretation). Leveraging attention mechanisms, we obtain the essential representations for interpretation.
(2) The model’s decision-making is interpreted through the ranked reason-elements and the predicted answer.
(3) A controllable dual-stage process generates the explanations: Stage 1: The initial phase focuses on generating the “why-choose" explanations. Stage 2: Building upon the outputs and elements of Stage 1, we then generate the “why-not-choose" explanations.
(4) We conduct a human evaluation to identify errors in the explanations. If discrepancies arise, explanations are reverted to Step 3 for refinement. This process not only helps prevent potential issues arising from bad explanations generated by the LLM but also maintains human-aligned clarity and relevance.
E.5.3 Instructions for Explanation Generation
The generator model generates why-choose and why-not-choose explanations of the LLM ’s behavior based on a predefined set of instructions.
Recall that explanations are generated using instructions of the form
| (12) |
Specifically, the instruction symbols , , , , , and have the following meanings:
-
1.
represents “The question is …”
-
2.
represents “The predicted choice is …”
-
3.
represents “According to the model top reason-elements, explain the model reasoning process using …”
-
4.
represents
-
5.
represents “The top reason-elements are”.
-
6.
represents “According to …”
-
7.
represents “Explain why the model doesn’t choose other answers …”
Appendix F.6 Evaluation Materials
F.6.1 Questions and Evaluation Instructions
For each QAE triple, we provide eight questions for evaluators. Each question includes three score levels: 1 for disagree, 2 for neutral, and 3 for agree. The questions and instructions in our evaluation are as follows:
| Q0: This is a good explanation | |
|---|---|
| 1 | (Disagree) The explanation is illogical or inconsistent with the question and/or does not adequately cover the answer choices. |
| 2 | (Neutral) The explanation is somewhat logical and consistent with the question but might miss some aspects of the answer choices. |
| 3 | (Agree) The explanation is logical, consistent with the question, and adequately covers the answer choices. |
| Q1: I understand this explanation of how the AI model works. | |
| 1 | (Disagree) The explanation is unclear or contains overly complex terms or convoluted sentences. |
| 2 | (Neutral) The explanation is somewhat understandable but might contain complex terms or convoluted sentences. |
| 3 | (Agree) The explanation is clear, concise, and easy to understand. |
| Q2: I trust this explanation of how the AI model works. | |
| 1 | (Disagree) The explanation is unclear or contains overly complex terms or convoluted sentences. |
| 2 | (Neutral) The explanation is somewhat credible but contains some elements that I find doubtful or questionable. |
| 3 | (Agree) The explanation is credible and aligns with my understanding of how AI models work. |
| Q3: This explanation of how the AI model works is satisfying. | |
| 1 | (Disagree) The explanation does not meet my expectations and leaves many questions unanswered. |
| 2 | (Neutral) The explanation somewhat meets my expectations but leaves some questions unanswered. |
| 3 | (Agree) The explanation meets my expectations and satisfies my query. |
| Q4: This explanation of how the AI model works has sufficient detail. | |
| 1 | (Disagree) The explanation lacks detail and does not adequately cover the AI model’s decision-making. |
| 2 | (Neutral) The explanation provides some detail but lacks thoroughness in covering the AI model’s decision-making. |
| 3 | (Agree) The explanation is thorough and covers all aspects of the AI model’s decision-making. |
| Q5: This explanation of how the AI model works contains irrelevant details. | |
| 1 | (Disagree) The explanation does not contain any irrelevant details. |
| 2 | (Neutral) The explanation contains some irrelevant details. |
| 3 | (Agree) The explanation contains many irrelevant details. |
| Q6: This explanation of how the AI model works seems complete. | |
| 1 | (Disagree) The explanation does not adequately cover the answer choices and leaves many aspects unexplained. |
| 2 | (Neutral) The explanation covers most answer choices but leaves some aspects unexplained. |
| 3 | (Agree) The explanation covers all answer choices and leaves no aspect unexplained. |
| Q7: This explanation of how the AI model works is accurate. | |
| 1 | (Disagree) The explanation does not accurately reflect the AI model’s decision-making. |
| 2 | (Neutral) The explanation somewhat reflects the AI model’s decision-making but contains some inaccuracies. |
| 3 | (Agree) The explanation accurately reflects the AI model’s decision-making. |
F.6.2 Details of Human-centered Metrics
The meaning of metrics used in the human-centered evaluation are as follows:
-
1.
Overall quality reflects the overall effectiveness of explainability. It reveals how effectively explanations convey the decision-making process of the AI models to the human users.
-
2.
Understandability evaluates how well a human can comprehend the model’s output and explanations. It captures the clarity and coherence of the generated text.
-
3.
Trustworthiness measures the human evaluator’s confidence in the model’s outputs and explanations. It evaluates whether the explanations appear reliable, credible, and based on sound reasoning.
-
4.
Satisfaction captures the overall contentment of the evaluator with the explanations. It measures whether the outputs meet the evaluator’s needs and expectations in terms of quality, relevance, and utility.
-
5.
Sufficiency of detail evaluates whether the explanations provide a sufficient level of detail. It evaluates whether the responses are adequately descriptive and provide all necessary information to fully answer the question or task.
-
6.
Irrelevance evaluates whether the explanations include any unnecessary or irrelevant information.
-
7.
Completeness measures whether the explanations address the decision behaviors of the model.
-
8.
While we also measure accuracy objectively, the human evaluation of accuracy assesses whether the explanations align with the evaluator’s knowledge or expectations. It measures whether the explanations can reflect if the model’s outputs are factually correct and contextually appropriate.