DALA: A Distribution-Aware LoRA-Based Adversarial Attack against Pre-trained Language Models
Abstract
Pre-trained language models (PLMs) that achieve success in applications are susceptible to adversarial attack methods that are capable of generating adversarial examples with minor perturbations. Although recent attack methods can achieve a relatively high attack success rate (ASR), our observation shows that the generated adversarial examples have a different data distribution compared with the original examples. Specifically, these adversarial examples exhibit lower confidence levels and higher distance to the training data distribution. As a result, they are easy to detect using very simple detection methods, diminishing the actual effectiveness of these attack methods. To solve this problem, we propose a Distribution-Aware LoRA-based Adversarial Attack (DALA) method, which considers the distribution shift of adversarial examples to improve attack effectiveness under detection methods. We further design a new evaluation metric NASR combining ASR and detection for the attack task. We conduct experiments on four widely-used datasets and validate the attack effectiveness on ASR and NASR of the adversarial examples generated by DALA on the BERT-base model and the black-box LLaMA2-7b model.
DALA: A Distribution-Aware LoRA-Based Adversarial Attack against Pre-trained Language Models
Yibo Wang1††thanks: Equal Contribution Xiangjue Dong211footnotemark: 1 James Caverlee2 Philip S. Yu1 1 University of Illinois Chicago, 2 Texas A&M University {ywang633, psyu}@uic.edu, {xj.dong, caverlee}@tamu.edu
1 Introduction
Pre-trained language models (PLMs), despite their capacity for remarkable accuracy and human-like performance in many applications, face vulnerability to adversarial attacks and exhibit high sensitivity to subtle input perturbations, which can potentially lead to failure Jia and Liang (2017); Belinkov and Bisk (2018); Wallace et al. (2019). Recently, an increasing number of adversarial attacks have been proposed in NLP, taking the forms of insertion, deletion, swapping, and substitution at character, word, or sentence levels Zhao et al. (2018); Ren et al. (2019); Jin et al. (2020); Garg and Ramakrishnan (2020); Ribeiro et al. (2020). These meticulously crafted adversarial examples are imperceptible to humans but can deceive the targeted model, raising concerns about the robustness and security of PLMs. For example, the chatbot can generate responses that are offensive or contain personal information, and leak private training data in the generated text during the conversation Perez et al. (2022).
However, while existing adversarial attack methods can achieve a relatively high attack success rate on victim models Gao et al. (2018); Belinkov and Bisk (2018); Li et al. (2020), our observation experiments detailed in §3 reveal distribution disparities between the generated adversarial examples and the original examples, rendering high detectability of adversarial examples. For one thing, adversarial examples exhibit different confidence levels compared to their original counterparts. Typically, the Maximum Softmax Probability (MSP), a metric indicating prediction confidence, is higher for original validation examples than for adversarial examples. For the other thing, there is a disparity in the distance to the training data distribution between adversarial examples and original examples. Specifically, the Mahalanobis Distance (MD) to training data distribution for original examples is shorter than that for adversarial examples. Based on the two aforementioned observations, we draw the conclusion that adversarial examples generated by previous attack methods in NLP, such as BERT-Attack Li et al. (2020), can be easily detected through score-based detection techniques like MSP detection Hendrycks and Gimpel and embedding-based detection methods like MD detection Lee et al. (2018). Thus, the actual efficacy of previous attack methods is diminished in the consideration of OOD detection.
To address these problems, we propose a Distribution-Aware LoRA-based Attack (DALA) method with Data Alignment Loss (DAL), which is a new attack method that can generate elusive adversarial examples that are hard to identify by existing detection methods. The framework of DALA consists of two phases. Firstly, DALA finetunes a LoRA-based PLM through a combination of the Masked Language Modeling task and the downstream classification task using DAL. The fine-tuning phase enables the LoRA-based PLM to possess the capability of generating adversarial examples closely resembling original examples in terms of MSP and MD. Then the obtained LoRA-based PLM is utilized during the inference to generate adversarial examples.
To consider the detectability of adversarial examples generated by attack methods, we propose a new evaluation metric: Non-detectable Attack Success Rate (NASR), which combines Attack Success Rate (ASR) with Out-of-Distribution (OOD) detection. We conduct experiments on four datasets to verify whether DALA can effectively attack PLMs, and evaluate the attack transferability of DALA on the black-box LLaMA2-7b model using ASR and NASR. Our experiments show that DALA achieves competitive attack performance on BERT-base and the best transferability on the black-box LLaMA2-7b compared with baselines.
Our work has the following contributions:
-
•
We analyze the distribution of adversarial examples compared with original examples, and find the distribution shift exists in terms of MSP and MD.
-
•
We propose a new Distribution-Aware LoRA-based Attack (DALA) method with Data Alignment Loss, which is able to generate adversarial examples that can effectively attack victim models.
-
•
We design a new evaluation metric – NASR – for the attack task, which considers the detectability of the adversarial examples.
-
•
We conduct comprehensive experiments to compare performance between DALA and baseline models on four datasets, where we find DALA achieves competitive attack capabilities and supreme transferability under the consideration of detection.
2 Related Work
2.1 Adversarial Attack in NLP
Adversarial attacks have been extensively studied to explore the robustness of language models. Current methods fall into character-level, word-level, sentence-level, and multi-level Goyal et al. (2023). Character-level methods manipulate texts by incorporating typos or errors into words, such as deleting, repeating, replacing, swapping, flipping, inserting, and allowing variations in characters for specific words Gao et al. (2018); Belinkov and Bisk (2018). While these attacks are quite effective and can achieve a high success rate, they can be easily detected through a grammar checker. Word-level attacks alter entire words rather than individual characters within words, which tend to be less perceptible to humans compared to character-level attacks. The common manipulation includes addition, deletion, and substitution with synonyms to mislead language models while the manipulated words are selected based on gradient, importance score Ren et al. (2019); Jin et al. (2020); Li et al. (2020); Garg and Ramakrishnan (2020), etc. Sentence-level attacks typically involve inserting or rewriting sentences within a text, all while preserving the original meaning Zhao et al. (2018); Iyyer et al. (2018); Ribeiro et al. (2020). Multi-level attacks combine multiple perturbation techniques to achieve both imperceptibility and a high success rate in the attack Song et al. (2021). Our work focuses on the word-level attack.
2.2 Out-of-distribution Detection in NLP
Out-of-distribution (OOD) detection methods have been widely explored in NLP problems Arora et al. (2021); Ren et al. (2022); Adila and Kang (2022). OOD detection methods in NLP can be roughly categorized into two types: (1) score-based methods; and (2) embedding-based methods. Score-based methods utilize maximum softmax probabilities Hendrycks and Gimpel , perplexity score Arora et al. (2021), beam score Wang et al. (2019b), sequence probability Wang et al. (2019b), BLEU variance Xiao et al. (2020), or energy-based scores Liu et al. (2020). Embedding-based methods measure the distance to in-distribution data in the embedding space for OOD detection. For example, Lee et al. (2018) uses Mahalanobis distance; Ren et al. (2021) proposes to use relative Mahalanobis distance; Sun et al. (2022) proposes a nearest-neighbor-based OOD detection method.
We select the simple and widely-used OOD detection methods of these two categories: MSP detection Hendrycks and Gimpel and MD detection Lee et al. (2018), respectively. These two methods are incorporated with the Attack Success Rate to assess both the robustness and detectability of adversarial examples generated by different attack models.
3 Understanding Distribution Shift of Adversarial Examples
In this section, we showcase the empirical observations from our analysis of adversarial examples generated by previous attack methods. Specifically, we find disparities in distribution manifest between adversarial examples and original examples, which implies original examples are in-distribution examples while adversarial examples are Out-of-Distribution (OOD) examples. Due to space constraints, we only present the analysis of adversarial examples generated by BERT-Attack on SST-2 and MRPC; the complete results are available in the Appendix A.
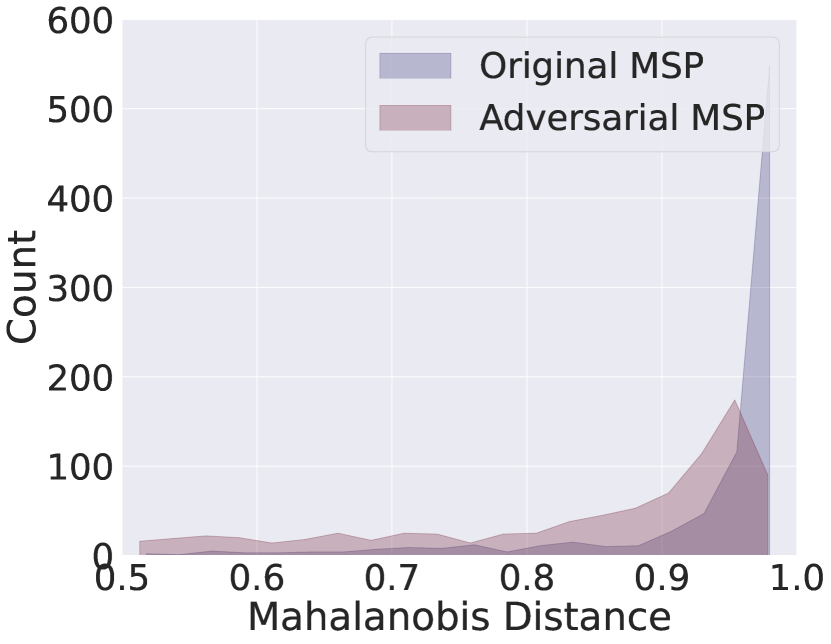
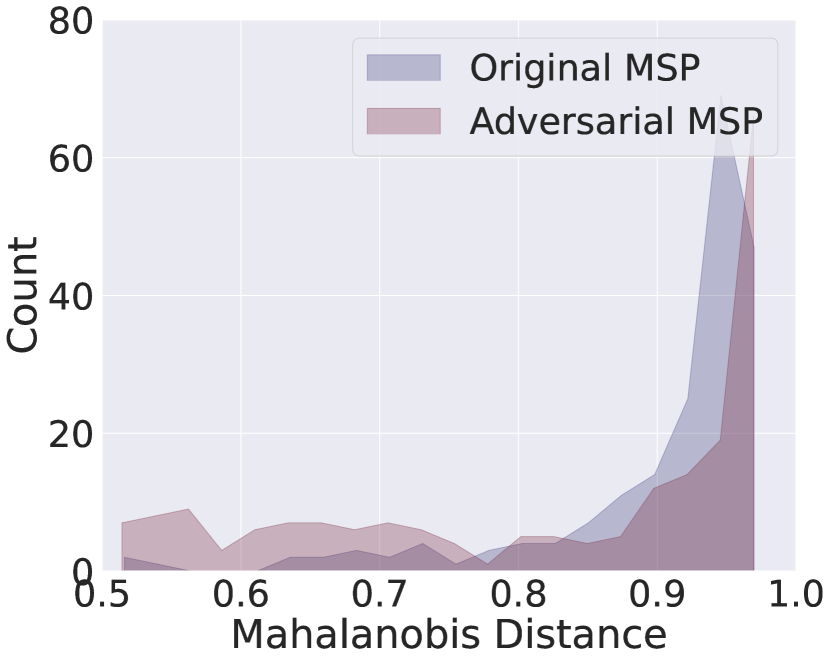
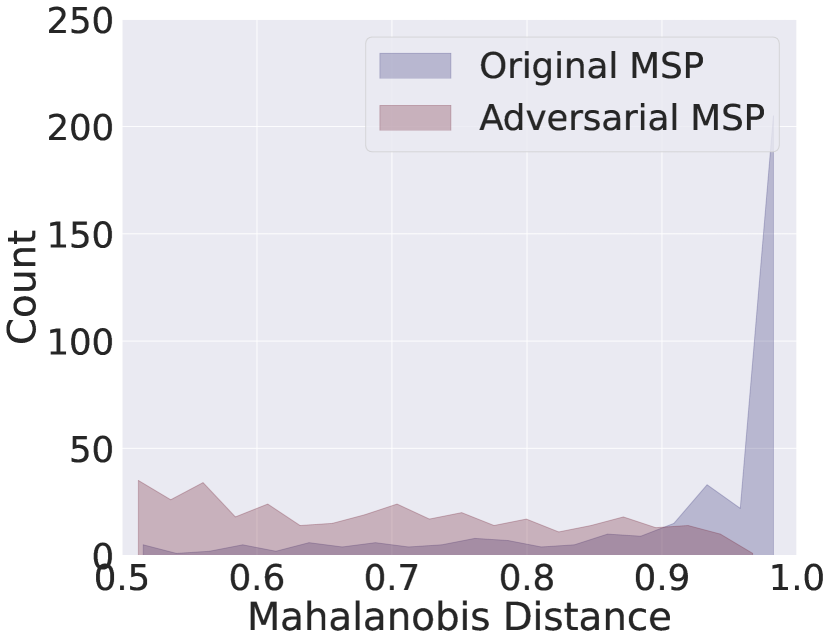
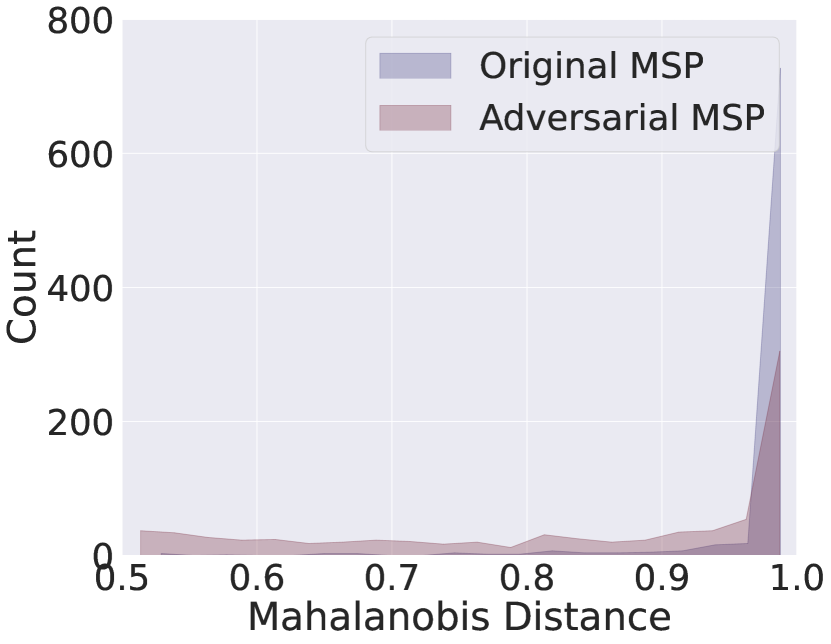
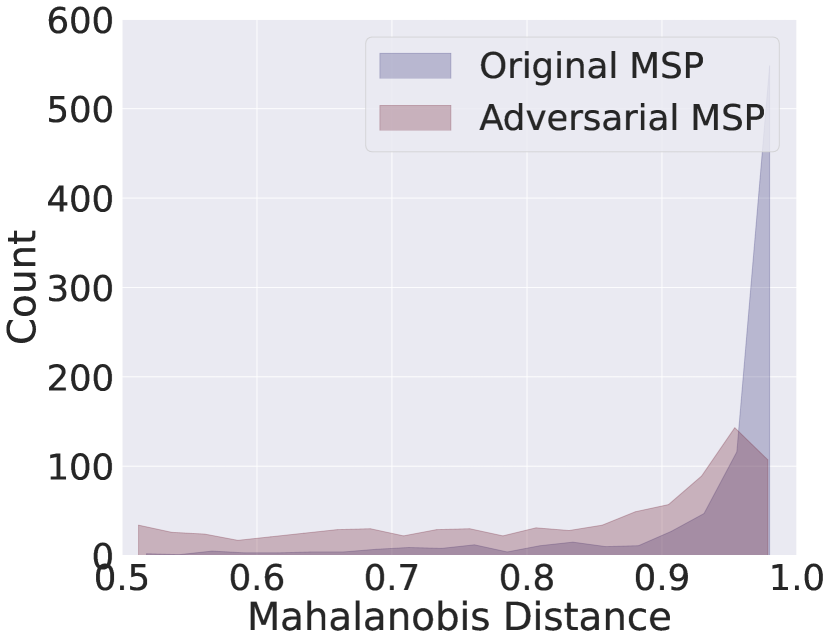
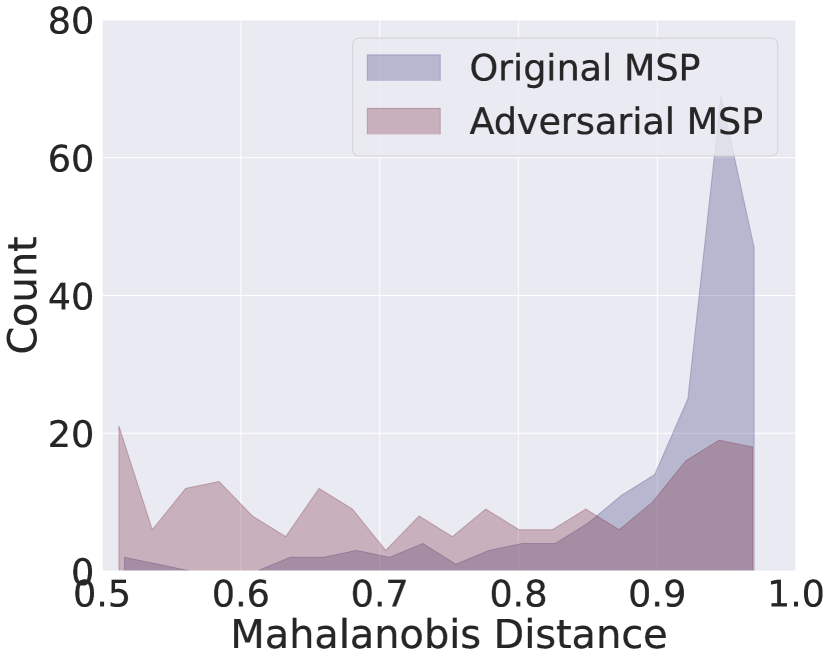
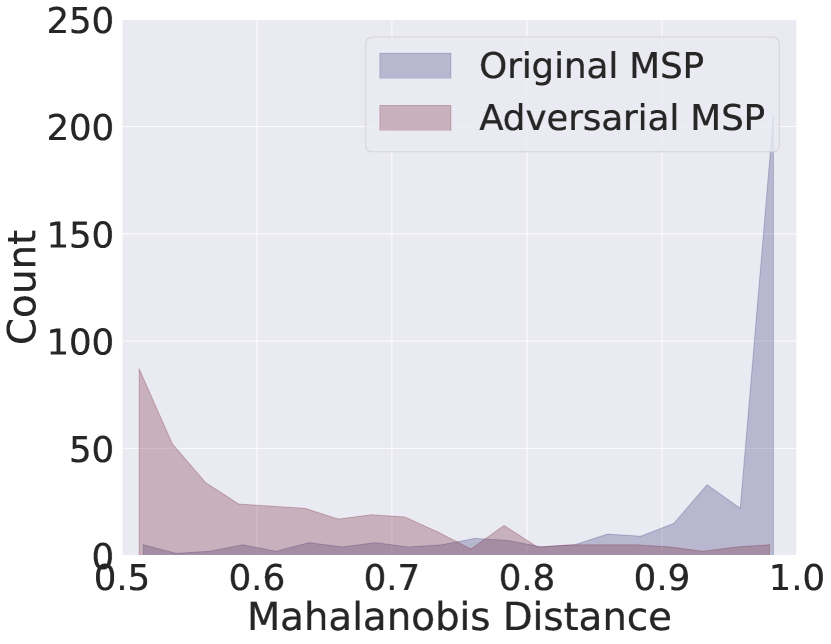
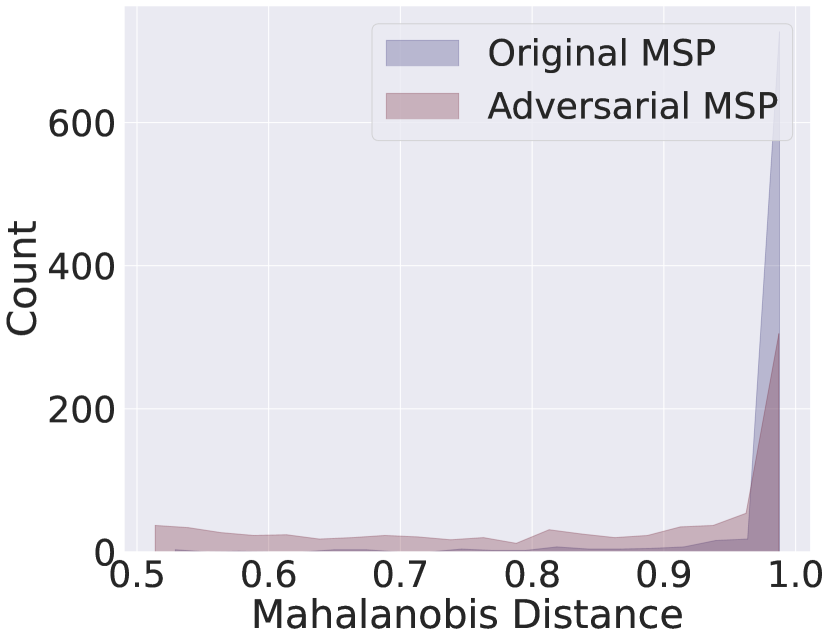
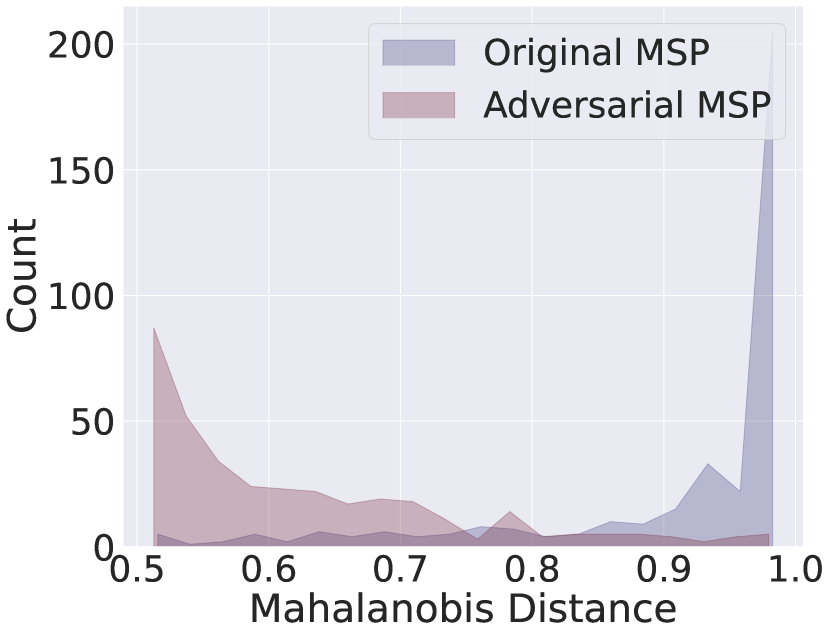
Maximum Softmax Probability
Maximum Softmax Probability (MSP) functions as a measure to evaluate prediction confidence, rendering it a widely employed score-based method for OOD detection, with diminished confidence correlating to OOD examples. To assess the difference of MSP, we visualize the MSP distribution of adversarial examples generated by BERT-Attack Li et al. (2020) and original examples on the SST-2 dataset Socher et al. (2013) and MRPC dataset Dolan and Brockett (2005) in Figure 1. From Figure 1, we can observe that on both datasets, most of the original examples have an MSP over 0.9, indicating a significantly higher MSP compared to adversarial examples overall. This disparity is particularly pronounced in the MRPC dataset, whereby the majority of adversarial examples exhibit MSP below 0.6, highlighting a distinct contrast with the original examples.
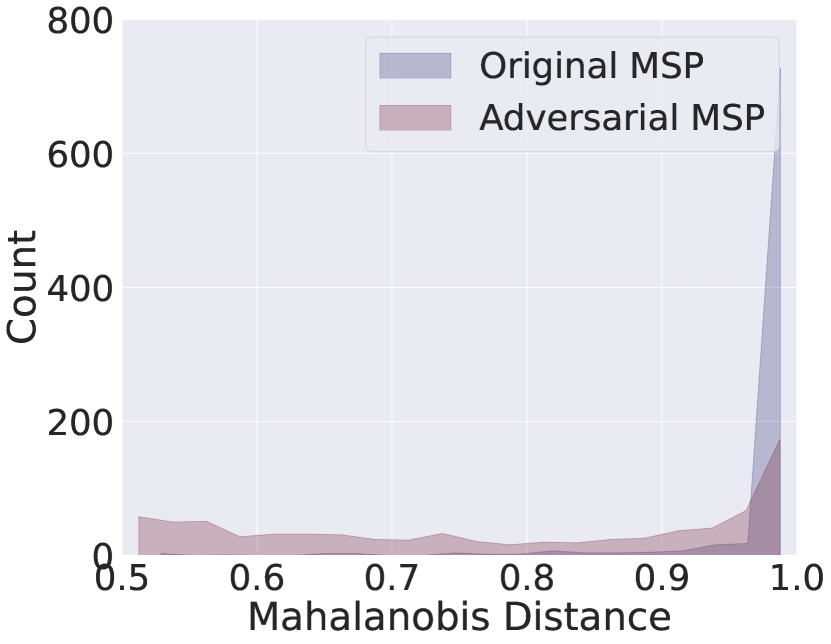
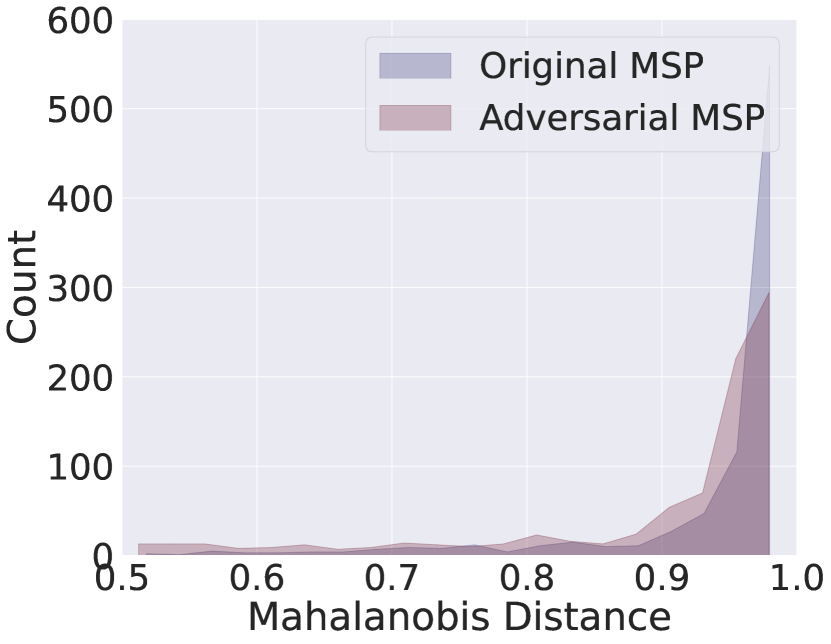
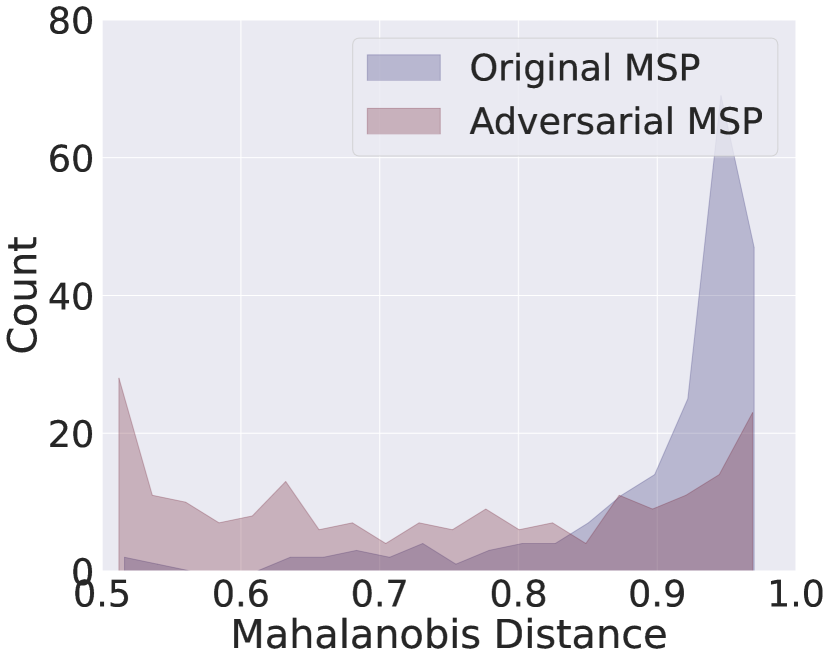
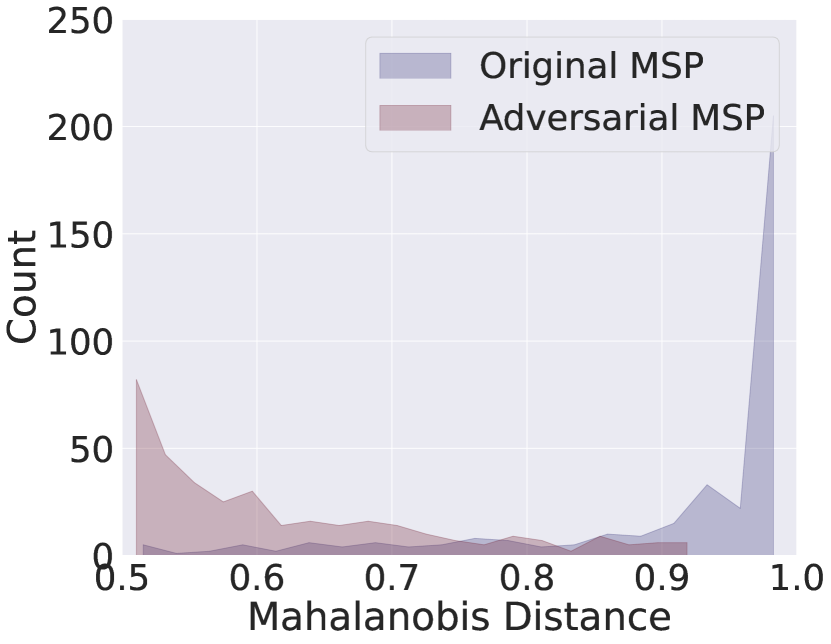
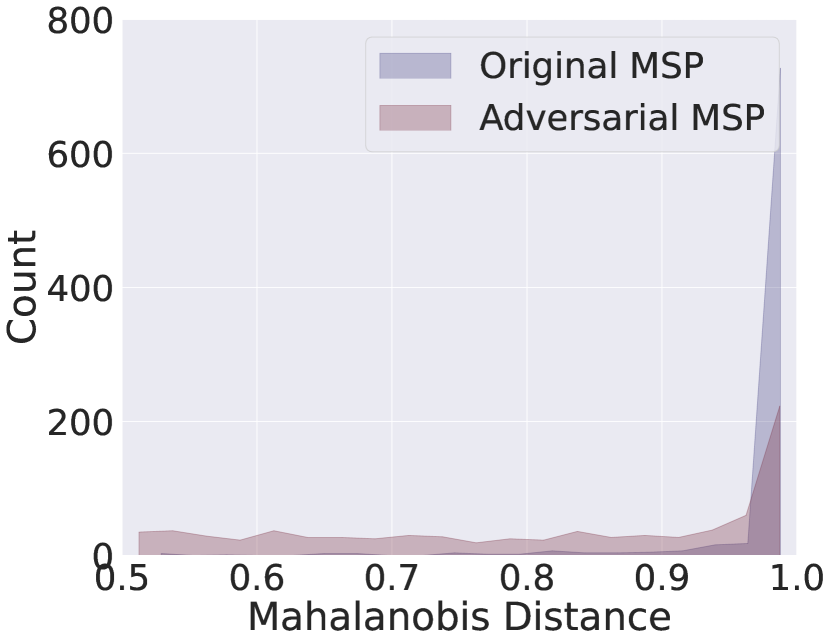
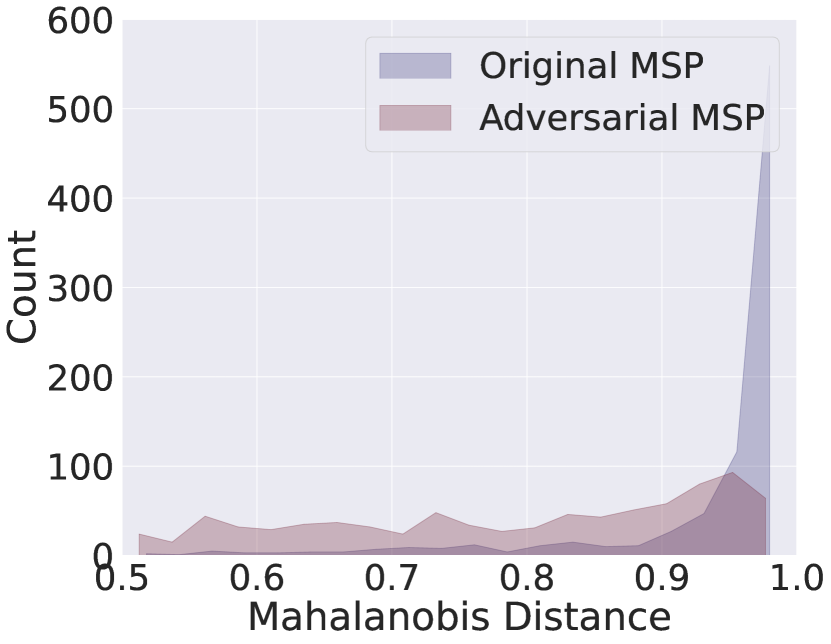
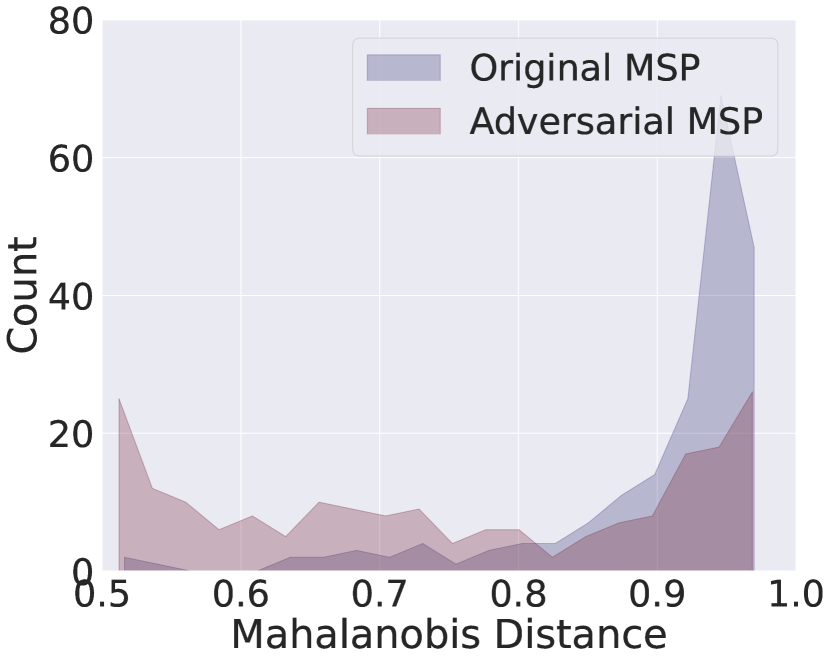
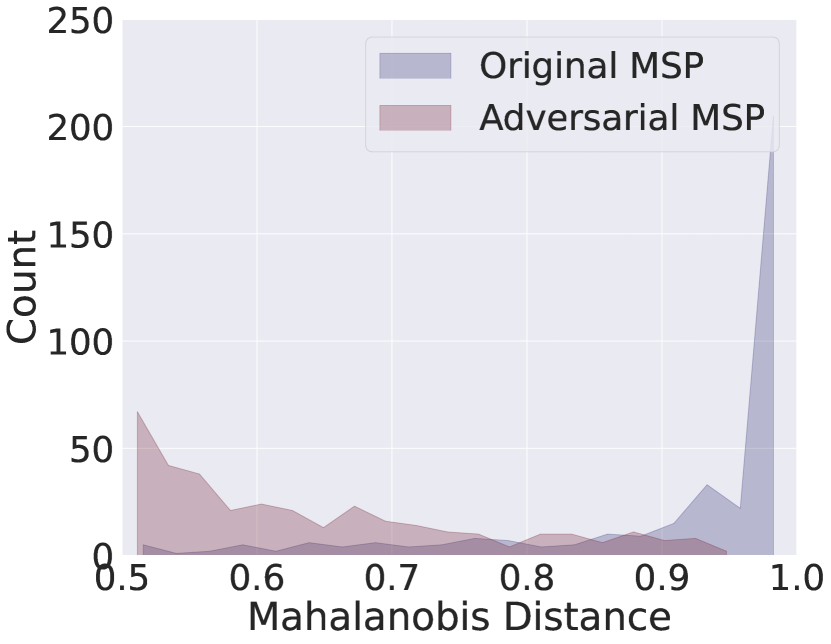
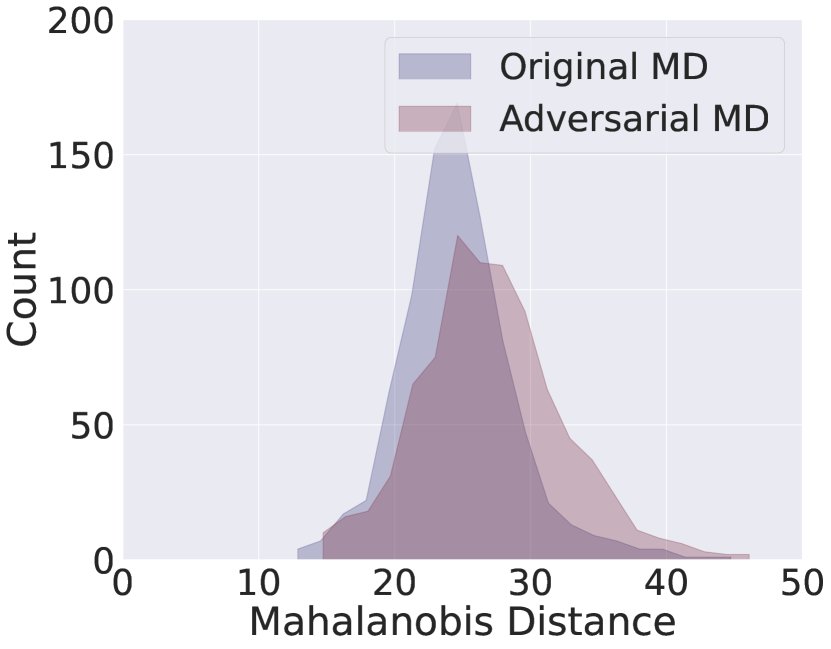
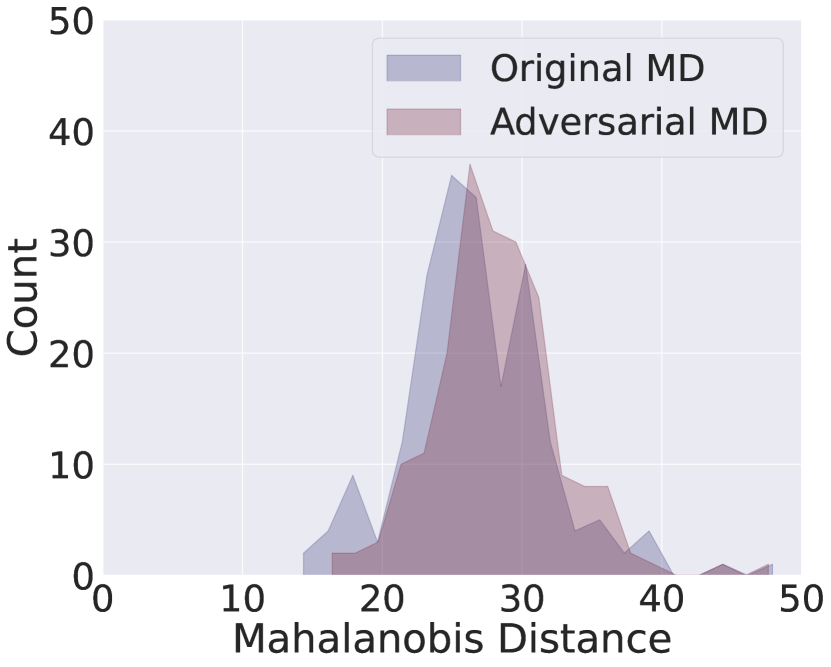
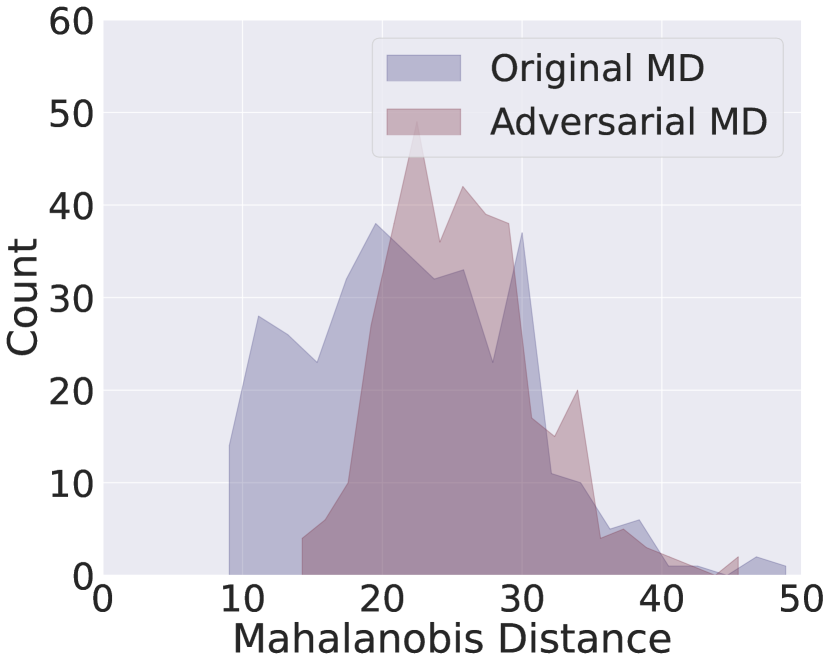
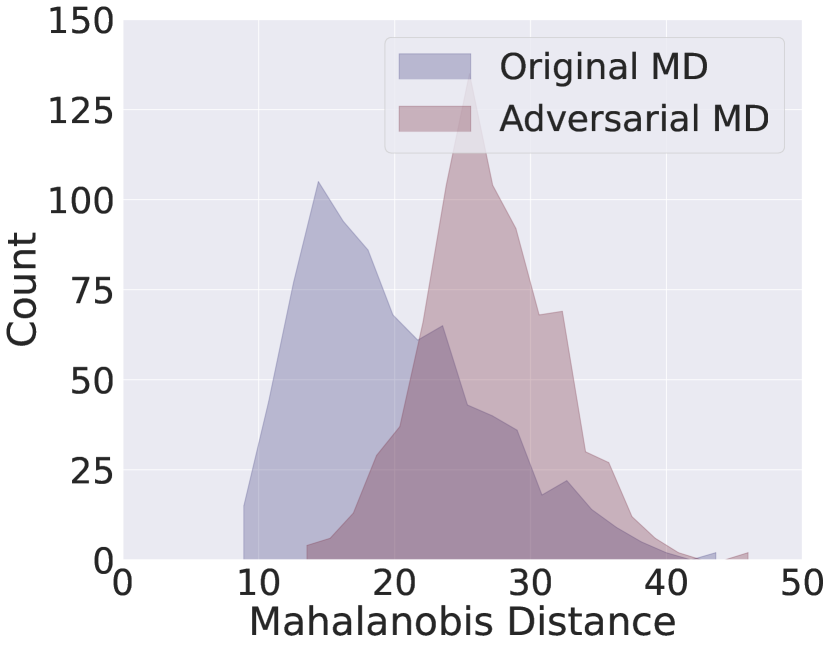
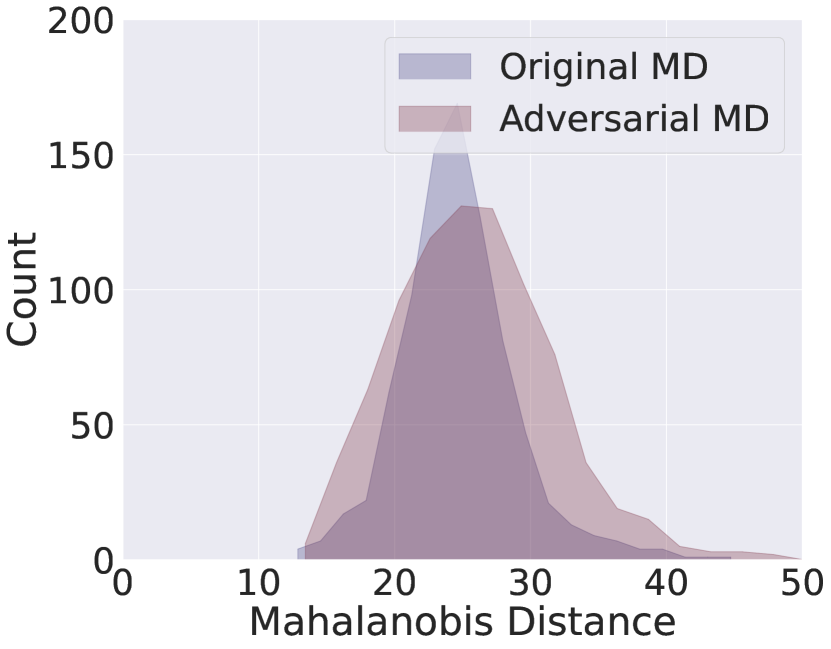
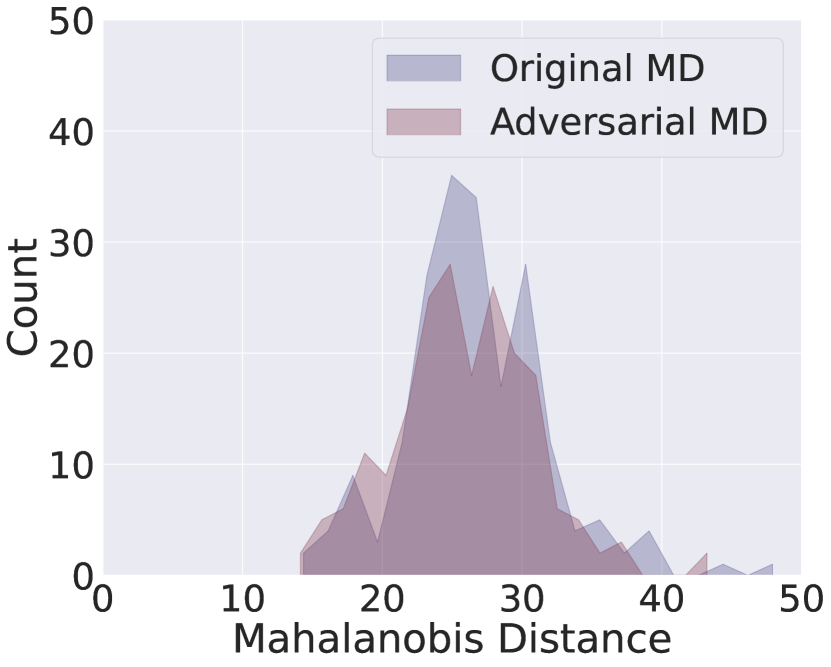
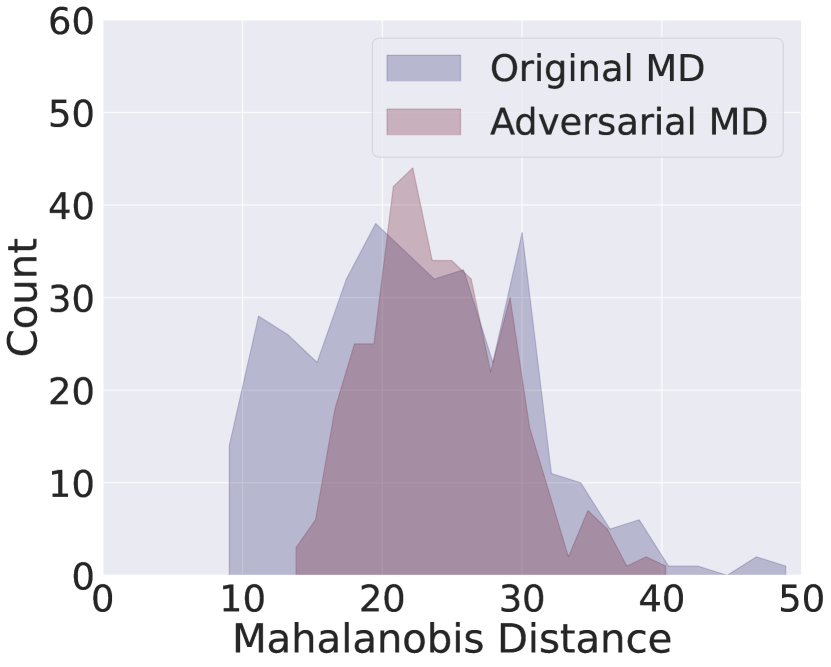
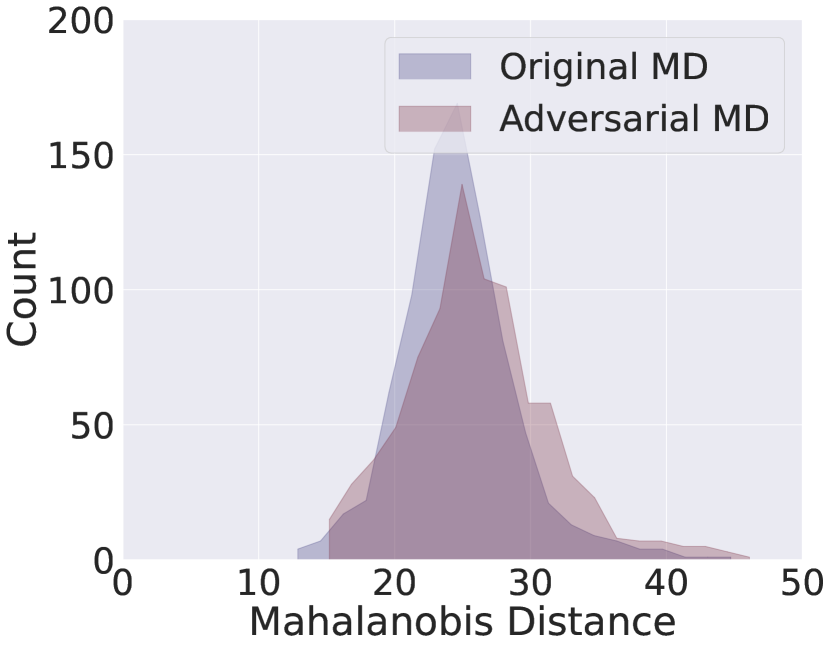
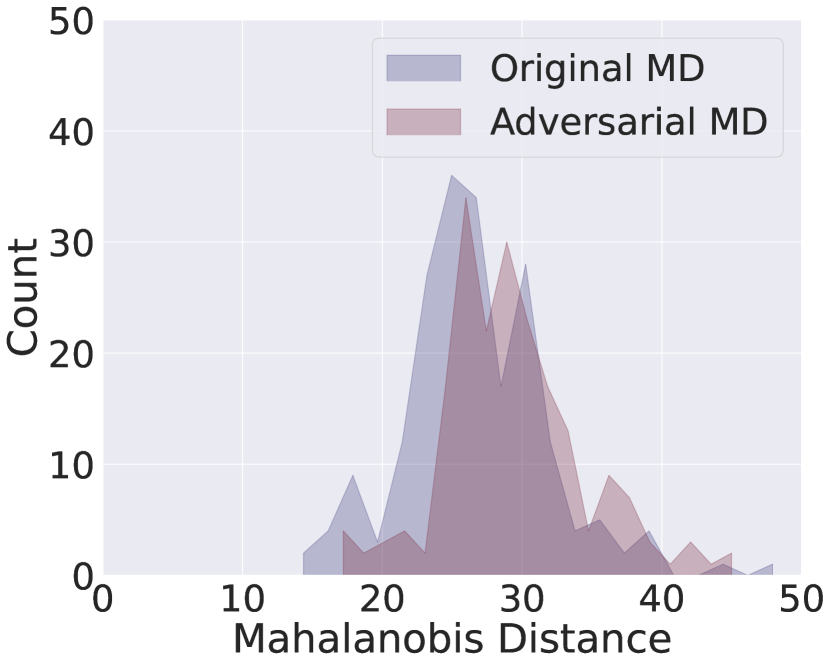
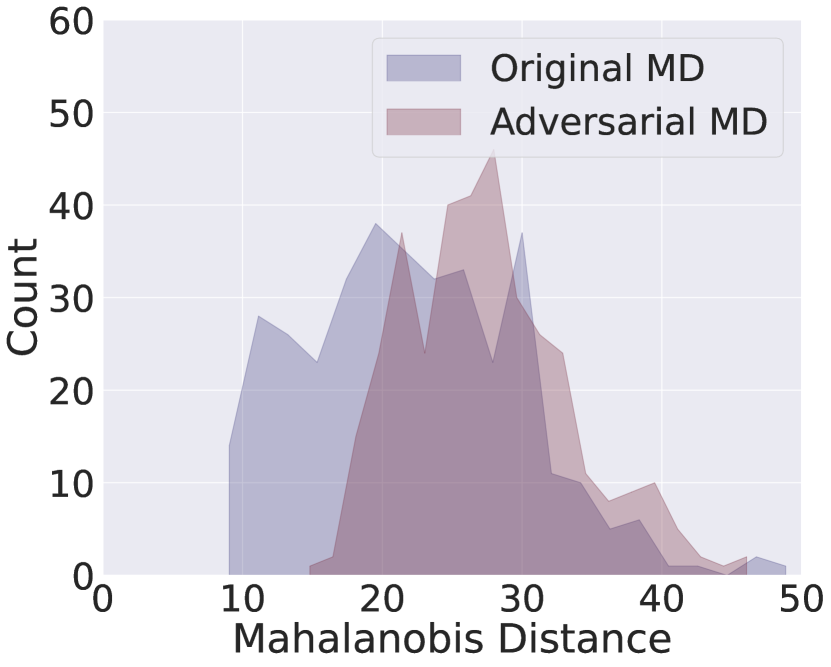
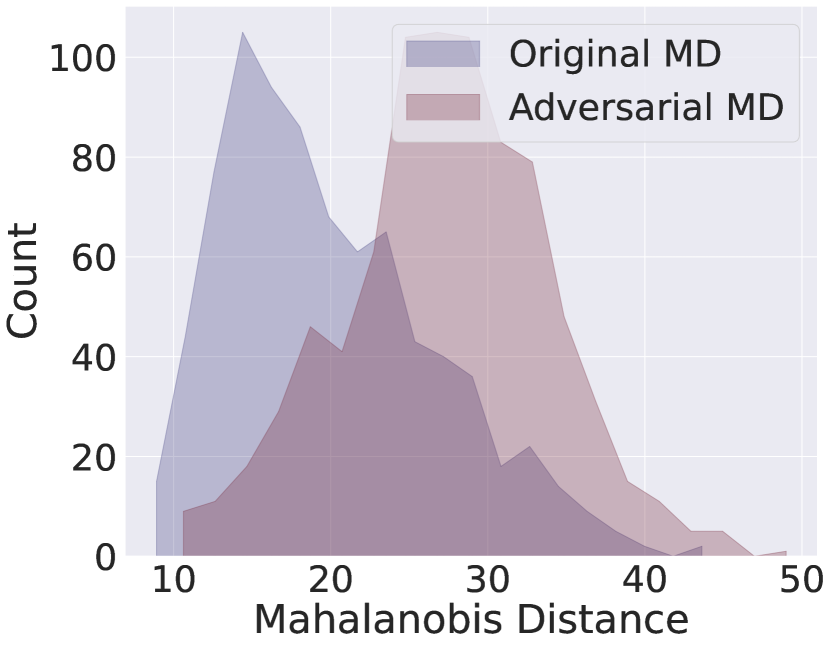
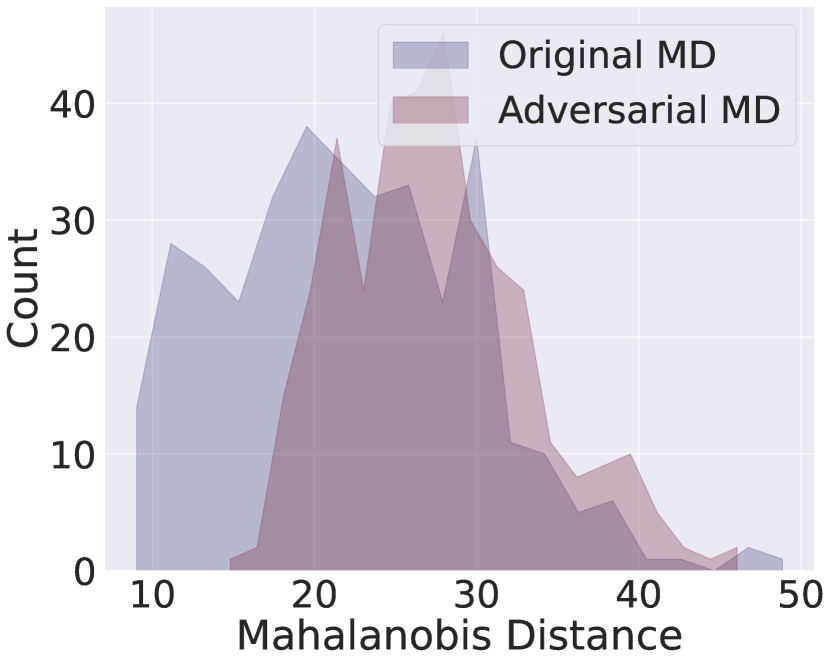
Mahalanobis Distance
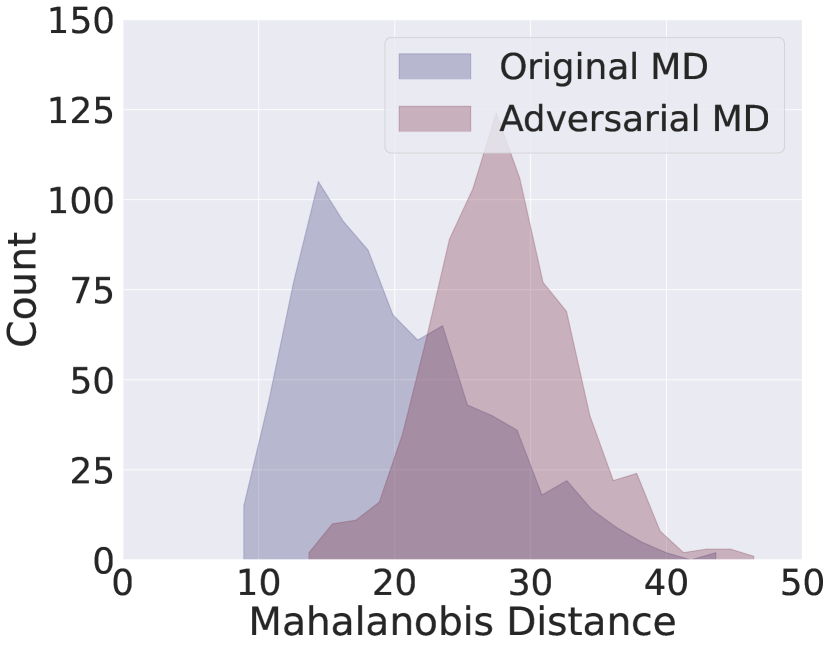
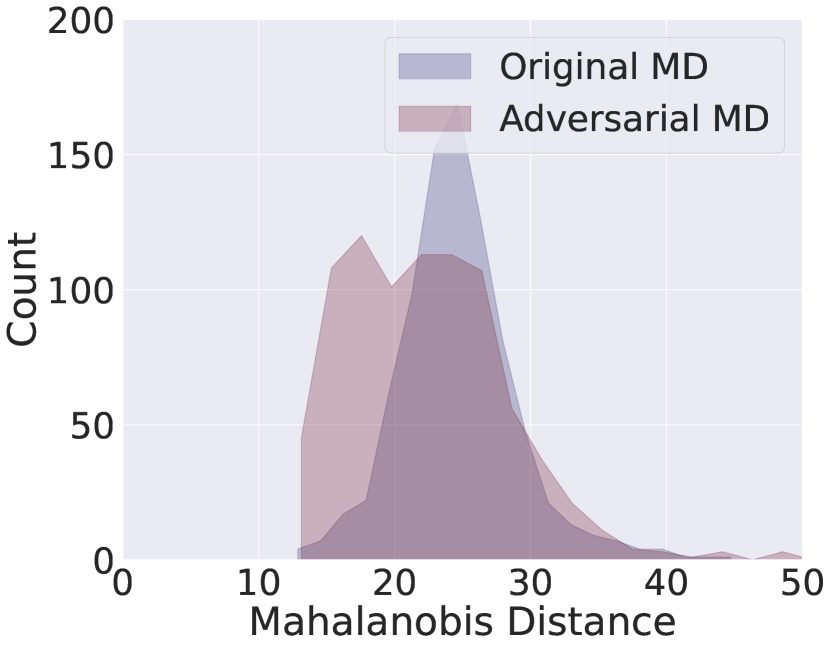
Mahalanobis Distance (MD) is a measure of distance between one data point to a distribution, which inherently serves as a highly suitable and widespread method for OOD detection. The higher MD of an example to in-distribution data (training data) indicates that the example may be an OOD instance. To assess the difference of MD to the distribution of training data, we visualize the MD distribution of adversarial examples generated by BERT-Attack and original examples on the SST-2 dataset and MRPC dataset in Figure 2. From Figure 2, we can observe that on both datasets, disparities exist between original examples and adversarial examples. This dissimilarity of more noticeable on the SST-2 dataset, while on the MRPC dataset, it is not as conspicuous.
Overall
These observations for both MSP and MD indicate clear distinctions between original examples and adversarial examples generated by one of the state-of-the-art methods BERT-Attack. In comparison to the original examples, the adversarial examples exhibit a more pronounced OOD nature in both MSP and MD dimensions, meaning that adversarial examples are easy to detect and the practical effectiveness of previous attack methods is diminished.
4 Methodology
In this section, we define the attack task (§4.1), propose a novel attack method called Distribution-Aware LoRA-based Attack (§4.2), and introduce the new Data Alignment Loss (§4.3).
4.1 Problem Formulation
Given an original sentence and an original label , our objective is to obtain an adversarial sentence such that the prediction of the victim model corresponds to and .
4.2 Distribution-Aware LoRA-based Attack
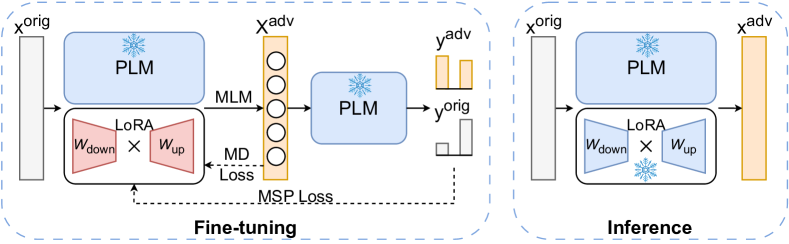
Motivated by the distribution shift of adversarial examples, we propose a Distribution-Aware LoRA-based Attack (DALA) method. The key idea of DALA is to consider the distribution of the generated adversarial examples and attempt to bring about a closer alignment between the distributions of adversarial examples and original examples in terms of MSP and MD. DALA is composed of two phases: fine-tuning and inference. DALA model structure is shown in Figure 3.
Fine-tuning Phase
The fine-tuning phase aims to fine-tune a LoRA-based PLM capable of generating adversarial examples through the Masked Language Modeling (MLM) task. First, the original sentence undergoes the MLM task through a LoRA-based PLM to generate the adversarial embedding , during which the parameters of the PLM are frozen, and the parameters of LoRA Hu et al. (2021) are tunable. Then, the generated adversarial embedding is subjected to the corresponding downstream task through the frozen PLM and outputs original ground truth label and adversarial label . The loss is calculated from , , and to update the parameters of LoRA. Details are discussed in §4.3.
Inference Phase
The purpose of the inference phase is to generate adversarial examples with minimal perturbation. The original sentence is first tokenized, and a ranked token list is obtained through token importance Li et al. (2020). Then, a token is selected from the token list to be masked. Subsequently, the MLM task of the frozen LoRA-based PLM is employed to generate a candidate list for the masked token. A word is then chosen from the list to replace the masked token until a successful attack on the victim model is achieved or the candidate list is exhausted. If the attack is not successful, another token is chosen from the token list until a successful attack is achieved or the termination condition is met. The termination condition is set as the percentage of the tokens.
4.3 Model Learning
To bring closer the distributions of adversarial examples and original examples, we propose Data Alignment Loss, which consists of Maximum Softmax Probability (MSP) Loss and Mahalanobis Distance (MD) Loss.
Data Alignment Loss, notated as , is used to constrain adversarial examples to make adversarial examples more similar to original examples in terms of MSP and MD. is composed of two losses:
where and are the mean and covariance embedding of the in-distribution (training) data respectively, and is model parameters.
is equal to 1 subtracted by the sigmoid of the difference of the Softmax probability between the adversarial label and the original label given adversarial input. According our observation experiments in Figure 1, original data has higher Maximum Softmax Probabilities (confidence) than adversarial data. Thus, minimizing makes generated adversarial examples more similar to original examples concerning MSP.
is the log of the Mahalanobis distance (RMD) Ren et al. (2021) of adversarial input to the training dataset distribution. MD is a superior and robust metric for out-of-distribution detection and adversarial data detection. In general, adversarial data has higher MD compared to original data as shown in Figure 2. Thus, maximizing generates adversarial examples more similar to original examples in terms of MD. is constrained to the log space in order to be consistent with the scale of .
Thus, Data Alignment Loss is represented as
| (1) |
and DALA is trained by optimizing the Data Alignment Loss.
| Dataset | Train | Validation | Type |
|---|---|---|---|
| SST-2 | 67,300 | 872 | Sentiment analysis |
| CoLA | 8,550 | 1,040 | Grammar correctness |
| RTE | 2,490 | 277 | Textual entailment |
| MRPC | 3,670 | 408 | Textual similarity |
5 Evaluation Metrics
ASR
Attack success rate (ASR) is the widely used evaluation metric to assess the performance of attack models. ASR is the percentage of generated adversarial examples that successfully deceive model predictions. We use ASR to maintain consistency with prior work.
NASR
Non-detectable attack success rate (NASR) is a new evaluation metric we defined to assess the detectability of adversarial examples generated by attack methods, which integrates attack success rate (ASR) with out-of-distribution (OOD) detection. NASR posits that the indicative criterion for a successful attack resides in the capacity of an adversarial example to cause failure in the victim model while concurrently eluding OOD detection methods. Thus, NASR is formulated as:
| (2) |
where denotes the set of examples that successfully attack the victim model but are detected by the detection method .
We utilize two established and commonly employed OOD detection techniques: MSP detection Hendrycks and Gimpel and MD detection Lee et al. (2018). MSP detection relies on logits and constitutes a method based on probability distributions, while MD detection is a distance-based approach. Negative MSPs, , are used for MSP detection, and MDs ,, are used for MD detection, where and are the mean and covariance value of the in distribution (training) data respectively.
Adversarial examples are considered as OOD examples (positive), while original examples are considered as in-distribution examples (negative). To detect adversarial examples while avoiding hurting normal examples from a defender’s view, we use the negative MSP and MD value at 99% False Positive Rate of the training data, where values exceeding the threshold are considered positive, and those less than the threshold are considered negative.
6 Experimental Settings
| Dataset | Prompt |
|---|---|
| SST-2 | “Evaluate the sentiment of the given text. Respond with ‘positive’ or ‘negative’ in lowercase, only one word. \nInput: {text}\nAnswer:” |
| CoLA | “Assess the grammatical structure of the given text. Respond with ‘acceptable’ or ‘unacceptable’ in lowercase, only one word.\nInput: {text}\nAnswer:”, |
| RTE | “Assess the relationship between sentence1 and sentence2. Respond with ‘entailment’ or ’not_entailment’ in lowercase, only one word.\nInput: {text}\nAnswer:” |
| MRPC | “Assess whether sentence1 and sentence2 share the same semantic meaning. Respond with ’equivalent’ or ’not_equivalent’ in lowercase, only one word.\nInput: {text} \nAnswer:” |
| Dataset | Model | BERT-base (white-box) | LLaMA2-7b (black-box) | ||||||
|---|---|---|---|---|---|---|---|---|---|
| ACC | ASR | NASR (MSP) | NASR (MD) | ACC | ASR | NASR (MSP) | NASR (MD) | ||
| SST-2 | Original | 92.43 | 90.94 | ||||||
| TextFooler | 4.47 | 95.16 | 53.47 | 91.94 | 69.95 | 23.58 | 22.32 | 23.46 | |
| TextBugger | 29.01 | 68.61 | 37.34 | 66.87 | 84.75 | 7.57 | 7.06 | 7.19 | |
| DeepWordBug | 16.74 | 81.89 | 57.57 | 80.77 | 83.94 | 8.58 | 8.07 | 8.45 | |
| BERT-Attack | 38.42 | 58.44 | 33.62 | 54.96 | 67.55 | 26.36 | 25.22 | 26.10 | |
| DALA | 21.10 | 77.17 | 54.22 | 75.06 | 65.83 | 28.37 | 27.74 | 27.87 | |
| COLA | Original | 81.21 | 72.77 | ||||||
| TextFooler | 1.92 | 97.64 | 95.63 | 94.92 | 35.95 | 53.49 | 53.49 | 51.25 | |
| TextBugger | 12.18 | 85.01 | 81.23 | 77.69 | 44.68 | 42.16 | 42.03 | 38.21 | |
| DeepWordBug | 7.09 | 91.26 | 88.78 | 86.19 | 37.01 | 55.86 | 55.86 | 52.57 | |
| BERT-Attack | 12.46 | 84.65 | 79.22 | 79.93 | 44.01 | 42.29 | 42.16 | 40.32 | |
| DALA | 2.78 | 96.58 | 93.74 | 93.27 | 35.67 | 56.52 | 56.13 | 52.96 | |
| RTE | Original | 72.56 | 55.60 | ||||||
| TextFooler | 1.44 | 98.01 | 68.66 | 79.60 | 53.07 | 6.49 | 5.19 | 3.90 | |
| TextBugger | 2.53 | 96.52 | 68.66 | 83.08 | 53.79 | 3.25 | 1.95 | 0.65 | |
| DeepWordBug | 4.33 | 94.03 | 79.60 | 88.06 | 52.71 | 5.19 | 4.55 | 3.25 | |
| BERT-Attack | 3.61 | 95.02 | 67.16 | 72.64 | 47.65 | 14.29 | 13.64 | 9.74 | |
| DALA | 1.08 | 98.51 | 72.14 | 86.07 | 44.40 | 20.13 | 17.53 | 10.39 | |
| MRPC | Original | 87.75 | 68.63 | ||||||
| TextFooler | 2.94 | 96.65 | 58.38 | 91.62 | 65.93 | 8.57 | 5.36 | 7.14 | |
| TextBugger | 7.35 | 91.60 | 62.85 | 87.15 | 68.14 | 3.57 | 3.21 | 2.14 | |
| DeepWordBug | 10.05 | 88.55 | 72.35 | 86.31 | 66.42 | 5.36 | 4.64 | 3.93 | |
| BERT-Attack | 9.56 | 89.11 | 55.31 | 80.17 | 64.71 | 8.93 | 6.79 | 8.21 | |
| DALA | 0.74 | 99.16 | 74.86 | 93.29 | 63.73 | 11.43 | 8.21 | 9.29 | |
6.1 Baselines
We use two character-level attack methods: DeepWordBug and TextBugger, and two word-level attack methods: TextFooler and BERT-Attack.
DeepWordBug Gao et al. (2018) uses two scoring functions to determine the most important words and then adds perturbations through random substation, deletion, insertion, and swapping letters in the word while constrained by the edit distance.
TextBugger Jinfeng et al. (2019) finds important words through the Jacobian matrix or scoring function, and then uses insertion, deletion, swapping, substitution with visually similar words, and substitution with semantically similar words.
TextFooler Jin et al. (2020) uses the prediction change before and after deleting the word as the word importance score and then replaces each word in the sentence with synonyms until the prediction label of the target model changes.
BERT-Attack Li et al. (2020) finds the vulnerable words through logits from the target model and then uses BERT to generate perturbations based on the top-K predictions.
6.2 Datasets
We evaluate DALA on four different types of tasks. Data statistics are shown in Table 1.
SST-2 The Stanford Sentiment Treebank Socher et al. (2013) is a binary sentiment classification task. It consists of sentences extracted from movie reviews with human-annotated sentiment labels.
CoLA The Corpus of Linguistic Acceptability Warstadt et al. (2019) contains English sentences extracted from published linguistics literature, aiming to check grammar correctness.
RTE The Recognizing Textual Entailment dataset Wang et al. (2019a) is derived from a combination of news and Wikipedia sources, aiming to determine whether the given pair of sentences entail each other.
MRPC The Microsoft Research Paraphrase Corpus Dolan and Brockett (2005) comprises sentence pairs sourced from online news articles. These pairs are annotated to indicate whether the sentences are semantically equivalent.
6.3 Implementation Details
For each experiment, the fine-tuning phrase is executed for a total of 20 epochs. The learning rate is searched from . 30% of the tokens are masked during the fine-tuning phrase. The rank of the update matrices of LoRA is set to 8; LoRA scaling factor is 32; LoRA dropout value is set as 0.1. The inference termination condition is set as 40% of the tokens. The prompts used for LLaMA2-7b on four datasets are shown in Table 2. The hyperparameters are shown in Table 4.
All the BERT-base related experiments are conducted on two NVIDIA GeForce RTX 3090ti GPUs, and the LLaMA2-7b related experiments are conducted on two NVIDIA RTX A5000 24GB GPUs.
| SST-2 | CoLA | RTE | MRPC | |
|---|---|---|---|---|
| batch size | 128 | 128 | 32 | 128 |
| learning rate | 1e-4 | 5e-5 | 1e-5 | 1e-3 |
| % masked tokens | 30 | 30 | 30 | 30 |
7 Experimental Results
We design experiments to compare the performance of DALA and baselines on four datasets when attacking the BERT-base model. We also conduct experiments to attack the black-box LLaMA2-7b model to assess the transferability of attack methods on Large Language Models (LLMs), as LLMs like LLaMA2 are of interest to the NLP community. Besides, we conduct an ablation study and utilize visualization to analyze the effectiveness of different components of .
Our experiments aim to answer three research questions: RQ1: Will DALA attack effectively on BERT-base? RQ2: Are generated adversarial examples transferable to the black-box LLaMA2-7b model? RQ3: How does each loss component affect DALA?
7.1 Attack Effectiveness (RQ1, RQ2)
We use the adversarial examples generated by our method to attack the white-box BERT-base models finetuned on the corresponding dataset, which are accessible during our fine-tuning phase, and the black-box zero-shot LLaMA-7b model. The experimental results on ACC, ASR, and NASR compared with baselines are shown in Table 3.
When attacking the white-box models, DALA obtains the best or close-to-best performance regarding ACC, ASR, and NASR on COLA, RTE, and MRPC datasets. On SST-2 dataset, although DALA’s performance is not the best, the NASR (MSP) and NASR (MD) of DALA experience a relatively smaller decrease under ASR compared with baselines, implying that the adversarial examples generated by DALA are harder to detect. Aside from DALA, some baseline methods like TextFooler work well on some datasets. However, NASR (MSP) of TextFooler on SST-2 and MRPC drops drastically compared to ASR, indicating that these adversarial examples are relatively easy to detect using MSP detection.
When attacking the black-box LLaMA-7b model, DALA consistently performs superior across all datasets, outperforming baselines in every evaluation metric.
The experimental results indicate that our method yields reasonable and commendable outcomes when attacking a white-box model, and the results remain favorable when considering detectability. When generalizing the generated adversarial examples to the black-box LLaMA-7b model, our model exhibits a substantial advantage compared to other models.
| Dataset | Model | ACC | ASR | MSP | |
| NASR | DR | ||||
| SST-2 | Original | 92.43 | |||
| BERT-Attack | 38.42 | 58.44 | 33.62 | 42.46 | |
| DALA | 21.10 | 77.17 | 54.22 | 29.74 | |
| (w/o MSP) | 1.61 | 98.26 | 47.27 | 51.89 | |
| COLA | Original | 81.21 | |||
| BERT-Attack | 12.46 | 84.65 | 79.22 | 6.42 | |
| DALA | 2.78 | 96.58 | 93.74 | 2.93 | |
| (w/o MSP) | 2.11 | 97.40 | 93.15 | 4.36 | |
| RTE | Original | 72.56 | |||
| BERT-Attack | 3.61 | 95.02 | 67.16 | 29.32 | |
| DALA | 1.08 | 98.51 | 72.14 | 26.77 | |
| (w/o MSP) | 1.08 | 98.51 | 70.65 | 28.28 | |
| MRPC | Original | 87.75 | |||
| BERT-Attack | 9.56 | 89.11 | 55.31 | 37.93 | |
| DALA | 0.74 | 99.16 | 74.86 | 24.51 | |
| (w/o MSP) | 0.74 | 99.16 | 73.18 | 26.20 | |
| Dataset | Model | ACC | ASR | MD | |
| NASR | DR | ||||
| SST-2 | Original | 92.43 | |||
| BERT-Attack | 38.42 | 58.44 | 54.96 | 5.94 | |
| DALA | 21.10 | 77.17 | 75.06 | 2.73 | |
| (w/o MD) | 15.60 | 83.13 | 80.77 | 2.84 | |
| COLA | Original | 81.21 | |||
| BERT-Attack | 12.46 | 84.65 | 79.93 | 5.58 | |
| DALA | 2.78 | 96.58 | 93.27 | 3.42 | |
| (w/o MD) | 2.30 | 97.17 | 90.55 | 6.80 | |
| RTE | Original | 72.56 | |||
| BERT-Attack | 3.61 | 95.02 | 72.64 | 23.56 | |
| DALA | 1.08 | 98.51 | 86.07 | 12.63 | |
| (w/o MD) | 1.08 | 98.51 | 85.57 | 13.13 | |
| MRPC | Original | 87.75 | |||
| BERT-Attack | 9.56 | 89.11 | 80.17 | 10.03 | |
| DALA | 0.74 | 99.16 | 93.29 | 5.9 | |
| (w/o MD) | 1.72 | 98.04 | 90.22 | 7.98 | |
7.2 Ablation Study (RQ3)
To analyze the effectiveness of different components of the Data Alignment Loss, we conduct an ablation study on BERT-base. The results of the ablation study are shown in Table 5 and Table 6.
MSP Loss
We replace as during the fine-tuning phase to assess the efficacy of .
helps improve MSP NASR and Detection Rate (DR), which is the ratio of and the number of the set of all successful adversarial examples, across all the datasets. One interesting finding is that on SST-2 and CoLA, while the model with performs better in terms of ASR, the situation deteriorates when considering detectability, leading to lower NASR and higher Detection Rate compared to the model with .
MD Loss
We replace as during the fine-tuning phase to assess the efficacy of .
helps improve the MD Detection Rate (DR), which is the ratio of and the number of the set of all successful adversarial examples, across all the datasets, and MD NASR on all the datasets except SST-2. A similar finding on CoLA also exists on the comparison between the model with and the model with .
BERT-Attack
Considering DALA and BERT-Attack are both transformer-based methods utilizing BERT-base as the backbone model, we compare NASR and DR of BERT-Attack and our method, evaluating the effectiveness of our . From the results, we can conclude that DALA outperforms BERT-Attack across all the datasets for both MSP and MD evaluation metrics, demonstrating the capability of .
7.3 Loss Visualization (RQ3)
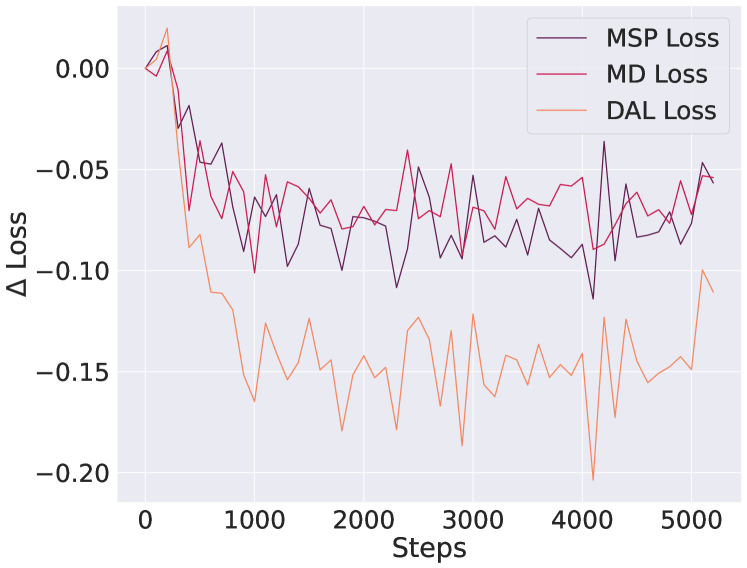
To enhance the understanding of how different loss components contribute to DALA during model fine-tuning, we visualize the change of , , and during the fine-tuning of DALA on SST-2 dataset in Figure 4.
All three losses exhibit oscillating descent and converge. While the overall trends of and are consistent, upon closer examination of these two losses at each step, we observe that they often exhibit opposite trends at the individual step level, especially in the initial steps. Despite these two losses sharing a common key objective of decreasing the disparities between adversarial examples and original examples, this observation reveals a possible trade-off relationship between these two losses. One possible interpretation is that from a certain perspective, the objective of minimizing is generally aligned with that of the attack task; the objective of minimizing is relaxedly similar to the objective of the masked language modeling task. The former objective is to generate adversarial examples, while the latter objective is to make the generated sentences closely resemble the original ones. These two objectives are not inherently conflicting. However, from an extreme standpoint, when the latter objective is fully satisfied, meaning the model generates exactly the same examples as the original ones, the former objective naturally becomes untenable.
8 Conclusion
We analyze the adversarial examples generated by previous attack methods and find that distribution disparities exist between adversarial examples and original examples in terms of MSP and MD. Thus, we propose a Distribution-Aware LoRA-based Adversarial Attack (DALA) method with the Data Alignment Loss (DAL) and introduce a novel evaluation metric, NASR, which incorporates OOD detection into consideration within a successful attack. Our experiments validate the attack effectiveness of ASR and NASR of DALA on both BERT-base and the black-box LLaMA2-7b.
References
- Adila and Kang (2022) Dyah Adila and Dongyeop Kang. 2022. Understanding out-of-distribution: A perspective of data dynamics. In I (Still) Can’t Believe It’s Not Better! Workshop at NeurIPS 2021, pages 1–8. PMLR.
- Arora et al. (2021) Udit Arora, William Huang, and He He. 2021. Types of out-of-distribution texts and how to detect them. In 2021 Conference on Empirical Methods in Natural Language Processing, EMNLP 2021, pages 10687–10701. Association for Computational Linguistics (ACL).
- Belinkov and Bisk (2018) Yonatan Belinkov and Yonatan Bisk. 2018. Synthetic and natural noise both break neural machine translation. In International Conference on Learning Representations.
- Dolan and Brockett (2005) William B. Dolan and Chris Brockett. 2005. Automatically constructing a corpus of sentential paraphrases. In Proceedings of the Third International Workshop on Paraphrasing (IWP2005).
- Gao et al. (2018) Ji Gao, Jack Lanchantin, Mary Lou Soffa, and Yanjun Qi. 2018. Black-box generation of adversarial text sequences to evade deep learning classifiers. In 2018 IEEE Security and Privacy Workshops (SPW), pages 50–56.
- Garg and Ramakrishnan (2020) Siddhant Garg and Goutham Ramakrishnan. 2020. BAE: BERT-based adversarial examples for text classification. In Proceedings of the 2020 Conference on Empirical Methods in Natural Language Processing (EMNLP), pages 6174–6181, Online. Association for Computational Linguistics.
- Goyal et al. (2023) Shreya Goyal, Sumanth Doddapaneni, Mitesh M. Khapra, and Balaraman Ravindran. 2023. A survey of adversarial defenses and robustness in nlp. ACM Comput. Surv., 55(14s).
- (8) Dan Hendrycks and Kevin Gimpel. A baseline for detecting misclassified and out-of-distribution examples in neural networks. In International Conference on Learning Representations.
- Hu et al. (2021) Edward J Hu, Phillip Wallis, Zeyuan Allen-Zhu, Yuanzhi Li, Shean Wang, Lu Wang, Weizhu Chen, et al. 2021. Lora: Low-rank adaptation of large language models. In International Conference on Learning Representations.
- Iyyer et al. (2018) Mohit Iyyer, John Wieting, Kevin Gimpel, and Luke Zettlemoyer. 2018. Adversarial example generation with syntactically controlled paraphrase networks. In Proceedings of the 2018 Conference of the North American Chapter of the Association for Computational Linguistics: Human Language Technologies, Volume 1 (Long Papers), pages 1875–1885, New Orleans, Louisiana. Association for Computational Linguistics.
- Jia and Liang (2017) Robin Jia and Percy Liang. 2017. Adversarial examples for evaluating reading comprehension systems. In Proceedings of the 2017 Conference on Empirical Methods in Natural Language Processing, pages 2021–2031, Copenhagen, Denmark. Association for Computational Linguistics.
- Jin et al. (2020) Di Jin, Zhijing Jin, Joey Tianyi Zhou, and Peter Szolovits. 2020. Is bert really robust? a strong baseline for natural language attack on text classification and entailment. Proceedings of the AAAI Conference on Artificial Intelligence, 34(05):8018–8025.
- Jinfeng et al. (2019) Li Jinfeng, Ji Shouling, Du Tianyu, Li Bo, and Wang Ting. 2019. Textbugger: Generating adversarial text against real-world applications. Proceedings 2019 Network and Distributed System Security Symposium.
- Lee et al. (2018) Kimin Lee, Kibok Lee, Honglak Lee, and Jinwoo Shin. 2018. A simple unified framework for detecting out-of-distribution samples and adversarial attacks. Advances in neural information processing systems, 31.
- Li et al. (2020) Linyang Li, Ruotian Ma, Qipeng Guo, Xiangyang Xue, and Xipeng Qiu. 2020. BERT-ATTACK: Adversarial attack against BERT using BERT. In Proceedings of the 2020 Conference on Empirical Methods in Natural Language Processing (EMNLP), pages 6193–6202, Online. Association for Computational Linguistics.
- Liu et al. (2020) Weitang Liu, Xiaoyun Wang, John Owens, and Yixuan Li. 2020. Energy-based out-of-distribution detection. Advances in neural information processing systems, 33:21464–21475.
- Perez et al. (2022) Ethan Perez, Saffron Huang, Francis Song, Trevor Cai, Roman Ring, John Aslanides, Amelia Glaese, Nat McAleese, and Geoffrey Irving. 2022. Red teaming language models with language models. In Proceedings of the 2022 Conference on Empirical Methods in Natural Language Processing, pages 3419–3448, Abu Dhabi, United Arab Emirates. Association for Computational Linguistics.
- Ren et al. (2021) Jie Ren, Stanislav Fort, Jeremiah Liu, Abhijit Guha Roy, Shreyas Padhy, and Balaji Lakshminarayanan. 2021. A simple fix to mahalanobis distance for improving near-ood detection. arXiv preprint arXiv:2106.09022.
- Ren et al. (2022) Jie Ren, Jiaming Luo, Yao Zhao, Kundan Krishna, Mohammad Saleh, Balaji Lakshminarayanan, and Peter J Liu. 2022. Out-of-distribution detection and selective generation for conditional language models. In The Eleventh International Conference on Learning Representations.
- Ren et al. (2019) Shuhuai Ren, Yihe Deng, Kun He, and Wanxiang Che. 2019. Generating natural language adversarial examples through probability weighted word saliency. In Proceedings of the 57th Annual Meeting of the Association for Computational Linguistics, pages 1085–1097, Florence, Italy. Association for Computational Linguistics.
- Ribeiro et al. (2020) Marco Tulio Ribeiro, Tongshuang Wu, Carlos Guestrin, and Sameer Singh. 2020. Beyond accuracy: Behavioral testing of NLP models with CheckList. In Proceedings of the 58th Annual Meeting of the Association for Computational Linguistics, pages 4902–4912, Online. Association for Computational Linguistics.
- Socher et al. (2013) Richard Socher, Alex Perelygin, Jean Wu, Jason Chuang, Christopher D. Manning, Andrew Ng, and Christopher Potts. 2013. Recursive deep models for semantic compositionality over a sentiment treebank. In Proceedings of the 2013 Conference on Empirical Methods in Natural Language Processing, pages 1631–1642, Seattle, Washington, USA. Association for Computational Linguistics.
- Song et al. (2021) Liwei Song, Xinwei Yu, Hsuan-Tung Peng, and Karthik Narasimhan. 2021. Universal adversarial attacks with natural triggers for text classification. In Proceedings of the 2021 Conference of the North American Chapter of the Association for Computational Linguistics: Human Language Technologies, pages 3724–3733, Online. Association for Computational Linguistics.
- Sun et al. (2022) Yiyou Sun, Yifei Ming, Xiaojin Zhu, and Yixuan Li. 2022. Out-of-distribution detection with deep nearest neighbors. In International Conference on Machine Learning, pages 20827–20840. PMLR.
- Wallace et al. (2019) Eric Wallace, Shi Feng, Nikhil Kandpal, Matt Gardner, and Sameer Singh. 2019. Universal adversarial triggers for attacking and analyzing NLP. In Proceedings of the 2019 Conference on Empirical Methods in Natural Language Processing and the 9th International Joint Conference on Natural Language Processing (EMNLP-IJCNLP), pages 2153–2162, Hong Kong, China. Association for Computational Linguistics.
- Wang et al. (2019a) Alex Wang, Amanpreet Singh, Julian Michael, Felix Hill, Omer Levy, and Samuel R. Bowman. 2019a. GLUE: A multi-task benchmark and analysis platform for natural language understanding. In the Proceedings of ICLR.
- Wang et al. (2019b) Shuo Wang, Yang Liu, Chao Wang, Huanbo Luan, and Maosong Sun. 2019b. Improving back-translation with uncertainty-based confidence estimation. In Proceedings of the 2019 Conference on Empirical Methods in Natural Language Processing and the 9th International Joint Conference on Natural Language Processing (EMNLP-IJCNLP), pages 791–802, Hong Kong, China. Association for Computational Linguistics.
- Warstadt et al. (2019) Alex Warstadt, Amanpreet Singh, and Samuel R. Bowman. 2019. Neural network acceptability judgments. Transactions of the Association for Computational Linguistics, 7:625–641.
- Xiao et al. (2020) Tim Z Xiao, Aidan N Gomez, and Yarin Gal. 2020. Wat zei je? detecting out-of-distribution translations with variational transformers. arXiv preprint arXiv:2006.08344.
- Zhao et al. (2018) Zhengli Zhao, Dheeru Dua, and Sameer Singh. 2018. Generating natural adversarial examples. In International Conference on Learning Representations.
Appendix A Observation Experiments
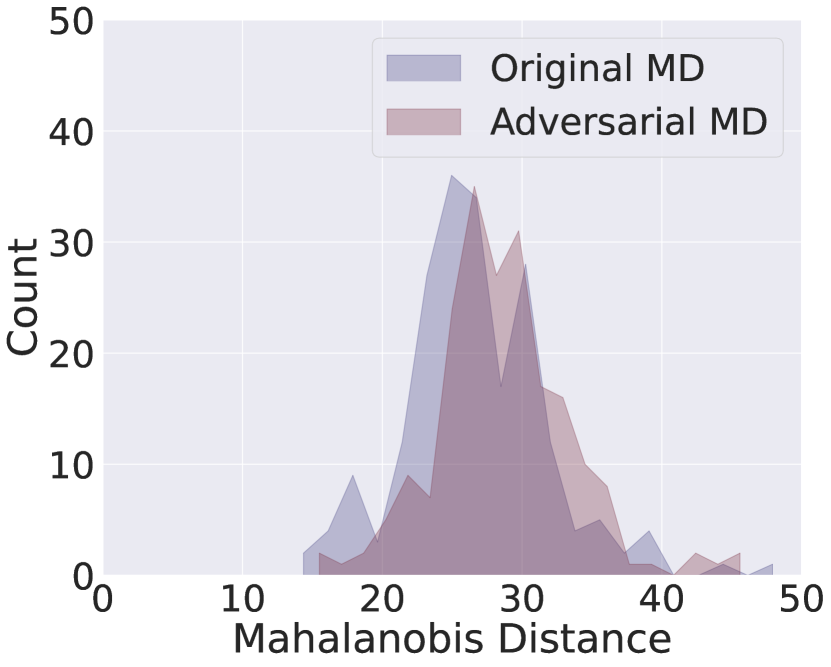
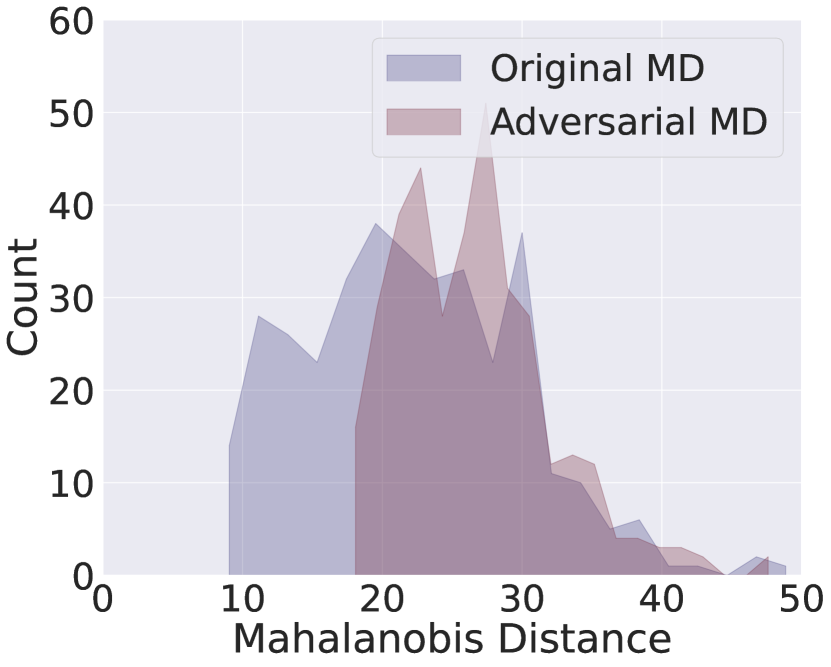
The observation experiments on previous attack methods TextFooler, TextBugger, DeepWordBug, and BERT-Attack are shown in Figure 5, Figure 6, Figure 7, Figure 8, Figure 9, Figure 10, Figure 11, and Figure 12.
The distribution disparities between adversarial examples and original examples are more obvious in terms of MSP across all the datasets. The distribution disparities between adversarial examples and original examples in terms of MD are clear only on SST-2 dataset and MRPC dataset. Although this disparity is not always present in terms of MD, it is imperative to address this issue given its presence in certain datasets.