Carbon Responder: Coordinating Demand Response for the Datacenter Fleet
Abstract
The increasing integration of renewable energy sources results in fluctuations in carbon intensity throughout the day. To mitigate their carbon footprint, datacenters can implement demand response (DR) by adjusting their load based on grid signals. However, this presents challenges for private datacenters with diverse workloads and services. One of the key challenges is efficiently and fairly allocating power curtailment across different workloads. In response to these challenges, we propose the Carbon Responder framework.
The Carbon Responder framework aims to reduce the carbon footprint of heterogeneous workloads in datacenters by modulating their power usage. Unlike previous studies, Carbon Responder considers both online and batch workloads with different service level objectives and develops accurate performance models to achieve performance-aware power allocation. The framework supports three alternative policies: Efficient DR, Fair and Centralized DR, and Fair and Decentralized DR. We evaluate Carbon Responder polices using production workload traces from a private hyperscale datacenter. Our experimental results demonstrate that the efficient Carbon Responder policy reduces the carbon footprint by around 2x as much compared to baseline approaches adapted from existing methods. The fair Carbon Responder policies distribute the performance penalties and carbon reduction responsibility fairly among workloads.
I Introduction
Hyperscale datacenters consumed tens of terawatt hours of energy in 2022 [25, 48, 49, 6]. Energy consumption for technology companies, such as Google and Meta, doubled from 2017 to 2020 [25, 48]. This rapid growth has motivated datacenters to reduce their operational carbon with supply-side solutions that emphasize clean energy supply. They have invested in renewable energy generation and storage to offset datacenter consumption as well as developed renewable energy contracts and credits to track those offsets [24, 15]. However, supply-side solutions incur embodied carbon costs: the carbon footprint from manufacturing wind/solar farms and batteries. These solutions become prohibitively expensive when datacenters must compute through periods of scarce renewable energy supply from intermittent sources such as wind and solar. For example, datacenters may need to increase wind and solar investments by an additional to increase the percentage of hourly carbon-free compute from 95% to 99% than from 0% to 95% [2].
More effective solutions must coordinate supply and demand, adjusting datacenter activity in response to the energy grid’s carbon intensity, i.e. implement demand response (DR). DR in the context of datacenters means deferring computation or degrading quality-of-service when carbon intensity is high. Equally important, it boosts computation when carbon intensity is low, ensuring deferred tasks dequeue rather than accumulate across time. Such load shifting can effectively reduce carbon emissions by leveraging the significant variation in a power grid’s carbon intensity.
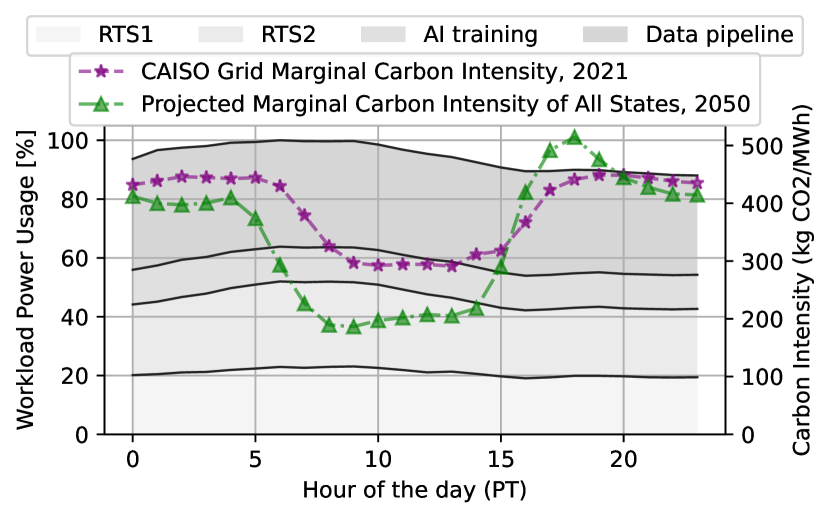
For example, Figure 1 presents the normalized power usage of a cluster consisting of four workloads and illustrates the marginal carbon intensity111We choose the projected carbon intensity of all States for illustration, while the predicted carbon intensity of California shows the same variation. based on the California grid (CAISO) data in 2021 [57] and the projected trend for 2050 [17]. Marginal carbon intensity is the carbon footprint of the power plant at the margin of the grid’s dispatch stack: If electricity demand increases, the marginal power plant increase generation and, if demand falls, it would be the first plant to reduce generation. Figure 1 indicates the peak-to-trough difference in marginal carbon intensity is significant. The trough can be as low as 66% of the peak in today’s grid. Moreover, because fluctuations in carbon intensity are anticipated to increase, the trough can be as low as 40% of the peak by 2050 [18]. Another analysis projects even greater growth in solar energy supply, leading to periods of zero marginal carbon intensity by 2050 [5]. Furthermore, in today’s grids substantial renewable energy generated is curtailed – i.e. goes to waste. For instance, in California in 2022, 29 million megawatts were curtailed, amounting to 4.4% of solar and wind generation [1]. In China 15% of renewable energy was curtailed in 2019 [8]. With increased renewable adoption, oversupplies issues due to the intermittent nature of renewable energy are expected to be more frequent. This trend underscores the immense potential for datacenters to reduce carbon and utilize the renewable energy better through demand response.
Despite its benefits, demand response is particularly challenging when the datacenter fleet supports a diverse mix of batch and realtime workloads — Which workloads should respond when carbon-free energy is scarce, by how much, and when? To address these questions, we propose a framework — Carbon Responder (CR) — that integrates representative workload models with expressive demand response policies. CR analyzes the impact of demand response for individual workloads and unifies these impacts into a common measure of performance loss. This permits CR to compare performance costs and sustainability benefits from power adjustments across workloads. We develop DR policies for both realtime and batch workloads with varying Service Level Objectives (SLOs222 An SLO specifies the deadline by which a batch job should be completed.), accounting for their relative sensitivity to power allocation based on production datacenter traces. In contrast, prior DR studies focus exclusively on batch workloads and make simplifying assumptions about performance loss (e.g., 20% of power is deferrable within a 24-hour period without any loss) [2, 50, 38].
Moreover, we propose a family of sustainability-aware policies for CR. Subject to operational carbon targets, policies differ in their objectives. Some seek efficiency by minimizing the datacenter’s aggregate performance loss when adjusting power (Efficient DR) whereas others seek fairness by balancing losses across workloads based on their performance models (Fair DR). Policies also differ in their implementation. Centralized policies formulate an optimization to be solved whereas distributed policies formulate mechanisms to incentivize participation from selfish agents. We explore the policy space and assess sustainability, performance efficiency, and fairness trade-offs.
Using Carbon Responder, we evaluate a variety of demand response policies with production workload traces from a private hyperscale datacenter. Our experimental results demonstrate that the three CR policies exhibit an inherent trade-off between efficiency and fairness. When compared to baseline approaches adapted from existing works, the efficient Carbon Responder policy achieves a carbon footprint reduction of 1.5x to 2x given the same performance degradation. In addition, the fair Carbon Responder policies distribute the performance penalties and carbon reduction responsibility more fairly among workloads than most baselines.
II Datacenter Demand Response
| Related work | Objective | Allocation | Providing Fairness Options | ||||||||||
|---|---|---|---|---|---|---|---|---|---|---|---|---|---|
| Problem statement |
|
|
|
|
|||||||||
| OLDI [45] | DC Power efficiency | Proportionality | Realtime | Even split | ✓ | ✗ | |||||||
| eBuff [26] | DC Power capping | Electricity cost | Realtime | Not applicable | ✓ | ✗ | |||||||
| Dynamo [59] | DC Power capping | Peak power | Realtime | Priority rank based on perf impace | ✗ | ✗ | |||||||
| Pricing DR [43] | Grid-level DR | Competitive ratio | Batch | Not applicable | ✗ | ✓ | |||||||
| AQA [65] | Job-level DR | Electricity cost | Batch | Not applicable | ✓ | ✗ | |||||||
| Google [50] | DC DR | Carbon and peak | Batch | Priority tiers based on SLOs | ✗ | ✗ | |||||||
| Our model | DC DR | Carbon and perf | Batch & Realtime | Optimization based apportioning | ✓ | ✓ | |||||||
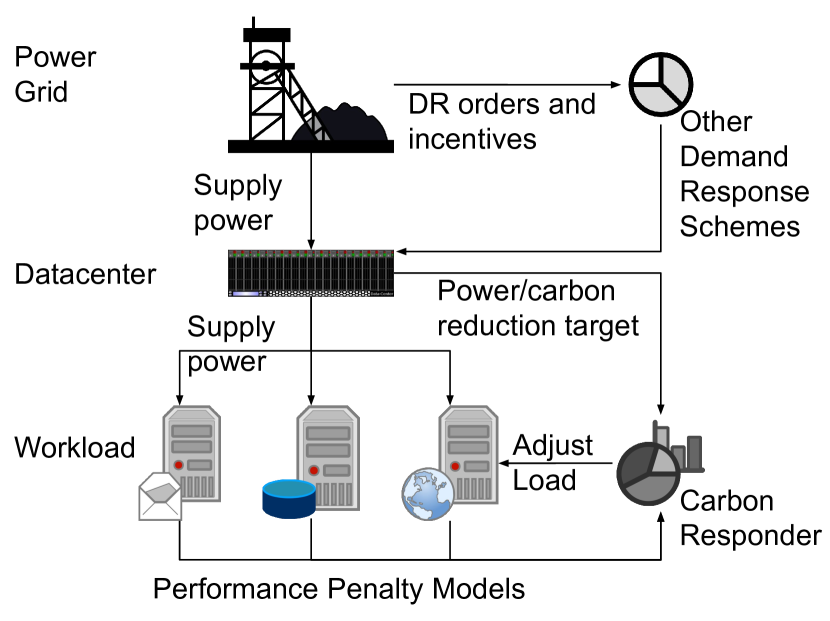
DR Abstraction Layers. Demand response requires well defined interfaces between the grid, datacenter, and workloads as illustrated in Figure 2. At the grid-datacenter interface, the grid supplies power for the datacenter’s hundreds of thousands of machines. The grid also provides signals about its supply and carbon intensity (e.g., energy prices, curtailment requests), which could permit intelligent datacenter demand response. At the datacenter-workload interface, the datacenter sets a power or carbon reduction objective and achieves it by scheduling workloads and modulating their energy demands.
Many prior demand response studies focus on the grid-datacenter interface [43, 3, 50]. They treat the datacenter as a large consumer and assume some power usage can be deferred without penalty. Other DR papers, in contrast, schedule batch jobs directly in response to grid signals, neglecting or breaking abstraction layers [22, 21, 42, 65]. The abstractions and assumptions of those work hinder their use for datacenters with heterogeneous users and workloads.
Datacenter DR must consider several dimensions of the management problem. First, DR must define an optimization objective that formalizes the outcome sought when curtailing power. The outcome may be some combination of reductions in energy cost, peak power, and operational carbon. Second, DR must implement an allocation procedure that determines how power curtailments are distributed across heterogenous workloads. Finally, DR may wish to account for fairness and the contributions of individual workloads toward the datacenter’s broader sustainability goal.
II-A Objective – Datacenter Demand Response for Carbon
Table I compares related work with our proposed Carbon Responder framework. Studies such as [43, 65] focus on demand response programs provided by power grids for grid reliability. On the other hand, [45, 26, 59] explore datacenter power capping, which has potential implications for datacenter carbon reduction. Note that datacenter DR goes beyond traditional power capping by rescheduling computation to periods when carbon intensity is low.
There exists significant opportunity for carbon-informed datacenter demand response. Figure 1 indicates that grid carbon intensity varies significantly while datacenter power usage stays relatively stable. Modern datacenters exhibit little hourly variation in energy usage because they schedule computation to maximize utilization of their installed compute capacity and infrastructure [16]. These time series suggest DR must re-discover time-varying demands for servers and align that demand with the grid’s renewable energy supply.
II-B Allocation – Apportioning Power Adjustments
In hyperscale datacenters, apportioning power adjustments to heterogeneous and diverse workloads is challenging. Prior studies avoid this challenge by focusing DR on a single workload or category of workloads. Many focus on batch workloads [50, 65, 4, 42] while others focus on real-time workloads [26, 59]. However, this narrow focus is neither sufficient nor efficient for several reasons.
First, no single class of workloads can adjust enough power to align datacenter demand with fluctuations in energy supply and carbon intensity. When most of the datacenter’s power is attributed to online workloads, modulating only delay-tolerant, batch workloads would be insufficient for sustainability and incur prohibitive perforamnce losses. For example, 30-40% of Google’s workloads are delay-tolerant with a 24-hour SLO [56] and 20-30% of Meta’s are delay-tolerant with varying SLOs [3]. Although 70% of Microsoft’s Azure workloads are labeled delay-tolerant, the degree of tolerance is unspecified [12].
II-C Fairness and Incentives
Fairness and incentives play a crucial role in the allocation of power adjustments across workloads, particularly in private datacenters where teams have their own capacity entitlements and dedicated job scheduling frameworks. The studies discussed thus far neglect fairness, in part, because they lack performance models for heterogeneous workloads, cannot assess performance outcomes, and cannot quantify associated fairness implications [50]. Thus, they could not assess the performance outcomes and the associated fairness implications.
Incentives may be required to encourage teams and their workloads to adjust power. However, research on DR in private hyperscale datacenters has largely overlooked the role of incentives, despite some ideas in using markets to allocate system resources [9, 28, 62]. Prior studies neglect incentives, in part, because they assume a centralized scheduler can compel DR within the datacenter, as exemplified by Google’s use of Borg to the number of available CPUs when carbon intensity is high [50].
III Carbon Responder
To achieve efficient and fair carbon reduction in private hyperscale datacenters, we propose Carbon Responder (CR) — a carbon-based demand response framework that focuses on the datacenter-workload interface in Figure 2. Based on the current practices of our hyperscale datacenter, CR specifically focus on the operational carbon emissions attributed to the datacenter’s consumption of grid power, assuming no batteries, or on-site renewable energy generation [26, 14]. It treats the datacenter as a collection of heterogeneous workloads and designs DR based on the performance characteristics of those workloads, rather than modeling the datacenter as a monolithic consumer [43, 3, 50]. Furthermore, CR shields users and their workloads from the grid’s complexity and departs from prior studies that neglect or break these abstractions [7, 22, 21, 42].
III-A Framework Design
CR recognizes that modulating datacenter power requires models of performance-power trade-offs and policies governing efficiency-fairness trade-offs. Figure 3 illustrates its two major contributions. First, CR trains models that quantify penalties when implementing demand response for diverse workloads. These models capture the relationship between power allocation and diverse measures of performance and service quality. Power allocations affect processor utilization, which in turn affect performance. Performance metrics vary by workload type (i.e., batch or real-time). Carbon Responder aggregates individual workload characteristics to model the relationship between power and performance for the entire datacenter.
Second, CR balances penalties incurred against carbon reduced when determining how much each workload should contribute towards the datacenter’s DR objective. Carbon Responder optimizes how workloads modulate power use, minimizing performance penalties across all workloads. Carbon Responder provides different policies to trade-off efficiency and fairness.
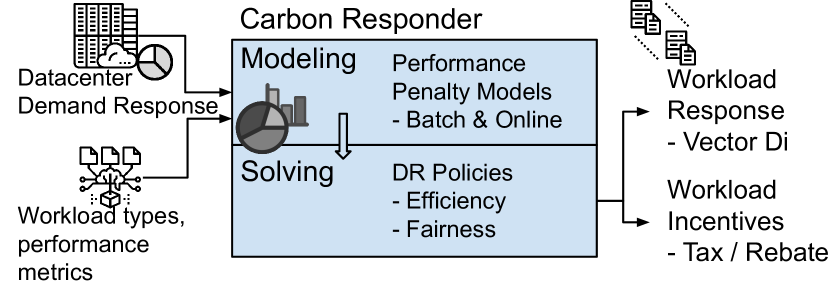
Carbon Responder takes as input workloads’ measurements, which detail power usage and performance outcomes, and the datacenter’s DR objectives. It learns the Performance Penalty Function (Section IV) given the behavior of each workload’s scheduler. Based on the penalty function and a fairness policy, Carbon Responder outputs optimized power adjustments for each workload and details methods to enforce them (Section V). The adjustment determines each workload’s performance penalty, power usage, and contribution to operational carbon. Load adjustments are executed daily, while the CR performance modeling pipeline can be scheduled weekly or only subsequent to significant application updates to accommodate any application changes.
III-B Supporting Diverse Workloads
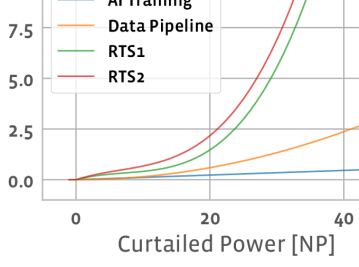
Carbon Responder extracts flexibility from both batch and real-time workloads, unlike previously proposed solutions. For each additional unit of power required for DR adjustment, Carbon Responder identifies the workload with the smallest marginal performance penalty. When Carbon Responder adjusts power usage, different types of workloads are affected differently as illustrated in Figure 4.
Real-time. For real-time workloads, increasing power curtailments may degrade quality of the service and harm user engagement. In contrast, decreasing curtailments can improve service as workloads opportunistically exploit additional compute.
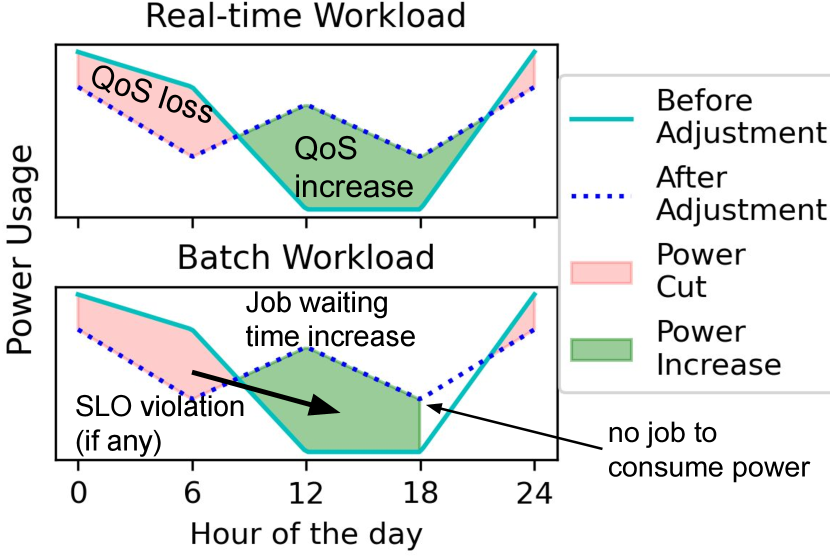
Batch without SLOs. Batch jobs are often assumed to be delay-tolerant with no penalty. For example, AI training must be completed but do not have a strict deadline. For batch jobs without SLOs, Carbon Responder models the DR penalty as the job’s total waiting time [27].
Carbon Responder ensures the queue of deferred jobs does not accumulate across multiple days. If is the workload adjustment for hour , then . Figure 4 shows how jobs deferred during DR (red, ) are rescheduled later (green, ) such that jobs complete within the day.
Batch with SLOs. In production systems, many batch jobs specify landing times. These jobs are often part of a data analysis pipeline and their completion times affect downstream jobs. Penalties arise when completion times extend beyond the landing time and violate the SLO. We measure penalties in terms of tardiness, the amount of extra time required beyond the landing time. Figure 4 shows that DR causes some deferred jobs to incur a tardiness penalty while others might meet their SLOs. Carbon Responder models total performance penalty associated with DR as a function of the red area.
Carbon Responder’s approach to workload elasticity is novel. Prior studies often take a macro view of workloads and make simplifying assumptions. Studies with batch jobs often assume they can be deferred arbitrarily and without penalty as long as jobs complete within 24 hours[43, 50], neglecting penalties from violating SLOs and landing times. Other studies with real-time jobs assume that SLOs can be relaxed by some percentage [59, 26, 38], again neglecting penalties. Studies that model performance and power trade-offs as we do [30, 51, 10], envision neither DR nor coordination between real-time and batch services.
IV Workload Performance and Penalty Models
| Services | Description | Category | SLO | |||||||
|---|---|---|---|---|---|---|---|---|---|---|
|
|
Batch |
|
|||||||
|
|
Batch | No SLO | |||||||
| RTS1 |
|
Realtime | QoS based | |||||||
| RTS2 |
|
Realtime | QoS based |
| Required Input | Source of Input |
|---|---|
| Power usage of each service before load adjustment | Daily average of power usage from production workloads in hyperscale datacenters. |
| Performance penalty functions of online workloads | Adapted from the results of performance profiling in Dynamo (§ IV-A1) [59]. |
| Performance penalty functions of batch workloads | Machine learning on production workload traces (§ IV-A2). |
| Weights in penalty functions | Aligning performance penalty with entitlement loss when capping 15% capacity (§ III). |
| Marginal carbon intensity of grid power | Daily average from CAISO 2021 (kg CO2/MWh) obtained from WattTime [57]. |
Model Input. The model’s input is a vector of hourly adjustments to power load based on one metric and two concepts: Normalized Power (NP), Power Capacity Entitlement, and Physical Power Usage. NP is the unit of power used by datacenter provisioning teams in place of Watts. Power capacity is the workload’s maximum permissible power usage and represents an entitlement to computational resources. Power usage is the workload’s actual power usage.
Let denote power usage for workload across time, and denote load curtailment vector measured in terms of power usage. Positive indicates a load decrease (e.g., means workload reduces load by 5 NP at time ) whereas negative indicates a load increase. Adjustments are relative to baseline load such that is the difference in power usage with and without DR.
Model Output. The model’s output is the penalty that arises from hourly adjustments to power load. Carbon Responder first uses machine learning to calculate DR’s performance loss and then scales performance loss into an equivalent loss in power capacity.
The first step accounts for unique, workload-specific measures of performance. The second step establishes a datacenter-wide measure of penalty, permitting comparisons across heterogeneous workloads. It models a linear relationship between losses in power capacity and performance, calculating the scaling weight as the power capacity loss divided by the performance loss.
IV-A Modeling Heterogeneous Workloads
Without loss of generality, we illustrate and apply Carbon Responder to model four Meta services — Data Pipeline, AI Training, and two different real-time services (RTS1, RTS2)—as detailed in Table II. These four services include the largest and most representative workloads in batch and user-facing computation.
Table III details our data sources and inputs. Power usage data is obtained from a trace of production workloads in a hyperscale datacenter. The trace details daily average power usage over the year 2021, while the job-level traces for AI training and storage comprise 10,000 jobs subsampled within a two-day window. To model batch workload performance, we utilized production data. To model batch workloads, we use production data. To model real-time workloads, we use published Dynamo parameters [59] rather than our own experiments to ensure confidentiality.
IV-A1 Real-Time Workloads
RTS1 and RTS2 represent real-time services that must generate timely responses for users. Although real-time services cannot defer their computation, their quality-of-service (QoS) can be reduced in exchange for less power consumption [38]. Dynamo profiles the effect of power capping on web server performance and finds latency is an increasing convex function of the power reduction. Based on Dynamo’s Figure 13 [59], we fit a polynomial function for latency degradation where is the power adjustment expressed as a percentage of usage.
We fit distinct models and based on published median and maximum latency degradation, respectively. These latency models are used to assess penalty from power adjustments . Thus, penalty functions for real-time workloads are:
| (1) |
where and , and the weights are calculated with the methodology specified in the 4th paragraph in Section III.
IV-A2 Batch Workloads
Data Pipeline represents batch workloads with SLOs. These workloads consist of data processing jobs that are critical to other services. Five priority tiers correspond to five SLOs with deadlines of hours. AI Training represents batch workloads without SLOs. These workloads consist of offline training jobs that run within a capacity allocation and without an explicit deadline.
The penalty function for batch services captures how DR lengthens waiting time and induces tardiness. We model waiting time and tardiness as a function of DR adjustments, specifying a regression model with engineered features and fitting that model with Lasso regression333Lasso (Least Absolute Shrinkage and Selection Operator) is a regression method that includes feature selection and regularization. and cross-validation. We obtain training data by implementing a scheduler, simulating schedules under varied processor availabilities, and measuring tardiness. We implement an earliest due date (EDD) scheduler, but Carbon Responder supports any scheduling framework.
Power Adjustment Scheduling Results. First, a linear model estimates the processor availabilities (CPUs/GPUs) based on the power supply. Then, we implement an earliest due date (EDD) scheduler to simulate how processor availabilities influence batch job performance. The simulator’s inputs include hourly energy capacity, server capacity, and a trace of batch jobs. The simulator reports waiting time and tardiness — the waiting time beyond what can be tolerated by the SLO for each job [37].
Scheduling Results Machine Learning Model. The model’s dependent variable is tardiness and waiting time for batch jobs with and without SLOs, respectively. Modeling waiting time directly as a function of load adjustment is a naive starting point, producing the simple penalty function: However, this model uses too many features. And it neglects the cumulative impact of curtailed power; jobs delayed in previous hours are queued which lengthen the waiting time in every hour they remain queued. This naive model fits poorly and we can do better with engineered features.
| Feature | Equation |
|
|
|||||
|---|---|---|---|---|---|---|---|---|
|
✗ | ✗ | ||||||
|
✓ as | ✓ as | ||||||
|
✗ | ✓ as | ||||||
|
✓ as | ✗ | ||||||
|
N/A | ✗ |
To incorporate more meaningful features into our machine learning model, we derive the total waiting time and its variations as independent variables. These features are outlined in Table IV, where denotes the positive part of , given by , and represents the total number of jobs for workload at time .
The first feature we investigate is the cumulative waiting time of all jobs, as indicated in the first row of Table IV. The terms in the inner sum estimate the number of jobs that are delayed due to power adjustments at time . The inner sum calculates the number of queued jobs at time by accumulating the delayed jobs from all previous hours. Taking the positive part of the sum ensures that the queue length is non-negative. The outer sum aggregates the queue length per hour over all hours in the schedule, providing a measure of the total waiting time.
Similarly, the second feature examines cumulative waiting time with regard to power usage (NP) instead of the number of jobs. This feature quantifies the total delayed power usage in units of (), while the first feature is measured in units of (). The third feature considers the convex relationship between power cut and waiting time. To capture this convexity, we introduce a squared term as a potential feature. The fourth feature estimates the total number of jobs affected by power curtailment, offering a non-cumulative measure to assess the impact of demand response. The final feature accounts for tardiness and represents the number of jobs queued for more than a specified Service Level Objective (SLO) threshold (SLO hours). It quantifies the total overdue hours for jobs that have waited more than the SLO threshold.
We collect training data by generating diverse curtailment vectors , scheduling jobs from Meta, and measuring the model’s inputs (features) and outputs (tardiness). Diverse curtailments are sampled with a random walk [63], using only those where average curtailment is positive.
We train the machine learning model using Lasso. It regularizes when fitting coefficients, using hyperparameter to balance minimizing residuals and constraining the magnitude of the coefficients; is set with ten-fold cross-validation.
Table IV specifies features selected for batch workloads. We specify separate models with different variables for batch workloads with SLOs (Data pipeline) and without (AI training). The dependent variable is tardiness and waiting time for batch jobs with and without SLOs, respectively.
| Workload | # Samples | # Features selected | 10-Fold Cross Validation | |||
|---|---|---|---|---|---|---|
|
|
R2 | ||||
| AI Training | 303 | 2 | 150.0 | 24.7 | 0.789 | |
| Data pipeline | 162 | 2 | 39.2 | 14.3 | 0.864 | |
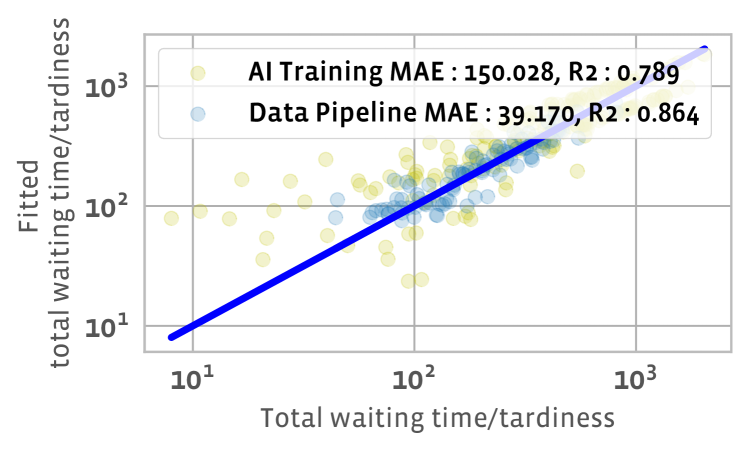
The regression effectively models batch workload’s performance penalty as a function of adjustment. Table V demonstrates a good model fit. Figure 5 illustrates accurate predictions, plotting fitted penalties against measured ones. With specified in Table IV, penalty functions for batch workloads are:
| (2) |
V Datacenter Demand Response Policies
Carbon Responder models heterogeneous workloads and enables DR policy, which apportions power adjustments across heterogeneous workloads. We propose several policy options that differ in optimization objectives and efficiency-fairness trade-offs. Moreover, we compare these policies against prior studies that have taken varied perspectives on datacenter DR, which are detailed in Table I. These prior studies are not directly comparable because they target unique characteristics of different abstraction layers, datacenters, and workloads. Nonetheless, where possible, we adapt these policies and formulate the corresponding DR optimization rigorously.
V-A Carbon Responder Policies
Carbon Responder supports three policies that balance efficiency and fairness differently. The precise nature of this balance determines how Carbon Responder formulates and optimizes power adjustments. The formulation, in turn, determines how the datacenter enforces or incentivizes users to participate in DR and contribute to power adjustments.
For demand response, the decision variable is a matrix of hourly power adjustments for each workload . Let denote aggregate performance losses and denote the change in operational carbon footprint, which corresponds to the inner product of marginal carbon intensity and power adjustment).
CR1 – Efficient DR apportions datacenter-wide power adjustments across workloads to minimize performance costs and carbon footprint . Hyperparameter supports varied performance and carbon trade-offs. Smaller values of emphasize carbon reductions at the expense of performance, producing larger power adjustments.
| (3) |
Efficient DR may induce unfairness as workloads with greater power efficiency, and thus smaller performance losses from DR, will experience larger curtailments. To enhance fairness, we consider two additional policies.
CR2 – Fair and Centralized DR ensures each workload makes an equal contribution to datacenter-wide power adjustments. When workloads all cap power by the same percentage, denoted by cap%, each workload will suffer individual performance losses . The CR2 policy minimizes operational carbon while ensuring performance loss for each workload is consistent with the loss from equal power caps .
| (4) |
CR2 uses equal power caps as a reference for fairness but does not actually cap power. Instead, CR2 determines power adjustments that minimize carbon subject to performance constraints that are deemed fair under hypothetical, equal power caps. It adjusts power allocations for individual workloads independently until their performance losses equal those associated with power capping at . This approach is preferable to simply equalizing losses across workloads (i.e., ), which can vary significantly in scale.
Both CR1 and CR2 rely on centralized enforcement. Each workload must implement prescribed adjustments through workload-specific hardware or software mechanisms. Non-compliance leads to an indiscriminate reduction in power capacity, which subsequently decreases power usage and penalizes performance. This enforcement mechanism ensures workloads adhere to the DR plans.
CR3 – Fair and Decentralized DR encourages participation in power adjustments with decentralized implementation, using taxes and rebates, rather than centralized enforcement. First, the policy ensures initial taxes are collected fairly (i.e. with same tax rate) across workloads. Then, the policy offers rebates to workloads that reduce carbon through DR. For each workload, a tax reduces its power capacity whereas rebates offset the tax. Users and their workloads are motivated to earn rebates, which increase their final power allocations. Each user has an equal opportunity to earn rebates by adjusting power usage.
Using taxes and rebates to reduce and increase power capacity, respectively, can be formulated as decentralized optimization. Let denote workload ’s initial power capacity entitlement. Let and denote tax paid and rebate received, respectively. The workload’s net power entitlement after adjusting for taxes and rebates is thus . Carbon Responder imposes three constraints on CR3’s power optimization.
First, we constrain actual hourly usage such that it does not exceed workload ’s net entitlement. Larger rebate relaxes power constraints imposed by tax , thereby improving performance.
| (5) |
We also ensure fiscal balance such that rebates offered to workloads are covered by taxes collected across workloads. Thus, the policy does not create or require extra power capacity.
| (6) |
Finally, for fairness, each workload is taxed equally at the beginning but receives differentiated rebates based on its contribution to DR.
| (7) |
For example, in Optimization 8, workloads are taxed and must relinquish some percentage of their initial power capacity entitlements (e.g., 20% of ). Workloads are then offered rebates based on their participation in DR and contribution to carbon reductions (i.e., ). With decentralized optimization, each workload determines its in to minimize its performance degradation subject to 5–7.
| (8) |
As a workload contributes more to DR, it earns a larger rebate that relaxes power constraints and improves performance. On the other hand, as the workload contributes less to DR, rebates that permit power usage in other hours of the day may be insufficient to offset performance losses. Thus, a workload should optimally increase DR contributions until these effects balance and the marginal increase in performance from a marginal increase in DR is zero.
V-B Baseline Policies
Our baselines are derived from notable prior research, which encompass different design options. B1 and B2 represent simple and optimized power capping mechanisms, respectively [26]. B3 and B4 distinguish between diverse workload types, using either heuristics or optimization to reduce carbon. These power capping baselines, adapted from Meta and Google’s studies [59, 50], were originally intended for reducing power costs and mitigating power emergencies but can be used to reduce carbon as well.
B1 – Proportional Power Capping reduces datacenter power usage by setting power caps or limits as a fraction of their power capacity and ensuring this fraction is equal for all workloads such that This policy calculates hourly adjustments to power usage so that each workload conforms to its cap.
| (9) |
We sweep hyperparameter to quantify this policy’s performance and carbon trade-offs. As power capping becomes more aggressive, the policy will produce larger performance penalties and carbon reductions.
B2 – Performant Power Capping reduces datacenter power to minimize combined peak usage and performance loss. Peak power usage after DR is because is workload ’s hourly power usage. This policy uses workload models from Section IV to optimally set differentiated power caps for each workload as follows
Note that is a matrix of power adjustments for workload and hour . We sweep hyperparameter to quantify this policy’s performance and carbon-trade-offs. As increases, the policy favors performance at the expense of power and carbon reductions.
This policy is inspired by eBuff [26], which shaves power peaks with a policy that balances reductions in electricity bills with losses in performance. Note that eBuff’s policy is applied to one workload at a time and lacks a strategy for apportioning power curtailments to a mix of heterogeneous workloads.
B3 – Prioritized Power Capping employs priority-based heuristics for power capping. It protects batch workloads and curtails only real-time workloads, reducing their power usage based on a pre-defined priority order while ensuring reductions never exceed a pre-defined maximum cut. The priority order and maximum cut for each real-time workload is established by a human operator.
For instance, suppose real-time workload has higher priority than and the maximum allowable power cut for both is 20%. B3 will first curtail ’s power usage down to 80% of its power cap and then curtail ’s. Curtailments are determined as earlier in Equation 9. As and are curtailed, performance deteriorates and carbon decreases, creating a trade-off.
This strategy is derived from Dynamo [59], which sets varying power caps for each front-end cluster based on a priority order of services. Interestingly, Dynamo finds that real-time workloads experience negligible performance degradation when servers are subject to power capping. This finding is explained by over-provisioned power buffers for real-time workloads, which ensures constant, high-quality service [59]. This finding motivates a priority order that caps real-time workloads and trims buffers before capping batch workloads.
B4 – Load Shaping schedules workloads to balance performance and carbon. It protects real-time workloads and curtails only batch workloads while ensuring their SLOs. This policy minimizes the weighted sum of carbon and daily peak power as follows.
We sweep hyperparameter to quantify this policy’s performance and carbon-trade-offs. As increases, the policy favors performance at the expense of power and carbon reductions.
Such a policy is similar to that in Google’s study of datacenter DR [50], which assumes real-time workloads have low tolerance for power capping [50], protects them from demand response, and predominantly adjusts power usage for batch workloads. Other power oversubscription and capping schemes from Google [53] and Microsoft [39] suggest capping only non-production, non-critical workloads, which would produce power caps similar to B4’s.
V-C Constraints
In solving the associated optimization problem, both Carbon Responder and the baseline policies adhere to two constraints: the total capacity constraint and batch preservation.
Firstly, the result of Demand Response (DR) should not exceed the datacenter’s total power capacity. If it does, the DR policy would necessitate additional machines, thereby leading to an increased embodied carbon footprint, which would undermine the DR’s objectives. Based on observations from our hyperscale datacenter practices, we assume that the datacenter maintains a 20% buffer capacity that remains unused. Consequently, the total capacity is set to 120% of the peak power usage, derived from the summation of power usage across the four workloads. Mathematically, this ensures that the peak power post-DR remains within the total capacity:
| (10) |
Secondly, both Carbon Responder and the baseline policies ensure batch preservation. The policies reschedule hourly power usage but adjustments, for each batch workload, must sum to a non-negative value over the hours in a day.This is crucial to ensure that any delays experienced by batch workloads are not cumulative across days. Regardless of whether SLOs are adhered to or violated, this constraint ensures that batch jobs are executed to completion without indefinite delays.
| (11) |
VI Experimental Evaluation
We evaluate DR policies, quantifying their ability to reduce carbon and examining the fairness of performance losses. First, we show DR dynamics by illustrating Carbon Responder’s load adjustments during a representative day and detailing how rescheduling power usage reduces carbon and impacts performance (§VI-B). Then, we compare DR policies and show Carbon Responder is more efficient than baselines, achieving greater carbon reductions with smaller performance penalties (§VI-C). Finally, we compare DR policies and show Carbon Responder is more fair than baselines based on the dispersion of carbon reductions and performance penalties across workloads (§VI-D-VI-E).
VI-A Experimental Methods
First, Carbon Responder models performance penalties resulting from power adjustments for each workload using equations 1 and 2. We use traces and data from four production workloads detailed in §IV-A.
Second, we implement DR policies with optimization to determine load adjustment . We solve optimization problems with Scipy’s Sequential Least Squares Programming. Optimization determines power adjustments for a two-day interval, allowing us to determine whether a policy delays batch jobs beyond 24 hours. Optimization is offline and day-ahead, which aligns with methods in prior work [50]. We limit curtailments to at most half the workload’s original power capacity entitlement, which accounts for the fact that idle power typically constitutes half of a server’s total power usage and Carbon Responder does not presently power down servers.
Finally, we calculate carbon reductions for the two-day interval as the inner product of vectors for marginal carbon intensity and power reductions (§V). We process CAISO data to quantify marginal and average carbon intensity [57]. Carbon Responder can support the analysis of other balancing authorities and geographical locations by drawing on other EIA data [5]. We assess Carbon Responder against baseline policies based on their carbon reduction and performance losses. Carbon reduction is normalized by the total operational carbon, while the performance losses are measured by the percentage of equivalent power capacity losses.
The datacenter’s baseline power capacity is at the scale of many tens of megawatts. And the datacenter’s baseline operational carbon is at the scale of thousands of metric tons of CO2 for the two-day interval. For confidentiality, our evaluation reports carbon and power reductions as a percentage of baselines without DR. Percentages range from 1% to 8%, which correspond to carbon and power reductions at the scale of tens of metric tons of and multiple megawatts, respectively.
VI-B Carbon and Power Dynamics
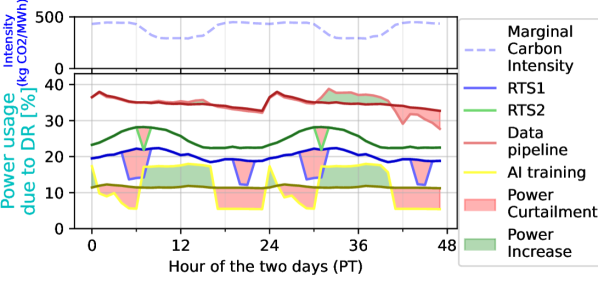
Figure 7 illustrates hourly marginal carbon intensity and power usage before and after Carbon Responder. Lines present data for four workloads. Red and green areas between lines indicate negative and positive power adjustments, respectively. Adjustment is calculated using CR1 and Optimization 3. Collectively, the four workloads reduce operational carbon by 4.6% and suffer a performance loss equivalent to a 4% reduction in their power capacity.
Real-time workloads reduce power usage (i.e., red adjustments) and degrade performance. RTS1 can tolerate reduced power and consistently curtails usage when carbon intensity is high, reducing carbon by 2.6% and degrading performance by an equivalent of 2.9% in power capacity. RTS2 suffers higher performance losses from DR and curtails usage less often, reducing carbon by only 0.4% and degrading performance by an equivalent of 0.7% in power capacity.
Batch workloads defer power (i.e., red and green adjustments), shifting it to hours of low carbon intensity. AI training and data pipeline workloads defer jobs from the 6pm–8am window to the 8am–6pm window, reducing carbon by and while degrading performance by only 0.2% and 0.3%.
Figure 7 visualizes outcomes from policy CR1 with . The next section explores other policies and hyperparameters that could further reduce carbon or preserve performance.
VI-C Efficiency and Fairness
We evaluate the efficiency of carbon-informed DR based on its ability to reduce datacenter carbon while mitigating performance losses. By adjusting policies’ hyperparameters (e.g., , cap%, and ), we can obtain different DR outcomes and trade-offs between carbon and performance.
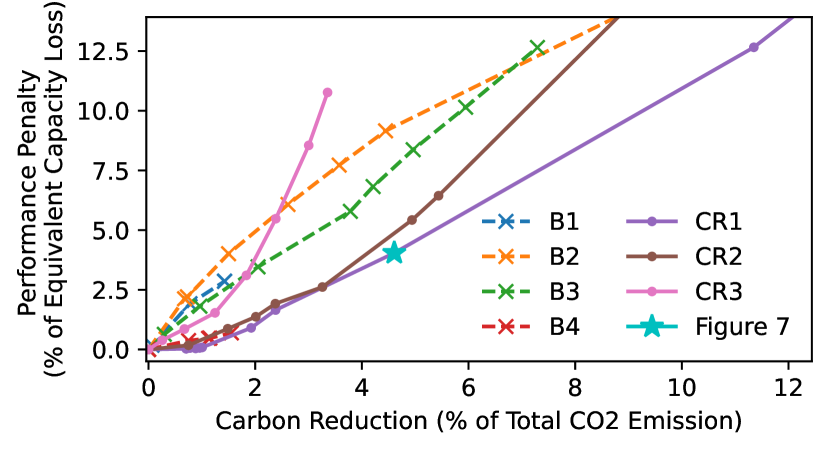
Figure 8 illustrates Pareto frontiers for baseline and Carbon Responder policies. The x-axis represents carbon reductions, while the y-axis represents the total performance losses incurred, both as a percentage of numbers without DR. Upward-sloping curves indicate that as a policy reduces carbon more aggressively, performance losses increase.
Efficiency versus Fairness. Policies with frontiers located on the lower right of the figure eliminate more carbon for the same level of performance loss, making them more efficient than those located on the upper left. For instance, when the performance loss ranges from 1% to 5%, CR1 eliminates twice as much carbon as baselines B1-B4.
CR1 is most efficient followed by CR2 and B4 (i.e., red line near origin). Optimization 3 and its weighted sum minimizes carbon under varied constraints on performance loss, thereby establishing an upper bound on efficiency. CR1 is globally optimal and efficient. Unfortunately, it is also unfair.
CR2 minimizes carbon under varied constraints on fairness, performing well initially but eventually suffering from an inevitable trade-off between efficiency and fairness. CR3 suffers from a more severe version of this trade-off. Its Pareto frontier rises more quickly than CR2’s because it uses decentralized incentives (i.e., tax and rebate), which allow workloads to make independent DR decisions but harm efficiency.
Limits of Baseline Policies. When comparing the baseline policies to Carbon Responder, we observe that B1, B2, and B3 are less efficient compared to CR1 and CR2. We analyze B1 without the batch preservation constraint. Otherwise, B1 would have terminated at the yellow start in Figure 8, indicating its inability to adjust power under the constraint. B2, despite having been designed to be performant, incurs a greater performance loss. This can be attributed to B2’s additional objective of peak shaving and the constraint of batch preservation, which limits its efficiency. B4 is not at all effective at DR for carbon reduction. It only curtails batch workloads in accordance with their SLOs, resulting in negligible carbon reductions and performance losses because batch workloads without SLOs constitute a small share of our datacenter’s total workload (Fig. 1).
VI-D Service-Level Analysis
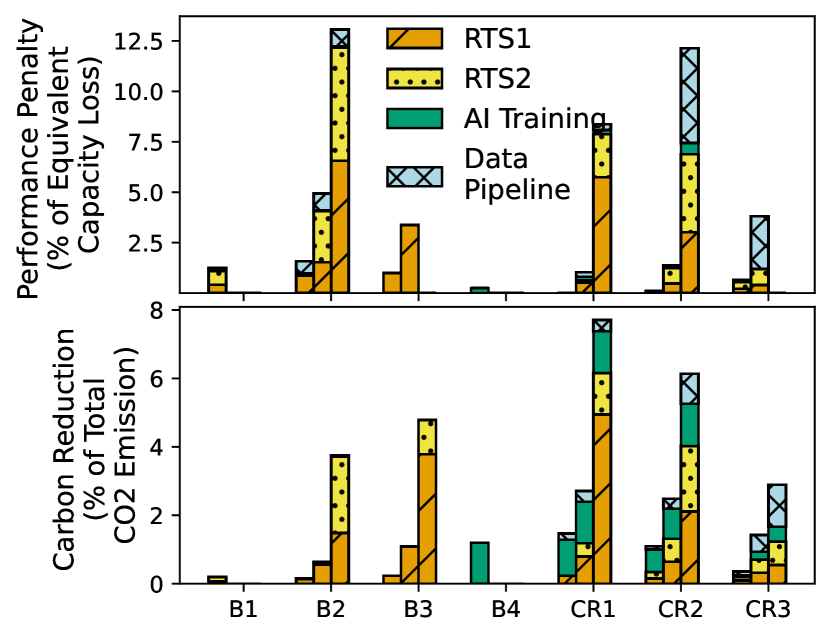
We assess the distribution of carbon reductions and performance losses across services and workloads. The upper subplot of Figure 9 details performance losses for each policy and service when the datacenter uses demand response to reduce carbon by 0.5%, 2%, and 8%. Similarly, the lower subplot details carbon reductions. The absence of bars for B3, B4, and CR3 indicate their inability to achieve target carbon reductions or satisfy performance constraints.
Performance Loss. In the upper subplot of Figure 9, CR1 minimizes total performance penalty and its bars represent the most efficient distribution of those penalties. In contrast, CR2 emphasizes fairness and imposes performance penalties based on each workload’s allocation of power capacity. Compared to CR1, CR2 allocates more penalties to RTS2 than RTS1 because RTS2 has a higher power capacity. Note that AI training and data pipeline’s penalties are not exactly proportional to their power capacity due to constraints imposed by batch preservation. Finally, the upper subplot does not illustrate CR3’s fairness because the policy defines fairness in terms of taxes and rebates rather than performance outcomes.
Carbon Reduction. The lower subplot of Figure 9 presents the breakdown of carbon reductions. Compared to CR1, CR2 distributes carbon reductions more evenly across workloads. Although CR3 reduces total carbon by less than the first two policies, it distributes those reductions in rough proportion to each workload’s power capacity, thereby achieving the most equitable allocation of responsibilities across workloads.
Baseline policies exhibit varying levels of efficiency and fairness. B1’s proportional power capping is fair, in the distributions of both performance losses and carbon reductions, but also inefficient because power capping ignores time-varying carbon intensity. B2 is similarly inefficient, power capping only real-time workloads because their performance is relatively resilient to caps. On the other hand, B3 and B4 exclusively curtail either real-time or batch workloads, producing both unfair performance distributions and insufficient carbon reductions.
VI-E Fairness
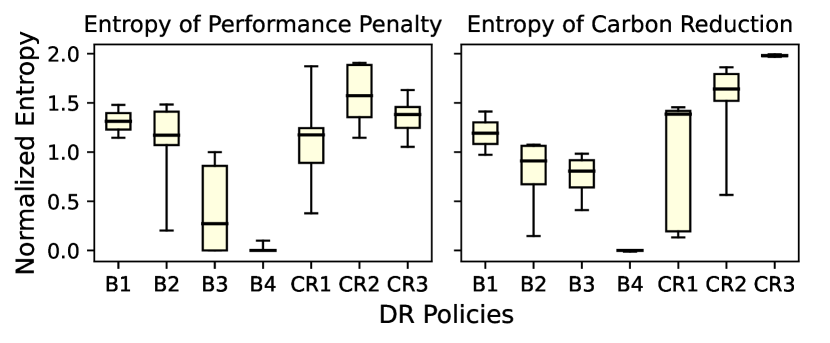
We explicitly evaluate fairness by measuring Shannon entropy, which is
for a discrete distribution . We consider four workloads () for which greater entropy indicates a more equitable distribution. Entropy has a maximum value of 2, which corresponds to a perfectly fair, uniform distribution.
We calculate entropy by scaling performance loss and carbon reduction by each workload’s power capacity such that or . With this scaling, entropy aligns carbon breakdowns or performance losses and workloads’ respective allocations of power capacity. Specifically, when performance losses or carbon reductions are directly proportional to the power capacity, entropy reaches the maximum value of 2.
Figure 10 illustrates how closely performance losses and carbon reductions of workloads align with their power capacity under each policy. The entropy distribution of each policy was calculated by varying their hyperparameters, following the same data points as shown in Figure 8. The Box-and-whisker plots present the 1st, 2nd, and 3rd quartiles for entropy, while the whiskers extend to the minimum and maximum values. A higher box height in the plot indicates a greater degree of fairness in the policy, while shorter boxes and whiskers indicate less variability and more consistent fairness results across different hyperparameters.
Policies B1, CR2, and CR3 emerge as the most fair policies due to their equal treatment of workloads. B1 applies proportional caps to all workloads, resulting in fair albeit inefficient DR. CR2 defines optimization constraints that achieves fair outcomes for performance losses. CR3 defines an incentive mechanism that rewards workloads for DR contributions, thereby achieving fair outcomes for carbon reductions.
Policies that neglect fairness report low entropy. Policies B2 and CR1 optimize for performance and carbon without accounting for fairness. B3 and B4 discriminate between workloads and curtail power based on workload type.
VI-F Increasing Potential in the Future
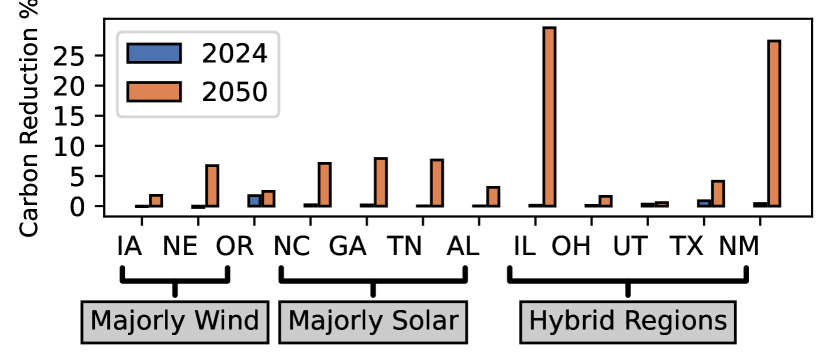
Figure 11 demonstrates the significant potential of carbon-aware DR due to the growing variations of grid carbon intensities. Fixing the load adjustments as depicted in Figure 7, Figure 11 showcases the hypothetical carbon reduction of datacenters achieved thereby in 2024 and 2050. Each state exhibits different levels of potential benefits, influenced by their predicted carbon-free energy availability in 2024 and 2050[17]. The bars in Figure 11 represent a lower bound on the carbon reduction for 2024 and 2050, as it employs the load shift from today (Figure 7) rather than re-optimizing the load adjustments with CR. The substantial increase in carbon reduction from 2024 to 2050 can be attributed to the growing variations in carbon intensity across most states As the deployment of solar energy continues to expand, it leads to a remarkable surge in carbon reduction achieved through Carbon Responder.
VII Discussion and Related Work
We are motivated by prior work in supply function bidding [35, 61] as well as DR aggregators that both curtail and defer load [55].
Demand Response (DR). Markets use monetary payments to align incentives between the grid and consumers [58, 43, 66]. Markets also incentivize co-located tenants to collaboratively reduce carbon [33, 32, 34, 52]. However, these works require well-defined markets with payment in dollars at the grid level or within shared datacenters [60, 33]. Within the datacenter fleet of a company, there is no prior work in modeling performance elasticity and defining DR payment. Datacenter carbon-aware DR adjusts hourly power capacity depending on the grid’s carbon intensity [36, 44, 50]. Carbon-aware job schedulers can account for time-varying capacity constraints [46, 20, 63] or green energy availability [21]. Similarly, cloud applications can be provisioned with carbon-awareness by employing integer programming techniques that impose constraints on the usage of carbon-intensive grid energy [13]. However, these studies lack techniques for apportioning curtailments across heterogeneous batch and online workloads.
Performance/Power Management. Prior studies model datacenter performance to calculate capacity and improve power efficiency [11, 19, 31, 40, 41, 45, 64]. Their models optimize processor and power utilization with performance targets, usually with SLAs based on queuing theory [11, 19, 31]. However, power efficiency is not equivalent to carbon reduction because DR leverages the intermittency of renewable energy and shift power demand accordingly [54].
Net Zero and Renewable Energy Credits. Today’s datacenters often procure wind and solar projects, generating renewable energy credits (RECs) that allow them to offset their annual carbon footprints [15, 24, 49]. Such procurements facilitate claims of being 100% powered by renewable energy. However, these claims, when examined on an hourly basis, reveal that a datacenter’s energy consumption can frequently surpass the amount of procured renewables. At these times, the datacenter’s energy is only as green as the grid’s broader carbon intensity.
Operational vs. Embodied Carbon Footprint. While embodied carbon dominates in battery-operated systems, operational carbon remains significant in datacenters [29]. According to the 2023 Meta and Google Sustainability Reports, without carbon offsetting (i.e., location-based approach), operational carbon comprises 41% and 79% of their total respective datacenter carbon footprints [47, 23]. However, with annual renewable offsetting (i.e., market-based approach), operational carbon was greatly reduced to 1% and 54% respectively, making the carbon footprint predominantly embodied. With hourly renewable offsetting, we use the open-source Carbon Explorer framework and calculated a 40-75% decrease (depending on the region characteristics) in operational carbon. Furthermore, since a portion of the embodied footprint is coming from electricity consumed during manufacturing, optimizing for both operational and embodied carbon is important.
Embodied Carbon in Demand Response. Demand response, particularly the CR methodology, operates within current server capacities, preventing additional embodied carbon footprints. Even when demand response entails extra servers, the overall carbon footprint can still decrease. Carbon Explorer’s recent findings affirm this, demonstrating that incorporating the embodied carbon of extra servers still results in a net reduction of carbon footprint in various regions [2].
VIII Conclusion
We presented Carbon Responder, a datacenter DR framework that addresses the challenges of carbon-informed DR in private datacenters supporting diverse workloads. We extend demand response to include both realtime and batch workloads with varying service level objectives, accounting for their sensitivity to power allocation. We introduce a family of performance-aware DR policies, exploring the trade-offs between efficiency, fairness, and carbon reduction. Experimental results demonstrate that the efficient CR policy achieves a remarkable carbon footprint reduction of 1.5x to 2x compared to baseline approaches, while the fair CR policies distribute responsibilities more equitably among workloads.
Beyond specific numbers for performance-carbon tradeoffs, CR’s contribution is exploring the space of DR policies and highlighting inherent challenges overlooked in prior research. Without a thorough analysis of performance implications and a commitment to fairly distributing DR among diverse workloads, realizing DR in hyperscale datacenters remains a lofty ambition. Though the carbon benefit from DR in a realistic datacenter setup may be modest today, it serves as a call to action. We need to design datacenters, hardware, and software with delay tolerance and energy proportionality in mind.
Acknowledgements
We would like to thank Leonardo Piga and Hong-Shuo Chen from Meta for production workload characterization and their feedback on the project. We also thank Kim Hazelwood for supporting this work.
References
- [1] “California ISO - Managing Oversupply.” [Online]. Available: https://www.caiso.com/informed/Pages/ManagingOversupply.aspx
- [2] B. Acun, B. Lee, F. Kazhamiaka, K. Maeng, U. Gupta, M. Chakkaravarthy, D. Brooks, and C. Wu, “Carbon explorer: A holistic framework for designing carbon aware datacenters,” in Proc. Architectural Support for Programming Languages and Operating Systems (ASPLOS), 2023.
- [3] B. Acun, B. Lee, F. Kazhamiaka, A. Sundarrajan, K. Maeng, M. Chakkaravarthy, D. Brooks, and C.-J. Wu, “Carbon Dependencies in Datacenter Design and Management,” in HotCarbon’22, UC San Diego campus, La Jolla, California, 2022. [Online]. Available: https://research.facebook.com/publications/carbon-dependencies-in-datacenter-design-and-management/
- [4] B. Acun, B. Lee, K. Maeng, M. Chakkaravarthy, U. Gupta, D. Brooks, and C.-J. Wu, “A Holistic Approach for Designing Carbon Aware Datacenters,” arXiv:2201.10036 [cs, eess], Jan. 2022, arXiv: 2201.10036. [Online]. Available: http://arxiv.org/abs/2201.10036
- [5] U. E. I. Administration”, “Annual energy outlook 2023,” https://www.eia.gov/outlooks/aeo/narrative/index.php, 2023.
- [6] Amazon, “Delivering progress every day: Amazon’s 2021 sustainability report,” Tech. Rep., 2021.
- [7] W. Buchanan, J. Foxon, D. Cooke, S. Iyer, E. Graham, B. DeRusha, C. Binder, K. Chiu, H. Richardson, V. Knight, A. Hussain, and N. Mathews, “Carbon-aware computing: Measuring and reducing the carbon footprint associated with software in execution,” Microsoft Switzerland News Center, Jan. 2023. [Online]. Available: https://news.microsoft.com/de-ch/2023/01/10/carbon-aware-computing-whitepaper/
- [8] A. Bunodiere and H. S. Lee, “Renewable Energy Curtailment: Prediction Using a Logic-Based Forecasting Method and Mitigation Measures in Kyushu, Japan,” Energies, vol. 13, no. 18, p. 4703, Jan. 2020, number: 18 Publisher: Multidisciplinary Digital Publishing Institute. [Online]. Available: https://www.mdpi.com/1996-1073/13/18/4703
- [9] J. Chase, D. Anderson, P. Thakar, A. Vahdat, and R. Doyle, “Managing energy and server resources in hosting centers,” in Proc Symposium on Operating System Principles (SOSP), 2001.
- [10] K.-T. Chen, C.-Y. Huang, P. Huang, and C.-L. Lei, “Quantifying Skype user satisfaction,” ACM SIGCOMM Computer Communication Review, vol. 36, no. 4, pp. 399–410, Aug. 2006. [Online]. Available: https://dl.acm.org/doi/10.1145/1151659.1159959
- [11] Y. Chen, D. Gmach, C. Hyser, Z. Wang, C. Bash, C. Hoover, and S. Singhal, “Integrated management of application performance, power and cooling in data centers,” in 2010 IEEE Network Operations and Management Symposium - NOMS 2010, Apr. 2010, pp. 615–622, iSSN: 2374-9709.
- [12] E. Cortez, A. Bonde, A. Muzio, M. Russinovich, M. Fontoura, and R. Bianchini, “Resource Central: Understanding and Predicting Workloads for Improved Resource Management in Large Cloud Platforms,” in Proceedings of the 26th Symposium on Operating Systems Principles, ser. SOSP ’17. New York, NY, USA: Association for Computing Machinery, 2017, pp. 153–167. [Online]. Available: http://doi.org/10.1145/3132747.3132772
- [13] N. Deng, C. Stewart, D. Gmach, and M. Arlitt, “Policy and mechanism for carbon-aware cloud applications,” in 2012 IEEE Network Operations and Management Symposium, Apr. 2012, pp. 590–594, iSSN: 2374-9709. [Online]. Available: https://ieeexplore.ieee.org/document/6211963
- [14] N. Deng, C. Stewart, and J. Li, “Concentrating renewable energy in grid-tied datacenters,” in Proceedings of the 2011 IEEE International Symposium on Sustainable Systems and Technology, May 2011, pp. 1–6, iSSN: 2378-7260. [Online]. Available: https://ieeexplore.ieee.org/abstract/document/5936855
- [15] Facebook, “Advancing renewable energy through green tariffs,” Tech. Rep., 2021.
- [16] X. Fan, W.-D. Weber, and L. A. Barroso, “Power provisioning for a warehouse-sized computer,” ACM SIGARCH Computer Architecture News, vol. 35, no. 2, pp. 13–23, Jun. 2007. [Online]. Available: https://doi.org/10.1145/1273440.1250665
- [17] P. Gagnon, B. Cowiestoll, and M. Schwarz, “Cambium 2022 Scenario Descriptions and Documentation,” National Renewable Energy Lab.(NREL), Golden, CO (United States), Tech. Rep., 2023. [Online]. Available: https://www.nrel.gov/analysis/cambium.html
- [18] P. Gagnon, E. Hale, and W. Cole, “Long-run marginal emission rates for electricity-workbooks for 2021 cambium data,” National Renewable Energy Laboratory-Data (NREL-DATA), Golden, CO: National Renewable Energy Laboratory, Tech. Rep., 2022.
- [19] A. Gandhi, Y. Chen, D. Gmach, M. Arlitt, and M. Marwah, “Minimizing data center SLA violations and power consumption via hybrid resource provisioning,” in 2011 International Green Computing Conference and Workshops, Jul. 2011, pp. 1–8.
- [20] F. J. Gil-Gala, M. R. Sierra, C. Mencía, and R. Varela, “Genetic programming with local search to evolve priority rules for scheduling jobs on a machine with time-varying capacity,” Swarm and Evolutionary Computation, vol. 66, p. 100944, Oct. 2021. [Online]. Available: https://www.sciencedirect.com/science/article/pii/S2210650221001061
- [21] I. n. Goiri, K. Le, T. D. Nguyen, J. Guitart, J. Torres, and R. Bianchini, “GreenHadoop: leveraging green energy in data-processing frameworks,” in Proceedings of the 7th ACM european conference on Computer Systems, ser. EuroSys ’12. New York, NY, USA: Association for Computing Machinery, 2012, pp. 57–70. [Online]. Available: http://doi.org/10.1145/2168836.2168843
- [22] Í. Goiri, K. Le, M. E. Haque, R. Beauchea, T. D. Nguyen, J. Guitart, J. Torres, and R. Bianchini, “Greenslot: scheduling energy consumption in green datacenters,” in Proceedings of 2011 International Conference for High Performance Computing, Networking, Storage and Analysis, 2011, pp. 1–11.
- [23] Google, “2023 Environmental Report.” [Online]. Available: https://sustainability.google/reports/google-2023-environmental-report/
- [24] Google, “Google’s green PPAs: What, how and why,” Tech. Rep., 2013.
- [25] Google, “Environmental report,” Tech. Rep., 2021.
- [26] S. Govindan, A. Sivasubramaniam, and B. Urgaonkar, “Benefits and limitations of tapping into stored energy for datacenters,” in Proceedings of the 38th annual international symposium on Computer architecture, ser. ISCA ’11. New York, NY, USA: Association for Computing Machinery, Jun. 2011, pp. 341–352. [Online]. Available: https://doi.org/10.1145/2000064.2000105
- [27] R. L. Graham, E. L. Lawler, J. K. Lenstra, and A. H. G. R. Kan, “Optimization and Approximation in Deterministic Sequencing and Scheduling: a Survey,” in Annals of Discrete Mathematics, ser. Discrete Optimization II, P. L. Hammer, E. L. Johnson, and B. H. Korte, Eds. Elsevier, Jan. 1979, vol. 5, pp. 287–326. [Online]. Available: https://www.sciencedirect.com/science/article/pii/S016750600870356X
- [28] M. Guevara, B. Lubin, and B. Lee, “Navigating heterogeneous processors with market mechanisms,” in Proc. Symposium on High-Performance Computer Architecture (HPCA), 2013.
- [29] U. Gupta, Y. G. Kim, S. Lee, J. Tse, H.-H. S. Lee, G.-Y. Wei, D. Brooks, and C.-J. Wu, “Chasing Carbon: The Elusive Environmental Footprint of Computing,” in 2021 IEEE International Symposium on High-Performance Computer Architecture (HPCA), Feb. 2021, pp. 854–867, iSSN: 2378-203X.
- [30] Y. He, S. Elnikety, J. Larus, and C. Yan, “Zeta: scheduling interactive services with partial execution,” in Proceedings of the Third ACM Symposium on Cloud Computing, ser. SoCC ’12. New York, NY, USA: Association for Computing Machinery, Oct. 2012, pp. 1–14. [Online]. Available: https://dl.acm.org/doi/10.1145/2391229.2391241
- [31] J. Heo, P. Jayachandran, I. Shin, D. Wang, T. Abdelzaher, and X. Liu, “OptiTuner: On Performance Composition and Server Farm Energy Minimization Application,” IEEE Transactions on Parallel and Distributed Systems, vol. 22, no. 11, pp. 1871–1878, Nov. 2011, conference Name: IEEE Transactions on Parallel and Distributed Systems.
- [32] M. A. Islam, H. Mahmud, S. Ren, and X. Wang, “Paying to save: Reducing cost of colocation data center via rewards,” in 2015 IEEE 21st International Symposium on High Performance Computer Architecture (HPCA), Feb. 2015, pp. 235–245, iSSN: 2378-203X.
- [33] M. A. Islam, S. Ren, and X. Wang, “GreenColo: A novel incentive mechanism for minimizing carbon footprint in colocation data center,” in International Green Computing Conference, Nov. 2014, pp. 1–8.
- [34] M. A. Islam, X. Ren, S. Ren, A. Wierman, and X. Wang, “A market approach for handling power emergencies in multi-tenant data center,” in 2016 IEEE International Symposium on High Performance Computer Architecture (HPCA), Mar. 2016, pp. 432–443, iSSN: 2378-203X.
- [35] R. Johari and J. N. Tsitsiklis, “Parameterized Supply Function Bidding: Equilibrium and Efficiency,” Operations Research, vol. 59, no. 5, pp. 1079–1089, Oct. 2011, publisher: INFORMS. [Online]. Available: https://pubsonline.informs.org/doi/abs/10.1287/opre.1110.0980
- [36] W. Katsak, I. n. Goiri, R. Bianchini, and T. D. Nguyen, “GreenCassandra: Using renewable energy in distributed structured storage systems,” in 2015 Sixth International Green and Sustainable Computing Conference (IGSC), Dec. 2015, pp. 1–8.
- [37] C. Koulamas, “The Total Tardiness Problem: Review and Extensions,” Operations Research, vol. 42, no. 6, pp. 1025–1041, Dec. 1994, publisher: INFORMS. [Online]. Available: https://pubsonline.informs.org/doi/abs/10.1287/opre.42.6.1025
- [38] A. Krioukov, S. Alspaugh, P. Mohan, S. Dawson-Haggerty, D. E. Culler, and R. H. Katz, “Design and Evaluation of an Energy Agile Computing Cluster,” EECS Department, University of California, Berkeley, Tech. Rep. UCB/EECS-2012-13, Jan. 2012. [Online]. Available: http://www2.eecs.berkeley.edu/Pubs/TechRpts/2012/EECS-2012-13.html
- [39] A. G. Kumbhare, R. Azimi, I. Manousakis, A. Bonde, F. Frujeri, N. Mahalingam, P. A. Misra, S. A. Javadi, B. Schroeder, M. Fontoura, and R. Bianchini, “{Prediction-Based} Power Oversubscription in Cloud Platforms,” 2021, pp. 473–487. [Online]. Available: https://www.usenix.org/conference/atc21/presentation/kumbhare
- [40] J. Li, Z. Li, K. Ren, and X. Liu, “Towards Optimal Electric Demand Management for Internet Data Centers,” IEEE Transactions on Smart Grid, vol. 3, no. 1, pp. 183–192, Mar. 2012, conference Name: IEEE Transactions on Smart Grid.
- [41] M. Lin, A. Wierman, L. L. H. Andrew, and E. Thereska, “Dynamic right-sizing for power-proportional data centers,” in 2011 Proceedings IEEE INFOCOM, Apr. 2011, pp. 1098–1106, iSSN: 0743-166X.
- [42] Z. Liu, Y. Chen, C. Bash, A. Wierman, D. Gmach, Z. Wang, M. Marwah, and C. Hyser, “Renewable and cooling aware workload management for sustainable data centers,” ACM SIGMETRICS Performance Evaluation Review, vol. 40, no. 1, pp. 175–186, 2012. [Online]. Available: http://doi.org/10.1145/2318857.2254779
- [43] Z. Liu, I. Liu, S. Low, and A. Wierman, “Pricing data center demand response,” in The 2014 ACM international conference on Measurement and modeling of computer systems, ser. SIGMETRICS ’14. New York, NY, USA: Association for Computing Machinery, Jun. 2014, pp. 111–123. [Online]. Available: https://doi.org/10.1145/2591971.2592004
- [44] A. H. Mahmud and S. Ren, “Online capacity provisioning for carbon-neutral data center with demand-responsive electricity prices,” ACM SIGMETRICS Performance Evaluation Review, vol. 41, no. 2, pp. 26–37, 2013. [Online]. Available: http://doi.org/10.1145/2518025.2518029
- [45] D. Meisner, C. M. Sadler, L. A. Barroso, W.-D. Weber, and T. F. Wenisch, “Power management of online data-intensive services,” in Proceedings of the 38th annual international symposium on Computer architecture, ser. ISCA ’11. New York, NY, USA: Association for Computing Machinery, 2011, pp. 319–330. [Online]. Available: http://doi.org/10.1145/2000064.2000103
- [46] C. Mencía, M. R. Sierra, R. Mencía, and R. Varela, “Genetic Algorithm for Scheduling Charging Times of Electric Vehicles Subject to Time Dependent Power Availability,” in Natural and Artificial Computation for Biomedicine and Neuroscience, ser. Lecture Notes in Computer Science, J. M. Ferrández Vicente, J. R. Álvarez Sánchez, F. de la Paz López, J. Toledo Moreo, and H. Adeli, Eds. Cham: Springer International Publishing, 2017, pp. 160–169.
- [47] Meta, “2023 Sustainability Report.” [Online]. Available: https://sustainability.fb.com/2023-sustainability-report/
- [48] Meta, “Sustainability report,” Tech. Rep., 2021.
- [49] Microsoft, “Environmental sustainability report,” Tech. Rep., 2021.
- [50] A. Radovanovic, R. Koningstein, I. Schneider, B. Chen, A. Duarte, B. Roy, D. Xiao, M. Haridasan, P. Hung, N. Care, S. Talukdar, E. Mullen, K. Smith, M. Cottman, and W. Cirne, “Carbon-Aware Computing for Datacenters,” arXiv:2106.11750 [cs, eess], Jun. 2021, arXiv: 2106.11750. [Online]. Available: http://arxiv.org/abs/2106.11750
- [51] S. S. Reddy, “Optimizing energy and demand response programs using multi-objective optimization,” Electrical Engineering, vol. 99, no. 1, pp. 397–406, Mar. 2017. [Online]. Available: https://doi.org/10.1007/s00202-016-0438-6
- [52] S. Ren and M. A. Islam, “Colocation Demand Response: Why Do I Turn Off My Servers?” 2014, pp. 201–208. [Online]. Available: https://www.usenix.org/conference/icac14/technical-sessions/presentation/ren
- [53] V. Sakalkar, V. Kontorinis, D. Landhuis, S. Li, D. De Ronde, T. Blooming, A. Ramesh, J. Kennedy, C. Malone, J. Clidaras, and P. Ranganathan, “Data Center Power Oversubscription with a Medium Voltage Power Plane and Priority-Aware Capping,” in Proceedings of the Twenty-Fifth International Conference on Architectural Support for Programming Languages and Operating Systems, ser. ASPLOS ’20. New York, NY, USA: Association for Computing Machinery, Mar. 2020, pp. 497–511. [Online]. Available: https://dl.acm.org/doi/10.1145/3373376.3378533
- [54] C. Stewart and K. Shen, “Some joules are more precious than others: Managing renewable energy in the datacenter,” in Proceedings of the workshop on power aware computing and systems, 2009, pp. 15–19. [Online]. Available: https://www.cs.rochester.edu/~kshen/papers/hotpower2009.pdf
- [55] S. Talari, M. Shafie-khah, F. Wang, J. Aghaei, and J. P. S. Catalão, “Optimal Scheduling of Demand Response in Pre-Emptive Markets Based on Stochastic Bilevel Programming Method,” IEEE Transactions on Industrial Electronics, vol. 66, no. 2, pp. 1453–1464, 2019, conference Name: IEEE Transactions on Industrial Electronics.
- [56] M. Tirmazi, A. Barker, N. Deng, M. E. Haque, Z. G. Qin, S. Hand, M. Harchol-Balter, and J. Wilkes, “Borg: the next generation,” in Proceedings of the Fifteenth European Conference on Computer Systems, ser. EuroSys ’20. New York, NY, USA: Association for Computing Machinery, 2020, pp. 1–14. [Online]. Available: http://doi.org/10.1145/3342195.3387517
- [57] WattTime, “Marginal emissions methodology,” https://www.watttime.org/marginal-emissions-methodology/, 2023.
- [58] A. Wierman, Z. Liu, I. Liu, and H. Mohsenian-Rad, “Opportunities and challenges for data center demand response,” in International Green Computing Conference. DALLAS, TX, USA: IEEE, Nov. 2014, pp. 1–10. [Online]. Available: http://ieeexplore.ieee.org/document/7039172/
- [59] Q. Wu, Q. Deng, L. Ganesh, C.-H. Hsu, Y. Jin, S. Kumar, B. Li, J. Meza, and Y. J. Song, “Dynamo: facebook’s data center-wide power management system,” ACM SIGARCH Computer Architecture News, vol. 44, no. 3, pp. 469–480, 2016. [Online]. Available: http://doi.org/10.1145/3007787.3001187
- [60] H. Xu, X. Jin, F. Kong, and Q. Deng, “Two Level Colocation Demand Response with Renewable Energy,” IEEE Transactions on Sustainable Computing, vol. 5, no. 1, pp. 147–159, 2020, conference Name: IEEE Transactions on Sustainable Computing.
- [61] Y. Xu, N. Li, and S. H. Low, “Demand Response With Capacity Constrained Supply Function Bidding,” IEEE Transactions on Power Systems, vol. 31, no. 2, pp. 1377–1394, Mar. 2016, conference Name: IEEE Transactions on Power Systems.
- [62] S. M. Zahedi, Q. Llull, and B. Lee, “Amdahl’s law in the datacenter era: A market for fair processor allocation,” in HPCA, 2018.
- [63] C. Zhang and A. A. Chien, “Scheduling Challenges for Variable Capacity Resources,” in Job Scheduling Strategies for Parallel Processing, D. Klusáček, W. Cirne, and G. P. Rodrigo, Eds. Cham: Springer International Publishing, 2021, vol. 12985, pp. 190–209, series Title: Lecture Notes in Computer Science. [Online]. Available: https://link.springer.com/10.1007/978-3-030-88224-2_10
- [64] Q. Zhang, M. F. Zhani, S. Zhang, Q. Zhu, R. Boutaba, and J. L. Hellerstein, “Dynamic energy-aware capacity provisioning for cloud computing environments,” in Proceedings of the 9th international conference on Autonomic computing, ser. ICAC ’12. New York, NY, USA: Association for Computing Machinery, 2012, pp. 145–154. [Online]. Available: http://doi.org/10.1145/2371536.2371562
- [65] Y. Zhang, D. C. Wilson, I. C. Paschalidis, and A. K. Coskun, “HPC Data Center Participation in Demand Response: An Adaptive Policy With QoS Assurance,” IEEE Transactions on Sustainable Computing, vol. 7, no. 1, pp. 157–171, Jan. 2022, conference Name: IEEE Transactions on Sustainable Computing.
- [66] Z. Zhou, F. Liu, Z. Li, and H. Jin, “When smart grid meets geo-distributed cloud: An auction approach to datacenter demand response,” in 2015 IEEE Conference on Computer Communications (INFOCOM), Apr. 2015, pp. 2650–2658, iSSN: 0743-166X.