MasterRTL: A Pre-Synthesis PPA Estimation Framework
for Any RTL Design
Abstract
In modern VLSI design flow, the register-transfer level (RTL) stage is a critical point, where designers define precise design behavior with hardware description languages (HDLs) like Verilog. Since the RTL design is in the format of HDL code, the standard way to evaluate its quality requires time-consuming subsequent synthesis steps with EDA tools. This time-consuming process significantly impedes design optimization at the early RTL stage. Despite the emergence of some recent ML-based solutions, they fail to maintain high accuracy for any given RTL design. In this work, we propose an innovative pre-synthesis PPA estimation framework named MasterRTL. It first converts the HDL code to a new bit-level design representation named the simple operator graph (SOG). By only adopting single-bit simple operators, this SOG proves to be a general representation that unifies different design types and styles. The SOG is also more similar to the target gate-level netlist, reducing the gap between RTL representation and netlist. In addition to the new SOG representation, MasterRTL proposes new ML methods for the RTL-stage modeling of timing, power, and area separately. Compared with state-of-the-art solutions, the experiment on a comprehensive dataset with 90 different designs shows accuracy improvement by 0.33, 0.22, and 0.15 in correlation for total negative slack (TNS), worst negative slack (WNS), and power, respectively.
I Introduction
In modern VLSI design flows, the register-transfer level (RTL) stage is a critical point, where designers devote significant effort to crafting precise design behavior descriptions using hardware description languages (HDLs) such as Verilog, VHDL, and Chisel [1]. At this early stage, design engineers face a vast design space with maximum flexibility, allowing them to make virtually any fine-grained design decisions that will affect the ultimate quality of the ASIC design in terms of power, performance, and area (PPA). Ideally, designers should optimize their RTL designs sufficiently at this stage, since it is extremely challenging, if not impossible, to remedy low-quality RTL in downstream synthesis stages.
Despite the critical importance of optimizing RTL designs, it is very difficult to evaluate the RTL design quality, considering an RTL design is still in the format of HDL code. In a standard VLSI design flow, designers have to go through the time-consuming subsequent synthesis or even layout stages, relying on full-fledged commercial electronic design automation (EDA) tools to evaluate the design quality based on netlists or layouts. For complex industrial designs, the logic synthesis could take more than one day and the layout process can easily further take several days. To make things worse, designers often need to frequently invoke synthesis tools to implement and evaluate their RTL designs, optimize the RTL code based on the results, and then repeat the evaluation process until optimization is complete. This iterative process significantly prolongs the total turnaround time and hinders the optimization of design quality, making the RTL design process extremely inefficient.
In recent years, many customized machine learning (ML) methods have been explored to predict design quality as early design feedbacks [2]. However, most ML methods make predictions based on gate-level netlists or layouts, with the earlier RTL stage receiving less attention [2]. Existing ML solutions commonly represent gate-level netlists as graphs and process them with graph neural networks (GNNs), while layouts are represented as two-dimensional matrices and processed with convolutional neural networks (CNNs). However, since the RTL design is in HDL code format instead of common data structures, there is no consensus on the best way to represent and handle such RTL designs yet. Some works [3, 4] only tune the design flow of specific designs without examining RTL details, therefore requiring retraining the ML model for every new design. Similarly, most RTL-stage power models [5, 6, 7, 8, 9] cannot be generalized to new designs. Other works [10, 11] develop RTL-stage timing models based on Neural Networks. However, these models only support combinational circuits and are trained using specific design variations generated by an RTL generator. Besides the RTL-stage PPA modeling, which is the focus of this work, there are models targeting even earlier architectural stages [12, 13, 14, 15, 16, 17]. But it is even harder for them to directly generalize to unknown new designs, due to the lack of RTL details.
Most recently, a few more general ML methods [18, 19] are proposed to predict design qualities at the RTL stage. They first convert design RTL to representations such as the abstract syntax tree (AST), and then evaluate design PPA either based on all register trees [18] or randomly sampled paths [19] extracted from AST-alike representations. However, their accuracy on unknown new RTL designs is still limited for several reasons. First, the AST-alike representation adopted in these works [19, 18] is simply the initial data format used by traditional synthesis tools. It is not an ideal data format to support ML solutions. As we will demonstrate in Subsection II-A, the discrepancies of different design types are obvious in AST-alike representations, limiting the model generalization ability. Second, these works [18, 19] process the representations with several unreasonable operations. For example, in [18], we find notable undesired duplications among register trees when counting the design logic. In [19], there is a significant gap between the pseudo training paths and real paths extracted from target inference designs. Subsection III-B provides a detailed inspection of these prior works.
In this work, we propose a new RTL-stage PPA modeling framework named MasterRTL, which achieves significantly higher accuracy over prior works [18, 19] when applied to new RTL designs. It is the first work that supports the cross-design RTL evaluation on all major PPA qualities, including both total negative slack (TNS) and worst negative slack (WNS), both vector-less and vector-based power analysis results, and the gate area111In comparison, [18] only evaluates TNS and vector-less power, [19] only evaluates WNS, vector-less power, and area. Most other RTL-stage models [3, 4, 5, 6, 7, 8, 9] are not cross-design, requiring retraining on new designs.. It primarily answers two key unsolved questions in the RTL-stage PPA modeling problem:
-
Q1. What is the most appropriate data format of RTL design (i.e. RTL representation) that best supports ML methods?
-
Q2. Based on the RTL representation, how to capture the key patterns to estimate each design objective?
For question Q1, since we target a cross-design ML-based method applicable to any RTL design, an appropriate RTL representation should be maximally similar to the ultimate gate-level netlist, and be as general as possible. Such a general representation will unify different design types, thus maximizing the ML model’s accuracy on unknown new designs. MasterRTL adopts a new bit-level design representation named the simple operator graph (SOG), with only fundamental single-bit logic operations. Compared with the AST-alike representations in prior works [19, 18], it better unifies different RTL design types and styles and thus enables a higher cross-design model accuracy for almost all design objectives and ML methods.
For question Q2, since the mechanisms behind ground-truth power, performance, and area measurement are largely different, instead of adopting similar input features for different tasks in prior works [19, 18], we customize different estimation methodologies for timing, power, and area separately. Specifically, among all RTL-stage cross-design methods, our timing model is the first to explicitly capture the critical path and the corresponding delay between any pair of registers. This is enabled by our SOG representation’s consistency in register mapping with the netlist. Our power model is also the first to integrate toggle rate information as features, thus supporting unified predictions on both vector-based and vector-less power values. It is also the first cross-design RTL power model that employs module-level power evaluation, significantly augmenting the number of power labels for training.
Our contributions in this work are summarized below:
-
•
We propose an open-sourced new framework named MasterRTL to efficiently evaluate all PPA values of any given design RTL222It is open-sourced in https://github.com/fangwenji/MasterRTL.git. Evaluated on our comprehensive dataset with 90 different RTL designs, it achieves 0.33, 0.22, and 0.15 higher absolute values in correlation for TNS, WNS, and power estimations, than state-of-the-art solutions.
-
•
We adopt a new bit-level RTL representation named SOG. Compared to ASTs used in prior works, it is a significantly more general representation that unifies different design types, and reduces the gap to the ultimate gate-level netlist. It is a highly “ML-friendly” representation that can be adopted by follow-up ML solutions involving cross-design RTL processing tasks.
-
•
Based on SOG, we customize algorithms for each design objective, capturing their different mechanisms. Among cross-design RTL-stage methods, MasterRTL is the first to capture detailed critical-path information in timing modeling, and the first to integrate toggle rate and module-level information in power modeling.
-
•
We further study the impact of different logic synthesis options and the extra placement step on the target design PPA. We extend MasterRTL to predict post-placement PPA values.
-
•
Finally, we explore a new data augmentation technique that generates new pseudo RTL designs from scratch. We demonstrate its potential in mitigating the circuit data availability problem.
II Methodology
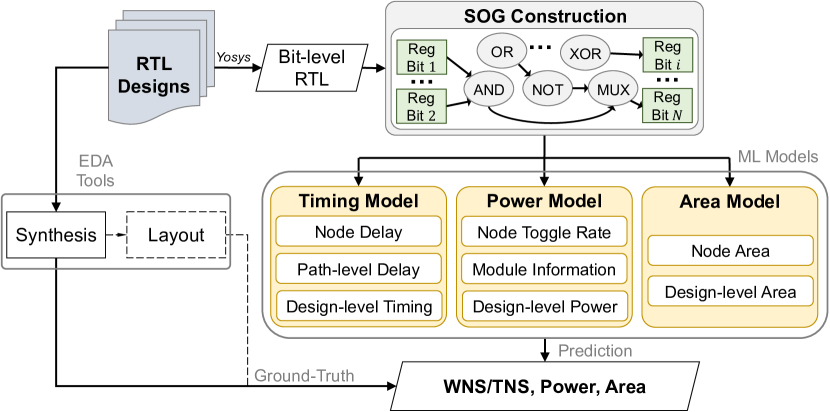
This section introduces our MasterRTL framework in detail. Let’s denote an RTL design in HDL-code format as , and the generated gate-level netlist after synthesis as , with its power, timing, and area as . The target of our RTL modeling framework is to evaluate these post-synthesis qualities of any RTL design. This framework first converts HDL-code format to a representation , allowing the processing of RTL details. Then different power, timing, and area models will be developed separately. The target can be summarized as below.
| (1) |
In this section, we will first introduce the new RTL representation named SOG adopted by MasterRTL, together with a preview of experimental results demonstrating its advantages. Based on this new representation , we will introduce the new timing, power, and area models proposed in MasterRTL.
II-A SOG: Our Suggested Bit-Level RTL Representation
The RTL-stage PPA modeling starts with converting the raw HDL code to a reasonable data structure, named design representation , to enable the processing of detailed RTL design information. A major challenge in this task is how to bridge the huge gap between the RTL-stage representation and the post-synthesis gate-level netlist, without invoking the time-consuming logic synthesis engine. Prior works [19, 18] directly convert the HDL code to an AST-alike representation. As Fig. 2(a) shows, this AST-alike representation can be viewed as a directed graph, with each node being a word-level design operation with any bit width. These operations may include adders, subtractors, multipliers, shifters, comparators, multiplexers, registers, and other logic operators [19]. Altogether there are 18 different word-level operations with any legitimate bit width in such AST-alike representation. Fig. 2(c) shows the target gate-level netlist after synthesizing this RTL example.
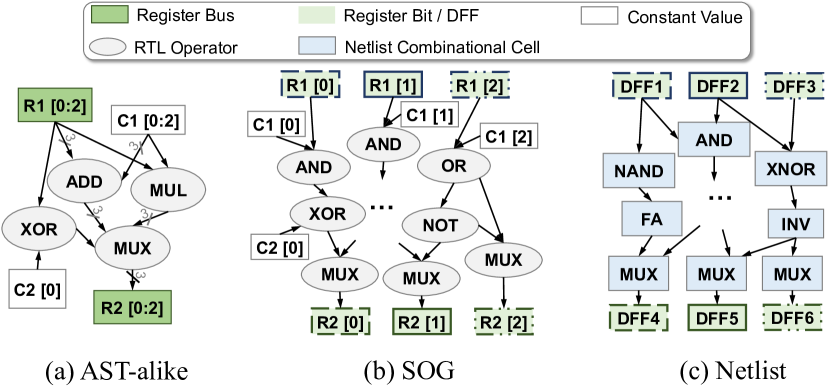
In comparison, MasterRTL adopts a new bit-level RTL representation without involving time-consuming optimizations in the existing synthesis process. It is shown in Fig. 2(b). Compared with 18 different word-level operations in AST-alike representation, this new bit-level representation consists of only single-bit registers and 5 types of single-bit primary simple logic operations, including two-input AND, two-input OR, two-input XOR, NOT, 2-to-1 MUX. Therefore, we name it simple operator graph (SOG). This new bit-level RTL representation SOG is generated by breaking each multi-bit word into logic bits and replacing the word-level operations with corresponding Boolean relations over these bits, following a pre-set mapping relation. The generation of this SOG representation can be implemented based on open-source tools like Yosys [20] and finishes in a short time.
In this subsection, we inspect the advantage of SOG for ML predictions, compared with AST-alike representation in prior works [19, 18]. We observe two potential advantages of SOG as follows.
-
1.
Similarity: SOG is more similar to the target gate-level netlist after logic synthesis. It reduces the gap between pre-synthesis RTL and post-synthesis gate-level netlist.
-
2.
Generalization: By only adopting 5 simple single-bit logic operations, SOG is more general than the AST, reducing the difference among various RTL design types and styles.
To support these two claims, we provide a preview of our experiment results in Table I, which compares the area prediction accuracy based on two different representations . It is based on our dataset with 90 different designs. Here we present the area prediction task considering its simplicity. The trend is similar in power and timing predictions shown by full experimental results in Section III-C.
| Area Estimation Accuracy | SOG | AST-alike | |
|---|---|---|---|
| (bit-level) | (word-level) | ||
| Simple correlation of all designs | |||
| (a) Evaluation of similarity between RTL representations and netlist. | |||
| Area Estimation Accuracy | SOG | AST-alike | |
| Training data | Test data | (bit-level) | (word-level) |
| Random | Other Random | ||
| CPUs | Non-CPU designs | ||
| Large designs | Small designs | ||
| (b) Evaluation of the generalization ability of RTL representations. | |||
Table I(a) shows a higher similarity between the SOG representation and the netlist. It simply measures the Pearson correlation between extracted features from each RTL representation and the gate area of netlist as ground-truth, without any explicit ML model. Extracted features for each representation are the numbers of node operations in each design. There are 6 features for SOG and 18 features for AST-alike representation. Despite a smaller number of features, SOG correlates much better with netlists, according to Table I(a). Such a better correlation implies there is a higher similarity between SOG and the netlist.
Table I(b) implies that SOG is a more general representation. It reports the test accuracies of our proposed simple area model, which will be introduced in subsequent sections. When we randomly assign the 90 designs to the training and testing dataset, as Table I(b) shows, the model based on SOG is slightly better than the AST-alike representation, again reflecting SOG’s better similarity with netlist. However, when we use distinct types of designs for training and testing (e.g., train on CPU/large designs while test on non-CPU/small designs), the accuracy of models using AST-alike representation immediately degrades from to . In comparison, ML models based on SOG remain accurate with . These results imply that SOG is a more general representation that unifies different designs in training and testing datasets.
Besides the above two advantages in similarity and generalization, there is a third key advantage of SOG named consistency that enables the development of our new customized models in MasterRTL:
-
3.
Consistency in register mapping: As Fig. 2 shows, every register cell in gate-level netlist has a 1-to-1 mapping to the single-bit register operator in SOG . In comparison, the AST with word-level nodes can never directly map to netlists in prior works.
Supported by the consistency in 1-to-1 register mapping, our significantly more accurate and detailed timing model can directly explore critical paths on SOG, then map to paths of the same starting and end registers on netlist. In the next subsections, we will separately introduce our timing model, power model, and area model in detail.
II-B RTL-Stage Timing Modeling
For the RTL-stage timing modeling, as Fig. 3 shows, we propose a multi-stage ML framework to evaluate both the TNS and WNS of any RTL design. The target ground-truth timing information including TNS and WNS values are from the post-synthesis timing report. Please notice that detailed timing evaluation at such an early stage is highly challenging, since neither logic optimization nor technology mapping has been performed yet. Therefore, different from previous netlist- or layout-stage timing modeling methods [21, 22, 23], our modeling method will primarily focus on key patterns and use some approximations. While it may result in imperfections, they will be addressed by subsequent calibration using ML models.
For RTL-stage timing modeling, a key challenge is that the ground-truth label is based on the timing analysis on gate-level netlist . Such netlist-level timing values cannot be directly mapped to the AST-alike RTL representation . Therefore, state-of-the-art works either give up modeling RTL details [18] or only use synthesized pseudo paths as training data [19], leading to significant inaccuracies. In comparison, MasterRTL utilizes the consistency of registers between the new SOG representation and netlist . Specifically, we will capture the slowest critical paths in both SOG representation and netlist , and map these paths one-by-one according to their starting and end registers cell/operator. This multi-stage timing modeling process is introduced in detail below.
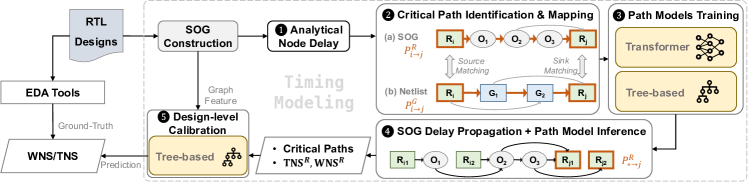
Node-delay modeling in . We first develop a simple approximated analytical (non ML-based) model to evaluate the delay after each node on our RTL representation in SOG. Please notice that such ‘node-delay’ on is not intended to be a real delay value. Instead, we only use it to guide path extraction on for feature collection. This node-delay model is a linear function of the fan-out number, with coefficients determined by the type of the driving node operator. Specifically, for each type of node operator, its coefficients are approximated by the RC values of standard cells of the same type in the liberty file (e.g., .lib/.db).
Critical path identification and mapping in and . Based on the estimated node-level delay in , we will efficiently propagate such estimated node-level delay by traversing the SOG graph in topological order, in order to estimate the maximum-delay path between any pair of registers in the representation , with the register as the startpoint and register as the endpoint. For a design with registers, .
Based on the captured from RTL representation , the goal is to evaluate ground-truth maximum path delay between the same pair of registers in the gate-level netlist . Denote the target critical path between register and in the netlist as . Its path delay is collected using post-synthesis timing analysis EDA tools.
Notice that both critical paths and share the same startpoint and endpoint registers , but the actual nodes on each path are different. A mapping example is shown in Fig. 3, where a node in represents an RTL operator, while a node in represents a standard cell.
Path-level delay model training. Based on features from the RTL-stage path , we train a path-level model to estimate the ground-truth path delay label at netlist .
| (2) |
To build the training dataset, for each design, we identify the register pairs that lead to the top maximum-delay netlist paths , according to the post-synthesis timing report.
For this path-level model , we explored two types of ML models. The first is the popular transformer model adopted in large language models (LLMs) nowadays, processing each path as a sequence of nodes. This transformer model is similar to the one adopted in [19]. But due to its limitation of using individual pseudo training paths, [19] has no fan-out/degree information in features, which are critical for path delay prediction. In comparison, we incorporate the fan-out count of each node (i.e., number of child nodes) in the path into the input features. The second explored ML model type for is the traditional tree-based algorithms like Random Forest [24] with careful feature engineering. The features captured from the path include: 1) the total number of all operations; 2) the number of each type of operation; 3) the accumulated node delay on this path according to the model in .
Path-level delay model inference. After training the path-delay model , it will be applied for TNS/WNS prediction on any given new RTL design. Similar to the calculation process of TNS and WNS in netlists, in the representation , we capture the critical path of each register as the endpoint. Using the technique in , we propagate the estimated node delays by traversing the SOG. Consequently, we identify altogether paths, with each path denoted as (). Here represents the startpoint register that leads to the maximum path delay.
Then the trained path-level model predicts the path delay of all paths . According to the definition of TNS and WNS, their estimations in the representation are calculated below.
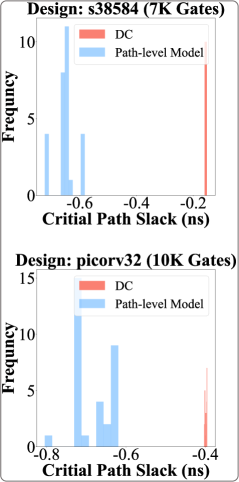
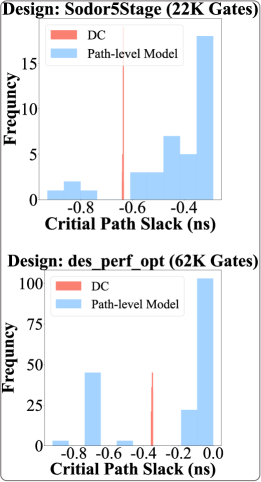
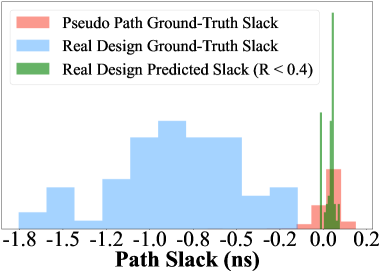
Design-level TNS/WNS calibration. Given that RTL-stage timing modeling is highly challenging, the estimated path delays, WNSR, and TNSR predicted directly by the path-level model in are not sufficiently accurate. But they provide useful information for further calibration. In Fig. 4, we compare the slack distribution of the worst 1% of the critical paths from both our path-level model prediction and ground-truth gate-level netlist timing report. We observe several interesting and reasonable patterns in Fig. 4:
-
•
The distribution of critical paths (red) from netlists is more concentrated than the path-level model predictions (blue).
-
•
While there are discrepancies between the ground-truth and path-level predictions, clear patterns exist based on design size. Specifically, predictions on small-scale designs tend to be over-pessimistic, large-scale ones are over-optimistic, and medium-sized designs fall in the middle.
These discrepancy patterns are actually expected. They primarily attributed to the optimization efforts carried out during logic synthesis, specifically targeting the most critical paths. Such optimization efforts make slacks of the 1% critical paths in netlist more concentrated and closer to actual WNS. Also, the impact of these optimization efforts is more obvious in small designs with fewer paths, making the path-level predictions based on over-pessimistic by comparison, and vice versa.
Leveraging these valuable patterns, we further devote one additional final-stage model to calibrate the above evaluations TNSR and WNSR towards the actual TNS and WNS labels measured in gate-level netlist . It adopts a tree-based ML model, with features including: 1) the SOG features (i.e., the numbers of node operators) indicating the design scale; 2) the estimated TNSR and WNSR provided by the path-level model; 3) the slack distribution of the worst 1% of the critical paths based on path-level model prediction . For each design, we take the worst, 10%, 50%, and 90% percentile of the predicted slacks as features.
II-C RTL-Stage Power Modeling
For RTL-stage power modeling, we propose a new toggle-rate-based and module-level method. Different from prior works [19, 18], this is the first cross-design RTL-stage power model to utilize toggle rate as input. It annotates a toggle rate on every node of the SOG representation . Such toggle rate annotation supports both vector-based and vector-less power simulation scenarios. For vector-based power analysis, we perform RTL simulations to obtain accurate toggle rates. It captures the dynamic behavior of the design, enabling precise estimation of toggle rates. For vector-less power analysis, we extract toggle rates from logic synthesis tools before the beginning of the synthesis process. It generates the necessary information about the design’s toggling behavior without explicit workload simulation.
Node toggle rate propagation. The toggle rate information of all register bits in RTL can be obtained from the Switching Activity Interchange Format (SAIF) files from EDA tools for both vector-based and vector-less analysis. Then the toggle rate of all registers can be directly mapped to the register nodes on SOG. Starting from registers, we can efficiently propagate the toggle rate to every node on SOG by traversing the graph, according to the functionality of each simple operator type in SOG [25].
Module-level power estimation. A major challenge in design power prediction is the lack of training data, since each design only provides one data sample (i.e., its total power) for training. Therefore, instead of directly predicting the total power of an entire design, we break the design down into modules based on the RTL hierarchy of HDL code333Specifically, we partition modules by considering only one level below the top module in this work.. This module-level method greatly enriches the total amount of power data by times. We predict the power of each module-level partition, denoted as , , …, . The overall power of the design, , is then obtained by summing the power of each module-level partition: , where refers to the number of times the module is instantiated.
For this module-level power prediction, we explored two types of models: graph neural network (GNN) model and traditional tree-based models. The total power is estimated by the sum of dynamic and static power. In terms of dynamic power, which is closely related to toggle rate, the explored models are introduced below. For the GNN model, we exploited the sub-SOG converted from modules as the input of the model. The features of each node are: 1) number of fan-in and fan-out; 2) one-hot encoding of the 6 node type; 3) propagated toggle rate. As for the tree-based method, for each module, we perform feature engineering based on toggle rate information: 1) the sum of toggle rate, 2) average toggle rates, 3) the sum of fan-out number multiples toggle rate on each node, 4) the total number of nodes. For static power estimation, it is toggle-rate irrelevant and only accounts for a small proportion of the total power, thus only the SOG-related features are utilized.
Design-level power calibration. Similar to the timing model, to capture the impact of different optimizations on distinct scales of designs during logic synthesis, we also add a final-stage tree-based ML model to calibrate the power prediction based on the sum of power prediction on all modules. In addition to this estimated total power, we incorporate the SOG graph features indicating the design scale. This final-stage calibration model further improves the accuracy.
II-D RTL-Stage Area Modeling
According to our observation, area modeling is much more straightforward than the aforementioned timing and power modeling. Based on the SOG representation, a one-stage tree-based model is sufficient to provide high accuracy. The total gate area is decomposed into the area of sequential and combinational cells. To predict the sequential area, we simply multiply the total number of registers in SOG with the cell area of a D-flip-flop in the liberty file. It provides accurate results, eliminating the need for further ML models. For the combinational part, we calculate the area of all operators in SOG using the liberty file, which is then combined with the previously mentioned SOG features to create a comprehensive feature vector. Based on the features, the tree-based model is further utilized for combinational area estimation.
II-E Data Augmentation by Generating New RTL
In real-world application scenarios, high-quality RTL designs are extremely important intellectual property (IP) of IC design companies and are hardly available to model developers. Therefore, it is very likely to encounter a shortage of diverse variants of RTL designs for model training. To address this data availability challenge, we present a new RTL data generation method. We intend to develop this further with more customizations on RTL format in our future work, but here we provide a brief description of how this can already be realized using the existing graph generation models.
Our current solution generates brand-new RTL designs based on a graph generative method [26] followed by a fine-tuning algorithm. Specifically, we first convert a small number of available training RTL designs to the RTL representation444In this RTL generation task, we adopt AST-alike representation to train the graph generation model. As we discussed, SOG is closer to the gate-level netlist, while AST-alike representation is more similar to RTL. in graph format, then train the graph generation model [26] with it. Then the graph generation model generates brand-new graphs. After that, the node type and connectivity in generated graphs will be fined-tuned to enforce our pre-defined RTL constraints (e.g., legitimate fan-in number, the proportion of each operator type, bit-width, etc.). Finally, the fine-tuned graphs can be converted back to newly generated RTLs as new training data for data augmentation.
Currently, this RTL-stage data generation method is helpful when the available real RTL data is very limited, with its effect demonstrated in the Subsection IV-C. Considering the scaling-up trend of ML models, the serious data availability problem will become a key bottleneck in RTL modeling. Therefore, we believe this RTL generation method is highly promising, since it can generate an almost unlimited number of new RTL designs. In future work, we will try to remove the reliance on the extra fine-tuning algorithm and further improve the similarity between generated RTL designs and real ones.
III Experimental Results
III-A Experimental Setup and MasterRTL Implementation
In this work, we first construct a comprehensive dataset by collecting altogether 90 different open-source RTL designs from different benchmark sources. Such a comprehensive dataset enables a more thorough examination of our proposed methodology.
Table II summarizes the sources of all designs we adopted in the dataset. They are originally coded with all mainstream HDLs, including Verilog, VHDL, Chisel [1], and SpinalHDL [27]. These designs target different applications, including CPU cores [28, 29], ML accelerators [29], vector arithmetic, cryptographic arithmetic, and other designs for logic synthesis study [30].
| Source | Number of | Original | Design Size (#K Gates) |
|---|---|---|---|
| Benchmarks | Designs | HDL Type | {Min, Median, Max} |
| ISCAS’89 [30]† | 5 | Verilog | {1, 6, 7} |
| ITC’99 [31]† | 13 | VHDL | {4, 10, 45} |
| OpenCores [32]† | 15 | Verilog | {2, 7, 62} |
| VexRiscv [28] | 26 | SpinalHDL | {7, 132, 530} |
| RISC-V Cores⋆ | 5 | Verilog | {7, 10, 17} |
| NVDLA [33] | 8 | Verilog | {6, 40, 672} |
| Chipyard [29]‡ | 18 | Chisel | {1, 25, 921} |
For each design, the RTL is synthesized with Synopsys Design Compiler® 2021 using the NanGate 45nm technology library [36]. The PPA values of the gate-level netlist of each design are recorded as the ground-truth label. Notice that we explored different synthesis parameters in Design Compiler®. The label for each RTL design is determined based on the best PPA point on the Pareto curve, representing the best design trade-off designers may achieve. Actually, unlike described in some prior works [18], the design trade-offs are not obvious using the latest commercial synthesis options, and we give a more detailed discussion in Subsection IV-B. The bit-level SOG representation is generated with open-source tools such as Yosys [20] and Pyverilog [37]. The experiments are conducted on a server with a 2.9 GHz Intel Xeon(R) Platinum 8375C CPU, and 256G RAM.
Based on the constructed dataset, the ML models can be implemented and evaluated. We adopt 10-fold cross-validation to assess the model accuracies. The hyper-parameter tuning for each ML model is based on a held-out validation set. After exploration and parameter tuning, our detailed model implementation is introduced below.
III-A1 Timing Models
As mentioned in Section II, we explored two types of timing models for path delay prediction, as listed below.
-
•
Transformer: The transformer model shares the same hyperparameters as described in [19] while we additionally introduce the fan-out of the operators into the path sequence.
-
•
Random Forest: With the features listed above, we exploited the Random Forest model [38] with 80 estimation trees and a maximum depth of 20 to perform the regression.
For the final design-level calibration model, we employed the XGBoost model with 45 estimators and a maximum depth of 8.
III-A2 Power Models
During the module-level power estimation, we explored and evaluated two different types of ML models:
-
•
Graph Neural Network: we implemented a Graph Convolutional Network (GCN) [39] with two hidden convolutional layers with 10 and 70 nodes, respectively, and one sum-pooling layer. It performs an end-to-end graph-level value regression. We utilized the Adam optimizer with a learning rate 0.01 for model optimization, and the GCN model converges in 100 epochs.
-
•
XGBoost Regressor: With the features listed above, an XGBoost model [40] with 30 estimators and a maximum depth of 6 is used for the regression task.
An additional XGBoost model with 45 estimators and 8 max depths is utilized for design-level power calibration.
Due to the unavailability of power simulation testbenches for many designs, we demonstrate the vector-based power prediction capability of MasterRTL through the RISC-V CPU core series named BOOM [29], which can be simulated with widely-adopted Dhrystone testbench [41] to obtain vector-based ground-truth power. All power models in this experiment are trained with vector-less power values. Unless explicitly indicated, the power prediction accuracy is also evaluated with vector-less power.
III-A3 Area Model
Similar to the design-level timing and power model, the XGBoost regressor with 45 estimators and 12 max depth is evaluated for the combinational area prediction. The total area is predicted by adding the predicted combinational area with the directly calculated sequential area.
We use three metrics to evaluate the prediction accuracy between the predicted value and ground-truth of designs. They are: correlation coefficient (R), Mean Absolute Error Percentage (MAPE), and Root Relative Square Error (RRSE), as defined below.
The and represent the average of predicted and measured values, respectively. These metrics bring a comprehensive and fair evaluation of ML models from three aspects, where the higher correlation R and lower MAPE and RRSE indicate better accuracy.
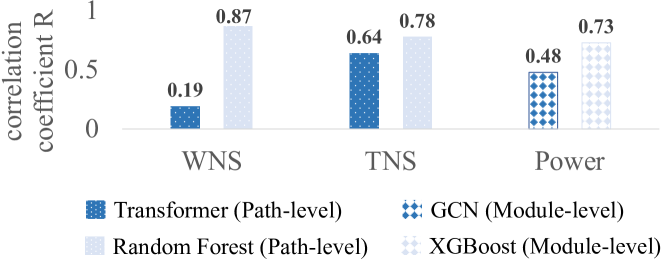
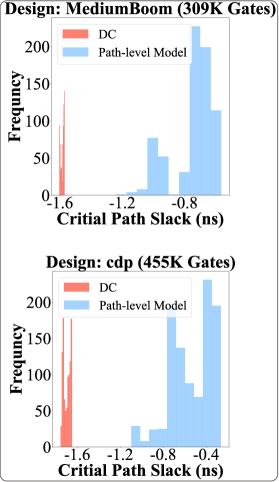
Fig 5 compares these explored intermediate-stage ML models in MasterRTL, and the final prediction results will be introduced later in Subsection III-C. For path-level timing models, the Random Forest model with human-extracted path features performs better than Transformer. The trend is similar in the module-level models, where the XGBoost regressor is more accurate than the GCN model. Therefore, the traditional tree-based model is finally adopted at the intermediate stages of MasterRTL instead of deep learning models.
III-B Baseline Solutions and their Limitations
As mentioned, [19, 18] are obviously state-of-the-art cross-design RTL modeling methods, which should be compared with our solution. The implementation of [19] is open-sourced. Although [18] is not open-sourced, by strictly following their description, we can implement their solution without much doubt. Neither works [19, 18] released their dataset. For a fair comparison, both baselines and MasterRTL are trained and evaluated on exactly the same training and testing data, with 10-fold cross-validation (i.e., each time 90% designs for training, 10% for testing, no design trained and tested at the same time). Before we delve into the experimental results, we will first inspect these solutions [19, 18] in detail, and discuss their potential limitations, which lead to inferior performance.
The work of [18] first backtraces every register to build the logic tree driving this register, named a register tree. After that, it calculates pre-defined features for each register tree and sums up the features of all register trees, generating the final ML model inputs. However, we observe significant logic overlaps among different register trees, resulting in the same RTL logic being counted multiple times as undesired duplications. As our experiment in Fig. 6(a) shows, the accuracies on power and TNS both increase when such an overlap is removed.
| Method | Target | R | MAPE | RRSE | Target | R | MAPE | RRSE | Target | R | MAPE | RRSE | Target | R | MAPE | RRSE |
|---|---|---|---|---|---|---|---|---|---|---|---|---|---|---|---|---|
| [18] (AST-alike) | WNS | 0.37 | 26% | 0.95 | TNS | 0.63 | 48% | 0.79 | Total Power | 0.42 | 51% | 1.01 | Area | 0.75 | 38% | 0.68 |
| [18] (SOG) | 0.82 | 24% | 0.53 | 0.86 | 41% | 0.36 | 0.62 | 48% | 0.79 | 0.94 | 31% | 0.33 | ||||
| [19] (AST-alike) | 0.71 | 35% | 1.15 | 0.78 | 36% | 1.1 | 0.74 | 68% | 0.81 | 0.93 | 38% | 0.42 | ||||
| [19] (SOG) | 0.78 | 26% | 0.78 | 0.8 | 29% | 0.88 | 0.82 | 48% | 0.62 | 0.96 | 35% | 0.4 | ||||
| MasterRTL (AST-alike) | 0.81 | 22% | 0.6 | 0.95 | 36% | 0.31 | 0.79 | 44% | 0.63 | 0.94 | 31% | 0.34 | ||||
| MasterRTL (SOG) | 0.93 | 14% | 0.4 | 0.96 | 27% | 0.29 | 0.89 | 38% | 0.54 | 0.98 | 16% | 0.24 | ||||
The work of [19] trains ML models to predict the PPA of each individual path. To generate the training dataset, it generates pseudo individual RTL paths, and then synthesizes them to collect the PPA label of each pseudo path. After training, the ML model is applied to infer paths sampled randomly from the target design. However, as shown in Fig. 6(b), we observe a significant gap between the pseudo training paths and real test paths from realistic target designs. These distinct distributions imply that the slack predictions (green) are misled by the pseudo paths (red), resulting in a large gap between predictions and real test paths (blue) in both absolute error and correlation R. In addition, the randomly sampled paths cannot fully reflect the TNS and WNS of the target design.
In the experimental results, we will emphasize and primarily compare with their originally proposed methods [19, 18]. Besides that, we have also implemented many baseline variations for detailed ablation studies. For all setups and variations, we have tried to maximize the performance through the similar model-tuning procedure.
| Design | MAPE (%) | |||
|---|---|---|---|---|
| Vector-less Method | Vector-based Method | |||
| [18] | [19] | MasterRTL | MasterRTL | |
| SmallBOOM | 84 | 59 | 42 | 34 |
| MediumBOOM | 74 | 50 | 21 | 5 |
| LargeBOOM | 67 | 58 | 39 | 8 |
| Aver. MAPE (BOOM) | 75 | 56 | 34 | 16 |
| Aver. MAPE (All designs) | 51 | 68 | 38 | N/A |
III-C PPA Estimation Accuracy Evaluation and Comparison
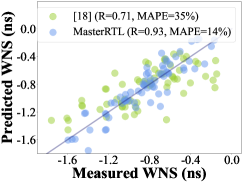
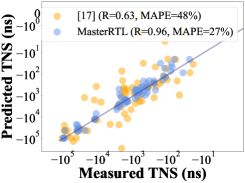
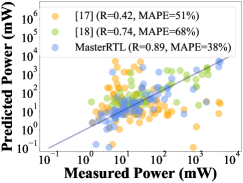
Table III shows the comparison of MasterRTL over prior works [19, 18]. Notice that only the colored cells with bold texts denote actual estimation methods, while other cells are implemented for ablation studies. As we have explained, prior works adopt AST-alike representations while MasterRTL uses the SOG. [18] originally only predicted TNS and power, while [19] was for WNS, power and area.
We have multiple interesting observations in Table III. First of all, MasterRTL significantly outperforms original prior works for all originally proposed estimations, specifically, WNS ( [19]), TNS ( [18]), power ( [18] and [19]), area ( [19]), and also much lower MAPE and RRSE errors. Another key observation is that the advantage of our proposed SOG over AST-alike representation is not limited to MasterRTL. All methods using SOG generally perform better. The advantage is more obvious for [18], while less obvious for [19]. This universal accuracy improvement validates our claimed advantages of SOG, which we believe should be more widely adopted as a highly ML-friendly RTL representation.
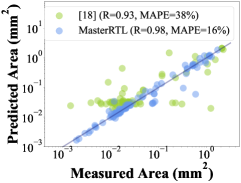
In addition, compared with the TNS and area, which are more correlated with each design’s scale, the WNS and power estimations are generally more challenging and less accurate. The advantage of SOG over AST-alike is also more obvious for these challenging tasks. More detailed comparisons of the colored cells in Table III are shown by the scatter plots in Fig. 7.
Table IV further shows the vector-based power prediction on BOOM series CPU designs, which support simulation based on testbenches like Dhrystone. Table IV indicates by adopting toggle rate in power model features, MasterRTL trained with vector-less power values only can directly predict vector-based power accurately. This power model unifies both vector-less and vector-based power analysis scenarios.
III-D PPA Estimation Accuracy Ablation Study
To analyze the superior performance of MasterRTL, we decompose our solution to provide ablation studies by removing key policies of MasterRTL. The following summarizes the crucial policies in MasterRTL: 1) SOG rather than AST-alike representation; 2) customized key features for WNS, TNS, and power, respectively (e.g. critical path information from path-level model for timing, the introduction of toggle rate and module-level partition for power); 3) design-level calibration.
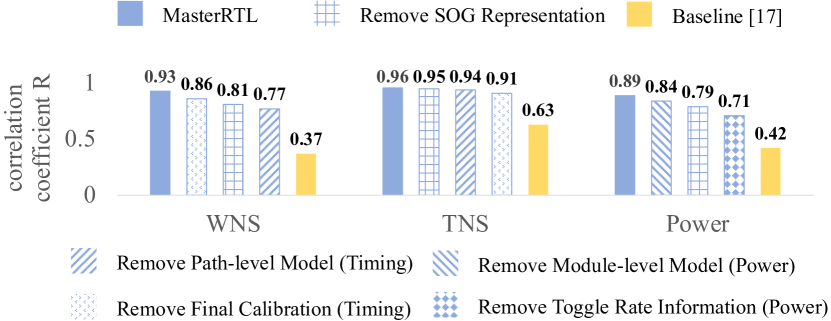
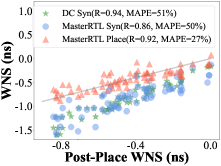
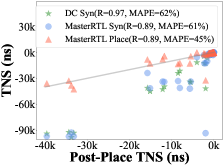
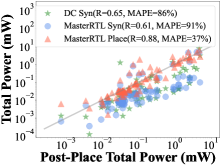
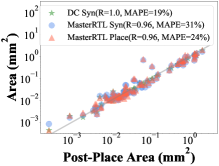
Fig. 8 shows ablation study results. For WNS prediction, which heavily relies on critical path information, removing the path-level model leads to the most substantial accuracy drop. Regarding TNS, the most significant accuracy drop happens when graph features are removed, indicating the importance of SOG features and design scale. For the total power, the toggle rate information is crucial to the accuracy. After removing all the proposed crucial policies, the final accuracy is similar to the baseline method [18].
III-E MasterRTL Runtime Overhead
MasterRTL, functioning as an RTL-stage estimator, offers accurate PPA evaluation without a time-consuming logic synthesis process. To evaluate its efficiency, we present the median runtime of all 90 benchmark designs. Table V compares the runtime overhead of MasterRTL with the commercial logic synthesis tool. Our framework exhibits a runtime overhead of approximately 5% compared to the synthesis runtime. The primary contributor to this overhead is the preprocessing of RTL designs, particularly the conversion from RTL designs to SOG, which consumes 3.4% of the synthesis runtime. Additionally, the extraction of toggle rate in synthesis tools accounts for 0.8% of the synthesis time. The feature engineering processes, on the other hand, typically require only seconds to extract features by traversing the entire design SOG, accounting for no more than 0.5% of the synthesis time. Lastly, the inference of all PPA values through our ML-based timing, power, and area models requires less than 0.1 seconds.
| Stage | Runtime⋆ | |
|---|---|---|
| RTL Preprocess | SOG Construction | 3.4% |
| Toggle Rate Extraction | 0.8% | |
| ML Feature Generation | Timing Modeling | 0.3% |
| Power Modeling | 0.1% | |
| Area Modeling | 0.1% | |
| All PPA Prediction Inference Time | <0.001% | |
-
•
⋆ The runtime is presented as the proportion of logic synthesis runtime.
IV Discussions
IV-A MasterRTL Extended to Layout PPA Modeling
In addition to targeting PPA labels of the post-synthesis netlist , MasterRTL can be readily extended to predict PPA in the layout stage based on the same RTL designs. Here we first visualize the PPA correlation between the post-synthesis netlist and the post-placement solution from Innovus®, as shown by green points in Fig. 9. These disparities primarily stem from offsets, while maintaining a high correlation. Moreover, the physical-design EDA tools significantly optimize the timing characteristics with the cost of a deterioration in power consumption, meanwhile, the area remains almost unchanged.
Based on this observation, we developed one extra tree-based model to further predict post-placement PPA. Its features are simply from the existing MasterRTL predictions (blue points). Here we perform RTL-stage prediction targeting post-placement, an extremely challenging task. The final predictions, depicted as red scattered points, indicate our framework can achieve similar or even higher accuracy than ground-truth logic synthesis results.
IV-B The Impact of Trade-offs
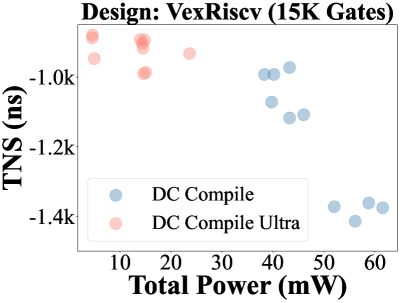
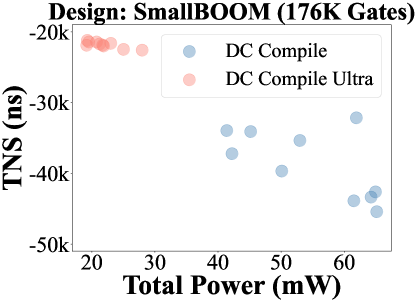
With the advanced synthesis option from the latest commercial tools, according to our observation, the trade-offs caused by synthesis parameters are not obvious. We compared the two different synthesis options (i.e., Compile_Ultra and Compile), and the synthesis results of two design examples are shown in Fig. 10. Notably, the PPA variance attained through the utilization of the Compile_Ultra command is significantly smaller compared to the alternative option, and there is typically a best result in both design objectives, thus the ground-truth label is directly used. The prior work [18] claiming the necessity of capturing trade-offs actually adopted Compile options.
IV-C Utilization of Generated Pseudo RTL Designs
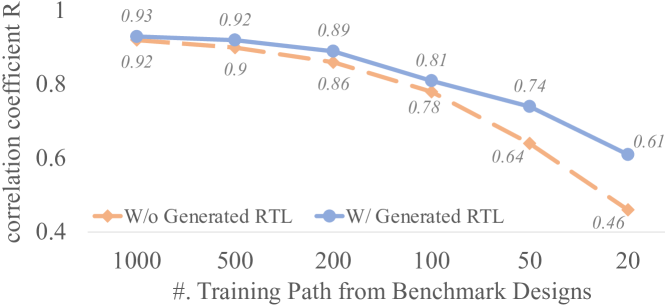
Finally, we evaluate the effect of generated RTL designs introduced in Subsection II-E, when there are insufficient real RTL designs as training data. The experiment evaluates the path slack prediction accuracy of our proposed path-level model, a key component of the timing model. Fig. 11 shows its accuracy as the number of training paths from real designs decreases. Without generated paths, the accuracy of the model drops rapidly (orange). But after augmenting the dataset with generated new RTL, there is an improvement (blue), and the gap is more obvious as real-design data further decreases. Generating new RTL designs from scratch obviously has strong practical value, and we will continue to improve the quality of generated RTL in our future works to further enlarge the gap.
V Conclusion
In this paper, we present MasterRTL, a pre-synthesis PPA estimation framework for RTL designs. The proposed method adopts a general RTL representation named simple operator graph (SOG) and customizes multi-stage ML models for WNS, TNS, power, and area separately. Accurate estimations are provided for both the post-synthesis and post-placement stages. Additionally, a data augmentation methodology is demonstrated to address the data availability problem, with plans for future extensions.
VI Acknowledgement
This work is partially funded by the Hong Kong Research Grants Council (RGC) ECS Grant 26208723, Guangdong Basic and Applied Basic Research Foundation no. 2022A1515110178, Guangzhou-HKUST(GZ) Joint Funding Scheme no. SL2022A03J01288, Guangzhou Basic Research Project no. SL2022A04J00615, and ACCESS – AI Chip Center for Emerging Smart Systems, sponsored by InnoHK funding, Hong Kong SAR. Also, the authors thank the help from Prof Jiang Hu and Prianka Sengupta at Texas A&M University.
References
- [1] J. Bachrach, H. Vo, B. Richards, Y. Lee, A. Waterman, R. Avižienis, J. Wawrzynek, and K. Asanović, “Chisel: constructing hardware in a scala embedded language,” in Design Automation Conference (DAC), 2012.
- [2] M. Rapp, H. Amrouch, Y. Lin, B. Yu, D. Z. Pan, M. Wolf, and J. Henkel, “MLCAD: A survey of research in machine learning for CAD keynote paper,” IEEE Transactions on Computer-Aided Design of Integrated Circuits and Systems (TCAD), 2021.
- [3] Z. Xie, G.-Q. Fang, Y.-H. Huang, H. Ren, Y. Zhang, B. Khailany, S.-Y. Fang, J. Hu, Y. Chen, and E. C. Barboza, “FIST: A feature-importance sampling and tree-based method for automatic design flow parameter tuning,” in 2020 25th Asia and South Pacific Design Automation Conference (ASP-DAC). IEEE, 2020, pp. 19–25.
- [4] R. Liang, J. Jung, H. Xiang, L. Reddy, A. Lvov, J. Hu, and G.-J. Nam, “Flowtuner: A multi-stage eda flow tuner exploiting parameter knowledge transfer,” in 2021 IEEE/ACM International Conference On Computer Aided Design (ICCAD). IEEE, 2021, pp. 1–9.
- [5] Z. Xie, X. Xu, M. Walker, J. Knebel, K. Palaniswamy, N. Hebert, J. Hu, H. Yang, Y. Chen, and S. Das, “APOLLO: An automated power modeling framework for runtime power introspection in high-volume commercial microprocessors,” in 54th Annual IEEE/ACM International Symposium on Microarchitecture (MICRO), 2021, pp. 1–14.
- [6] Y. Zhou, H. Ren, Y. Zhang, B. Keller, B. Khailany, and Z. Zhang, “PRIMAL: Power inference using machine learning,” in 56th Annual Design Automation Conference (DAC), 2019, pp. 1–6.
- [7] D. Kim, J. Zhao, J. Bachrach, and K. Asanović, “Simmani: Runtime power modeling for arbitrary rtl with automatic signal selection,” in Proceedings of the 52nd Annual IEEE/ACM International Symposium on Microarchitecture (MICRO), 2019, pp. 1050–1062.
- [8] Z. Xie, S. Li, M. Ma, C.-C. Chang, J. Pan, Y. Chen, and J. Hu, “DEEP: Developing extremely efficient runtime on-chip power meters,” in Proceedings of the 41st IEEE/ACM International Conference on Computer-Aided Design (ICCAD), 2022, pp. 1–9.
- [9] J. Yang, L. Ma, K. Zhao, Y. Cai, and T.-F. Ngai, “Early stage real-time SoC power estimation using RTL instrumentation,” in Asia and South Pacific Design Automation Conference (ASPDAC), 2015.
- [10] D. S. Lopera, L. Servadei, V. P. Kasi, S. Prebeck, and W. Ecker, “Rtl delay prediction using neural networks,” in 2021 IEEE Nordic Circuits and Systems Conference (NorCAS). IEEE, 2021, pp. 1–7.
- [11] D. S. Lopera and W. Ecker, “Applying gnns to timing estimation at rtl,” in Proceedings of the 41st IEEE/ACM International Conference on Computer-Aided Design (ICCAD), 2022, pp. 1–8.
- [12] W. R. Davis, P. Franzon, L. Francisco, B. Huggins, and R. Jain, “Fast and accurate ppa modeling with transfer learning,” in 2021 IEEE/ACM International Conference On Computer Aided Design (ICCAD). IEEE, 2021, pp. 1–8.
- [13] J. Zhai, C. Bai, B. Zhu, Y. Cai, Q. Zhou, and B. Yu, “McPAT-Calib: A microarchitecture power modeling framework for modern CPUs,” in 2021 IEEE/ACM International Conference On Computer Aided Design (ICCAD). IEEE, 2021, pp. 1–9.
- [14] N. Wu, H. Yang, Y. Xie, P. Li, and C. Hao, “High-level synthesis performance prediction using gnns: Benchmarking, modeling, and advancing,” in Proceedings of the 59th ACM/IEEE Design Automation Conference (DAC), 2022, pp. 49–54.
- [15] E. Ustun, C. Deng, D. Pal, Z. Li, and Z. Zhang, “Accurate operation delay prediction for fpga hls using graph neural networks,” in Proceedings of the 39th International Conference on Computer-Aided Design (ICCAD), 2020, pp. 1–9.
- [16] Y. S. Shao, B. Reagen, G.-Y. Wei, and D. Brooks, “Aladdin: A pre-rtl, power-performance accelerator simulator enabling large design space exploration of customized architectures,” ACM SIGARCH Computer Architecture News, vol. 42, no. 3, pp. 97–108, 2014.
- [17] Q. Zhang, S. Li, G. Zhou, J. Pan, C.-C. Chang, Y. Chen, and Z. Xie, “PANDA: Architecture-level power evaluation by unifying analytical and machine learning solutions,” in IEEE/ACM International Conference on Computer-Aided Design (ICCAD), 2023.
- [18] P. Sengupta, A. Tyagi, Y. Chen, and J. Hu, “How good is your Verilog RTL code? a quick answer from machine learning,” in Proceedings of the 41st IEEE/ACM International Conference on Computer-Aided Design (ICCAD), 2022, pp. 1–9.
- [19] C. Xu, C. Kjellqvist, and L. W. Wills, “SNS’s not a synthesizer: a deep-learning-based synthesis predictor,” in Proceedings of the 49th Annual International Symposium on Computer Architecture (ISCA), 2022, pp. 847–859.
- [20] C. Wolf, J. Glaser, and J. Kepler, “Yosys-a free verilog synthesis suite,” in Proceedings of the 21st Austrian Workshop on Microelectronics (Austrochip), 2013, p. 97.
- [21] Z. Xie, R. Liang, X. Xu, J. Hu, C.-C. Chang, J. Pan, and Y. Chen, “Pre-placement net length and timing estimation by customized graph neural network,” IEEE Transactions on Computer-Aided Design of Integrated Circuits and Systems (TCAD), 2022.
- [22] E. C. Barboza, N. Shukla, Y. Chen, and J. Hu, “Machine learning-based pre-routing timing prediction with reduced pessimism,” in Design Automation Conference (DAC), 2019.
- [23] Z. Guo, M. Liu, J. Gu, S. Zhang, D. Z. Pan, and Y. Lin, “A timing engine inspired graph neural network model for pre-routing slack prediction,” in Proceedings of the 59th ACM/IEEE Design Automation Conference (DAC), 2022, pp. 1207–1212.
- [24] L. Breiman, “Random forests,” Machine learning, vol. 45, pp. 5–32, 2001.
- [25] N. H. Weste and D. Harris, CMOS VLSI design: a circuits and systems perspective. Pearson Education India, 2015.
- [26] R. Liao, Y. Li, Y. Song, S. Wang, W. Hamilton, D. K. Duvenaud, R. Urtasun, and R. Zemel, “Efficient graph generation with graph recurrent attention networks,” Advances in neural information processing systems (NeurIPS), vol. 32, 2019.
- [27] SpinalHDL, “Spinal hardware description language,” 2022. [Online]. Available: https://spinalhdl.github.io/SpinalDoc-RTD/master/index.html
- [28] VexRiscv, “VexRiscv: A FPGA friendly 32 bit RISC-V CPU implementation,” 2022. [Online]. Available: https://github.com/SpinalHDL/VexRiscv
- [29] A. Amid, D. Biancolin, A. Gonzalez, D. Grubb, S. Karandikar, H. Liew, A. Magyar, H. Mao, A. Ou, N. Pemberton et al., “Chipyard: Integrated design, simulation, and implementation framework for custom socs,” IEEE Micro, vol. 40, no. 4, pp. 10–21, 2020.
- [30] F. Brglez, D. Bryan, and K. Kozminski, “Combinational profiles of sequential benchmark circuits,” in IEEE International Symposium on Circuits and Systems (ISCAS). IEEE, 1989, pp. 1929–1934.
- [31] F. Corno, M. S. Reorda, and G. Squillero, “Rt-level itc’99 benchmarks and first atpg results,” Design & Test of computers (ITC), 2000.
- [32] C. Albrecht, “Iwls 2005 benchmarks,” in International Workshop for Logic Synthesis (IWLS): http://www. iwls. org, 2005.
- [33] Nvidia, “Nvidia deep learning accelerator,” 2018. [Online]. Available: http://nvdla.org/primer.html
- [34] YosysHQ, “Picorv32 - a size-optimized risc-v cpu,” 2019. [Online]. Available: https://github.com/YosysHQ/picorv32
- [35] onchipuis, “A 32-bit risc-v processor for mriscv project,” 2017. [Online]. Available: https://github.com/onchipuis/mriscvcore
- [36] NanGate 45nm Open Cell Library, https://si2.org/open-cell-library/.
- [37] S. Takamaeda-Yamazaki, “Pyverilog: A python-based hardware design processing toolkit for verilog hdl,” in Applied Reconfigurable Computing, ser. Lecture Notes in Computer Science, vol. 9040. Springer International Publishing, Apr 2015, pp. 451–460. [Online]. Available: http://dx.doi.org/10.1007/978-3-319-16214-0_42
- [38] G. Louppe, “Understanding random forests: From theory to practice,” arXiv preprint arXiv:1407.7502, 2014.
- [39] S. Zhang, H. Tong, J. Xu, and R. Maciejewski, “Graph convolutional networks: a comprehensive review,” Computational Social Networks (Comput. Soc. Netw.), vol. 6, no. 1, pp. 1–23, 2019.
- [40] T. Chen and C. Guestrin, “Xgboost: A scalable tree boosting system,” in Proceedings of the 22nd acm sigkdd international conference on knowledge discovery and data mining (SIGKDD), 2016, pp. 785–794.
- [41] R. P. Weicker, “Dhrystone: a synthetic systems programming benchmark,” Communications of the ACM (Commun. ACM), vol. 27, no. 10, pp. 1013–1030, 1984.