:
\theoremsep
\jmlrvolumeLEAVE UNSET
\jmlryear2023
\jmlrsubmittedLEAVE UNSET
\jmlrpublishedLEAVE UNSET
\jmlrworkshopMachine Learning for Health (ML4H) 2023
Deep Phenotyping of Non-Alcoholic Fatty Liver Disease Patients with Genetic Factors for Insights into the Complex Disease
Abstract
Non-alcoholic fatty liver disease (NAFLD) is a prevalent chronic liver disorder characterized by the excessive accumulation of fat in the liver in individuals who do not consume significant amounts of alcohol, including risk factors like obesity, insulin resistance, type 2 diabetes, etc. We aim to identify subgroups of NAFLD patients based on demographic, clinical, and genetic characteristics for precision medicine. The genomic and phenotypic data (3,408 cases and 4,739 controls) for this study were gathered from participants in Mayo Clinic Tapestry Study (IRB#19-000001) and their electric health records, including their demographic, clinical, and comorbidity data, and the genotype information through whole exome sequencing performed at Helix using the Exome+® Assay according to standard procedure (www.helix.com). Factors highly relevant to NAFLD were determined by the chi-square test and stepwise backward-forward regression model. Latent class analysis (LCA) was performed on NAFLD cases using significant indicator variables to identify subgroups. The optimal clustering revealed 5 latent subgroups from 2,013 NAFLD patients (mean age 60.6 years and 62.1% women), while a polygenic risk score based on 6 single-nucleotide polymorphism (SNP) variants and disease outcomes were used to analyze the subgroups. The groups are characterized by metabolic syndrome, obesity, different comorbidities, psychoneurological factors, and genetic factors. Odds ratios were utilized to compare the risk of complex diseases, such as fibrosis, cirrhosis, and hepatocellular carcinoma (HCC), as well as liver failure between the clusters. Cluster 2 has a significantly higher complex disease outcome compared to other clusters.
keywords:
Fatty liver disease; Polygenic risk score; Precision medicine; Deep phenotyping; NAFLD comorbidities; Latent class analysis.1 Introduction
Fatty liver disease (FLD) is a common disease caused by excessive fat buildup in the liver. Based on the histological characteristics, FLD can be divided into two categories: alcoholic and nonalcoholic fatty liver disease. NAFLD affects approximately 25% of the population (Younossi et al., 2016) and is increasingly prevalent as heterogeneous, chronic, and complex liver diseases (Younossi et al., 2016; Brar and Tsukamoto, 2019; Mato et al., 2019), regardless of ethnicity, age, and sex (Zhou et al., 2019; Doycheva et al., 2017; Younossi et al., 2020). Their impact is more significant than previously believed (Tilg and Targher, 2021). The diseases can advance from a state of simple steatosis to steatohepatitis (around 20% of individuals)(Vos et al., 2020), with or without fibrosis. If left untreated, they can further progress to cirrhosis, liver failure, and hepatocellular carcinoma (Benedict and Zhang, 2017; Yeh and Brunt, 2014; Vos et al., 2020).
A complicated and multilayered dynamic interaction of numerous factors, such as sex (Mauvais-Jarvis et al., 2020), the presence of several genetic variations (Trépo and Valenti, 2020), the coexistence of various comorbidities (Byrne and Targher, 2015), the composition of the microbiota (Sharpton et al., 2021) and others, results in the clinical presentation of NAFLD. Although metabolic dysfunction, obesity, or excess weight are frequently the root causes (Chalasani et al., 2012; Targher et al., 2020; Marchesini et al., 2001; Arrese et al., 2021), people of Chinese descent who do not have metabolic syndrome have been found to have a greater impact on the accumulation of fat in the liver when they carry the gene patatin-like phospholipase domain containing 3 (PNPLA3), which is strongly linked to NAFLD (Fan et al., 2017; Shen et al., 2014). A new acronym formed metabolic (dysfunction)-associated fatty liver disease (MAFLD). Because of the disease’s high heterogeneity and complexity (Wang et al., 2022), a one-size-fits-all treatment approach is no longer suitable (Eslam et al., 2020). To provide effective treatment, it is crucial to tailor the approach according to the individual’s unique phenotypic and genetic information.
Deep phenotyping is defined as the precise and comprehensive characterization of patients’ phenotypic abnormalities, often involving the stratification of patients into disease subclasses (Robinson, 2012). Electronic health records (EHR) have been used to create comorbidity networks (Glicksberg et al., 2016), identify disease subgroups (Li et al., 2015), and predict disease outcomes (Abraham et al., 2022; Norgeot et al., 2019). Machine learning (ML) has been widely recognized as a scalable approach for identifying patient phenotypes. Applying machine learning in the field of NAFLD is emerging (Sood et al., 2018; Kantartzis and Stefan, 2023; Ye et al., 2022). However, deep phenotyping studies that analyze complex comorbidities and genetic factors remain limited.
In this study, we aim to: i) use phenotype and genotype data to identify distinct subgroups associated with NAFLD, ii) explore probabilistic methods (namely, latent class analysis) to identify subcohorts, and iii) gain insights about comorbidities in each subgroup. Our analysis identified five distinct subgroups of NAFLD patients: subgroup 1 (Non-Obese Metabolic NAFLD), subgroup 2 (Elevated NAFLD with High Genetic Risk), subgroup 3 (Metabolic-Multi-Morbid NAFLD with Psychoneurological Burden), subgroup 4 (Male Dominant Cardiorenal NAFLD), and subgroup 5 (Non-Metabolic NAFLD). Patients in subgroup 4 had significantly higher risks of cirrhosis, liver transplantation, and HCC than those in other subgroups. Subgroup 2, characterized by genetic predisposition, is significantly associated with cirrhosis, which is consistent with previous findings (Liu et al., 2022) showing risk allele carriers were at higher risk of hepatic progression rather than cardiometabolic complications.
2 Methods & Datasets
2.1 Datasets.
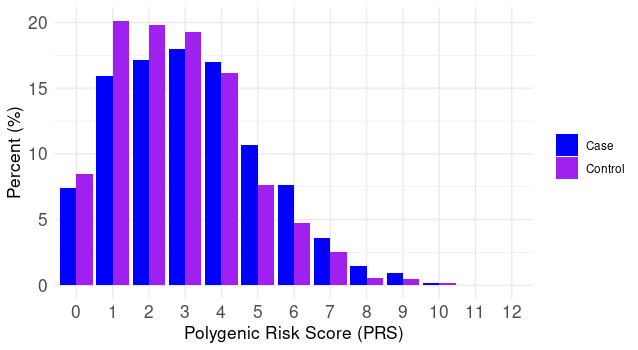
This work was conducted on data extracted from patients’ EHR, including their demographic details, clinical variables, characterized comorbidities, and genotype information from participants in the Mayo Clinic Tapestry study, with approval from the Institutional Review Board (IRB). We identified 3,408 patients with FLD (60.7% females, 60.2 mean age (13.1 standard deviations)) and 4,739 control patients (79.6% females, 43.7 mean age, 14.9 standard deviations) in a population genomics study (Appendix Table A1). We collected sociodemographic information on gender, age, income, education, race, and ethnicity. Anthropometric measurements include recent height, weight, and BMI. Clinical variables include C-reactive protein (CRP), high-density and low-density lipoprotein (HDL and LDL), cholesterol, triglycerides (TG), glucose fasting (GF), hemoglobin A1C (HbA1C), blood urea nitrogen (BUN), and hepatitis B core (HBC). Liver function tests include aspartate transaminase (AST), alanine transaminase (ALT), alkaline phosphatase (ALP), gamma-glutamyl transferase (GGT), and prothrombin time (PT). For related comorbidities, we extracted the patient’s diagnosis of obesity, hyperlipidemia, metabolic syndrome (MetS), cardiovascular disease (CVD), diabetes, sleep apnea, osteoarthritis (OA), depression, gastroesophageal reflux disease (GERD), migraine, hypertension, chronic kidney disease (CKD), and neurological problems by using the tenth revision of the International Statistical Classification of Diseases and Related Health Problems (ICD-10). Natural language processing was used to further refine diagnosis in patients’ clinical notes. We selected six common single nucleotide polymorphism (SNP) variants identified through genome-wide association studies (Miao et al., 2022) to calculate the polygenic risk score (PRS). PNPLA3 rs738409, PNPLA3 rs2294918, TM6SF2 rs58542926, SAMM50 rs2143571, GATAD2A rs4808199, and NCAN rs2228603 genotypes were coded as dosages 0, 1, and 2 for noncarriers, heterozygous carriers, and homozygous carriers of the risk-increasing allele, respectively. For each participant, the PRS was calculated as the sum of these SNP dosages (range, 0–12) (Appendix Figure A1). In preparation for the LCA computation, PRS values were divided into three categories, classified as low, middle, and high PRS (Park, 2023) where the PRS was 0 to 2, 3 to 4, and using 40%, 50% to 80%, and 90% quantile values, respectively (Appendix Table A2). Indeed, due to data unavailability, our analysis does not include lifestyle factors such as smoking history, drinking history, as well as family history. For the available data, only significant features were included and significance was determined using stepwise regression. Race, ethnicity, and education were excluded due to their low statistical significance. We also excluded features with high missing values, e.g., HBC, GF, and PT. All continuous values were categorized into binary indicators (Appendix Table A3). The normal range of the clinical variables was collected from the Mayo Clinic website.
2.2 Subgroup identification algorithm.
The task of patient stratification requires an unsupervised clustering method, because of the lack of ground truth labels. In medical literature, latent class analysis (LCA) is the most commonly used method for patient stratification (Andreacchi et al., 2021; Dong et al., 2022; Byale et al., 2022). Compared to K-means clustering, literature has shown that LCA is more robust and consistent in subgroup identification(Sinha et al., 2021). LCA provides statistical evidence for determining the most appropriate number of clusters – a main advantage, compared to clustering approaches that require an arbitrarily chosen cluster number. So we performed LCA using the poLCA package (Linzer and Lewis, 2011) in RStudio (4.3.0 [2023-04-21]) to identify latent classes within the NAFLD patients. LCA is a mixture model that divides a population into mutually exclusive and exhaustive latent classes based on the probability distributions of underlying variables. For the model selection process, up to 10 classes were assessed. Standard fit statistics were utilized to carefully choose the ultimate model, which encompassed: i) statistical metrics such as Akaike information criterion (AIC), Bayesian information criterion (BIC), consistent AIC (CAIC), adjusted BIC (aBIC) log-likelihood, likelihood ration, and entropy (Sinha et al., 2021; Weller et al., 2020) where lower values of BIC indicated improved fit; ii) class sample sizes (all exceeding 5%); and iii) clinical significance, ensuring interpretability and alignment with established scientific knowledge (Andreacchi et al., 2021; Tein et al., 2013). Characteristics were organized into clusters by employing the vector assignment of predicted class memberships.
3 Results
|
log-likelihood | BIC | aBIC | cAIC | likelihood-ratio | Entropy | ||
|---|---|---|---|---|---|---|---|---|
| 2 | -21949.82 | 44318.04 | 44143.30 | 44373.04 | 13785.18 | 0.735 | ||
| 3 | -21734.78 | 44100.97 | 43837.28 | 44183.97 | 13355.11 | 0.664 | ||
| 4 | -21567.85 | 43980.13 | 43627.47 | 44091.13 | 13021.25 | 0.705 | ||
| 5 | -21448.91 | 43955.25 | 43513.64 | 44094.25 | 12783.37 | 0.761 | ||
| 6 | -21362.00 | 43994.44 | 43463.87 | 44161.44 | 12609.55 | 0.76 | ||
| 7 | -21288.66 | 44060.75 | 43441.22 | 44255.75 | 12462.86 | 0.738 | ||
| 8 | -21218.50 | 44133.44 | 43424.96 | 44356.44 | 12322.54 | 0.679 | ||
| 9 | -21162.08 | 44233.61 | 43436.16 | 44484.61 | 12209.70 | 0.7 | ||
| 10 | -21115.00 | 44352.47 | 43466.07 | 44631.47 | 12115.55 | 0.594 |
3.1 Study Cohort.
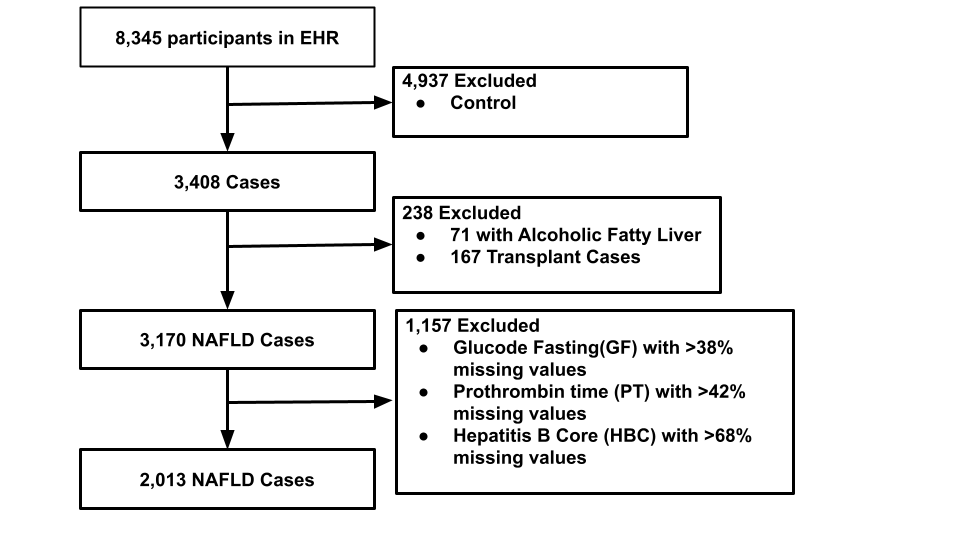
A total of 2,013 (59.0%) patients were eligible for analysis from 3,408 cases after the exclusion criteria (Non-NAFLD=238) and removing missing values (N=1,157) (Appendix Figure A2). The mean age of cases was 60.6 years (18-100 years (13.2 standard deviation)). In NAFLD cases, the majority of participants were female (62.1%), compared to non-NAFLD cases (42.4%). NAFLD patients had greater metabolic syndrome, obesity, and comorbidities like hyperlipidemia, hypertension, as well as neurological disorders.
3.2 NAFLD Subgroups Using LCA.
In order to determine the optimal number of clusters and the best fit for the model, multiple solutions were tested and statistically evaluated. The LCA included the top 16 indicators (p.001) using stepwise regression (Dong et al., 2022): Gender, hyperlipidemia, MetS, sleep apnea, hypertension, CKD, A1C, ALT, AST, ALP, BMI, BUN, HDL, LDL, TG, and OA were selected for analysis (Appendix Table A4) and the best solution was achieved with 5 clusters. Table 1 summarizes the model fit indices. The choice of this cluster size was mainly based on the i) BIC value, which indicates the model’s fit, and ii) entropy, which signifies the degree of class separation. A low BIC value and high entropy are more desirable. We found that a class size of 5 gives the best performance in terms of BIC (43955.25) and entropy (0.761). Table 2 summarizes the cluster characteristics. The initial prior probabilities were randomly assigned for each cluster by the software. Upon implementing LCA, we calculated the mean prior probabilities for the latent classes, resulting in values of 0.192, 0.076, 0.245, 0.249, and 0.238, respectively, where lower probabilities suggest sparser class assignments. Cluster 2 appears more sparse than the other classes.
Non-Obese Metabolic NAFLD. This cluster comprised 18% (n = 361) of the NAFLD cases and was more likely to be older (65.2 mean age) and female. These patients had high metabolic syndrome (99.7%), hyperlipidemia (87.5%), and OA (64.0%) compared to other clusters. However, these patients were less likely to be obese (37.9%) or to have diabetes, hypertension, or abnormal lab values, though they had an increased risk factor for migraine and GERD.
|
|
|
|
|
|
||||||||||||||||||||||||
|---|---|---|---|---|---|---|---|---|---|---|---|---|---|---|---|---|---|---|---|---|---|---|---|---|---|---|---|---|---|
| Age (Years) | Mean (SD) | 65.2 (11.2) | 59.4 (13.1) | 60.1 (12.3) | 64.6 (11.9) | 53.8 (13.9) | 60.6 (13.2) | ||||||||||||||||||||||
| Gender | Female | 272 (75.3%) | 83 (53.9%) | 507 (100%) | 0 (0%) | 389 (80.0%) | 1251 (62.1%) | ||||||||||||||||||||||
| BMI | Obesity | 137 (37.9%) | 100 (64.9%) | 427 (84.3%) | 344 (68.1%) | 295 (60.7%) | 1303 (64.7%) | ||||||||||||||||||||||
| Overweight | 143 (39.6%) | 38 (24.7%) | 57 (11.2%) | 141 (27.9%) | 136 (28.0%) | 515 (25.6%) | |||||||||||||||||||||||
| Normal | 81 (22.4%) | 16 (10.4%) | 22 (4.3%) | 19 (3.8%) | 53 (10.9%) | 53 (10.9%) | |||||||||||||||||||||||
| Hyperlipidemia | Yes | 316 (87.5%) | 74 (48.1%) | 355 (70.0%) | 396 (78.4%) | 0 (0%) | 1141 (56.7%) | ||||||||||||||||||||||
| Diabetes | Type 2 | 119 (33.0%) | 67 (43.5%) | 300 (59.2%) | 242 (47.9%) | 57 (11.7%) | 785 (39.0%) | ||||||||||||||||||||||
| MetS | Yes | 360 (99.7%) | 117 (76.0%) | 499 (98.4%) | 496 (98.2%) | 148 (30.5%) | 1620 (80.5%) | ||||||||||||||||||||||
| CVD | Yes | 155 (42.9%) | 47 (30.5%) | 215 (42.4%) | 249 (49.3%) | 95 (19.5%) | 761 (37.8%) | ||||||||||||||||||||||
| Hypertension | Yes | 213 (59.0%) | 91 (59.1%) | 344 (67.9%) | 380 (75.2%) | 159 (32.7%) | 1187 (59.0%) | ||||||||||||||||||||||
| Depression | Yes | 116 (32.1%) | 47 (30.5%) | 231 (45.6%) | 143 (28.3%) | 170 (35.0%) | 707 (35.1%) | ||||||||||||||||||||||
| Migraine | Yes | 73 (20.2%) | 24 (15.6%) | 117 (23.1%) | 49 (9.7%) | 113 (23.3%) | 376 (18.7%) | ||||||||||||||||||||||
| Sleep Apnea | Yes | 130 (36.0%) | 58 (37.7%) | 293 (57.8%) | 291 (57.6%) | 100 (20.6%) | 872 (43.3%) | ||||||||||||||||||||||
| OA | Yes | 231 (64.0%) | 60 (39.0%) | 302 (59.6%) | 231 (45.7%) | 160 (32.9%) | 984 (48.9%) | ||||||||||||||||||||||
| Gerd | Yes | 174 (48.2%) | 55 (35.7%) | 261 (51.5%) | 184 (36.4%) | 144 (29.6%) | 818 (40.6%) | ||||||||||||||||||||||
| CKD | Yes | 90 (24.9%) | 38 (24.7%) | 182 (35.9%) | 227 (45.0%) | 69 (14.2%) | 606 (30.1%) | ||||||||||||||||||||||
| ALT | High | 6 (1.7%) | 131 (85.1%) | 34 (6.7%) | 50 (9.9%) | 44 (9.1%) | 265 (13.2%) | ||||||||||||||||||||||
| AST | High | 15 (4.2%) | 152 (98.7%) | 9 (1.8%) | 3 (0.6%) | 11 (2.3%) | 190 (9.4%) | ||||||||||||||||||||||
| ALP | High | 18 (5.0%) | 44 (28.6%) | 59 (11.6%) | 28 (5.5%) | 26 (5.3%) | 175 (8.7%) | ||||||||||||||||||||||
| BUN | High | 22 (6.1%) | 17 (11.0%) | 55 (10.8%) | 90 (17.8%) | 8 (1.6%) | 192 (9.5%) | ||||||||||||||||||||||
| LDL | High | 64 (17.7%) | 25 (16.2%) | 110 (21.7%) | 29 (5.7%) | 109 (22.4%) | 337 (16.7%) | ||||||||||||||||||||||
| HDL | Poor | 25 (6.9%) | 93 (60.4%) | 322 (63.5%) | 419 (83.0%) | 194 (39.9%) | 1053 (52.3%) | ||||||||||||||||||||||
| TG | High | 38 (10.5%) | 59 (38.3%) | 331 (65.3%) | 236 (46.7%) | 121 (24.9%) | 785 (39.0%) | ||||||||||||||||||||||
| PRS | High | 49 (13.6%) | 35 (22.7%) | 58 (11.4%) | 62 (12.3%) | 75 (15.4%) | 279 (13.9%) |
Elevated NAFLD with High Genetic Risk. This cluster was the smallest by proportion 8% (n = 154) of NAFLD cases and was characterized by labs suggesting liver inflammation and dysfunction, such as elevated ALT (85.1%), AST (98.7%) and ALP (28.6%). These patients had fewer comorbidities than other patients, but they exhibited a higher PRS value (22.7%) compared to other subgroups.
Metabolic-Multi-Morbid NAFLD with Psychoneurological Burden. This cluster comprised the largest number of patients, 25.2% (n = 507), and all were female (100%). These patients were defined by increased scores for psychiatric diagnoses: depression (45.6%), or any other mental health disorder, as well as migraine (23.1%) and sleep apnea (57.8%). We also observe that this subgroup has a higher level of comorbidities, including obesity (84.3%), diabetes (59.2%), BMI(40, 31.6%), MetS (98.4%), GERD (51.5%), OA (59.6%) and an increased level of TG (65.3%).
Male Dominant Cardiorenal NAFLD. This cluster comprised the second-largest number of patients 25% (n = 505) with NAFLD, and all were male (100%). CVD (49.3%), CKD (45.0%), hypertension (75.2%), and hyperlipidemia (78.4%) were more common among subgroup 4 patients, while depression and migraine were less common.
Non-Metabolic NAFLD. Patients in subgroup 5 tended to be younger (53.8 mean age), had fewer comorbidities than others, and were unlikely to have abnormal lab values. However, they had a slightly increased PRS value (15.4%). Subgroup 5 patients were relatively healthy compared to the other groups.
3.3 Insights into Complex Diseases.
We further computed the odds ratios (Table 3). With subgroup 1 as the reference, subgroup 4 was strongly associated with the highest risks for HCC (OR 11.78; 95% CI 1.56–89.21), liver transplant (OR 7; 95% CI 2.11–23.22), and increased risk of cirrhosis (OR 1.77; 95% CI 1.01–3.13) among all subgroups, while subgroup 3 was associated with higher risk for liver transplantation (OR 4.14; 95% CI 1.2–14.23) and increased risk of steatohepatitis (OR 1.33; 95% CI 0.94-1.88). Subgroup 2 was also strongly associated with the highest risk of cirrhosis (OR 3.87; 95% CI 2.05–7.3), steatohepatitis, and fibrosis, along with an elevated risk of HCC and liver transplants. Subgroup 5 exhibited a less significant impact on complex diseases, aligning with prior research indicating that this subgroup generally demonstrates better health conditions than the others.
| Classes | Fibrosis | Cirrhosis |
|
|
Steatohepatitis | ||||||||||
| 1 | ref | ref | ref | ref | ref | ||||||||||
| 2 |
|
3.87 (2.05,7.3) |
|
|
1.67 (1.06,2.63) | ||||||||||
| 3 |
|
|
|
4.14 (1.2,14.23) |
|
||||||||||
| 4 |
|
1.77 (1.01,3.13) | 11.78 (1.56,89.21) | 7 (2.11,23.22) |
|
||||||||||
| 5 |
|
|
|
|
|
Only
odds ratios with p 0.05 are color coded.
3.4 Summary, Limitations, and Future Work.
Among the 2,013 well-characterized NAFLD patients, 5 unique latent clusters were identified in this study. These subgroups had different clinical characteristics and different outcomes. Two groups had fewer comorbidities and more positive outcomes. Another subgroup with a high PRS value shows several complex disease outcomes. Our findings are consistent with prior studies reporting gender-stratified NAFLD (Ballestri et al., 2017), lipid liver NAFLD (Carrillo-Larco et al., 2022), and a comparatively healthy subgroup with younger patients with less complex disease (Vandromme et al., 2019). In addition, the subgroups reveal that NAFLD patients with high PRS values are at an increased risk of HCC (Thomas et al., 2022). Our study of heterogeneity among NAFLD patients benefited from the inclusion of personalized genetic data and a thorough utilization of EHR data, which may enable more precise prevention, diagnosis, and therapy planning. The limitations of our study are common to EHR-based projects, which often suffer missing values. Additionally we converted all of the continuous values to discrete values to make it computationally efficient which may include biases. To ensure AI trustworthiness and robustness in choosing the LCA model, an out-of-distribution (OOD) test is essential. The pre-processing, missing value imputation, subgroup interpretation, working with continuous values and performing OOD tests remain open to improvement.
We showed that unsupervised clustering can be used to identify clinically relevant disease subgroups with distinct patterns of adverse outcomes. If prospectively validated, these disease subgroups could help guide patient management and screening initiatives. Ongoing work is on expanding the PRS risk analysis, performing additional comorbidity validations, new patient assignment on the computed subgroups and comparing LCA with other unsupervised clustering methods.
Data Availability: Tapestry data were used under license, thus are not publicly available due to use restrictions. Reasonable requests for Tapestry data from qualified researchers may be directed to, Dr. Konstantinos Lazaridis, lazaridis.konstantinos@mayo.edu. Access to de-identified data will require a legal agreement and the permission of Helix.
Acknowledgement: Genomic data were provided by the Tapestry study supported by the Mayo Clinic Center for Individualized Medicine.
References
- Abraham et al. (2022) Abin Abraham, Brian Le, Idit Kosti, Peter Straub, Digna R Velez-Edwards, Lea K Davis, JM Newton, Louis J Muglia, Antonis Rokas, Cosmin A Bejan, et al. Dense phenotyping from electronic health records enables machine learning-based prediction of preterm birth. BMC medicine, 20(1):333, 2022.
- Andreacchi et al. (2021) Alessandra T Andreacchi, Urun Erbas Oz, Carol Bassim, Lauren E Griffith, Alexandra Mayhew, Marie Pigeyre, Saverio Stranges, Chris P Verschoor, and Laura N Anderson. Clustering of obesity-related characteristics: a latent class analysis from the Canadian longitudinal study on aging. Preventive Medicine, 153:106739, 2021.
- Arrese et al. (2021) Marco Arrese, Juan P Arab, Francisco Barrera, Benedikt Kaufmann, Luca Valenti, and Ariel E Feldstein. Insights into nonalcoholic fatty-liver disease heterogeneity. In Seminars in Liver Disease, volume 41, pages 421–434. Thieme Medical Publishers, Inc. 333 Seventh Avenue, 18th Floor, New York, NY …, 2021.
- Ballestri et al. (2017) Stefano Ballestri, Fabio Nascimbeni, Enrica Baldelli, Alessandra Marrazzo, Dante Romagnoli, and Amedeo Lonardo. NAFLD as a sexual dimorphic disease: role of gender and reproductive status in the development and progression of nonalcoholic fatty liver disease and inherent cardiovascular risk. Advances in therapy, 34:1291–1326, 2017.
- Benedict and Zhang (2017) Mark Benedict and Xuchen Zhang. Non-alcoholic fatty liver disease: An expanded review. World journal of hepatology, 9(16):715, 2017.
- Brar and Tsukamoto (2019) Gurmehr Brar and Hidekazu Tsukamoto. Alcoholic and non-alcoholic steatohepatitis: global perspective and emerging science. Journal of Gastroenterology, 54:218–225, 2019.
- Byale et al. (2022) Anjali Byale, Ryan J Lennon, Siddharth Byale, Margaret Breen-Lyles, Adam L Edwinson, Ruchi Gupta, Brian E Lacy, Janet E Olson, Lesley A Houghton, and Madhusudan Grover. High-dimensional clustering of 4000 irritable bowel syndrome patients reveals seven distinct disease subsets. Clinical Gastroenterology and Hepatology, 2022.
- Byrne and Targher (2015) Christopher D Byrne and Giovanni Targher. NAFLD: a multisystem disease. Journal of hepatology, 62(1):S47–S64, 2015.
- Carrillo-Larco et al. (2022) Rodrigo M Carrillo-Larco, Wilmer Cristobal Guzman-Vilca, Manuel Castillo-Cara, Claudia Alvizuri-Gómez, Saleh Alqahtani, and Vanessa Garcia-Larsen. Phenotypes of non-alcoholic fatty liver disease (NAFLD) and all-cause mortality: unsupervised machine learning analysis of NHANES III. BMJ open, 12(11):e067203, 2022.
- Chalasani et al. (2012) Naga Chalasani, Zobair Younossi, Joel E Lavine, Anna Mae Diehl, Elizabeth M Brunt, Kenneth Cusi, Michael Charlton, and Arun J Sanyal. The diagnosis and management of non-alcoholic fatty liver disease: Practice guideline by the American Association for the Study of Liver Diseases, American College of Gastroenterology, and the American Gastroenterological Association. Hepatology, 55(6):2005–2023, 2012.
- Dong et al. (2022) Bin Dong, Yiling Yao, Ruicong Xue, Weihao Liang, Jiangui He, Fangfei Wei, Yugang Dong, Xin He, and Chen Liu. Distinct implications of body mass index in different subgroups of nonobese patients with heart failure with preserved ejection fraction: a latent class analysis of data from the TOPCAT trial. BMC medicine, 20(1):1–12, 2022.
- Doycheva et al. (2017) Iliana Doycheva, Kymberly D Watt, and Naim Alkhouri. Nonalcoholic fatty liver disease in adolescents and young adults: the next frontier in the epidemic. Hepatology, 65(6):2100–2109, 2017.
- Eslam et al. (2020) Mohammed Eslam, Arun J Sanyal, Jacob George, Arun Sanyal, Brent Neuschwander-Tetri, Claudio Tiribelli, David E Kleiner, Elizabeth Brunt, Elisabetta Bugianesi, Hannele Yki-Järvinen, et al. MAFLD: a consensus-driven proposed nomenclature for metabolic associated fatty liver disease. Gastroenterology, 158(7):1999–2014, 2020.
- Fan et al. (2017) Jian-Gao Fan, Seung-Up Kim, and Vincent Wai-Sun Wong. New trends on obesity and NAFLD in Asia. Journal of hepatology, 67(4):862–873, 2017.
- Glicksberg et al. (2016) Benjamin S Glicksberg, Li Li, Marcus A Badgeley, Khader Shameer, Roman Kosoy, Noam D Beckmann, Nam Pho, Jörg Hakenberg, Meng Ma, Kristin L Ayers, et al. Comparative analyses of population-scale phenomic data in electronic medical records reveal race-specific disease networks. Bioinformatics, 32(12):i101–i110, 2016.
- Kantartzis and Stefan (2023) Konstantinos Kantartzis and Norbert Stefan. Clustering NAFLD: phenotypes of nonalcoholic fatty liver disease and their differing trajectories, 2023.
- Li et al. (2015) Li Li, Wei-Yi Cheng, Benjamin S Glicksberg, Omri Gottesman, Ronald Tamler, Rong Chen, Erwin P Bottinger, and Joel T Dudley. Identification of type 2 diabetes subgroups through topological analysis of patient similarity. Science translational medicine, 7(311):311ra174–311ra174, 2015.
- Linzer and Lewis (2011) Drew A Linzer and Jeffrey B Lewis. polca: An r package for polytomous variable latent class analysis. Journal of statistical software, 42:1–29, 2011.
- Liu et al. (2022) Zhenqiu Liu, Chen Suo, Oumin Shi, Chunqing Lin, Renjia Zhao, Huangbo Yuan, Li Jin, Tiejun Zhang, and Xingdong Chen. The health impact of MAFLD, a novel disease cluster of NAFLD, is amplified by the integrated effect of fatty liver disease-related genetic variants. Clinical Gastroenterology and Hepatology, 20(4):e855–e875, 2022.
- Marchesini et al. (2001) Giulio Marchesini, Mara Brizi, Giampaolo Bianchi, Sara Tomassetti, Elisabetta Bugianesi, Marco Lenzi, Arthur J McCullough, Stefania Natale, Gabriele Forlani, and Nazario Melchionda. Nonalcoholic fatty liver disease: a feature of the metabolic syndrome. Diabetes, 50(8):1844–1850, 2001.
- Mato et al. (2019) José M Mato, Cristina Alonso, Mazen Noureddin, and Shelly C Lu. Biomarkers and subtypes of deranged lipid metabolism in non-alcoholic fatty liver disease. World journal of gastroenterology, 25(24):3009, 2019.
- Mauvais-Jarvis et al. (2020) Franck Mauvais-Jarvis, Noel Bairey Merz, Peter J Barnes, Roberta D Brinton, Juan-Jesus Carrero, Dawn L DeMeo, Geert J De Vries, C Neill Epperson, Ramaswamy Govindan, Sabra L Klein, et al. Sex and gender: modifiers of health, disease, and medicine. The Lancet, 396(10250):565–582, 2020.
- Miao et al. (2022) Zong Miao, Kristina M Garske, David Z Pan, Amogha Koka, Dorota Kaminska, Ville Männistö, Janet S Sinsheimer, Jussi Pihlajamäki, and Päivi Pajukanta. Identification of 90 nafld gwas loci and establishment of nafld prs and causal role of nafld in coronary artery disease. Human Genetics and Genomics Advances, 3(1), 2022.
- Norgeot et al. (2019) Beau Norgeot, Benjamin S Glicksberg, Laura Trupin, Dmytro Lituiev, Milena Gianfrancesco, Boris Oskotsky, Gabriela Schmajuk, Jinoos Yazdany, and Atul J Butte. Assessment of a deep learning model based on electronic health record data to forecast clinical outcomes in patients with rheumatoid arthritis. JAMA network open, 2(3):e190606–e190606, 2019.
- Park (2023) Sunmin Park. Association of polygenic risk scores for insulin resistance risk and their interaction with a plant-based diet, especially fruits, vitamin C, and flavonoid intake, in Asian adults. Nutrition, 111:112007, 2023.
- Robinson (2012) Peter N Robinson. Deep phenotyping for precision medicine. Human mutation, 33(5):777–780, 2012.
- Sharpton et al. (2021) SR Sharpton, B Schnabl, R Knight, and R Loomba. Current concepts, opportunities, and challenges of gut microbiome-based personalized medicine in nonalcoholic fatty liver disease. Cell metabolism, 33(1):21–32, 2021.
- Shen et al. (2014) J Shen, GL-H Wong, HL-Y Chan, H-Y Chan, DK-W Yeung, RS-M Chan, AM-L Chim, AW-H Chan, PC-L Choi, J Woo, et al. PNPLA 3 gene polymorphism accounts for fatty liver in community subjects without metabolic syndrome. Alimentary pharmacology & therapeutics, 39(5):532–539, 2014.
- Sinha et al. (2021) Pratik Sinha, Carolyn S Calfee, and Kevin L Delucchi. Practitioner’s guide to latent class analysis: methodological considerations and common pitfalls. Critical care medicine, 49(1):e63, 2021.
- Sood et al. (2018) Vikrant Sood, Rajeev Khanna, Dinesh Rawat, Shvetank Sharma, Seema Alam, and Shiv Kumar Sarin. Study of family clustering and PNPLA3 gene polymorphism in pediatric non alcoholic fatty liver disease. Indian Pediatrics, 55:561–567, 2018.
- Targher et al. (2020) Giovanni Targher, Christopher D Byrne, and Herbert Tilg. NAFLD and increased risk of cardiovascular disease: clinical associations, pathophysiological mechanisms and pharmacological implications. Gut, 69(9):1691–1705, 2020.
- Tein et al. (2013) Jenn-Yun Tein, Stefany Coxe, and Heining Cham. Statistical power to detect the correct number of classes in latent profile analysis. Structural equation modeling: a multidisciplinary journal, 20(4):640–657, 2013.
- Thomas et al. (2022) Claire E Thomas, Brenda Diergaarde, Allison L Kuipers, Jennifer J Adibi, Hung N Luu, Xuling Chang, Rajkumar Dorajoo, Chew-Kiat Heng, Chiea-Chuen Khor, Renwei Wang, et al. NAFLD polygenic risk score and risk of hepatocellular carcinoma in an East Asian population. Hepatology Communications, 6(9):2310–2321, 2022.
- Tilg and Targher (2021) Herbert Tilg and Giovanni Targher. NAFLD-related mortality: simple hepatic steatosis is not as ‘benign’as thought. Gut, 70(7):1212–1213, 2021.
- Trépo and Valenti (2020) Eric Trépo and Luca Valenti. Update on NAFLD genetics: from new variants to the clinic. Journal of hepatology, 72(6):1196–1209, 2020.
- Vandromme et al. (2019) Maxence Vandromme, Tomi Jun, Ponni Perumalswami, Joel T Dudley, Andrea Branch, and Li Li. Automated phenotyping of patients with non-alcoholic fatty liver disease reveals clinically relevant disease subtypes. In PACIFIC SYMPOSIUM ON BIOCOMPUTING 2020, pages 91–102. World Scientific, 2019.
- Vos et al. (2020) Theo Vos, Stephen S Lim, Cristiana Abbafati, Kaja M Abbas, Mohammad Abbasi, Mitra Abbasifard, Mohsen Abbasi-Kangevari, Hedayat Abbastabar, Foad Abd-Allah, Ahmed Abdelalim, et al. Global burden of 369 diseases and injuries in 204 countries and territories, 1990–2019: a systematic analysis for the global burden of disease study 2019. The Lancet, 396(10258):1204–1222, 2020.
- Wang et al. (2022) Yuying Wang, Yuetian Yu, Haojie Zhang, Chi Chen, Heng Wan, Yi Chen, Fangzhen Xia, Shiyan Yu, Ningjian Wang, Lin Ye, et al. Cardiovascular and renal burdens among patients with MAFLD and NAFLD in China. Frontiers in Endocrinology, 13:968766, 2022.
- Weller et al. (2020) Bridget E Weller, Natasha K Bowen, and Sarah J Faubert. Latent class analysis: a guide to best practice. Journal of Black Psychology, 46(4):287–311, 2020.
- Ye et al. (2022) Junzhao Ye, Xiaodong Zhuang, Xin Li, Xiaorong Gong, Yanhong Sun, Wei Wang, Shiting Feng, Tingfeng Wu, and Bihui Zhong. Novel metabolic classification for extrahepatic complication of metabolic associated fatty liver disease: A data-driven cluster analysis with international validation. Metabolism, 136:155294, 2022.
- Yeh and Brunt (2014) Matthew M Yeh and Elizabeth M Brunt. Pathological features of fatty liver disease. Gastroenterology, 147(4):754–764, 2014.
- Younossi et al. (2016) Zobair M Younossi, Aaron B Koenig, Dinan Abdelatif, Yousef Fazel, Linda Henry, and Mark Wymer. Global epidemiology of nonalcoholic fatty liver disease—meta-analytic assessment of prevalence, incidence, and outcomes. Hepatology, 64(1):73–84, 2016.
- Younossi et al. (2020) Zobair M Younossi, Maria Stepanova, Youssef Younossi, Pegah Golabi, Alita Mishra, Nila Rafiq, and Linda Henry. Epidemiology of chronic liver diseases in the USA in the past three decades. Gut, 69(3):564–568, 2020.
- Zhou et al. (2019) Feng Zhou, Jianghua Zhou, Wenxin Wang, Xiao-Jing Zhang, Yan-Xiao Ji, Peng Zhang, Zhi-Gang She, Lihua Zhu, Jingjing Cai, and Hongliang Li. Unexpected rapid increase in the burden of NAFLD in China from 2008 to 2018: a systematic review and meta-analysis. Hepatology, 70(4):1119–1133, 2019.
Appendix A First Appendix
|
|
|
P-value |
|
||||||||||
|---|---|---|---|---|---|---|---|---|---|---|---|---|---|---|
| Age | Mean (SD) | 43.7 (14.9) | 60.1 (13.2) | 61.8 (11.9) | <0.001 | 50.5 (16.4) | ||||||||
| Gender | Female | 3928 (79.6%) | 1967 (62.1%) | 101 (42.4%) | <0.001 | 5996 (71.9%) | ||||||||
| Male | 1009 (20.4%) | 1202 (37.9%) | 137 (57.6%) | 2348 (28.1%) | ||||||||||
| Missing | 0 (0%) | 1 (0.0%) | 0 (0%) | 1 (0.0%) | ||||||||||
| BMI | Normal | 1702 (34.5%) | 354 (11.2%) | 81 (34.0%) | <0.001 | 2137 (25.6%) | ||||||||
| Obesity I | 788 (16.0%) | 932 (29.4%) | 49 (20.6%) | 1769 (21.2%) | ||||||||||
| Obesity II | 410 (8.3%) | 541 (17.1%) | 12 (5.0%) | 963 (11.5%) | ||||||||||
| Obesity III | 317 (6.4%) | 465 (14.7%) | 6 (2.5%) | 788 (9.4%) | ||||||||||
| Overweight | 1542 (31.2%) | 863 (27.2%) | 87 (36.6%) | 2492 (29.9%) | ||||||||||
| Underweight | 84 (1.7%) | 12 (0.4%) | 3 (1.3%) | 99 (1.2%) | ||||||||||
| Missing | 94 (1.9%) | 3 (0.1%) | 0 (0%) | 97 (1.2%) | ||||||||||
| Obesity | No | 4181 (84.7%) | 1758 (55.5%) | 198 (83.2%) | <0.001 | 6137 (73.5%) | ||||||||
| Yes | 756 (15.3%) | 1412 (44.5%) | 40 (16.8%) | 2208 (26.5%) | ||||||||||
| Hyperlipidemia | No | 4937 (100%) | 1626 (51.3%) | 162 (68.1%) | <0.001 | 6725 (80.6%) | ||||||||
| Yes | 0 (0%) | 1544 (48.7%) | 76 (31.9%) | 1620 (19.4%) | ||||||||||
| Diabetes | No | 4926 (99.8%) | 2207 (69.6%) | 165 (69.3%) | <0.001 | 7298 (87.5%) | ||||||||
| Type 1 | 11 (0.2%) | 5 (0.2%) | 0 (0%) | 16 (0.2%) | ||||||||||
| Type 2 | 0 (0%) | 958 (30.2%) | 73 (30.7%) | 1031 (12.4%) | ||||||||||
| MetS | No | 4937 (100%) | 990 (31.2%) | 90 (37.8%) | <0.001 | 6017 (72.1%) | ||||||||
| Yes | 0 (0%) | 2180 (68.8%) | 148 (62.2%) | 2328 (27.9%) | ||||||||||
| CVD | No | 4303 (87.2%) | 2131 (67.2%) | 148 (62.2%) | <0.001 | 6582 (78.9%) | ||||||||
| Yes | 634 (12.8%) | 1039 (32.8%) | 90 (37.8%) | 1763 (21.1%) | ||||||||||
| Hypertension | No | 4209 (85.3%) | 1538 (48.5%) | 79 (33.2%) | <0.001 | 5826 (69.8%) | ||||||||
| Yes | 728 (14.7%) | 1632 (51.5%) | 159 (66.8%) | 2519 (30.2%) | ||||||||||
| OA | No | 3425 (69.4%) | 1850 (58.4%) | 185 (77.7%) | <0.001 | 5460 (65.4%) | ||||||||
| Yes | 1512 (30.6%) | 1320 (41.6%) | 53 (22.3%) | 2885 (34.6%) | ||||||||||
| Depression | No | 3366 (68.2%) | 2214 (69.8%) | 189 (79.4%) | 0.14 | 5769 (69.1%) | ||||||||
| Yes | 1571 (31.8%) | 956 (30.2%) | 49 (20.6%) | 2576 (30.9%) | ||||||||||
| GERD | No | 4276 (86.6%) | 2034 (64.2%) | 197 (82.8%) | <0.001 | 6507 (78.0%) | ||||||||
| Yes | 661 (13.4%) | 1136 (35.8%) | 41 (17.2%) | 1838 (22.0%) | ||||||||||
| Neurological | No | 4927 (99.8%) | 3142 (99.1%) | 235 (98.7%) | 0.0085 | 8304 (99.5%) | ||||||||
| Yes | 10 (0.2%) | 28 (0.9%) | 3 (1.3%) | 41 (0.5%) | ||||||||||
| Migraine | No | 4041 (81.9%) | 2643 (83.4%) | 227 (95.4%) | 0.0675 | 6911 (82.8%) | ||||||||
| Yes | 896 (18.1%) | 527 (16.6%) | 11 (4.6%) | 1434 (17.2%) | ||||||||||
| Sleep | No | 4377 (88.7%) | 1997 (63.0%) | 209 (87.8%) | <0.001 | 6583 (78.9%) | ||||||||
| Yes | 560 (11.3%) | 1173 (37.0%) | 29 (12.2%) | 1762 (21.1%) | ||||||||||
| PRS | 0% to 50% | 2393 (48.5%) | 1284 (40.5%) | 97 (40.8%) | <0.001 | 3774 (45.2%) | ||||||||
| 50% to 90% | 2126 (43.1%) | 1445 (45.6%) | 112 (47.1%) | 3683 (44.1%) | ||||||||||
| Top 10% | 418 (8.5%) | 441 (13.9%) | 29 (12.2%) | 888 (10.6%) | ||||||||||
| CKD | No | 4656 (94.3%) | 2345 (74.0%) | 107 (45.0%) | <0.001 | 7108 (85.2%) | ||||||||
| Yes | 281 (5.7%) | 825 (26.0%) | 131 (55.0%) | 1237 (14.8%) | ||||||||||
| A1C (%) | Diabetes | 14 (0.3%) | 507 (16.0%) | 32 (13.4%) | <0.001 | 553 (6.6%) | ||||||||
| Normal | 1616 (32.7%) | 1191 (37.6%) | 140 (58.8%) | 2947 (35.3%) | ||||||||||
| Prediabetes | 195 (3.9%) | 722 (22.8%) | 45 (18.9%) | 962 (11.5%) | ||||||||||
| Missing | 3112 (63.0%) | 750 (23.7%) | 21 (8.8%) | 3883 (46.5%) | ||||||||||
| ALT (U/L) | High | 100 (2.0%) | 407 (12.8%) | 31 (13.0%) | <0.001 | 538 (6.4%) | ||||||||
| Low | 6 (0.1%) | 3 (0.1%) | 0 (0%) | 9 (0.1%) | ||||||||||
| Normal | 2789 (56.5%) | 2405 (75.9%) | 206 (86.6%) | 5400 (64.7%) | ||||||||||
| Missing | 2042 (41.4%) | 355 (11.2%) | 1 (0.4%) | 2398 (28.7%) | ||||||||||
| AST (U/L) | High | 66 (1.3%) | 293 (9.2%) | 29 (12.2%) | <0.001 | 388 (4.6%) | ||||||||
| Low | 1 (0.0%) | 2 (0.1%) | 0 (0%) | 3 (0.0%) | ||||||||||
| Normal | 3015 (61.1%) | 2538 (80.1%) | 206 (86.6%) | 5759 (69.0%) | ||||||||||
| Missing | 1855 (37.6%) | 337 (10.6%) | 3 (1.3%) | 2195 (26.3%) | ||||||||||
| ALP (U/L) | High | 81 (1.6%) | 252 (7.9%) | 45 (18.9%) | <0.001 | 377 (4.5%) | ||||||||
| Low | 138 (2.8%) | 74 (2.3%) | 2 (0.8%) | 214 (2.6%) | ||||||||||
| Normal | 2660 (53.9%) | 2511 (79.2%) | 187 (78.6%) | 5358 (64.2%) | ||||||||||
| Missing | 2058 (41.7%) | 333 (10.5%) | 4 (1.7%) | 2395 (28.7%) | ||||||||||
| BUN (mg/dl) | High | 63 (1.3%) | 252 (7.9%) | 77 (32.4%) | <0.001 | 392 (4.7%) | ||||||||
| Low | 68 (1.4%) | 21 (0.7%) | 3 (1.3%) | 92 (1.1%) | ||||||||||
| Normal | 3824 (77.5%) | 2752 (86.8%) | 155 (65.1%) | 6731 (80.7%) | ||||||||||
| Missing | 982 (19.9%) | 145 (4.6%) | 3 (1.3%) | 1130 (13.5%) | ||||||||||
| LDL (mg/dl) | Best | 448 (9.1%) | 670 (21.1%) | 57 (23.9%) | <0.001 | 1175 (14.1%) | ||||||||
| High | 585 (11.8%) | 496 (15.6%) | 36 (15.1%) | 1117 (13.4%) | ||||||||||
| Optimal | 2592 (52.5%) | 1515 (47.8%) | 132 (55.5%) | 4239 (50.8%) | ||||||||||
| Missing | 1312 (26.6%) | 489 (15.4%) | 13 (5.5%) | 1814 (21.7%) | ||||||||||
| HDL (mg/dl) | Best | 1820 (36.9%) | 716 (22.6%) | 75 (31.5%) | <0.001 | 2611 (31.3%) | ||||||||
| Better | 917 (18.6%) | 618 (19.5%) | 53 (22.3%) | 1588 (19.0%) | ||||||||||
| Poor | 923 (18.7%) | 1378 (43.5%) | 98 (41.2%) | 2399 (28.7%) | ||||||||||
| Missing | 1277 (25.9%) | 458 (14.4%) | 12 (5.0%) | 1747 (20.9%) |
| Quantile | 10% | 20% | 30% | 40% | 50% | 60% | 70% | 80% | 90% | 100% |
| PRS Score | 1 | 1 | 2 | 2 | 3 | 3 | 4 | 4 | 6 | 12 |
| Categorical Conversion | Low | Medium | High | |||||||
| Variable Name | Range | Variable Name | Range | ||
|---|---|---|---|---|---|
| CRP (mg/L) | Low | <8 | TG (md/dL) | Desirable | <150 |
| High | >= 8 | High | >=150 | ||
| HDL (md/dL) | Poor | <50 | ALT (U/L) | High | >55 |
| Better | 50 to 59 | Normal | 7 to 55 | ||
| Best | >=60 | Low | <7 | ||
| LDL (md/dL) | Best | <70 | HbA1C (%) | Diabetes | >=6.5 |
| Optimal | 70 to 128 | Prediabetes | 5.7 to 6.5 | ||
| High | >=129 | Normal | <5.7 | ||
| BUN (md/dL) | High | >24 | GF (mg/dL) | Diabetes | >=126 |
| Normal | 6 to 24 | Prediabetes | 100 to 126 | ||
| Low | <6 | Normal | <100 | ||
| PT (seconds) | High | >12.5 | AST (U/L) | High | >48 |
| Normal | 9.4 to 12.5 | Normal | 8 to 48 | ||
| Low | <9.4 | Low | <8 | ||
| ALP (U/L) | High | >129 | PRS | High | >=6 |
| Normal | 40 to 129 | Middle | >=3 | ||
| Low | <40 | Low | <3 | ||
| Variable | Type of Variable | Scale of Measurement |
|
|
|||||
| Socio demographic | Age | Continuous | Years | Yes | |||||
| Gender | Categorical | Male or Female | Yes | Yes | |||||
| Race | Categorical |
|
|||||||
| Ethnicity | Categorical |
|
|||||||
| Anthropometric | Height | Continuous | kg | ||||||
| Weight | Continuous | cm | |||||||
| BMI | Continuous | — | Yes | Yes | |||||
| Clinical Variables | CRP | Categorical | mg/L | ||||||
| HDL | Continuous | mg/dL | Yes | Yes | |||||
| LDL | Continuous | mg/dL | Yes | Yes | |||||
| TG | Continuous | mg/dL | Yes | Yes | |||||
| GF | Continuous | mg/dL | |||||||
| HbA1C | Continuous | % | Yes | Yes | |||||
| BUN | Continuous | mg/dL | Yes | Yes | |||||
| HBc | Categorical |
|
|||||||
| AST | Continuous | U/L | Yes | Yes | |||||
| ALT | Continuous | U/L | Yes | Yes | |||||
| ALP | Continuous | U/L | Yes | Yes | |||||
| GGT | Continuous | U/L | |||||||
| PT | Continuous | Seconds | |||||||
| Comorbidities | Hyperlipidemia | Categorical | Yes or No | Yes | Yes | ||||
| MetS | Categorical | Yes or No | Yes | Yes | |||||
| CVD | Categorical | Yes or No | Yes | ||||||
| CKD | Categorical | Yes or No | Yes | Yes | |||||
| Diabetes | Categorical | Yes or No | Yes | ||||||
| Sleep Apnea | Categorical | Yes or No | Yes | Yes | |||||
| OA | Categorical | Yes or No | Yes | Yes | |||||
| Depression | Categorical | Yes or No | Yes | ||||||
| Migraine | Categorical | Yes or No | Yes | ||||||
|
Categorical | Yes or No | |||||||
| GERD | Categorical | Yes or No | Yes | ||||||
| Hypertension | Categorical | Yes or No | Yes | Yes | |||||
| Obesity | Categorical | Yes or No | Yes | ||||||
| Genotype Data |
|
Continuous | SNP dosages 0,1,2 | ||||||
| PNPLA3 rs2294918 | Continuous | SNP dosages 0,1,2 | |||||||
| TM6SF2 rs58542926 | Continuous | SNP dosages 0,1,2 | |||||||
| SAMM50 rs2143571 | Continuous | SNP dosages 0,1,2 | |||||||
| GATAD2A rs4808199 | Continuous | SNP dosages 0,1,2 | |||||||
| NCAN rs2228603 | Continuous | SNP dosages 0,1,2 | |||||||
| PRS | Continuous | — | Yes |