Conceptualization of this study, Methodology, Investigation, Data curation, Writing - Original draft preparation
Investigation, Data curation, Software, Writing - Original draft preparation
Investigation, Data curation, Software
[1] \creditConceptualization of this study, Methodology, Writing - Original draft preparation
Methodology, Writing - Original draft preparation
Methodology, Writing - Original draft preparation
[cor1]Corresponding author.
Exploring Multi-Programming-Language Commits and Their Impacts on Software Quality: An Empirical Study on Apache Projects
Abstract
Context: Modern software systems (e.g., Apache Spark) are usually written in multiple programming languages (PLs). There is little understanding on the phenomenon of multi-programming-language commits (MPLCs), which involve modified source files written in multiple PLs.
Objective: This work aims to explore MPLCs and their impacts on development difficulty and software quality.
Methods: We performed an empirical study on eighteen non-trivial Apache projects with 197,566 commits.
Results: (1) the most commonly used PL combination consists of all the four PLs, i.e., C/C++, Java, JavaScript, and Python; (2) 9% of the commits from all the projects are MPLCs, and the proportion of MPLCs in 83% of the projects goes to a relatively stable level; (3) more than 90% of the MPLCs from all the projects involve source files in two PLs; (4) the change complexity of MPLCs is significantly higher than that of non-MPLCs; (5) issues fixed in MPLCs take significantly longer to be resolved than issues fixed in non-MPLCs in 89% of the projects; (6) MPLCs do not show significant effects on issue reopen; (7) source files undergoing MPLCs tend to be more bug-prone; and (8) MPLCs introduce more bugs than non-MPLCs.
Conclusions: MPLCs are related to increased development difficulty and decreased software quality.
keywords:
Multi-Programming-Language Commit, Change Complexity, Bug Proneness, Bug Introduction, Issue Reopen, Open Source Software1 Introduction
Modern software systems, such as Apache Ambari and Spark, are usually written in multiple programming languages (PLs). One main reason for adopting multiple PLs is to reuse existing code with required functionalities (Grichi et al., 2021). Another main reason is to take advantages of specific PLs to implement certain features, to meet various software quality needs, and to improve software development efficiency (Grichi et al., 2021; Ray et al., 2014; Mayer and Bauer, 2015; Kochhar et al., 2016; Mayer, 2017; Mayer et al., 2017; Abidi et al., 2019a). Nowadays, multi-programming-language (MPL) software development is increasingly prevalent with the technology advances (Kontogiannis et al., 2006; Kochhar et al., 2016; Abidi et al., 2021).
However, despite great benefits of MPL systems, they are also facing various challenges. For instance, static code analysis is much more difficult in MPL systems than mono-language systems since multiple PLs and cross-language communication mechanisms need to be analyzed simultaneously (Shatnawi et al., 2019; Kargar et al., 2019).
In an MPL system, there inevitably exist a certain proportion of code changes that need to modify source files written in different PLs. Intuitively, a code change in which the modified source files are written in multiple PLs is likely to modify more than one component in a software system, and thus the complexity of such a change is relatively high. As a result, such a code change may need more effort and time to understand and analyze the impacts on the parts affected by the modified source files. We define an MPL commit (MPLC) in a version control system (e.g., Git) as a commit that involves modified source files written in two or more PLs.
Although there are a few studies that investigated the quality of MPL systems (Ray et al., 2014; Kochhar et al., 2016; Grichi et al., 2020), these studies took a project or pull request as an analysis unit, which is at a relatively high level and may not provide specific advice for software development practice. In contrast, a commit is in a finer granularity than a project or pull request, and developers deal with code changes in commits in daily development practices. Hence, we suggest to investigate MPL software development from the perspective of commits (i.e., MPLCs). To the best of our knowledge, the phenomenon of MPLCs in software development has not been comprehensively explored yet. In light of the potential impacts of MPLCs on development difficulty (e.g., cross-language change impact analysis (Shatnawi et al., 2019)) and software quality (e.g., bug introduction (Kochhar et al., 2016; Berger et al., 2019)), there is a need for exploring the phenomenon of MPLCs. To this end, we decided to conduct an empirical study in order to understand the state of MPLCs, their change complexity, as well as their impacts on open time of issues, issue reopen, bug proneness of source files, and bug introduction in real-life software projects, which provides a foundation for improving the practices of MPL software development.
The main contributions of this paper are summarized as follows:
-
•
This work is a first attempt to comprehensively explore the phenomenon of MPLCs in real-world settings.
-
•
The state of MPLCs (including the proportion of MPLCs and the number of PLs used in MPLCs) in MPL software systems is explored.
-
•
In this work, we investigated in depth the change complexity of MPLCs, open time of issues fixed in MPLCs, bug proneness of source files modified in MPLCs, as well as the impacts of MPLCs on issue reopen and bug introduction in MPL software systems.
This paper is an extended version of our previous conference paper (Li et al., 2021) published in the Proceedings of the 29th IEEE/ACM International Conference on Program Comprehension (ICPC 2021). The main extension of this journal version compared to the previous conference version lies in the following aspects: (1) we added three research questions on the use of PLs and the impacts of MPLCs on issue reopen and bug introduction; (2) we enriched the results of the research question on the proportion of MPLCs by calculating the correlation between the proportion of MPLCs and a measure (i.e., the entropy of PL use) reflecting how balanced PLs are used in the selected projects; and (3) we discussed the implications of results and threats to validity more comprehensively.
The remaining of this paper is organized as follows. Section 2 presents the related work; Section 3 describes the design of the empirical study; Section 4 presents the results of the study; Section 5 discusses the study results; Section 6 identifies the threats to validity of the results; and Section 7 concludes this work with future research directions.
2 Related Work
To the best of our knowledge, there has not been work on MPLCs. Thus, the related work presented here is not directly relevant to MPLCs, but related to the research on MPL software systems in general. The related work is presented in two aspects, including the phenomenon of MPL software systems and quality of MPL software systems.
2.1 Phenomenon of MPL Software Systems
Mayer and Bauer studied the phenomenon of multi-language programming using data mining technologies on 1,150 open source software (OSS) projects gathered from GitHub (Mayer and Bauer, 2015). They used the Poisson regression model to explore the relationship between the number of PLs of the project and the size, age, number of contributors, and number of commits. They found that each project uses an average of 5 PLs with a clearly dominant PL; the median number of general-purpose PLs and domain-specific PLs is 2 and 2, respectively. The results also confirmed that the use of multiple PLs is very common in OSS projects. The focus of our work is different in that we investigated MPL software systems from the perspective of commits, while the work of Mayer and Bauer paid more attention at the level of project; in addition, we went deeper and looked into the bug proneness and change complexity of source files modified in MPLCs as well.
2.2 Quality of MPL Software Systems
In 2011, Bhattacharya and Neamtiu investigated the impact of C and C++ on software maintainability and code quality of four large OSS projects (Bhattacharya and Neamtiu, 2011). They found that C++ code has higher internal quality than C code and C++ code is less prone to bugs than C code, but they could not confirm that C++ code needs less effort to maintain than C code. Their work looked into the impact of specific PLs on code quality, while our work investigated the impact of MPLCs on the bug proneness of source files in terms of defect density.
In 2014, Ray et al. studied the effect of PLs on software quality using a large dataset of 729 projects in 17 PLs gathered from GitHub (Ray et al., 2014). They combined multiple regression modeling with visualization and text analytics to study the impact of language characteristics. They found that language design indeed has a significant but modest effect on software defects. In addition, they found that there is a small but significant correlation between language set and software defects. Specifically, they found that there are 11 PLs that have a relationship with software defects. In 2019, Berger et al. (Berger et al., 2019) carried out repeated experiments of the study of Ray et al. (Ray et al., 2014) and reduced the number of defect-related languages down from 11 to only 4. These studies paid attention to the impact of language features on bug proneness of software systems. In contrast, our work is focused on the impact of MPLCs on the bug proneness of source files.
In 2016, Kochhar et al. conducted a large-scale empirical investigation of the use of multiple PLs and the combination of certain PLs on bug proneness (Kochhar et al., 2016). They analyzed a dataset comprised of 628 projects collected from GitHub, in 17 general-purpose PLs (e.g., Java and Python). They found that implementing a project with more PLs significantly increases bug proneness, especially on memory, concurrency, and algorithm bugs. The results also revealed that the use of specific PLs together is more bug-prone in an MPL setting. However, our work is focused on the development difficulty and software quality in a finer granularity of commits.
In 2019, Abidi et al. identified six anti-patterns (Abidi et al., 2019c) and twelve code smells (Abidi et al., 2019b) in MPL software systems. Six anti-patterns were identified in OSS systems, including excessive inter-language communication, too much scattering, language and paradigms mismatch, and so forth (Abidi et al., 2019c). Twelve code smells were proposed, including passing excessive objects, not handling exceptions across languages, assuming safe multi-language return values, memory management mismatch, and so on (Abidi et al., 2019b). Abidi et al. subsequently proposed an approach to detect aforementioned anti-patterns and code smells (both called design smells according to the authors) in MPL systems in which Java Native Interface (JNI) is used, and conducted an empirical study on the fault proneness of such MPL design smells in nine open source JNI projects (Abidi et al., 2021). They found that MPL design smells are prevalent in the selected projects and files with MPL design smells can often be more associated with bugs than files without these design smells, and that specific smells are more correlated to fault proneness than other smells. These design smells provide useful suggestions in practice to avoid design defects and implementation flaws in software development.
In 2019, Kargar et al. proposed an approach to modularization of MPL applications (Kargar et al., 2019). The results show that the proposed approach can build a modularization close to human experts, which may be helpful in understanding MPL software systems. In 2020, the same authors proposed a method to improve the modularization quality of heterogeneous MPL software systems by unifying structural and semantic concepts (Kargar et al., 2020). Admittedly, architecture quality (e.g., modularity) of MPL software systems is worth further and deeper research. This study provided an important viewpoint for the research on MPL software systems. Based on the results of our work, we will examine the architecture quality of MPL software systems with a relatively high proportion of MPLCs.
In 2020, Grichi et al. performed a case study on the impact of interlanguage dependencies in MPL systems (Grichi et al., 2021). They found that the risk of bug introduction gets higher when there are more interlanguage dependencies, while this risk remains constant for intralanguage dependencies; the percentage of bugs found in interlanguage dependencies is three times larger than the percentage of bugs identified in intralanguage dependencies. Grichi et al. also conducted a study on the impact of MPL development in machine learning frameworks (Grichi et al., 2020). They found that mono-language pull requests in machine learning frameworks are more bug-prone than traditional software systems. Their work investigated the influence of MPL code changes on software systems in a granularity of pull requests, while our work studied the bug proneness of MPL code changes on software systems in a finer granularity of commits. In addition, our work demonstrates a higher bug proneness of source files modified in MPLCs than source files modified in only non-MPLCs, which is a dramatic difference from the results obtained by the work of Grichi et al.
In 2021, Shen et al. carried out a preliminary investigation regarding cross-language coupling detection on Android applications. They found that the code changes in commits involving Jave/Kotlin and XML files are more scattered and more likely to introduce bugs than other commits. This finding is in line with our result. However, only the commits containing both Jave/Kotlin and XML were considered in their work, while MPLCs involving no less than two of eighteen general-purpose PLs are studied in our work.
3 Case Study Design
In order to investigate the state of MPLCs and their impacts on development difficulty and software quality, we performed a case study on Apache OSS projects. The main reason for conducting a case study is that, through using OSS projects, and more specifically their commit records and issues, we examine the phenomenon in its real-life context, since both the commit records and issues cannot be monitored in isolation, and their environment cannot be controlled. In this section we describe the case study, which was designed and reported following the guidelines proposed by Runeson and Höst (Runeson and Höst, 2009).
3.1 Objective and Research Questions
The goal of this study, described using the Goal-Question-Metric (GQM) approach (Basili, 1992), is: to analyze commits as well as their corresponding modified source files and fixed issues for the purpose of exploration with respect to the state of MPLCs as well as their impacts on development difficulty and software quality, from the point of view of software developers in the context of MPL OSS development.
Based on the abovementioned goal, we have formulated eight research questions (RQs), which are classified into three categories and described as follows.
Category I: State of MPLCs.
-
RQ1:
How do the programming languages distribute over the selected projects?
Rationale: With this RQ, we investigate what PLs are used and how balanced the PLs are used in the MPL projects. In addition, we can also find out the most commonly-used combination of PLs. -
RQ2:
What is the proportion of MPLCs over all commits of a project? Is the proportion of MPLCs correlated with the degree of the balanced use of PLs in all the projects?
Rationale: With this RQ, we investigate the frequency of MPLCs occurred in software projects and how the proportion of MPLCs evolves, so as to get a basic understanding on the state of MPLCs in MPL software projects. In addition, we study the relationship between the proportion of MPLCs and the distribution of PLs used in the selected projects, in order to get a further understanding on the potential influence of the use of PLs on the MPLCs of a project. -
RQ3:
How many programming languages are used in the modified source files of MPLCs?
Rationale: This RQ is focused on the number of PLs used in source files modified in MPLCs, which enables us to understand the tendency of the use of multiple PLs.
Category II: Impacts of MPLCs on development difficulty.
-
RQ4:
What is the code change complexity of MPLCs? Is there a difference on the code change complexity between MPLCs and non-MPLCs?
Rationale: To explore the development difficulty of MPLCs, we look into the code change complexity of MPLCs. Intuitively, the complexity of code changes in MPLCs may be different from that in non-MPLCs. With this RQ, we intend to calculate the complexity of code changes in MPLCs and further validate if the complexity of code changes in MPLCs is significantly higher than that in non-MPLCs. In addition, the complexity of code change in a commit can be measured by the number of lines of code, source files, and directories that are modified in the commit, and by the entropy (Hassan, 2009) of the modified files in the commit. These change complexity measures are adopted from (Li et al., 2020). -
RQ5:
Do the issues fixed in MPLCs tend to take longer to be resolved than issues fixed in non-MPLCs?
Rationale: With this RQ, we further investigate the time taken to resolve issues that were fixed in MPLCs and non-MPLCs. The time taken to resolve an issue can, to some extent, reflect the development difficulty of MPL software systems.
Category III: Impacts of MPLCs on software quality.
-
RQ6:
Are issues fixed in MPLCs more likely to be reopened than issues fixed in non-MPLCs?
Rationale: With this RQ, we investigate the likelihood of reopening issues fixed in MPLCs, which reflects the analyzability of the source code of files involved in MPLCs. -
RQ7:
Are source files that have been modified in MPLCs more bug-prone than source files that have never been modified in MPLCs?
Rationale: MPLCs may influence the quality of software systems. With this RQ, we are concerned with the impact of MPLCs on software systems in terms of the likelihood of bugs. -
RQ8:
Are MPLCs more likely to introduce bugs than non-MPLCs?
Rationale: With this RQ, we look into the impact of MPLCs on bug introduction at the granularity of commit. In contrast, with RQ7 we study the influence of MPLCs on bug proneness at the granularity of source file.
Among the eight RQs, RQ1, the second part of RQ2, RQ6, and RQ8 are new RQs addressed in this journal version, comparing with our previous conference paper (Li et al., 2021).
3.2 Cases and Unit Analysis
According to (Runeson and Höst, 2009), case studies can be characterized based on the way they define their cases and units of analysis. This study investigates multiple MPL OSS projects, i.e., cases, and each commit and the corresponding issue fixed is a single unit of analysis.
| # | PL | # | PL | # | PL |
| 1 | C/C++ | 7 | Haskell | 13 | PHP |
| 2 | C# | 8 | Java | 14 | Python |
| 3 | Clojure | 9 | JavaScript | 15 | Ruby |
| 4 | CoffeeScript | 10 | Kotlin | 16 | Scala |
| 5 | Erlang | 11 | Objective-C | 17 | Swift |
| 6 | Go | 12 | Perl | 18 | TypeScript |
3.3 Case Selection
In this study, we only investigated Apache MPL OSS projects. The reason why we used Apache projects is that the links between issues and corresponding commits tend to be well recorded in the commit messages of those projects. For selecting each case (i.e., MPL OSS project) included in our study, we applied the following inclusion criteria:
-
C1:
The issues of the project are tracked in JIRA. This criterion was set to ensure the same format of all issues of different projects so that we can handle the issues in the same way.
-
C2:
No less than 3 out of the 18 PLs listed in Table 1 are used in the project. All the 18 listed PLs are general-purpose languages. Sixteen out of the 18 PLs were adopted from (Kochhar et al., 2016), in which C and C++ are different PLs. However, we combined C and C++ into a single PL in this work since we cannot determine a header file with the extension of “.h” as a source file of C or C++ by only checking the commit records. Besides, we added two general-purpose PLs, i.e., Kotlin and Swift. This criterion was set to enlarge the population of MPLCs with different numbers of PLs and to reduce the dominance of MPLCs of two PLs, thereby increasing the generalizability of the study results.
-
C3:
The source code written by the main PL is no more than 75% of the code of the project. This criterion was set to ensure that the PL use is not extremely unbalanced so that the biases caused by specific PLs can be reduced.
-
C4:
The project has more than 20 contributors. This criterion was set to ensure that the selected projects are written by a relatively wide range of developers, thereby reducing biases caused by a small number of developers to the study results.
-
C5:
The project has more than 2,000 commits. This criterion was set to ensure that the selected project is non-trivial, and the resulting dataset is big enough to be statistically analyzed.
-
C6:
The number of issues of the project is no less than 1,000. This criterion was set to ensure that the selected projects had been in the maintenance and evolution stage for a reasonable length of period, and thus sufficient data on issue open time, issue reopen, bug proneness, and bug introduction can be collected.
-
C7:
The project has more than 100 MPLCs. This criterion was set to ensure that the resulting dataset is big enough to be statistically analyzed.
| # | Name | Description | RQ | |
| D1 | CmtID | The hashcode of the commit. | - | |
| D2 | CmtDT |
|
- | |
| D3 | Committer | The committer of the commit. | - | |
| D4 | IsMPLC | Whether the commit is an MPLC. | RQ1-RQ8 | |
| D5 | PLNo | The number of PLs used in the modified source files of the commit. | RQ3 | |
| D6 | LOCM | The number of lines of source code modified in the commit. | RQ4 | |
| D7 | NOFM |
|
RQ4 | |
| D8 | NODM |
|
RQ4 | |
| D9 | Entropy |
|
RQ4 | |
| D10 | IssueID |
|
RQ5, RQ7 | |
| D11 | IssueRT | The reporting time of the issue. | RQ5 | |
| D12 | IssueCT |
|
RQ5 | |
| D13 | IssueType | The type (e.g., bug) of the issue. | RQ7 | |
| D14 | IntroducedBugs | The bugs introduced by the commit. | RQ8 | |
| D15 | IsIssueReopened | Whether the issue was reopened. | RQ6 |
| # | Name | Description | RQ |
| D16 | Path | The path of the source file. | RQ7 |
| D17 | LOC | The number of lines of code in the source file. | RQ7 |
| D18 | NOB | The number of bugs that the source file experienced. | RQ7 |
| D19 | PLF | The PL used in the source file. | RQ1 |
3.4 Data Collection
3.4.1 Data Items to be Collected
To answer the RQs, we took a commit as the unit of analysis and the data items to be collected are listed in Table 2; and to answer RQ7, we also needed to collect the data items described in Table 3 of each source file, which can be extracted from the commits containing the source file. All the data items to be collected except for D9 and D14 are straightforward, thus we only explain these two data items in detail.
First, we explain the definition of the entropy of the modified source files in a commit (i.e., D9) (Hassan, 2009). Suppose that the modified source files of commit are , and file was modified in commits during a period of time before the commit. Let
| (1) |
Then, the entropy
| (2) |
Since the number of modified source files differs between different periods, we need to normalize the entropy to be comparable. Considering that achieves the maximum of when , the normalized entropy
| (3) |
In this study, the period is set to 60 days (including the day when commit happened), which is chosen according to (Li et al., 2020).
In the next, we explain what can be considered as introduced bugs by a commit (i.e., D14). In this study, we adopted the SZZ algorithm (Śliwerski et al., 2005) to identify the bug-introducing commits of each bug that is explicitly mentioned in a specific commit message, and then we can collect the bugs introduced by each commit. The SZZ algorithm is widely used in software engineering and research fields, such as defect prediction techniques and bug localization. PyDriller111https://github.com/ishepard/pydriller provides a set of APIs for the SZZ algorithm, which is based on AG-SZZ (a variant of SZZ) (Spadini et al., 2018). It can be easily used to identify bug-introducing commits by using the API get_commits_last_modified_lines. In this way, we can get a mapping table between commits and their introduced bugs. Thus, the introduced bugs of each commit can be obtained.
3.4.2 Data Collection Procedure
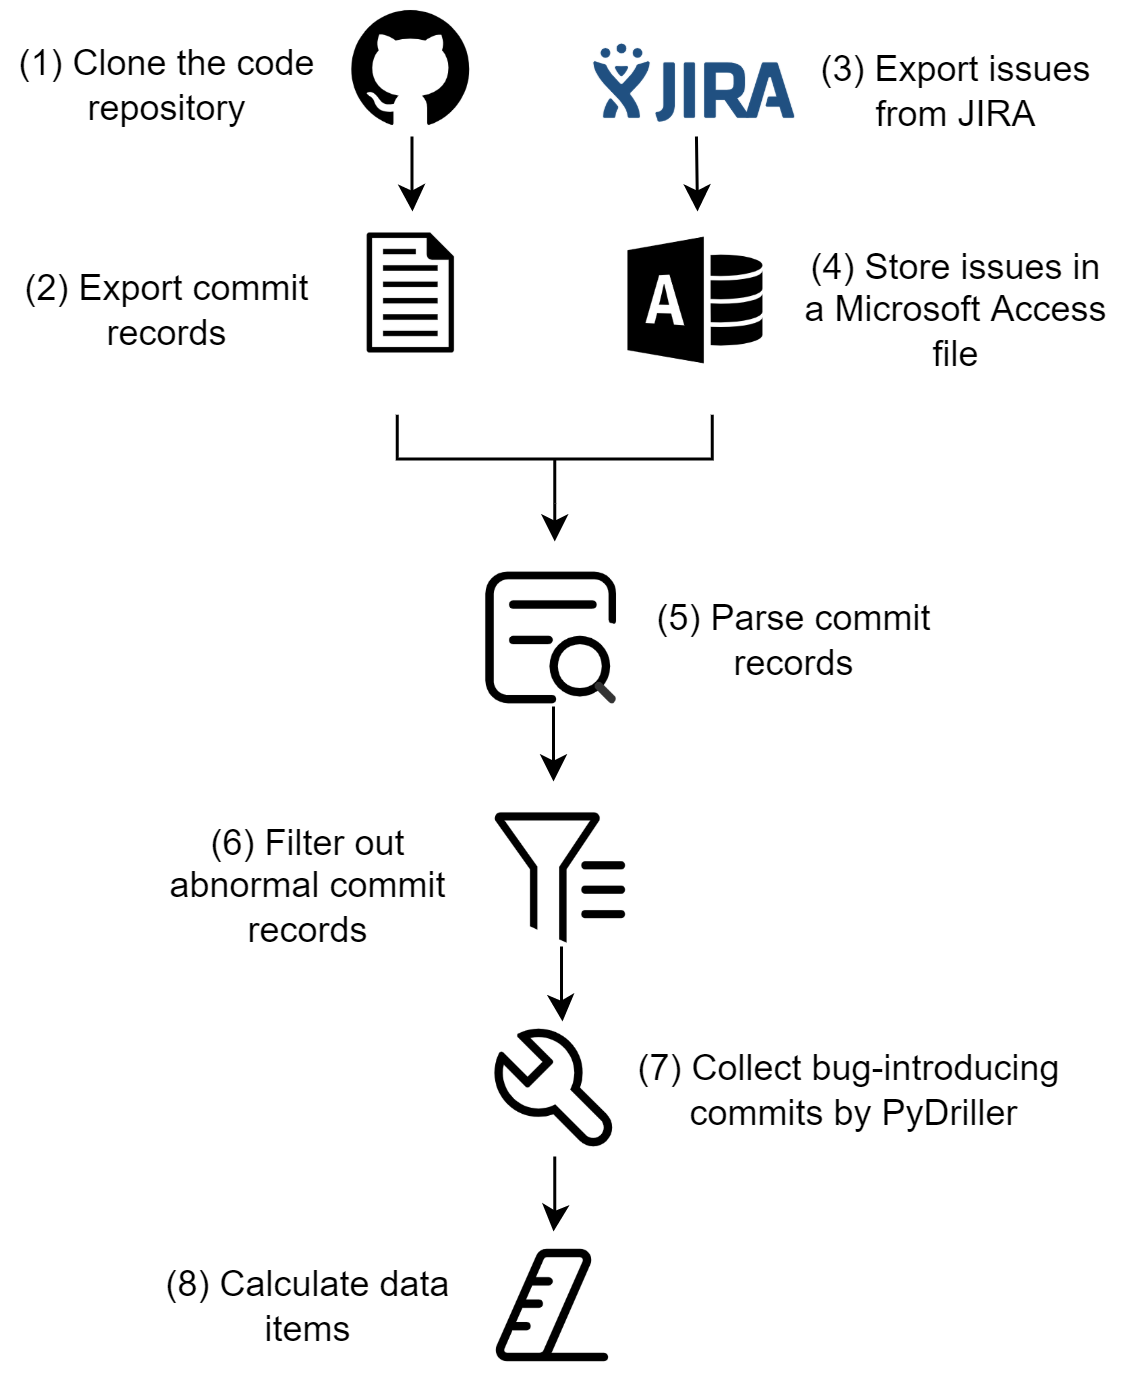
The data collection procedure for each selected project consists of seven steps (shown in Figure 1). The details of the steps are described as follows.
Step 1: Clone the repository of the project using TortoiseGit.
Step 2: Extract commit records from the repository to a text file for further parsing. In this step, we only exported the commit records of the master branch and the commit records merged to the master branch, but excluded the commit records corresponding to the MERGE operations of Git. A commit record corresponding to the MERGE operation in Git is duplicate with the merged commit records, in the sense that the file changes in the MERGE commit record are the same as the file changes in the merged commit records. In addition, the committer of the MERGE commit record is different from the committers of the merged commit records. Thus, the MERGE commit record should not be included to prevent double counting code changes.
Step 3: Export the issue reports. We manually exported all issues of the project from JIRA – deployed by the Apache Software Foundation.
Step 4: Store the exported issues in Step 3 to a Microsoft Access file, which is to facilitate data queries in the next steps.
Step 5: Parse commit records. If a commit is conducted to fix an issue, the committer would mention the issue ID explicitly in the commit message. The path and the number of lines of code changed of each modified source file can also be obtained in the commit record.
Step 6: Filter out abnormal commit records. Some commits contain changed source files with a large number of modified lines of code. For instance, if the involved source files are generated automatically, such files may be modified with tens of thousands of lines of code. Such commits should be filtered out. In this step, we filtered out commits in which more than 10,000 lines of code were modified.
Step 7: Collect bug-introducing commits by PyDriller. We use the PyDriller tool to identify bug-introducing commits based on the information of bug-fixing commits.
3.5 Data Analysis
To answer RQ1, besides the descriptive statistics, we also needed to calculate the entropy of PL use for each selected project. Suppose that the PLs used in a project are , and source files are written in PL . Let
| (4) |
Then, the entropy of PL use is
| (5) |
Since the number of source files differs between different projects, we need to normalize the entropy of PL use to be comparable. The normalized entropy of PL use is
| (6) |
To answer RQ2, in addition to descriptive statistics, we conducted a Spearman test to calculate the correlation coefficient between the entropy of PL use and the proportion of MPLCs for all the selected projects. The test is significant at p-value < 0.05, which means that the two tested variables have a significant correlation. The answer to RQ3 can be obtained by descriptive statistics.
To answer RQ4, RQ5, RQ7, and RQ8, in addition to descriptive statistics, we performed Mann-Whitney U tests (Field, 2013) to examine if two groups are significantly different from each other. Both the Mann-Whitney U test and t-test can be used to test if there is a significant difference between two groups of instances of a variable. The Mann-Whitney U test is a non-parametric test, i.e., it does not make the assumption of a normal distribution of each group. In contrast, the t-test is a parametric test, i.e., it requires that the groups follow normal distributions. Since the data of the variables to be tested do not necessarily follow a specific distribution, it is reasonable to use the Mann-Whitney U test – a non-parametric test – in this study. Besides, we measure the effect sizes for a Mann-Whitney U test by Pearson’s correlation coefficient r (Field, 2013). The test is significant at p-value < 0.05, which means that the tested groups have a significant difference.
To answer RQ6 and RQ8, we ran a Chi-squared test for each project (Field, 2013). Specifically, for RQ6, the two variables of a Chi-squared test are: whether a fixed issue was reopened or not and whether it is connected to an MPLC or not; for RQ8, the two variables of a Chi-squared test are: MPLC or not, and bug-introducing or not. The effect size of a Chi-squared test is measured by the odds ratio (OR) (Field, 2013). The test is significant at p-value < 0.05, which means that the two variables are connected.
Due to the multiple testing problem, we needed to perform the Benjamini-Hochberg procedure (Benjamini and Hochberg, 1995) to correct the p-values of the Mann-Whitney U tests and Chi-squared tests.
4 Study Results
We chose to examine around 500 Apache projects from JIRA, and all the projects meet project selection criterion C1. Then, we applied project selection criteria C2 - C6, and 30 projects were left. During this step, projects such as Tomcat (excluded by C2), Hadoop (excluded by C3), Lucy (excluded by C4), HAWQ (excluded by C5), and MADlib (excluded by C6) were excluded. Finally, we applied criterion C7, 18 non-trivial Apache MPL OSS projects were selected for data collection. During this step, projects such as Avro and Usergrid were excluded since they have less than 100 MPLCs.
We collected data items described in Table 2 and Table 3 from the 18 selected projects. The data of the selected projects were collected around the beginning of December of 2019. The study replication package is available online (Li et al., 2022), including the collected dataset and a README file explaining the data fields in the dataset and how to use it. Specifically, the dataset includes the commit records exported from repositories and issues exported from JIRA of the 18 selected projects. Table 4 shows the demographic information of the selected projects. The mean age of the projects is 9 years, the mean number of lines of code is 659K, the mean number of commits is 15,657, the mean number of contributors is 320, the mean number of issues is 8,645, and the mean number of bugs is 4,626. The number of PLs used in the projects ranges from 4 to 14, and the mean number of PLs used is 8. The percentage of code in the main PL (i.e., %Main PL) of the projects ranges from 33.7% to 74.7%, and the mean percentage is 60.7%. In addition, the projects belong to 10 domains, among which big data is the most popular domain. In the rest of this section, we will present the results for each RQ.
| Project | Age (yr) | #LOC | #Commit | #Ctbtr | #Issue | #Bug | #PL | Main PL | %Main PL | Domain |
| Airavata | 9 | 1,057K | 9,290 | 45 | 3,364 | 1,535 | 5 | Java | 74.7 | Distributed computing |
| Ambari | 9 | 1,093K | 24,588 | 134 | 25,261 | 17,881 | 11 | Java | 45.9 | Big data |
| Arrow | 5 | 635K | 7,575 | 476 | 10,058 | 3,410 | 9 | C/C++ | 45.0 | Big data |
| Beam | 5 | 1,053K | 29,021 | 676 | 11,019 | 4,608 | 8 | Java | 72.3 | Big data |
| CarbonData | 4 | 321K | 4,705 | 171 | 4,019 | 2,199 | 5 | Scala | 57.8 | Big data |
| CloudStack | 10 | 912K | 32,644 | 329 | 10,312 | 7,854 | 7 | Java | 59.5 | Cloud computing |
| CouchDB | 12 | 123K | 12,376 | 162 | 3,292 | 1,878 | 6 | Erlang | 68.0 | Database |
| Dispatch | 6 | 117K | 2,769 | 23 | 1,800 | 1,080 | 5 | Python | 42.3 | Message router |
| Ignite | 6 | 2,056K | 27,056 | 241 | 12,727 | 5,575 | 8 | Java | 74.6 | Database |
| Impala | 9 | 640K | 9,429 | 146 | 10,168 | 5,630 | 5 | C/C++ | 54.5 | Database |
| Kafka | 9 | 653K | 7,990 | 702 | 10,551 | 5,809 | 10 | Java | 73.2 | Event management |
| Kylin | 6 | 284K | 8,404 | 177 | 4,120 | 2,115 | 6 | Java | 71.3 | Big data |
| Ranger | 6 | 327K | 3,371 | 77 | 3,013 | 2,048 | 4 | Java | 68.9 | Data security |
| Reef | 8 | 283K | 3,873 | 68 | 2,063 | 498 | 6 | Java | 52.9 | Distributed computing |
| Spark | 10 | 973K | 28,142 | 1,634 | 28,983 | 12,402 | 6 | Scala | 73.6 | Big data |
| Subversion | 20 | 860K | 59,809 | 28 | 4,503 | 3,233 | 6 | C/C++ | 65.8 | Version control |
| Thrift | 14 | 258K | 6,101 | 340 | 5,283 | 2,923 | 14 | C/C++ | 33.7 | RPC framework |
| Zeppelin | 7 | 222K | 4,675 | 327 | 5,068 | 2,581 | 6 | Java | 59.3 | Web notebook |
| Mean | 9 | 659K | 15,657 | 320 | 8,645 | 4,626 | 8 | - | 60.7 | - |
4.1 Distribution of PLs Used in the Selected Projects (RQ1)
The distribution of PLs used in the selected projects is shown in Table 5, where X denotes that the PL in the corresponding column is the main PL of the project in the corresponding row, #Project denotes the number of projects using the PL in the corresponding column, #ProjectX denotes the number of projects using the PL in the corresponding column as the main PL, and #PL denotes the number of PLs used by the project in the corresponding row. As we can see from this table, Java and Python are used in all the 18 projects; C/C++, JavaScript, and Ruby are also used in most projects; and Java is the main PL of 10 projects, followed by C/C++ which is the main PL of 4 projects. Besides, all projects are written in 4 or more PLs, with a maximum of 14 PLs for project Thrift, followed by project Ambari in 11 PLs. Furthermore, most (13 out 18, 72.2%) of the projects use 5-8 PLs, and the most common PL combination consists of all the four PLs, i.e., C/C++, Java, JavaScript, and Python.
As shown in Table 5, we also calculated the entropy of PL use (i.e., EntropyPL in the last column of the table) for the selected MPL projects. Among all the selected MPL projects, Thrift gets the largest EntropyPL of 0.793, with the most balanced use of PLs; and Kylin has the smallest EntropyPL of 0.119, with the most unbalanced use of PLs.
| Project |
C/C++ |
C# |
Clojure |
CoffeeScript |
Erlang |
Go |
Haskell |
Java |
JavaScript |
Kotlin |
Objective-C |
Perl |
PHP |
Python |
Ruby |
Scala |
Swift |
TypeScript |
#PL |
EntropyPL |
| Airavata | x | X | x | x | x | 5 | 0.237 | |||||||||||||
| Ambari | x | x | x | X | x | x | x | x | x | x | x | 11 | 0.525 | |||||||
| Arrow | X | x | x | x | x | x | x | x | x | 9 | 0.648 | |||||||||
| Beam | x | x | X | x | x | x | x | x | 8 | 0.295 | ||||||||||
| CarbonData | x | x | x | x | X | 5 | 0.444 | |||||||||||||
| CloudStack | x | x | X | x | x | x | x | 7 | 0.209 | |||||||||||
| CouchDB | x | X | x | x | x | x | 6 | 0.501 | ||||||||||||
| Dispatch | x | x | x | X | x | 5 | 0.683 | |||||||||||||
| Ignite | x | x | X | x | x | x | x | x | 8 | 0.288 | ||||||||||
| Impala | X | x | x | x | x | 5 | 0.633 | |||||||||||||
| Kafka | x | x | x | x | X | x | x | x | x | x | 10 | 0.384 | ||||||||
| Kylin | x | x | X | x | x | x | 6 | 0.119 | ||||||||||||
| Ranger | x | X | x | x | 4 | 0.321 | ||||||||||||||
| Reef | x | x | X | x | x | x | 6 | 0.394 | ||||||||||||
| Spark | x | x | x | x | x | X | 6 | 0.396 | ||||||||||||
| Subversion | X | x | x | x | x | x | 6 | 0.544 | ||||||||||||
| Thrift | X | x | x | x | x | x | x | x | x | x | x | x | x | x | 14 | 0.793 | ||||
| Zeppelin | x | X | x | x | x | x | 6 | 0.548 | ||||||||||||
| #Project | 17 | 9 | 1 | 3 | 2 | 4 | 1 | 18 | 15 | 1 | 2 | 4 | 5 | 18 | 10 | 8 | 1 | 8 | - | - |
| #ProjectX | 4 | 0 | 0 | 0 | 1 | 0 | 0 | 10 | 0 | 0 | 0 | 0 | 0 | 1 | 0 | 2 | 0 | 0 | - | - |
4.2 Proportion of MPLCs in the Selected Projects (RQ2)
As shown in Table 6, the total number of commits of all projects is 197,566, the total number of MPLCs is 18,372, and thus the percentage of MPLCs is 9.3% when taking all projects as a whole. Please note that the number of commits for each project in Table 6 is different from the number in Table 4. This is because we only considered the commits of and the commits merged into the master branch of the project repository. As presented in Table 6, the proportion of MPLCs over all commits of each selected OSS project ranges from 1.7% to 41.0%.
| Project | #Commit | #MPLC | %MPLC |
| Airavata | 5,562 | 269 | 4.8 |
| Ambari | 19,667 | 1,491 | 7.6 |
| Arrow | 4,947 | 1,073 | 21.7 |
| Beam | 14,875 | 251 | 1.7 |
| CarbonData | 3,330 | 1,366 | 41.0 |
| CloudStack | 23,285 | 1,786 | 7.7 |
| CouchDB | 7,114 | 560 | 7.9 |
| Dispatch | 2,107 | 381 | 18.1 |
| Ignite | 17,565 | 888 | 5.1 |
| Impala | 7,485 | 1,975 | 26.4 |
| Kafka | 6,915 | 1,029 | 14.9 |
| Kylin | 5,587 | 126 | 2.3 |
| Ranger | 2,445 | 203 | 8.3 |
| Reef | 2,520 | 163 | 6.5 |
| Spark | 21,782 | 2,772 | 12.7 |
| Subversion | 44,993 | 3,113 | 6.9 |
| Thrift | 4,409 | 512 | 11.6 |
| Zeppelin | 2,978 | 414 | 13.9 |
| Total | 197,566 | 18,372 | 9.3 |
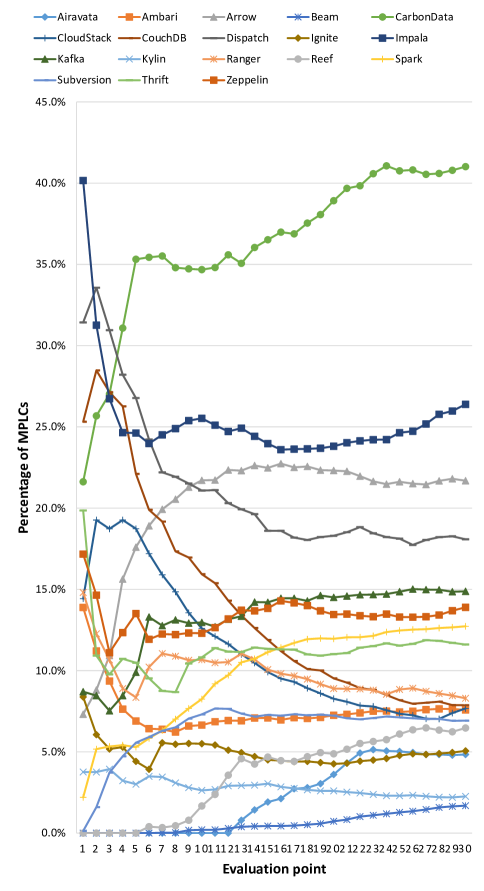
We further investigated the trend of the proportion of MPLCs in each selected project over time. To clearly display the trends of all the 18 projects in one diagram, we selected 30 evaluation points for each project to calculate the proportion of MPLCs. At the th evaluation point, we calculated the proportion of MPLCs based on the first thirtieth of all commits of the project. As shown in Figure 2, after relatively strong fluctuations in the early development stage of the projects, the proportion of MPLCs of most (15 out of 18, 83%) of the projects tends to be stable in the late development stage, while the proportion of MPLCs shows a long-term upward trend for CarbonData and a long-term downward trend for CloudStack and CouchDB.
In addition, we conducted the Spearman test on the entropy of PL use (i.e., EntropyPL) and the proportion of MPLCs for all the selected projects. The resulting correlation coefficient is 0.653 and the p-value is 0.003 (< 0.05), which suggests a significantly positive correlation. In other words, projects with higher proportions of MPLCs tend to be more balanced in terms of the use of PLs.
4.3 Number of PLs Used in the Source Files Modified in MPLCs (RQ3)
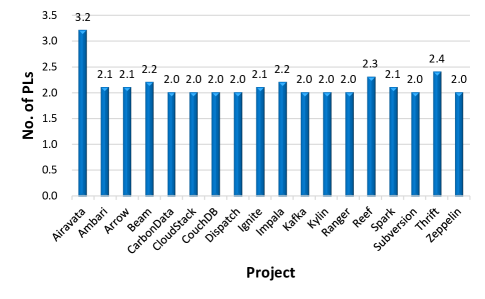
Figure 3 shows the average number of PLs used in the source files modified in MPLCs. Among the projects, on average, project Airavata has 3.2 PLs used in the source files that are modified in each MPLC, and this project is the only project with no less than 3.0 PLs used in the source files modified in each MPLC. Most (15 out of 18, 83%) of the projects have around 2.0 (i.e., 2.0-2.2) PLs for each MPLC on average.
We further explored how the number of PLs used distributes over MPLCs, and the results are shown in Table 7. In this table, #Ci denotes the number of commits in which the modified source files are written in i PLs, %Ci denotes the percentage of #Ci over #MPLC, and #C5+ denotes the number of commits in which the modified source files are written in 5 or more PLs. As shown in Table 7, taking all the projects as a whole, 91.7%, 7.1%, and 1.0% of the MPLCs involve source files written in 2, 3, and 4 PLs, respectively; and only 0.2% of the MPLCs involve source files written in 5 or more PLs. This means that most MPLCs involve source files written in only 2 PLs, and it is not common for MPLCs to modify source files in more than 4 PLs.
Table 7 also shows that most (14 out of 18, 78%) of the projects do not have MPLCs with 5 or more PLs, and one third (6 out of 18) of the projects do not have MPLCs with more than 3 PLs.
| Project | #MPLC | #C2 | %C2 | #C3 | %C3 | #C4 | %C4 | #C5+ | %C5+ |
| Airavata | 269 | 59 | 21.9 | 86 | 32.0 | 124 | 46.1 | 0 | 0.0 |
| Ambari | 1,491 | 1,383 | 92.8 | 105 | 7.0 | 2 | 0.1 | 1 | 0.1 |
| Arrow | 1,073 | 1,013 | 94.4 | 59 | 5.5 | 1 | 0.1 | 0 | 0.0 |
| Beam | 251 | 212 | 84.5 | 39 | 15.5 | 0 | 0.0 | 0 | 0.0 |
| CarbonData | 1,366 | 1,365 | 99.9 | 1 | 0.1 | 0 | 0.0 | 0 | 0.0 |
| CloudStack | 1,786 | 1,706 | 95.5 | 79 | 4.4 | 1 | 0.1 | 0 | 0.0 |
| CouchDB | 560 | 547 | 97.7 | 10 | 1.8 | 3 | 0.5 | 0 | 0.0 |
| Dispatch | 381 | 378 | 99.2 | 3 | 0.8 | 0 | 0.0 | 0 | 0.0 |
| Ignite | 888 | 788 | 88.7 | 94 | 10.6 | 5 | 0.6 | 1 | 0.1 |
| Impala | 1,975 | 1,606 | 81.3 | 368 | 18.6 | 1 | 0.1 | 0 | 0.0 |
| Kafka | 1,029 | 992 | 96.4 | 37 | 3.6 | 0 | 0.0 | 0 | 0.0 |
| Kylin | 126 | 125 | 99.2 | 1 | 0.8 | 0 | 0.0 | 0 | 0.0 |
| Ranger | 203 | 199 | 98.0 | 4 | 2.0 | 0 | 0.0 | 0 | 0.0 |
| Reef | 163 | 115 | 70.6 | 47 | 28.8 | 1 | 0.6 | 0 | 0.0 |
| Spark | 2,772 | 2,491 | 89.9 | 277 | 10.0 | 4 | 0.1 | 0 | 0.0 |
| Subversion | 3,113 | 3,039 | 97.6 | 53 | 1.7 | 17 | 0.5 | 4 | 0.1 |
| Thrift | 512 | 436 | 85.2 | 31 | 6.1 | 14 | 2.7 | 31 | 6.1 |
| Zeppelin | 414 | 396 | 95.7 | 16 | 3.9 | 2 | 0.5 | 0 | 0.0 |
| Total | 18,372 | 16,850 | 91.7 | 1,310 | 7.1 | 175 | 1.0 | 37 | 0.2 |
4.4 Change Complexity of MPLCs (RQ4)
Change complexity can be measured by the number of lines of code modified (LOCM), number of source files modified (NOFM), number of directories modified (NODM), and entropy of source files modified (Entropy) (Li et al., 2020). In Table 8, AveM and AveN denote the average value of the corresponding change complexity measure of MPLCs and non-MPLCs, respectively; %Diff denotes the percentage of the difference between AveM and AveN, i.e.,
| (7) |
As shown in Table 8, for all the projects, on average, these four change complexity measures of MPLCs are much larger than those of non-MPLCs, respectively. Specifically, on average, the LOCM, NOFM, and NODM of MPLCs are larger than those of non-MPLCs by more than 100.0% for most (15+ out of 18, 83%+) of the projects, and the Entropy of MPLCs is larger than that of non-MPLCs by 42.2% (i.e., project Arrow) at least. We further ran Mann-Whitney U tests on the four measures of MPLCs and non-MPLCs for each project, and the corrected p-value by the Benjamini–Hochberg procedure for each measure of each project is <0.001 as shown in Table 8. This indicates that all the four measures of MPLCs of each project are significantly larger than the measures for non-MPLCs, respectively. The effect size, i.e., ES(r), for each Mann-Whitney U test is also shown in Table 8. For each project, the effect size of NODM is larger than that of NOFM, and the latter is larger than the effect size of LOCM. For entropy, the effect sizes of 12 (66.7%) projects are the smallest among the four change complexity measures, the effect sizes of 5 (27.8%) projects are the second smallest among the four change complexity measures, and only one project’s effect size is the largest (slightly larger than the effect size of NODM for project CloudStack) among the four change complexity measures. In this sense, among the four change complexity measures, NODM has the strongest difference between MPLCs and non-MPLCs for the projects. In summary, the change complexity of MPLCs is significantly higher than that of non-MPLCs for each selected project.
| Project | LOCM | NOFM | NODM | Entropy | ||||||||||||||||
| AveM | AveN | %Diff | p-value | ES(r) | AveM | AveN | %Diff | p-value | ES(r) | AveM | AveN | %Diff | p-value | ES(r) | AveM | AveN | %Diff | p-value | ES(r) | |
| Airavata | 1,645 | 313 | 425.6 | <0.001 | -0.266 | 31 | 5 | 520.0 | <0.001 | -0.296 | 12 | 3 | 300.0 | <0.001 | -0.320 | 0.93 | 0.50 | 86.0 | <0.001 | -0.199 |
| Ambari | 541 | 187 | 189.3 | <0.001 | -0.234 | 13 | 5 | 160.0 | <0.001 | -0.295 | 7 | 3 | 133.3 | <0.001 | -0.309 | 0.88 | 0.58 | 51.7 | <0.001 | -0.138 |
| Arrow | 517 | 262 | 97.3 | <0.001 | -0.253 | 10 | 6 | 66.7 | <0.001 | -0.344 | 4 | 2 | 100.0 | <0.001 | -0.453 | 0.91 | 0.64 | 42.2 | <0.001 | -0.152 |
| Beam | 578 | 226 | 155.8 | <0.001 | -0.078 | 20 | 6 | 233.3 | <0.001 | -0.128 | 8 | 3 | 166.7 | <0.001 | -0.156 | 0.90 | 0.57 | 57.9 | <0.001 | -0.060 |
| CarbonData | 636 | 264 | 140.9 | <0.001 | -0.394 | 15 | 5 | 200.0 | <0.001 | -0.536 | 10 | 3 | 233.3 | <0.001 | -0.588 | 0.89 | 0.59 | 50.8 | <0.001 | -0.217 |
| CloudStack | 411 | 156 | 163.5 | <0.001 | -0.207 | 7 | 4 | 75.0 | <0.001 | -0.273 | 5 | 2 | 150.0 | <0.001 | -0.314 | 0.87 | 0.34 | 155.9 | <0.001 | -0.323 |
| CouchDB | 266 | 95 | 180.0 | <0.001 | -0.238 | 5 | 2 | 150.0 | <0.001 | -0.402 | 2 | 1 | 100.0 | <0.001 | -0.608 | 0.87 | 0.27 | 222.2 | <0.001 | -0.357 |
| Dispatch | 456 | 145 | 214.5 | <0.001 | -0.396 | 9 | 3 | 200.0 | <0.001 | -0.510 | 4 | 2 | 100.0 | <0.001 | -0.625 | 0.90 | 0.42 | 114.3 | <0.001 | -0.328 |
| Ignite | 1,019 | 292 | 249.0 | <0.001 | -0.199 | 40 | 7 | 471.4 | <0.001 | -0.259 | 16 | 4 | 300.0 | <0.001 | -0.278 | 0.90 | 0.53 | 69.8 | <0.001 | -0.182 |
| Impala | 455 | 156 | 191.7 | <0.001 | -0.423 | 12 | 4 | 200.0 | <0.001 | -0.509 | 5 | 2 | 150.0 | <0.001 | -0.616 | 0.90 | 0.53 | 69.8 | <0.001 | -0.270 |
| Kafka | 709 | 202 | 251.0 | <0.001 | -0.351 | 18 | 5 | 260.0 | <0.001 | -0.431 | 9 | 3 | 200.0 | <0.001 | -0.484 | 0.91 | 0.57 | 59.6 | <0.001 | -0.172 |
| Kylin | 274 | 193 | 42.0 | <0.001 | -0.084 | 7 | 5 | 40.0 | <0.001 | -0.142 | 5 | 3 | 66.7 | <0.001 | -0.159 | 0.86 | 0.51 | 68.6 | <0.001 | -0.094 |
| Ranger | 563 | 262 | 114.9 | <0.001 | -0.188 | 11 | 5 | 120.0 | <0.001 | -0.289 | 7 | 3 | 133.3 | <0.001 | -0.336 | 0.92 | 0.51 | 80.4 | <0.001 | -0.189 |
| Reef | 530 | 254 | 108.7 | <0.001 | -0.188 | 23 | 8 | 187.5 | <0.001 | -0.256 | 9 | 4 | 125.0 | <0.001 | -0.275 | 0.92 | 0.61 | 50.8 | <0.001 | -0.104 |
| Spark | 404 | 126 | 220.6 | <0.001 | -0.289 | 11 | 4 | 175.0 | <0.001 | -0.364 | 6 | 3 | 100.0 | <0.001 | -0.388 | 0.88 | 0.54 | 63.0 | <0.001 | -0.224 |
| Subversion | 235 | 75 | 213.3 | <0.001 | -0.229 | 7 | 2 | 250.0 | <0.001 | -0.370 | 3 | 1 | 200.0 | <0.001 | -0.481 | 0.86 | 0.25 | 244.0 | <0.001 | -0.362 |
| Thrift | 451 | 128 | 252.3 | <0.001 | -0.290 | 8 | 3 | 166.7 | <0.001 | -0.423 | 4 | 1 | 300.0 | <0.001 | -0.541 | 0.90 | 0.38 | 136.8 | <0.001 | -0.299 |
| Zeppelin | 541 | 167 | 224.0 | <0.001 | -0.308 | 10 | 4 | 150.0 | <0.001 | -0.410 | 6 | 2 | 200.0 | <0.001 | -0.446 | 0.90 | 0.46 | 95.7 | <0.001 | -0.280 |
4.5 Open time of issues fixed in MPLCs (RQ5)
We studied the open time (i.e., the time from when an issue report is created to when the issue is resolved) of issues fixed in MPLCs, and the results are shown in Table 9, in which AveOTM and AveOTN denote the average open time of issues fixed in MPLCs and non-MPLCs respectively, %Diff denotes the difference between AveOTM and AveOTN, i.e.,
| (8) |
and p-value denotes the corrected p-value by the Benjamini-Hochberg procedure of the Mann-Whitney U test on the open time of issues fixed in MPLCs and non-MPLCs of a project.
As shown in Table 9, 16 out of 18 (89%) projects have significantly (p-value <0.05 with small effect sizes) longer open time of issues fixed in MPLCs than that of issues fixed in non-MPLCs; and the other 2 projects (i.e., CouchDB and Subversion, which corresponding cells of column p-value are filled in grey) do not show a significant difference between the open time of issues fixed in MPLCs and that of issues fixed in non-MPLCs. The average open time of issues fixed in MPLCs is 8.0% to 124.7% longer than that of issues fixed in non-MPLCs for the 16 projects. It indicates that issues fixed in MPLCs are likely to take longer to be resolved than issues fixed in non-MPLCs.
| Project |
|
|
%Diff | p-value | ES(r) | ||||
| Airavata | 95.22 | 58.95 | 61.5 | 0.006 | -0.104 | ||||
| Ambari | 13.52 | 8.13 | 66.3 | <0.001 | -0.139 | ||||
| Arrow | 55.83 | 38.94 | 43.4 | <0.001 | -0.113 | ||||
| Beam | 96.08 | 87.59 | 9.7 | 0.008 | -0.053 | ||||
| CarbonData | 24.07 | 22.28 | 8.0 | <0.001 | -0.120 | ||||
| CloudStack | 113.71 | 50.60 | 124.7 | <0.001 | -0.155 | ||||
| CouchDB | 165.91 | 154.39 | 7.5 | 0.792 | -0.014 | ||||
| Dispatch | 55.82 | 34.30 | 62.7 | <0.001 | -0.168 | ||||
| Ignite | 71.11 | 56.03 | 26.9 | <0.001 | -0.053 | ||||
| Impala | 160.51 | 78.66 | 104.1 | <0.001 | -0.241 | ||||
| Kafka | 98.26 | 67.84 | 44.8 | <0.001 | -0.151 | ||||
| Kylin | 123.40 | 61.64 | 100.2 | 0.007 | -0.065 | ||||
| Ranger | 37.05 | 21.44 | 72.8 | <0.001 | -0.137 | ||||
| Reef | 41.99 | 29.24 | 43.6 | <0.001 | -0.115 | ||||
| Spark | 59.55 | 40.73 | 46.2 | <0.001 | -0.111 | ||||
| Subversion | 711.54 | 704.09 | 1.1 | 0.411 | -0.022 | ||||
| Thrift | 159.95 | 119.91 | 33.4 | <0.001 | -0.073 | ||||
| Zeppelin | 48.30 | 35.64 | 35.5 | <0.001 | -0.114 |
4.6 Impact of MPLCs on issue reopen (RQ6)
The proportions of reopened issues that were fixed in MPLCs and non-MPLCs are shown in Table 10, in which #RIMPLC and #RINonMPLC denote the number of reopened issues that were fixed in MPLCs and non-MPLCs respectively, #IMPLC and #INonMPLC denote the number of issues that were fixed in MPLCs and non-MPLCs respectively, %RIMPLC and %RINonMPLC denote the percentage of #RIMPLC over #IMPLC and the percentage of #RINonMPLC over #INonMPLC respectively, p-value denotes the corrected p-value of the Chi-squared test and ES(OR) denotes the effect size of the test measured by the odds ratio. As we can see from this table, the number of reopened issues that were fixed in MPLCs in each project is relatively small, from 0 to 98; and the proportion of the number of reopened issues fixed in MPLCs is larger than the proportion of that fixed in non-MPLCs in 8 out of 18 (44%) projects. In addition, we conducted the Chi-squared test to investigate whether there is a connection between MPLCs and issue reopen in the selected projects. The p-values for 89% (16 out of 18) of the projects are greater than 0.05, which means there are no significant connections between MPLCs and issue reopen in these projects. For the other two projects, the test results show a significant connection between MPLCs and issue reopen (i.e., p-value <0.05), and the effect sizes are medium. In summary, there are no significant differences between MPLCs and non-MPLCs regarding the impact on issue reopen for 89% of the projects.
| Project | #RIMPLC | #IMPLC | %RIMPLC | #RINonMPLC | #INonMPLC | %RINonMPLC | p-value | ES(OR) |
| Airavata | 6 | 61 | 9.8 | 47 | 662 | 7.1 | 0.600 | 1.427 |
| Ambari | 98 | 1,325 | 7.4 | 814 | 15,688 | 5.2 | 0.604 | 1.080 |
| Arrow | 10 | 1,027 | 1.0 | 44 | 3,318 | 1.3 | 0.072 | 0.291 |
| Beam | 2 | 116 | 1.7 | 87 | 2,649 | 3.3 | 0.527 | 0.516 |
| CarbonData | 10 | 814 | 1.2 | 14 | 874 | 1.6 | 0.435 | 0.533 |
| CloudStack | 11 | 245 | 4.5 | 350 | 3,637 | 9.6 | 0.018 | 0.358 |
| CouchDB | 12 | 118 | 10.2 | 20 | 240 | 8.3 | 0.643 | 0.800 |
| Dispatch | 10 | 252 | 4.0 | 32 | 794 | 4.0 | 0.640 | 0.779 |
| Ignite | 33 | 470 | 7.0 | 218 | 4,135 | 5.3 | 0.561 | 0.798 |
| Impala | 59 | 1,298 | 4.5 | 140 | 2,768 | 5.1 | 0.061 | 0.658 |
| Kafka | 30 | 740 | 4.1 | 122 | 3,155 | 3.9 | 0.063 | 0.514 |
| Kylin | 2 | 72 | 2.8 | 128 | 1,717 | 7.5 | 0.402 | 0.354 |
| Ranger | 10 | 157 | 6.4 | 66 | 1,449 | 4.6 | 0.556 | 1.425 |
| Reef | 4 | 97 | 4.1 | 29 | 928 | 3.1 | 0.986 | 0.989 |
| Spark | 94 | 2,070 | 4.5 | 456 | 11,110 | 4.1 | <0.001 | 0.507 |
| Subversion | 0 | 594 | 0.0 | 1 | 1,011 | 0.1 | 0.570 | 0.000 |
| Thrift | 45 | 354 | 12.7 | 278 | 2,087 | 13.3 | 0.520 | 0.805 |
| Zeppelin | 2 | 271 | 0.7 | 15 | 1,414 | 1.1 | 0.564 | 0.345 |
4.7 Bug proneness of source files modified in MPLCs (RQ7)
Bug proneness of a source file can be measured by defect density (DD) of the file, i.e., NOB/LOC of the file (Li et al., 2017). We calculated the defect density of the source files modified in MPLCs and that of the source files modified only in non-MPLCs. The results are shown in Table 11, in which #FileAll denotes the number of all source files of a project, LOC denotes the number of lines of code in a source file, Ave. LOC denotes the average LOC of all source files of a project, #FileM denotes the number of source files modified in MPLCs, #FileN denotes the number of source files modified only in non-MPLCs, DDM denotes the defect density of a source file modified in MPLCs, DDN denotes the defect density of a source file modified only in non-MPLCs, and %Diff denotes the percentage of the difference between Ave. DDM and Ave. DDN, i.e.,
| (9) |
We ran the Mann-Whitney U test to compare the DDM and DDN of source files in each project and performed the Benjamini-Hochberg procedure for the results, and the corrected p-value is shown in Table 11. As we can see from the table, DDM is significantly larger than DDN with p-value < 0.05 in 15 out of 18 (83%) projects, the effect sizes are between -0.514 and -0.084 (most are small or medium), and the difference between DDM and DDN ranges from 17.2% to 3,681.8%; DDM is significantly smaller than DDN with p-value < 0.05 in one project (Ignite, marked with * according to the corresponding p-value in Table 11); and there is no significant difference between DDM and DDN in the other 2 projects (Airavata and CloudStack, with p-value > 0.05, and the corresponding cells of column p-value are filled in grey in Table 11). In other words, the defect density of source files that have been modified in MPLCs is likely larger than the defect density of source files that have never been modified in MPLCs.
| Project | #FileAll | Ave. LOC | #FileM | #FileN | Ave. DDM | Ave. DDN | %Diff | p-value | ES(r) |
| Airavata | 993 | 1,065 | 450 | 543 | 0.00174 | 0.00325 | -46.5 | 0.381 | -0.028 |
| Ambari | 5,645 | 194 | 2,272 | 3,373 | 0.03636 | 0.01848 | 96.8 | <0.001 | -0.297 |
| Arrow | 2,851 | 223 | 1,757 | 1,094 | 0.01041 | 0.00604 | 72.4 | <0.001 | -0.132 |
| Beam | 5,812 | 181 | 2,344 | 3,468 | 0.01034 | 0.00325 | 218.2 | <0.001 | -0.514 |
| CarbonData | 1,484 | 216 | 1,244 | 240 | 0.00770 | 0.00290 | 165.5 | <0.001 | -0.234 |
| CloudStack | 2,395 | 381 | 1,346 | 1,049 | 0.00256 | 0.00247 | 3.6 | 0.075 | -0.037 |
| CouchDB | 557 | 221 | 173 | 384 | 0.00038 | 0.00009 | 322.2 | 0.008 | -0.114 |
| Dispatch | 332 | 351 | 261 | 71 | 0.02112 | 0.00517 | 308.5 | <0.001 | -0.410 |
| Ignite | 12,270 | 168 | 4,924 | 7,346 | 0.01085 | 0.01212 | -10.5 | <0.001* | -0.084 |
| Impala | 2,364 | 271 | 1,784 | 580 | 0.01549 | <0.00186 | 218.7 | <0.001 | -0.410 |
| Kafka | 3,341 | 195 | 2,365 | 976 | 0.01395 | 0.01190 | 17.2 | <0.001 | -0.084 |
| Kylin | 1,831 | 155 | 328 | 1,503 | 0.01165 | 0.00784 | 48.6 | <0.001 | -0.125 |
| Ranger | 1,480 | 221 | 579 | 901 | 0.01861 | 0.01394 | 33.5 | <0.001 | -0.205 |
| Reef | 3,590 | 79 | 499 | 3,091 | 0.01271 | <0.00121 | 201.9 | <0.001 | -0.236 |
| Spark | 4,854 | 201 | 3,759 | 1,095 | 0.01499 | 0.00711 | 110.8 | <0.001 | -0.213 |
| Subversion | 1,571 | 548 | 1,296 | 275 | <0.00116 | 0.00011 | 3,681.8 | <0.001 | -0.270 |
| Thrift | 1,322 | 195 | 839 | 483 | 0.01307 | 0.00742 | 76.1 | <0.001 | -0.223 |
| Zeppelin | 1,197 | 185 | 716 | 481 | 0.00945 | <0.00145 | 112.4 | <0.001 | -0.258 |
4.8 Bug introduction of MPLCs (RQ8)
We studied the impact of MPLCs on software quality in terms of bug introduction, and the results are presented as follows. We first investigated the difference between the proportion of bug-introducing MPLCs over all MPLCs and the proportion of bug-introducing non-MPLCs over all non-MPLCs. The results are shown in Table 12, where #BIMPLC and #BINonMPLC denote the number of bug-introducing MPLCs and the number of bug-introducing non-MPLCs respectively. As we can see from this table, the percentage of bug-introducing MPLCs (i.e., %BIMPLC) for each project ranges from 23.6% to 85.8% and the average is 54.2%; in contrast, the percentage of bug-introducing non-MPLCs (i.e., %BINonMPLC) for each project falls into [3.4%, 64.8%] and the average is 32.1%. In particular, the percentage of bug-introducing MPLCs is larger than the percentage of bug-introducing non-MPLCs in each project.
We ran the Chi-squared test for each project to investigate if there is a connection between MPLCs and bugs, and the results are shown in Table 12. There are significant connections between MPLCs and bugs for 89% (i.e., 16 out of 18) of the projects, and the corresponding effect sizes are medium (>1.500) or strong (>3.000). This means that MPLCs are significantly associated with bugs in 89% of the projects. In other words, MPLCs are more likely to introduce bugs than non-MPLCs in the selected projects.
We further looked into the number of bugs introduced by MPLCs. The results are shown in Table 13, where AveNumIBMPLC and AveNumIBNonMPLC denote the average number of introduced bugs over all bug-introducing MPLCs and all bug-introducing non-MPLCs respectively, and p-value is the result of the Mann-Whitney U test for comparing AveNumIBMPLC and AveNumIBNonMPLC after the Benjamini-Hochberg procedure. As can be seen from this table, in 17 out of the 18 (94%) projects, AveNumIBMPLC is significantly larger than AveNumIBNonMPLC with small effect sizes, and in the rest project Airavata, there is no significant difference between AveNumIBMPLC and AveNumIBNonMPLC. In summary, in 94% of the projects, the average number of introduced bugs of all bug-introducing MPLCs is significantly larger than that of all bug-introducing non-MPLCs.
| Project | #BIMPLC | #MPLC | %BIMPLC | #BINonMPLC | #NonMPLC | %BINonMPLC | p-value | ES(OR) |
| Airavata | 69 | 269 | 25.7 | 1,185 | 5,293 | 22.4 | 0.212 | 1.196 |
| Ambari | 1,279 | 1,491 | 85.8 | 11,782 | 18,176 | 64.8 | <0.001 | 3.274 |
| Arrow | 596 | 1,073 | 55.5 | 1,501 | 3,874 | 38.7 | <0.001 | 1.975 |
| Beam | 104 | 251 | 41.4 | 3,086 | 14,624 | 21.1 | <0.001 | 2.645 |
| CarbonData | 899 | 1,366 | 65.8 | 655 | 1,964 | 33.4 | <0.001 | 3.847 |
| CloudStack | 463 | 1,786 | 25.9 | 5,249 | 21,499 | 24.4 | 0.163 | 1.083 |
| CouchDB | 132 | 560 | 23.6 | 221 | 6,554 | 3.4 | <0.001 | 8.838 |
| Dispatch | 279 | 381 | 73.2 | 766 | 1,726 | 44.4 | <0.001 | 3.428 |
| Ignite | 477 | 888 | 53.7 | 4,777 | 16,677 | 28.6 | <0.001 | 2.891 |
| Impala | 1,411 | 1,975 | 71.4 | 2,464 | 5,510 | 44.7 | <0.001 | 3.093 |
| Kafka | 723 | 1,029 | 70.3 | 2,658 | 5,886 | 45.2 | <0.001 | 2.869 |
| Kylin | 65 | 126 | 51.6 | 1,640 | 5,461 | 30.0 | <0.001 | 2.483 |
| Ranger | 165 | 203 | 81.3 | 1,112 | 2,242 | 49.6 | <0.001 | 4.412 |
| Reef | 83 | 163 | 50.9 | 396 | 2,357 | 16.8 | <0.001 | 5.138 |
| Spark | 1,324 | 2,772 | 47.8 | 6,465 | 19,010 | 34.0 | <0.001 | 1.774 |
| Subversion | 851 | 3,113 | 27.3 | 4,389 | 41,880 | 10.5 | <0.001 | 3.214 |
| Thrift | 306 | 512 | 59.8 | 1,214 | 3,897 | 31.2 | <0.001 | 3.283 |
| Zeppelin | 266 | 414 | 64.3 | 879 | 2,564 | 34.3 | <0.001 | 3.445 |
| Average | - | - | 54.2 | - | - | 32.1 | - | - |
| Project | #BIMPLC | AveNumIBMPLC | #BINonMPLC | AveNumIBNonMPLC | p-value | ES(r) |
| Airavata | 69 | 1.42 | 1,185 | 1.54 | 0.813 | -0.007 |
| Ambari | 1,279 | 7.12 | 11,782 | 3.76 | <0.001 | 0.174 |
| Arrow | 596 | 3.64 | 1,501 | 2.31 | <0.001 | 0.174 |
| Beam | 104 | 2.16 | 3,086 | 1.62 | <0.001 | 0.066 |
| CarbonData | 899 | 3.80 | 655 | 2.09 | <0.001 | 0.304 |
| CloudStack | 463 | 2.99 | 5,249 | 1.93 | <0.001 | 0.118 |
| CouchDB | 132 | 1.62 | 221 | 1.40 | 0.005 | 0.153 |
| Dispatch | 279 | 3.99 | 766 | 2.28 | <0.001 | 0.252 |
| Ignite | 477 | 3.33 | 4,777 | 2.18 | <0.001 | 0.101 |
| Impala | 1,411 | 4.27 | 2,464 | 2.52 | <0.001 | 0.240 |
| Kafka | 723 | 6.30 | 2,658 | 3.19 | <0.001 | 0.262 |
| Kylin | 65 | 2.57 | 1,640 | 1.78 | <0.001 | 0.100 |
| Ranger | 165 | 6.42 | 1,112 | 3.17 | <0.001 | 0.213 |
| Reef | 83 | 1.86 | 396 | 1.66 | 0.012 | 0.117 |
| Spark | 1,324 | 3.53 | 6,465 | 2.36 | <0.001 | 0.139 |
| Subversion | 851 | 2.18 | 4,389 | 1.56 | <0.001 | 0.118 |
| Thrift | 306 | 3.10 | 1,214 | 1.94 | <0.001 | 0.181 |
| Zeppelin | 266 | 3.38 | 879 | 1.91 | <0.001 | 0.195 |
5 Discussion
In this section, we interpret the results of the study according to the RQs and discuss the implications of the results for both practitioners and researchers.
5.1 Interpretation of Study Results
RQ1: Although different PLs are used in different projects, they tend to use a specific combination of PLs. The entropy of PL use, i.e., EntropyPL, measures the degree to which the use of PLs is balanced. The result on the EntropyPL suggests that a higher degree of balanced use of PLs does not depend on a larger number of PLs used. For instance, the project Dispach uses the second least PLs (i.e., 5 PLs) but gets the second largest EntropyPL of 0.683.
The number of PLs employed and the EntropyPL do not depend on the domain of the project, but on the functionalities provided by the project. For instance, both Arrow and Kylin belong to the domain of big data, but the EntropyPL of Arrow is much larger than that of Kylin; Both Ambari and CarbonData belong to the domain of big data, but the number of PLs used in Ambari is much larger than that in CarbonData. Although Arrow and Thrift belong to different domains, both provide libraries used by multiple PLs. Arrow provides libraries that are “available for C, C++, C#, Go, Java, JavaScript, Julia, MATLAB, Python, R, Ruby, and Rust222https://arrow.apache.org”; Thrift is for scalable cross-language services development, and ”combines a software stack with a code generation engine to build services that work efficiently and seamlessly between C++, Java, Python, PHP, Ruby, Erlang, Perl, Haskell, C#, Cocoa, JavaScript, Node.js, Smalltalk, OCaml and Delphi and other languages333https://thrift.apache.org”.
RQ2: Only 9.3% of the commits are MPLCs when taking all projects as a whole, and the other 90.7% of the commits are non-MPLCs. It indicates that developers tend to make mono-language changes despite the MPL development. However, from the perspective of individual projects, the proportion of MPLCs may differ greatly. As we can see from Table 4 and Table 6, a greater number of PLs used and a lower percentage of code in the main PL do not necessarily mean a larger proportion of MPLCs in a project. One possible reason is that design quality may play an important role. For instance, higher modularity may reduce the likelihood of MPLCs.
Although the proportion of MPLCs of the selected projects differs from one to one, the proportion of MPLCs goes to a relatively stable level for most (83%) of the selected projects. This is an interesting phenomenon, which may indicate certain balanced status in the development, e.g., stable architecture design. It is worth further investigation to explore what factors play dominant roles in this phenomenon.
The strong positive correlation between the proportion of MPLCs and the Entropy of the use of PLs indicates that the proportion of MPLCs is related to how balanced different PLs are used. On the other hand, a higher proportion of MPLCs may not depend on a larger number of PLs used. As we can see in Table 5, projects Beam, CloudStack, Ignite, and Kafka use a relatively large number of PLs, but they have only relatively small EntropyPL, smaller than most projects (e.g., Dispatch and Impala) with 5 or 6 PLs used.
RQ3: Most of MPLCs involve source files written in two PLs, which may be a natural choice of developers. Source files in more PLs to be modified in a commit may lead to higher complexity of the code change, which requires more comprehensive consideration of the potential influence of the code change on the quality of the software systems. However, there is a lack of effective tools to automatically analyze change impact in an MPL context, and MPL code analysis still remains a rather challenging problem (Shatnawi et al., 2019).
RQ4: Change complexity of MPLCs is significantly higher than that of non-MPLCs, which is not surprising. MPLCs involve source files written in multiple PLs, and source files in different PLs are usually distributed over different components. Therefore, MPLCs tend to exert relatively global impact on the software system, and the change complexity of MPLCs is likely to be higher. In addition, the results of all the four change complexity measures (i.e., LOCM, NOFM, NODM, and Entropy) are perfectly consistent, which increases the confidence in the finding that changes in MPLCs are more complex than changes in non-MPLCs. Finally, the information on whether a code change is an MPLC can facilitate effort estimation in project management.
RQ5: The results on the open time of issues show that issues fixed in MPLCs likely take longer to be resolved than issues fixed in non-MPLCs. The open time of issues generally depends on two factors: the priority of issues and the difficulty of resolving issues. We investigated whether there is a significant difference on the priority of issues fixed in MPLCs and non-MPLCs, and found that there is no significant difference between the priority of issues fixed in MPLCs and non-MPLCs for most (10/18) of the selected projects. The results on the issue priority are not presented in this paper due to derivation from the focus of this work, but have been available online444https://github.com/ASSMS/JSS/blob/main/IssuePriority.pdf. Thus, the main reason for issues fixed in MPLCs taking longer to be resolved may be that such issues are more difficult to be fixed, which is evidenced by the results on RQ4.
RQ6: There is no significant connection between MPLCs and issue reopen. Although the change complexity of MPLCs are significantly higher than that of non-MPLCs, it does not mean that MPLCs will result in more rework of bug-fixing.
RQ7: Source files modified in MPLCs are likely to be more bug-prone, thus, the proportion of source files that have been modified in MPLCs can be used as an indicator of risk of bug introduction in MPL software systems. Source files in various PLs modified in an MPLC indicate that these source files are linked together due to (in)direct dependencies. In addition, source files in different PLs are communicated through dedicated mechanisms (e.g., JNI) and there is a lack of cross-language analysis tools, which increases the difficulty of bug fixing and consequently results in higher bug proneness of the involved source files in MPLCs.
RQ8: (1) One potential reason for that MPLCs are more likely to introduce bugs is that: an MPLC often involves changes in multiple modules or subsystems, which is more complex to analyze and understand. For the same reason, an bug-introducing MPLC tends to introduce more bugs than a bug-introducing non-MPLC. (2) As shown in Table 13, an MPLC or non-MPLC can introduce a relatively large number (more than one and even seven) of bugs. The reason is that a bug may be introduced by multiple commits. Since we consider a bug-introducing commit of bug as the last commit containing one or more files modified in the commit in which bug is fixed, bug can have more than one bug-introducing commit.
5.2 Implications for Practitioners
Prevent too many MPLCs by architecture design of MPL software systems. Since the change complexity of MPLCs is significantly higher than non-MPLCs, too many MPLCs happening in an MPL system will result in a considerable increase of effort for making changes to the system. An MPLC tends to be at the architecture level in light of that multiple components are modified in the MPLC. Thus, it is wise to design a more maintainable architecture for an MPL system. When a relatively high proportion of commits are MPLCs in an MPL system, there is a necessity to assess the maintainability (especially modularity) of the architecture of this system (Mo et al., 2016; Wong et al., 2011), and then to improve the architecture design through e.g., refactoring.
Pay special attention to source files modified in MPLCs. As the results of RQ7 revealed, the source files modified in MPLCs are likely to have a higher defect density than that of source files only modified in non-MPLCs. Therefore, practitioners should pay more attention to the former. For instance, designers may improve the modularity of source files modified in MPLCs, in order to lower the likelihood of such source files being modified together; developers need to investigate deeper on the impact of MPLCs; and developers and testers can invest more effort to test such source files.
5.3 Implications for Researchers
Take MPLCs into account when constructing defect prediction models for MPL software systems. Since whether the source files have been modified in MPLCs plays a role in the defect density of source files, it is reasonable to take MPLCs as a factor in defect prediction for MPL systems.
Investigate the factors that influence the proportion of MPLCs in MPL software systems. The change complexity of MPLCs is much higher than that of non-MPLCs, which implies that MPLCs will greatly increase the development cost of MPL software systems. Therefore, it is necessary to keep the proportion of MPLCs of an MPL system under a reasonable level. However, it still remains unclear what factors contribute to a relatively high proportion of MPLCs in an MPL system, which is an interesting research question.
Require larger-scale studies. As shown in Table 4, some PLs (e.g., Clojure, Kotlin, and Swift) are seldom used in the selected projects, while some other PLs (e.g., Java, Python, C/C++, and JavaScript) are commonly used in the selected projects. More projects written by the seldom used PLs are needed to balance the use of different PLs. To our experience, it is not possible to find many more Apache projects for research on MPLCs. Instead, it is better to turn to a bigger platform, such as GitHub, to find more suitable projects.
Need further studies on the relationship between MPLCs and software architecture. Although intuitively MPLCs are more related to the changes at the architecture level, there still lacks evidence on how MPLCs relate to software architecture and vice verse. We believe that this could be a promising research topic to be further explored.
Explore the reasons for why a majority of MPLCs introduce bugs in specific projects. For instance, the project Ambari, the percentage of bug-introducing MPLCs is more than 85%, an incredibly high level. In such a software system, it is highly risky to make every change involving source files written in multiple PLs. Thus, it is valuable to investigate the reasons behind this phenomenon, so as to take actions to avoid a large percentage of bug-introducing MPLCs.
6 Threats to Validity
There are several threats to the validity of the study results. We discuss these threats according to the guidelines in (Runeson and Höst, 2009). Please note that internal validity is not discussed, since we do not study causal relationships.
6.1 Construct Validity
Construct validity is concerned with whether the values of the variables (listed in Table 2 and Table 3) we obtained are in line with the real values that we expected. A potential threat to construct validity is that not all issues resolved are linked to corresponding commits. Due to different developer habits and development cultures, committers may not explicitly mention the ID of the issue resolved in corresponding commit message, which may negatively affect the representativeness of the collected issues and further influence the accuracy of defect density and the time taken to resolve issues. Through our analysis (the analysis results are not shown in this paper due to its deviation from the focus of this paper), we confirmed that the committers who explicitly mention the issue ID do not come from a small group of specific developers. Therefore, this threat is to some extent mitigated.
Another potential threat is related to the commits corresponding to the MERGE operation. Since a MERGE commit is usually a combination of a number of commits from different branches of the repository, such a commit is likely to be an MPLC in an MPL software system. Furthermore, the changed source files in the MERGE commit are duplicate with those in the merged commits. If such MERGE commits are still kept in the dataset, the quality of the dataset would be negatively affected, especially when a project has frequent MERGE operations. As described in Section 3.4.2, we discarded the MERGE commits, and thus this threat is totally removed.
One more threat is that a bug’s bug-introducing commits identified by the SZZ method implemented in the PyDriller tool may not be the real cause of the bug. Abidi et al. manually evaluated the effectiveness of the SZZ method implemented in PyDriller, and found that the precision of bug-introducing commits identified by PyDriller is more than 70% (Abidi et al., 2021). Thus, this threat is partially mitigated.
Finally, the open time of an issue is considered as the time between its creation and resolution without removing the “assignment time” between its creation and it being assigned to a developer, which may cause the inaccuracy of open time calculation. In our study, we did not remove the assignment time, since (1) our dataset (manually exported from JIRA) does not contain the time information when an issue is assigned to a developer, (2) some closed or resolved issues even do not have any developers assigned to them, and thus there is no assignment time for such issues, and (3) it is possible that an issue is not assigned to a developer until it is actually resolved by the developer, and removing the assignment time of such issues will reduce their actual open time.
6.2 External Validity
External validity is concerned with the generalizability of the study results. First, a potential threat to external validity is whether the selected projects are representative enough. As presented in Section 3.3, we applied a set of criteria to select projects. We tried to include as many as possible the Apache projects that meet the selection criteria. Furthermore, the selected projects cover different application domains, and differ in code repository size and development duration. This indicates improved representativeness of the selected projects.
Second, another threat is that only Apache MPL OSS projects were selected. The number of available projects is relatively small, which may reduce the generalizability of the study results.
Third, the use of different PLs by the selected projects are not balanced, which exposes a threat to the external validity. Some PLs are used by all selected project, while some other PLs are used by only a couple of selected projects. This threat can be mitigated by including more projects using the PLs that are not adopted in the selected projects in this paper. This is a direction of our future work.
Finally, since only 18 PLs are considered in this study, the findings and the conclusions drawn are only valid for projects using these PLs. Since only OSS projects were selected, we cannot generalize the findings and conclusions to closed source software projects.
6.3 Reliability
Reliability refers to whether the study yields the same results when it is replicated by other researchers. A potential threat is related to the implementation of related software tools for data collection. The tools were mainly implemented by the third author, and the code of the key functionalities had been regularly reviewed by the first and second authors. In addition, sufficient tests were performed to ensure the correctness of the calculation of data items. Hence, the threat to reliability had been alleviated.
Another threat is related to the correctness of the Mann-Whitney U tests. Since we only used IBM SPSS (a well-engineered and widely-used professional tool for statistics) to run the tests, this threat is minimal.
7 Conclusions and Future Work
The phenomenon of MPLCs is prevalent in modern software system development. To our knowledge, this phenomenon has not been explored yet. In light of the potential influence of MPLCs on development difficulty and software quality, we conducted an empirical study to understand the state of MPLCs, their change complexity, as well as their impacts on open time of issues and bug proneness of source files in real-life software projects.
Following a set of predefined criteria, we selected 18 non-trivial Apache MPL OSS projects, in which 197,566 commits (including 18,372 MPLCs) were analyzed. The main findings are that:
-
•
The most commonly used PL combination in the selected projects consists of all of the four PLs, i.e., C/C++, Java, JavaScript, and Python.
-
•
The proportion of MPLCs for the selected projects ranges from 1.7% to 41.0%, and 9.3% of the commits are MPLCs when taking all projects as a whole. The proportion of MPLCs goes to a relatively stable level for 83% of the selected projects.
-
•
In most of the selected projects, the average number of PLs used in each MPLC is around 2.0. Particularly, when taking all selected projects as a whole, 91.7% of the MPLCs involve source files written in two programming languages.
-
•
The change complexity (in terms of the number of lines of code, source files, directories modified, and Entropy) of MPLCs is significantly higher than that of non-MPLCs in all selected projects.
-
•
In 89% of the selected projects, the issues fixed in MPLCs take longer (by 8.0% to 124.7%) to be resolved than the issues fixed in non-MPLCs.
-
•
In 89% of the selected projects, there are no significant differences between MPLCs and non-MPLCs regarding the impact on issue reopen.
-
•
In 83% of the selected projects, the source files that have been modified in MPLCs are more bug-prone (by 17.2% to 3,681.8%) in terms of defect density than source files that have never been modified in MPLCs.
-
•
MPLCs are more likely to introduce bugs than non-MPLCs.
Based on the results of this exploratory study, our future research will focus on the following directions: First, one promising direction is to investigate how MPLCs and software architecture interplay in MPL software systems. For instance, we may look into whether MPLCs are related to architectural technical debt (Li et al., 2015b, a). Second, we plan to use MPLCs as an additional factor to enhance bug prediction models for MPL systems based on existing models. Third, to better understand how bugs are introduced in MPLCs and non-MPLCs, we will conduct an in-depth analysis on several selected projects. Finally, we will replicate this study by constructing a large-scale dataset, in which more projects written in diverse PLs will be included to balance the use of different PLs.
Acknowledgment
This work is supported by the Natural Science Foundation of Hubei Province of China under Grant No. 2021CFB577, and the National Natural Science Foundation of China under Grant Nos. 62176099, 62172311, and 61702377.
References
- Abidi et al. (2019a) Abidi, M., Grichi, M., Khomh, F., 2019a. Behind the scenes: developers’ perception of multi-language practices, in: Proceedings of the 29th Annual International Conference on Computer Science and Software Engineering (CASCON’19), IBM Corp.. pp. 72–81.
- Abidi et al. (2019b) Abidi, M., Grichi, M., Khomh, F., Guéhéneuc, Y.G., 2019b. Code smells for multi-language systems, in: Proceedings of the 24th European Conference on Pattern Languages of Programs (EuroPLoP’19), ACM. p. Article 12.
- Abidi et al. (2019c) Abidi, M., Khomh, F., Guéhéneuc, Y.G., 2019c. Anti-patterns for multi-language systems, in: Proceedings of the 24th European Conference on Pattern Languages of Programs (EuroPLoP’19), ACM. p. Article 42.
- Abidi et al. (2021) Abidi, M., Rahman, M.S., Openja, M., Khomh, F., 2021. Are multi-language design smells fault-prone? an empirical study. ACM Transactions on Software Engineering and Methodology 30, Article No. 29.
- Basili (1992) Basili, V.R., 1992. Software modeling and measurement: The goal/question/metric paradigm. URL: http://drum.lib.umd.edu/bitstream/1903/7538/1/Goal_Question_Metric.pdf.
- Benjamini and Hochberg (1995) Benjamini, Y., Hochberg, Y., 1995. Controlling the false discovery rate: A practical and powerful approach to multiple testing. Journal of the Royal Statistical Society: Series B (Methodological) 57, 289–300.
- Berger et al. (2019) Berger, E.D., Hollenbeck, C., Maj, P., Vitek, O., Vitek, J., 2019. On the impact of programming languages on code quality: A reproduction study. ACM Transactions on Programming Languages and Systems 41, Article 21.
- Bhattacharya and Neamtiu (2011) Bhattacharya, P., Neamtiu, I., 2011. Assessing programming language impact on development and maintenance: a study on C and C++, in: Proceedings of the 33rd International Conference on Software Engineering (ICSE’11), pp. 171–180.
- Field (2013) Field, A., 2013. Discovering Statistics using IBM SPSS Statistics. Fourth ed., Sage Publications Ltd., Singapore.
- Grichi et al. (2021) Grichi, M., Abidi, M., Jaafar, F., Eghan, E.E., Adams, B., 2021. On the impact of interlanguage dependencies in multilanguage systems empirical case study on java native interface applications (JNI). IEEE Transactions on Reliability 70, 428–440.
- Grichi et al. (2020) Grichi, M., Eghan, E.E., Adams, B., 2020. On the impact of multi-language development in machine learning frameworks, in: Proceedings of the 36th IEEE International Conference on Software Maintenance and Evolution (ICSME’20), IEEE. pp. 546–556.
- Hassan (2009) Hassan, A.E., 2009. Predicting faults using the complexity of code changes, in: Proceedings of the 31st International Conference on Software Engineering (ICSE’09), IEEE. pp. 78–88.
- Kargar et al. (2019) Kargar, M., Isazadeh, A., Izadkhah, H., 2019. Multi-programming language software systems modularization. Computers & Electrical Engineering 80, 106500.
- Kargar et al. (2020) Kargar, M., Isazadeh, A., Izadkhah, H., 2020. Improving the modularization quality of heterogeneous multi-programming software systems by unifying structural and semantic concepts. Journal of Supercomputing 76, 87–121.
- Kochhar et al. (2016) Kochhar, P.S., Wijedasa, D., Lo, D., 2016. A large scale study of multiple programming languages and code quality, in: Proceedings of the IEEE 23rd International Conference on Software Analysis, Evolution, and Reengineering (SANER’16), pp. 563–573.
- Kontogiannis et al. (2006) Kontogiannis, K., Linos, P., Wong, K., 2006. Comprehension and maintenance of large-scale multi-language software applications, in: Proceedings of the 22nd IEEE International Conference on Software Maintenance (ICSM’06), IEEE. pp. 497–500.
- Li et al. (2015a) Li, Z., Avgeriou, P., Liang, P., 2015a. A systematic mapping study on technical debt and its management. Journal of Systems and Software 101, 193–220.
- Li et al. (2015b) Li, Z., Liang, P., Avgeriou, P., 2015b. Architectural technical debt identification based on architecture decisions and change scenarios, in: Proceedings of the 12th Working IEEE/IFIP Conference on Software Architecture (WICSA’15), IEEE. pp. 65–74.
- Li et al. (2017) Li, Z., Liang, P., Li, B., 2017. Relating alternate modifications to defect density in software development, in: Proceedings of the 39th International Conference on Software Engineering Companion (ICSE’17), IEEE. pp. 308–310.
- Li et al. (2020) Li, Z., Liang, P., Li, D., Mo, R., Li, B., 2020. Is bug severity in line with bug fixing change complexity? International Journal of Software Engineering and Knowledge Engineering 30, 1779–1800.
- Li et al. (2021) Li, Z., Qi, X., Yu, Q., Liang, P., Mo, R., Yang, C., 2021. Multi-programming-language commits in oss: An empirical study on apache projects, in: Proceedings of the 29th IEEE/ACM International Conference on Program Comprehension (ICPC’21), IEEE. pp. 1–11.
- Li et al. (2022) Li, Z., Qi, X., Yu, Q., Liang, P., Mo, R., Yang, C., 2022. Dataset for "Exploring Multi-Programming-Language Commits and Their Impacts on Software Quality: An Empirical Study on Apache Projects". https://github.com/ASSMS/JSS/tree/main/Dataset .
- Mayer (2017) Mayer, P., 2017. A taxonomy of cross-language linking mechanisms in open source frameworks. Computing 99, 701–724.
- Mayer and Bauer (2015) Mayer, P., Bauer, A., 2015. An empirical analysis of the utilization of multiple programming languages in open source projects, in: Proceedings of the 19th International Conference on Evaluation and Assessment in Software Engineering (EASE’15), ACM. p. Article 4.
- Mayer et al. (2017) Mayer, P., Kirsch, M., Le, M.A., 2017. On multi-language software development, cross-language links and accompanying tools: a survey of professional software developers. Journal of Software Engineering Research and Development 5, 1–33.
- Mo et al. (2016) Mo, R., Cai, Y., Kazman, R., Xiao, L., Feng, Q., 2016. Decoupling level: A new metric for architectural maintenance complexity, in: Proceedings of the 38th International Conference on Software Engineering (ICSE’16), ACM. pp. 499–510.
- Ray et al. (2014) Ray, B., Posnett, D., Filkov, V., Devanbu, P., 2014. A large scale study of programming languages and code quality in github, in: Proceedings of the 22nd ACM SIGSOFT International Symposium on Foundations of Software Engineering (FSE’14), ACM. pp. 155–165.
- Runeson and Höst (2009) Runeson, P., Höst, M., 2009. Guidelines for conducting and reporting case study research in software engineering. Empirical Software Engineering 14, 131–164.
- Shatnawi et al. (2019) Shatnawi, A., Mili, H., Abdellatif, M., Guéhéneuc, Y.G., Moha, N., Hecht, G., El Boussaidi, G., Privat, J., 2019. Static code analysis of multilanguage software systems. URL: https://arxiv.org/abs/arXiv:1906.00815v1.
- Spadini et al. (2018) Spadini, D., Aniche, M., Bacchelli, A., 2018. PyDriller: Python framework for mining software repositories, in: Proceedings of the 26th ACM Joint Meeting on European Software Engineering Conference and Symposium on the Foundations of Software Engineering (ESEC/FSE’18), ACM. pp. 908–911.
- Wong et al. (2011) Wong, S., Cai, Y., Kim, M., Dalton, M., 2011. Detecting software modularity violations, in: Proceedings of the 33rd International Conference on Software Engineering (ICSE’11), IEEE. pp. 411–420.
- Śliwerski et al. (2005) Śliwerski, J., Zimmermann, T., Zeller, A., 2005. When do changes induce fixes? ACM SIGSOFT Software Engineering Notes 30, 1–5.