Artificial Text Boundary Detection with Topological Data Analysis and Sliding Window Techniques
Abstract
Due to the rapid development of text generation models, people increasingly often encounter texts that may start out as written by a human but then continue as machine-generated results of large language models. Detecting the boundary between human-written and machine-generated parts of such texts is a very challenging problem that has not received much attention in literature. In this work, we consider and compare a number of different approaches for this artificial text boundary detection problem, comparing several predictors over features of different nature. We show that supervised fine-tuning of the RoBERTa model works well for this task in general but fails to generalize in important cross-domain and cross-generator settings, demonstrating a tendency to overfit to spurious properties of the data. Then, we propose novel approaches based on features extracted from a frozen language model’s embeddings that are able to outperform both the human accuracy level and previously considered baselines on the Real or Fake Text benchmark (Dugan et al., 2020). Moreover, we adapt perplexity-based approaches for the boundary detection task and analyze their behaviour. We analyze the robustness of all proposed classifiers in cross-domain and cross-model settings, discovering important properties of the data that can negatively influence the performance of artificial text boundary detection algorithms.
1 Introduction
Artificial text detection is a very difficult problem in real life, where machine-generated text may be intertwined with human-written text, lightly edited, or pad out human-generated prompts. However, previous attempts at artificial text detection in machine learning literature have usually formulated this task in a rather simplified way: a typical setup involves experiments on a dataset of text samples labeled as either entirely human-written or entirely machine-written, so the detection problem can be safely treated as binary classification. Moreover, the models that perform this binary classification often are developed and trained to detect a particular type of the generator, e.g., text produced by a specific large language model (LLM) Uchendu et al. (2023). This represents a stark contrast with how we may encounter artificially created text in real life, where documents partially written by humans and partially generated by LLMs already abound. This setting is much more complex and much less researched at the same time.
To approach this problem, in this work we experiment with a lesser known dataset called RoFT (Real Or Fake Text), collected by Dugan et al. (2020). Each text in this dataset consists of ten sentences, where the first several sentences are human-written and the rest are machine-generated starting from this prompt, mainly by models from the GPT family (Radford et al., 2019; Brown et al., 2020). We consider several techniques already developed for binary artificial text detection, modifying them to this more complex problem setting of boundary detection; in particular, following Tulchinskii et al. (2023) we adapt intrinsic dimension estimation which is currently considered to be the best method for binary detection.
Our primary contributions are as follows:
-
•
we develop new approaches for detecting the boundary between human-written and machine-generated text and demonstrate how the tools developed for time series analysis can be adapted for extracting useful information from Transformer representations; our approaches here are mostly based on the properties of latent representations of the RoBERTa model;
-
•
we adapt perplexity-based methods for this new setting, discussing the differences in their behavior compared to binary artificial text detection and providing a comprehensive analysis of how perplexity scores react to the machine–human transition in the text;
-
•
we analyze the robustness of all boundary detectors (including the fully-tuned RoBERTa baseline) to domain shifts and show how it depends on the properties of these domains; we also study peculiarities in the dataset itself and their relations to the performance of different approaches;
-
•
we enrich the RoFT dataset with GPT-3.5-turbo111https://platform.openai.com/docs/model-index-for-researchers (ChatGPT) generation samples; we share this new dataset with the community, establish baselines, and analyze the behavior of our detectors on it.
We hope that the present work will encourage further research in both directions: first, boundary detection for texts that are partially human-written and partially generated, and second, analyzing how inner representations of Transformer-based models react to such transitions; the latter direction may also help interpretability research.
The rest of the paper is organized as follows. In Section 2 we survey related work, and Section 3 introduces the methods we have applied for artificial text boundary detection. Section 4 presents a comprehensive evaluation study on the RoFT and RoFT-chatgpt datasets. Section 5 presents a detailed discussion and analysis of our experimental results, and Section 6 concludes the paper.
2 Related Works
We refer to a recent survey by Uchendu et al. (2023) that discusses a number of different settings for artificial text detection and the main types of detectors, so in this section we concentrate only on a few specific approaches that are most relevant to our research.
2.1 Artificial Text Detection with Topological Data Analysis
In terms of methods for artificial text detection, apart from standard approaches we take special inspiration from the results of Tulchinskii et al. (2023). Their work shows that many artificial text generators, including GPT-2-XL, ChatGPT, and gpt-3.5-davinci, share a common property: the intrinsic dimensions (PHD) of RoBERTa embeddings of the texts created by these generators are typically smaller than those of the texts written by humans. This motivated Tulchinskii et al. (2023) to suggest intrinsic dimensions as high-performing features for artificial text detection, a direction that we explore further in this work. Another work in the same topic, also related to our research, was done by Kushnareva et al. (2021) who for the first time introduced topological features of the inner representations of a Transformer-based model (BERT in that case) for artificial text detection; topological data analysis has also proven to be useful for closely related tasks of fake news detection (Tudoreanu, ) and authorship attribution (Elyasi and Moghadam, 2019).
2.2 Style Change Detection
The artificial text boundary detection task has a lot in common with the style change detection problem (Zangerle et al., 2021). In this setting, the model is analyzing multi-author documents (such as, e.g., research papers), and the goal is to detect positions in the document where the author writing it changes. In the particular challenge introduced by Zangerle et al. (2021), the documents were created by compiling answers from StackExchange Q&A threads into a single text. In some subtasks, style changes occur only between paragraphs; in others, they may occur at the level of individual sentences. Our task can be formulated as a style change detection problem for two authors—human and artificial generator—with style changes occurring at the sentence level.
The best detectors found so far for the style change detection task, including the works by Lin et al. (2022), Jiang et al. (2022), Lao et al. (2022), and Iyer and Vosoughi (2020), are based on Transformer-based encoders such as BERT Devlin et al. (2019), RoBERTa Liu et al. (2019), AlBERT Lan et al. (2020), and ELECTRA Clark et al. (2020). In this work we also use RoBERTa as a baseline and a source of embeddings for several of our methods.
2.3 RoFT (Real Or Fake Text)
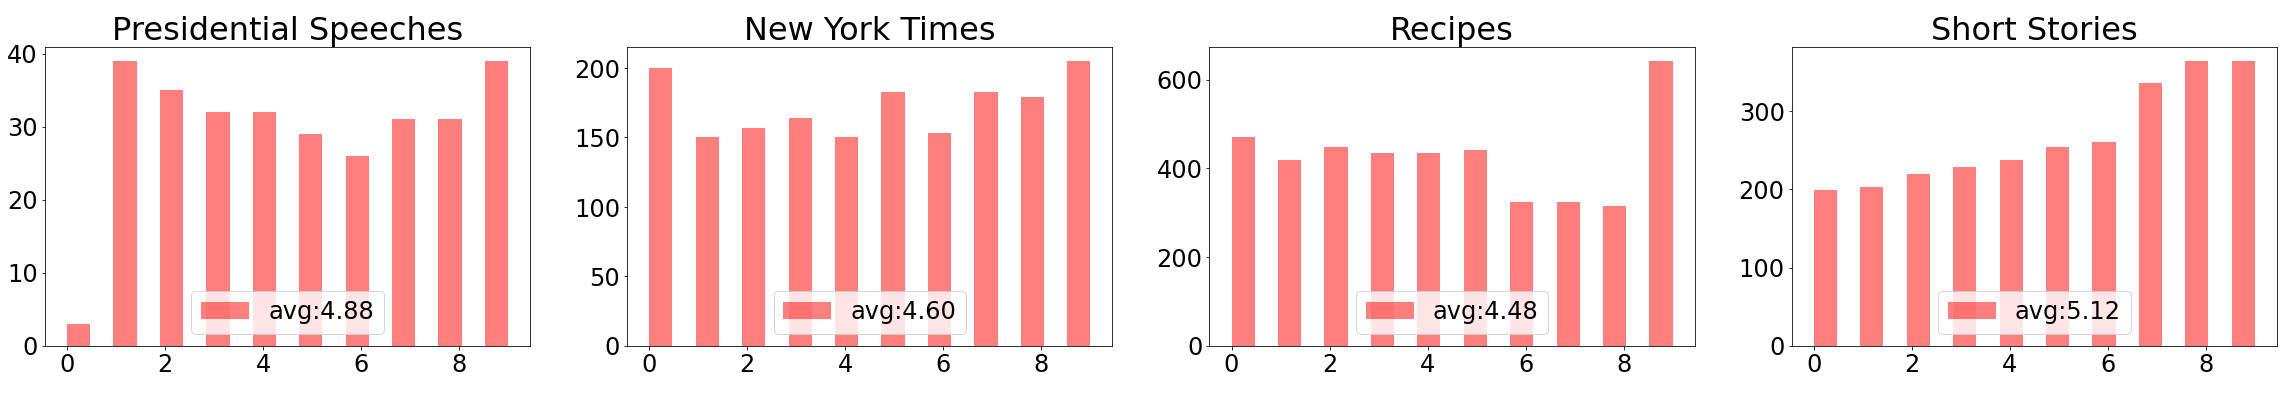
Our main dataset, collected by Dugan et al. (2020), originates from a website called RoFT222http://www.roft.io/ developed as a tool to analyze how humans detect generated text, including an extended study of whether and how they can explain their choice, when they say that a text sample is machine-generated, and how humans can learn to recognize machine-generated text better. Every user of this website can choose the topic (“Short Stories”, “Recipes”, “New York Times”, or “Presidential Speeches”) and start the “game” that looks as follows.
The player sees ten sentences one by one. The first sentence is always written by a human, but for each next sentence, the player is asked: is this sentence machine-generated or human-written? If the player believes the sentence is machine-generated, they are asked to provide feedback on why they think so. For example, the player may say that the sentence is ungrammatical, contradicts previous sentences, and so on. After this, the player is shown the correct answer. If the player guesses correctly, they earn points. If they guess machine generation before the boundary, they earn zero points. Otherwise, they earn points, where is the number of sentences after the correct boundary. Note that this is a harder problem than just boundary detection (since the player does not see the whole text and has to decide online), and also the scoring function is different from how we score model quality in this work since it is much worse in the RoFT game to detect the boundary earlier than later.
To summarize the information they gained from this website, Dugan et al. (2020) created a dataset also known as RoFT. In this dataset, every sample consists of ten sentences: the first sentences are human-written, and the other sentences are generated by some language model that uses the first sentences as a prompt. Every sample is accompanied by the following information: true value of ; the value predicted by a player; the topic (“Short Stories”, “Recipes”, “New York Times”, or “Presidential Speeches”); the generator model; explanation that the player provided for why they think that the th sentence is machine-generated; miscellaneous information about the player.
The original RoFT contains generations from the following models:
-
•
GPT-2 (Radford et al., 2019);
-
•
GPT-2 finetuned on the “Recipes” domain;
-
•
GPT-2-XL;
-
•
GPT-3.5 (davinci);
-
•
CTRL (Keskar et al., 2019) with control code “nocode”;
-
•
CTRL with control code “Politics”;
-
•
baseline, where instead of transitioning to an LM-generated continuation the passage transitions to a completely different news article selected at random.
In most studies, RoFT and datasets on similar topics are used to investigate how humans detect artificially generated texts manually. In particular, Clark et al. (2021) used datasets intersecting with RoFT examples and topics in order to evaluate several methods of improving the human ability to distinguish texts generated by GPT-2 and GPT-3 (i.e., training humans rather than neural networks).
Cutler et al. (2021) provided the first baselines on automatically solving RoFT. For this purpose, they used and compared several shallow classification and regression models based on RoBERTa and SRoBERTa (Reimers and Gurevych, 2019) embeddings collected from the last layer of these models. As a result, they found that logistic regression and random forests worked best when trained on particular domains. Aside from predicting true boundary labels, they also learned to predict human-predicted labels (“human-predicted boundary detection task”).
However, the cross-domain and cross-model settings in their research were very limited. In fact, Cutler et al. (2021) call “Out of Domain” (OOD) classifiers that had been trained on all available data and then evaluated on a given subset, and they call “In Domain” (ID) classifiers that had been trained and evaluated on the same subset. Besides, they did not analyze all generators and domains within this cross-domain setting. In contrast, in our work we concentrate on cross-domain and cross-model settings and interpretability. We evaluate our boundary detectors on unseen generators (models) and topics (domains). Also, we do this for all models and domains, establishing new baselines for the RoFT dataset.
3 Approach
Our methods for boundary detection span several different design choices. Initially, we adopt a multilabel classification framework, as proposed by Cutler et al. (2021), where the label of a text corresponds to the number of the first generated sentence. Another approach treats the text as a time series, sliding a fixed-size window over the text tokens. Labels can be predicted for every time point and then aggregated. Alternatively, we explore regression methods that aim to minimize the mean square error between true and predicted labels. For feature extraction, we adopt techniques that have been proven effective for artificial text detection before; below, we consider the details of every specific approach.
3.1 Boundary Detection as Multilabel Classification
We design our classifiers based on features that have been successfully used in prior works on artificial text detection (Solaiman et al., 2019; Mitchell et al., 2023). We also introduce a new baseline that uses sentence lengths as features.
RoBERTa classifier.
Unlike the approach proposed by Cutler et al. (2021), where each sentence is processed separately, we fine-tune the RoBERTa model (Liu et al., 2019) to represent the entire text sample via the [CLS] vector. This is the only case among our proposed models where we do apply full model fine-tuning. For other methods, we use simpler classifiers such as logistic regression or gradient boosting Friedman (2001) trained on various features that are extracted directly from larger trained models (e.g., Transformer-based language models), without any updates to the larger model’s weights.
3.1.1 Perplexity-based features.
We use a single unified model for all data to compute sentence-wise perplexity, making our approach more practical than that of Cutler et al. (2021) who used perplexity scores from the original model used to generate artificial text. Note that using the same model is not only harder in practice but may also be infeasible in situations where the generating model is unknown, in particular in cross-model scenarios.
Perplexity from GPT-2.
We calculate the perplexity of each word and each sentence in a text via the GPT-2 model (Radford et al., 2019). We then train a classifier using these vectors of sentence perplexities as features. Our underlying hypothesis here is that texts generated by similar models such as GPT-2 or GPT-3.5 might appear more “natural” to these models, as reflected by their perplexity scores. Our findings corroborate this assumption (see Appendix E).
DetectGPT.
The DetectGPT framework (Mitchell et al., 2023) proposes a more nuanced perplexity-based scoring function. It involves perturbing a text passage and comparing log-probabilities between original and altered texts. This score then serves as an input to a classification model, with GPT-2 as the base model and T5-Large (Raffel et al., 2020) generating the perturbations.
3.1.2 Length-Based Baseline
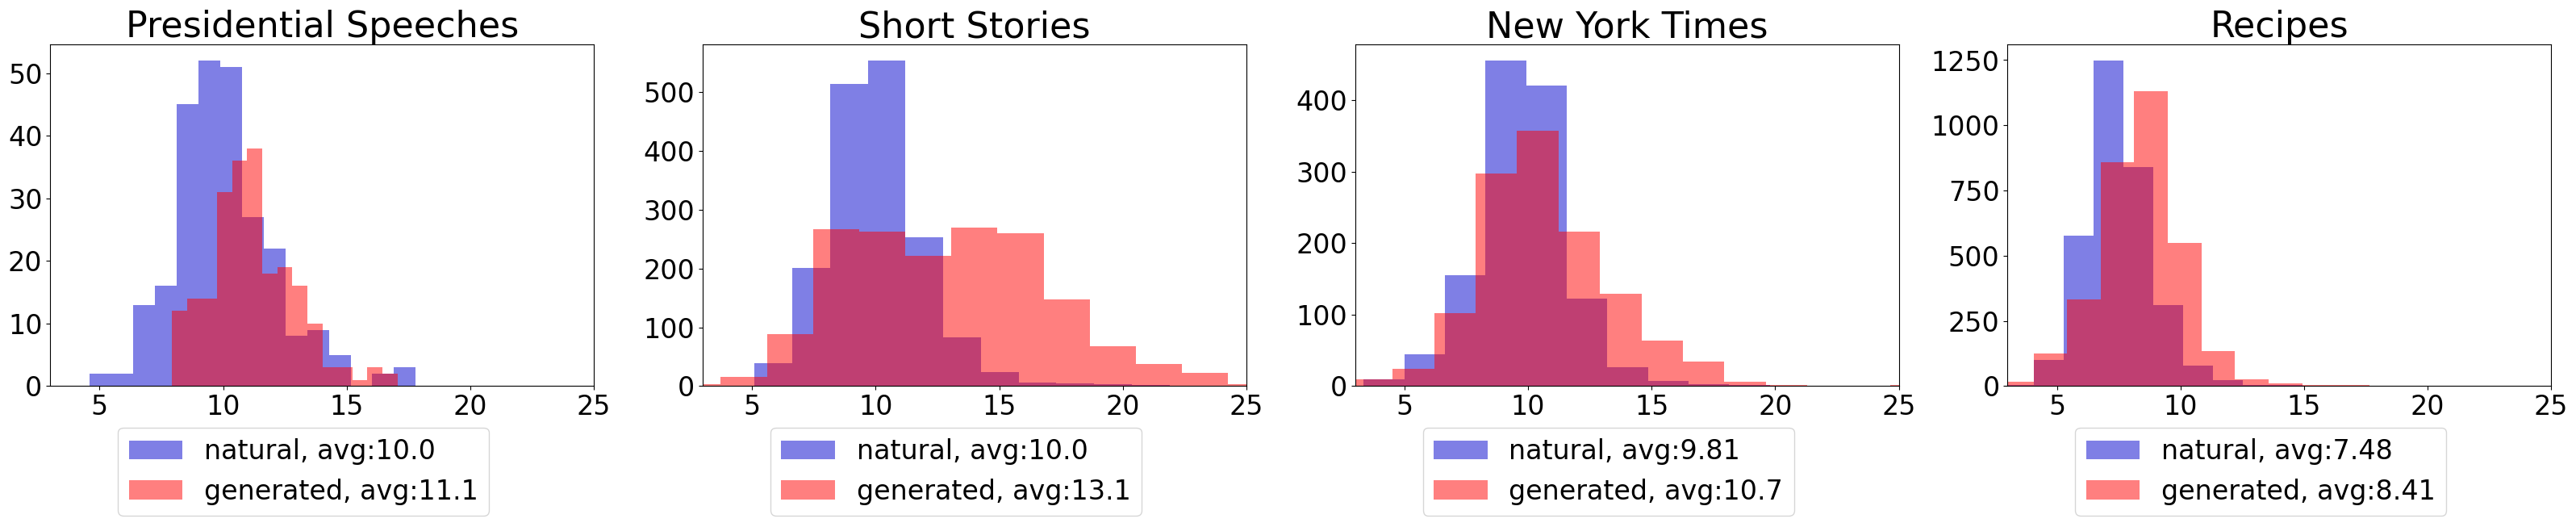
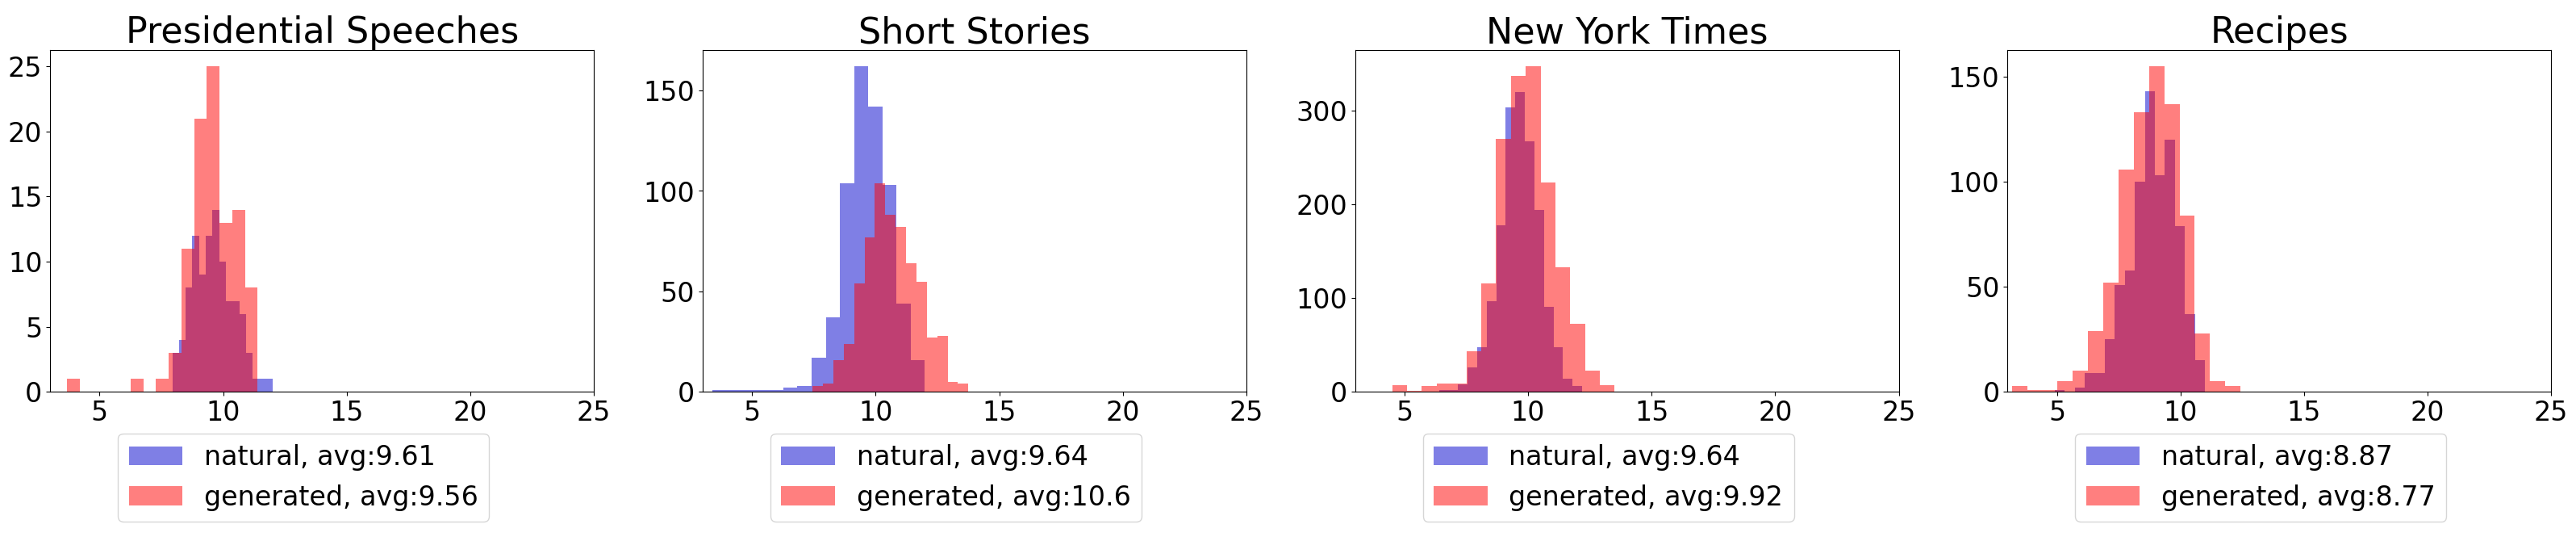
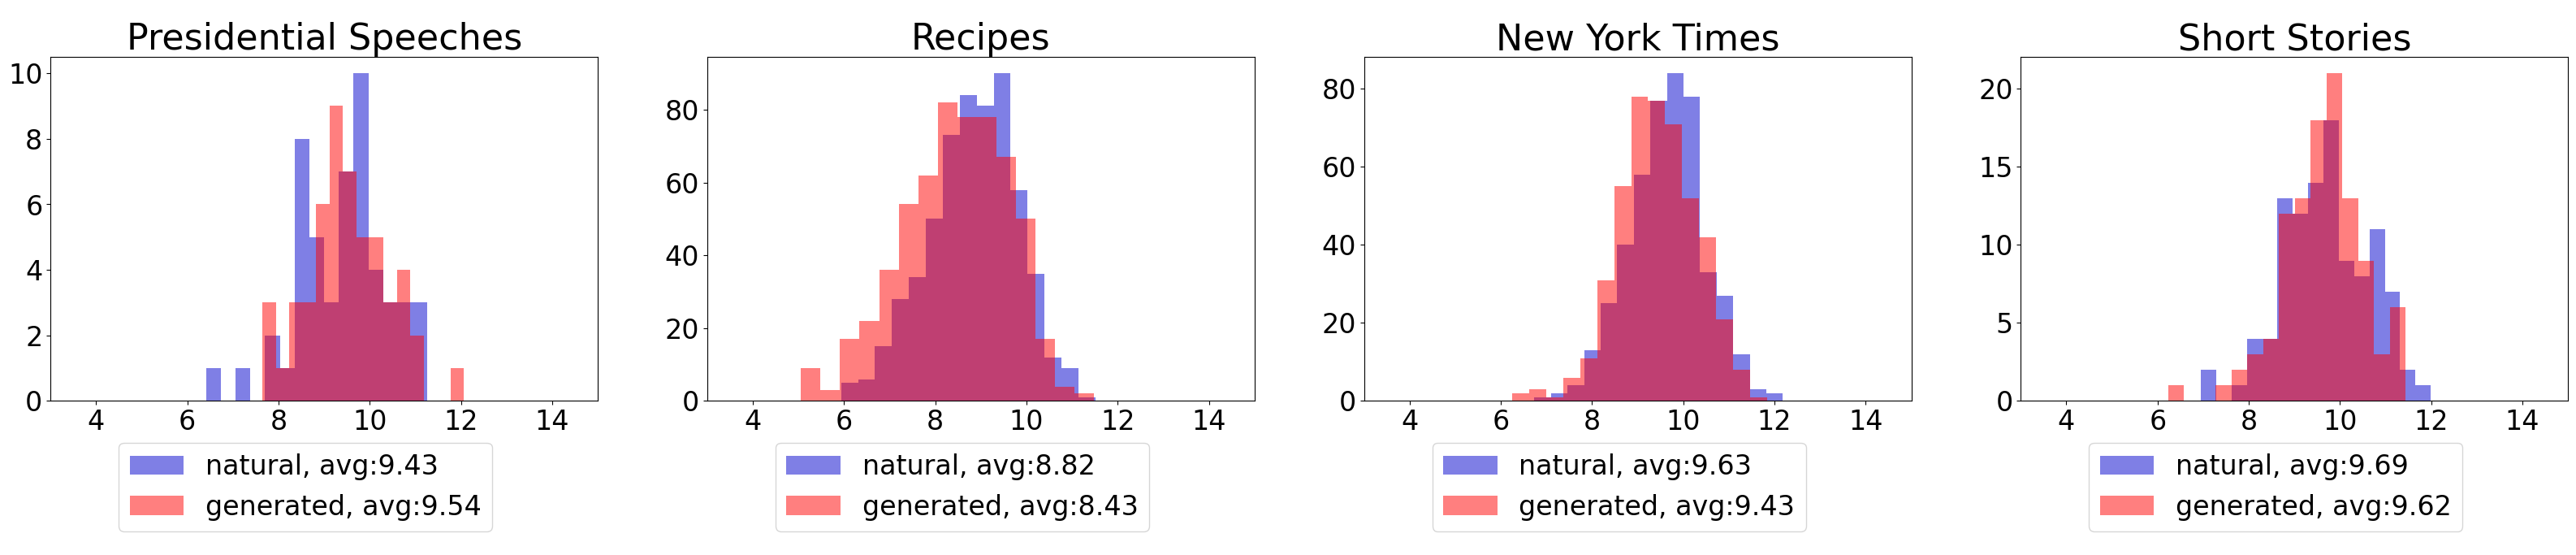
Since we have observed a statistical difference in sentence length distributions between human-written and generated texts (as illustrated in Fig. 4), we leverage sentence lengths as a simple baseline feature. This baseline allows us to gauge the effectiveness of a classifier in identifying boundaries without semantic understanding.
3.2 Perplexity Regression
We use a gradient boosting regressor trained on sentence-wise perplexity features to predict boundary values; note that this regression-based formulation takes advantage of the task’s sequential nature and aims to minimize label discrepancies rather than necessarily predict the exact first artificial sentence.
3.3 Topological Time Series
Inspired by a recent work by Tulchinskii et al. (2023), we explore the potential of topological features based on intrinsic dimensionality (ID); we provide an introduction to topological data analysis (TDA), including the definitions of the features we have used, in Appendix A. Although a direct application is challenging, we hypothesize that geometric variations in token sequences can help identify machine-generated text. To explore these variations, we introduce models that process TDA-based features treating them as time series.
Multilabel time series classification over intrinsic dimensionality.
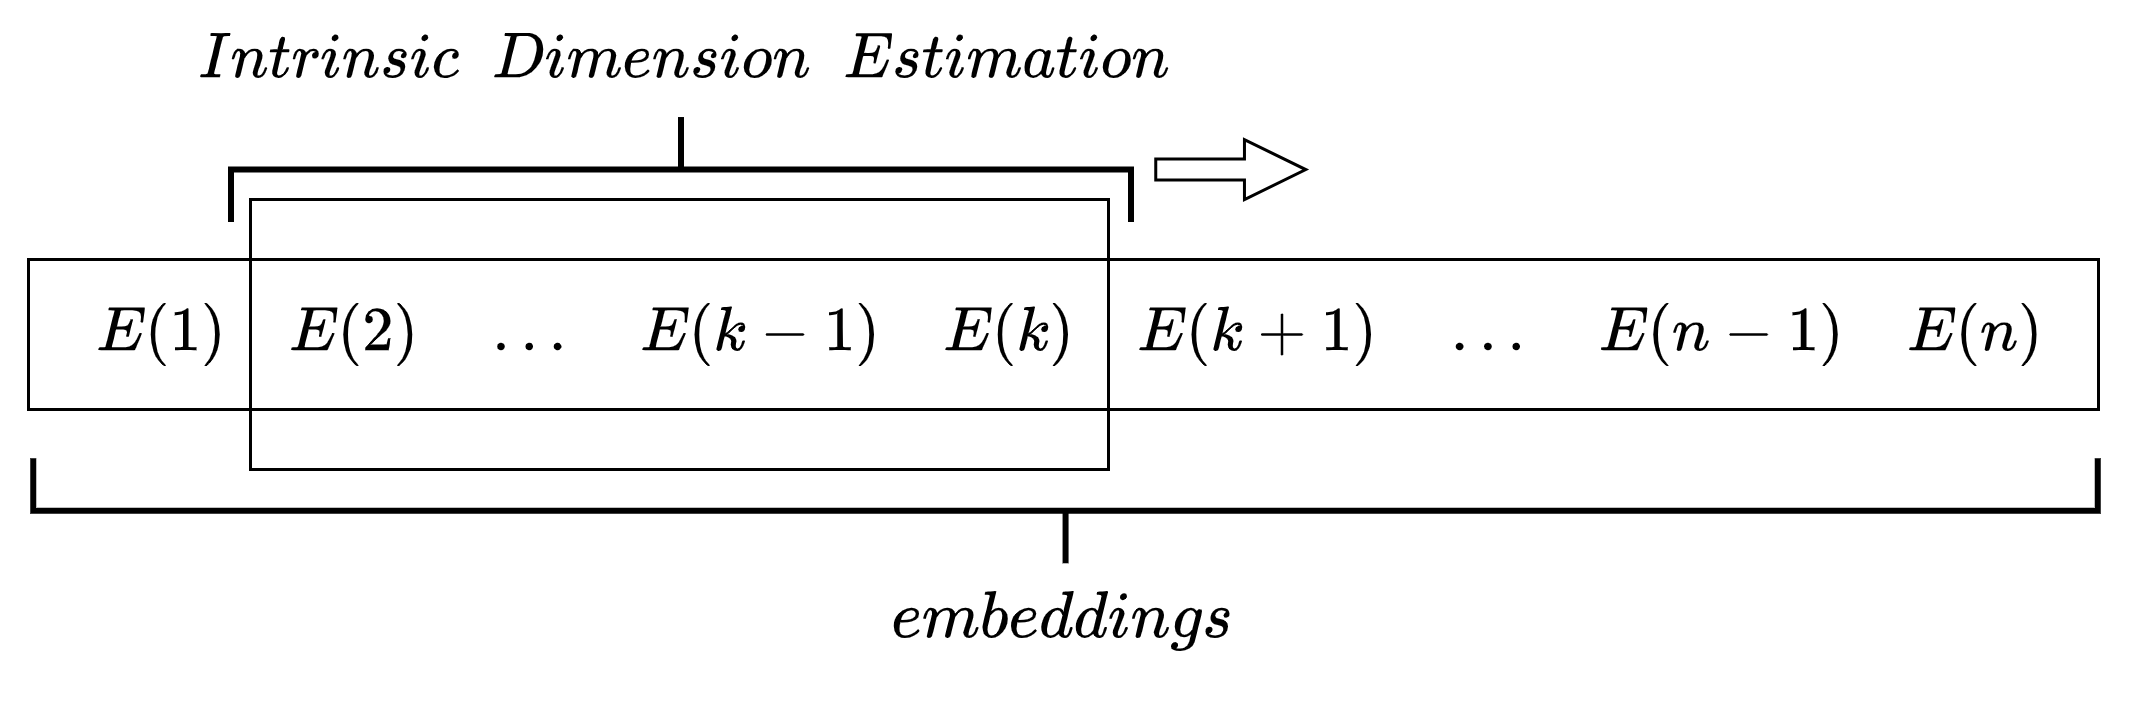
We consider boundary detection as a time series classification problem. For every text, we slide a window of tokens (step size ) over the RoBERTa token embeddings and calculate the intrinsic dimension (PHD) of the points within the window (Schweinhart, 2020). These time series are then classified using a support vector classifier equipped with the global alignment kernel (GAK) function (Cuturi, 2011).
Boundary detection via binary classification.
Another approach involves revisiting the standard task of artificial text detection. Specifically, we train a binary classifier to distinguish between fake and natural text atop a specific predictor. For the base predictor, we employ intrinsic dimensionality calculated over a sliding window of tokens. The TLE intrinsic dimension estimator was chosen due to its robust performance on small data samples (Amsaleg et al., 2019). For the base classifier, we use gradient boosting trees (Friedman, 2000, 2002).
To translate probabilities predicted with a binary classifier into a specific boundary that distinguishes natural text from fake text, we employ the following estimator: the final label is determined by maximizing , where the score function is defined as , and are predictions from the base binary classifier. In this context, we use a binary indicator set consisting of two consecutive chunks: a chunk of zeros followed by another chunk of ones. This emulates all possible ground truth label scenarios in our dataset.
4 RoFT experiments
4.1 Dataset preparation and analysis
In all our experiments, the task is to detect the exact boundary where a text passage that starts as human-written transits to machine generation.
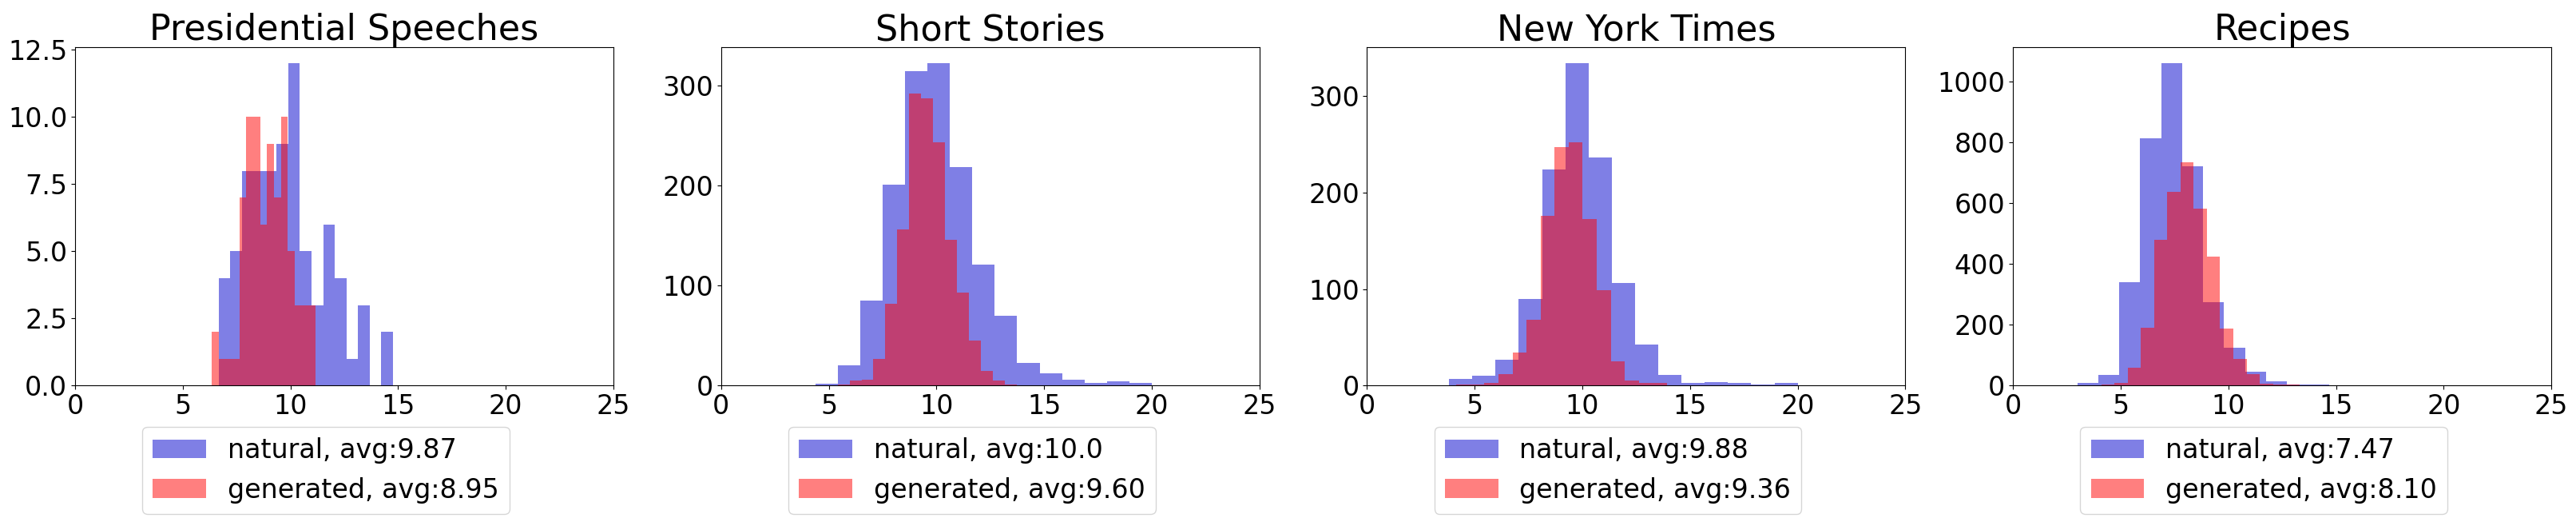
Apart from the original RoFT dataset (Dugan et al., 2020), we also created an additional version of the dataset which we call RoFT-chatgpt. In RoFT-chatgpt, we take the same human prompts from the original RoFT but generate all continuations with the gpt-3.5-turbo model instead of models used in the original RoFT; this dataset is supposed to be more challenging for artificial text boundary detection while preserving the basic statistical properties of the original such as the label distribution.
During preprocessing, we removed duplicates that were different only in human-predicted labels from both datasets; for RoFT-chatgpt, we also removed all samples containing “As an AI language model…” phrases and short samples that were clearly failed generations. As a result, we retained samples from the original RoFT and samples from RoFT-chatgpt.
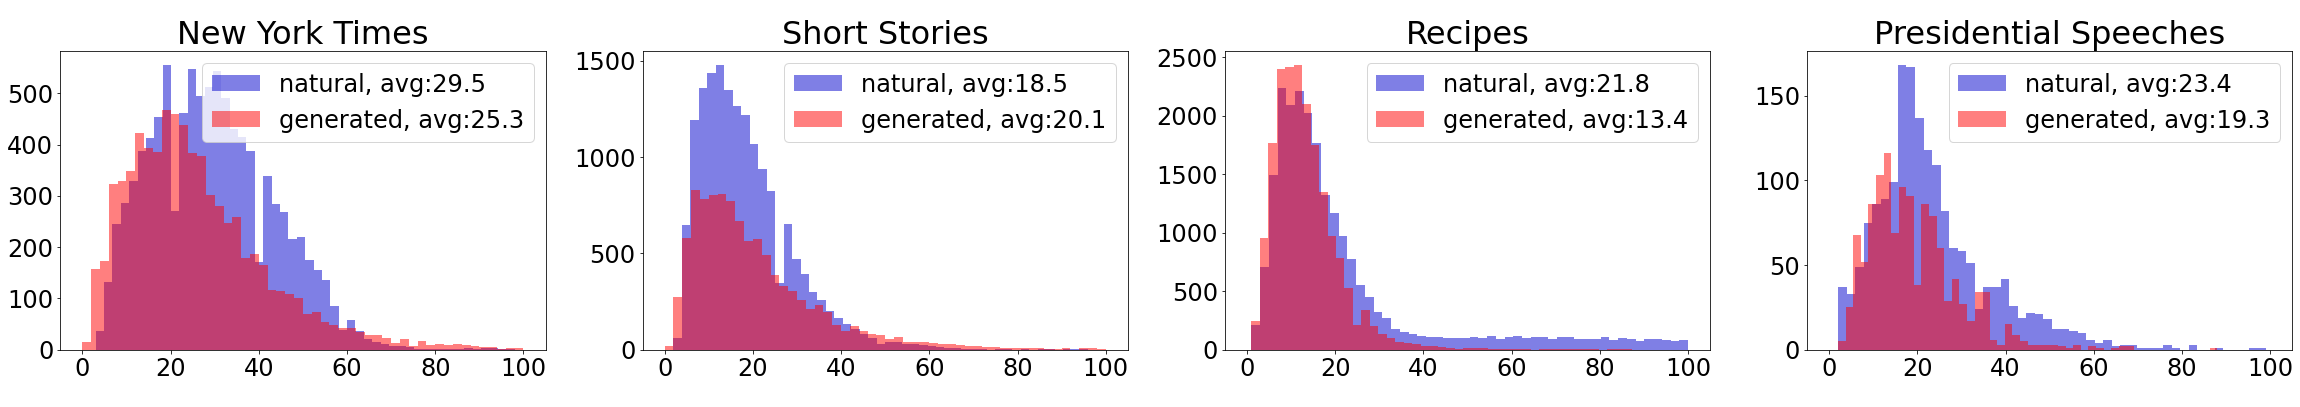
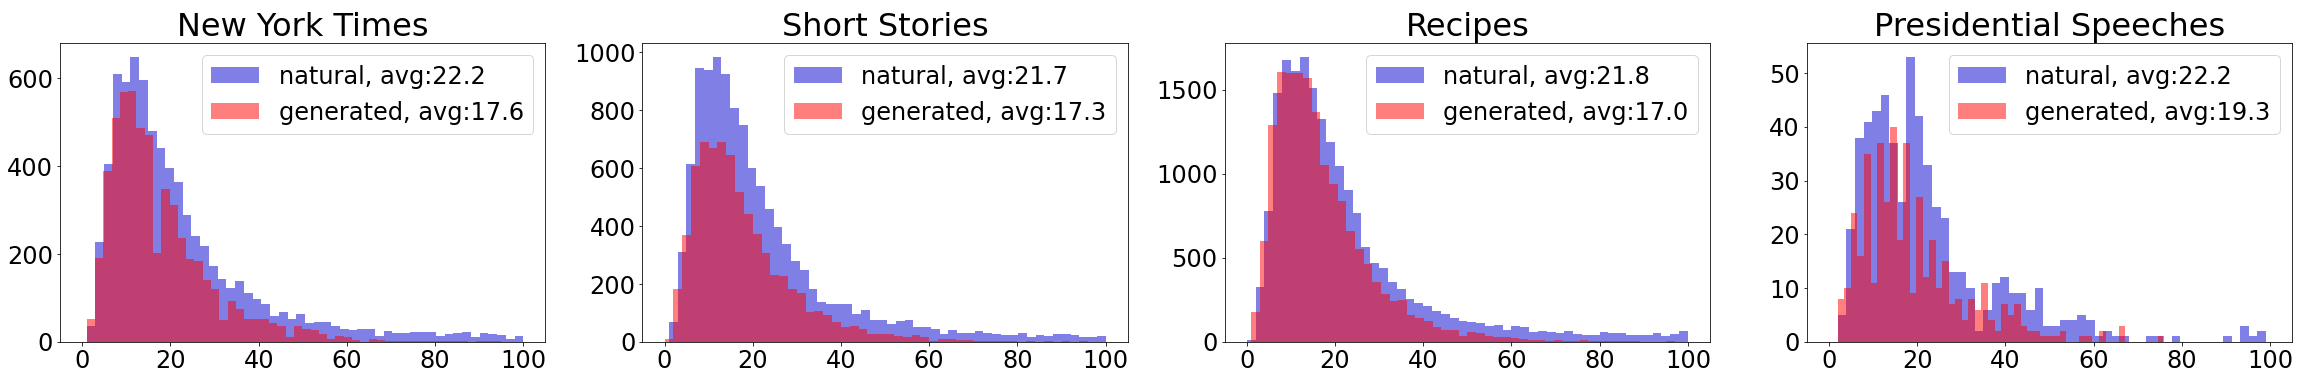
Preliminary statistical analysis of the datasets revealed that the distributions of sentence lengths in different subdomains vary significantly. These differences are shown in Figs. 4, 4, and 4 that show all lengths in tokens produced by the standard RoBERTa tokenizer (the figures have a cutoff of 100 for readability but the datasets do contain a few longer sentences). These differences will play a role in our discussion of the experimental results in Section 5.
4.2 Results
| Method | RoFT | RoFT-chatgpt | ||||
|---|---|---|---|---|---|---|
| Quality | Acc | SoftAcc1 | MSE | Acc | SoftAcc1 | MSE |
| RoBERTa + SEP | 49.64 % | 79.71 % | 02.63 | 54.61 % | 79.03 % | 03.06 |
| RoBERTa | 46.47 % | 74.86 % | 03.00 | 39.01 % | 75.18 % | 03.15 |
| Perplexity-based classifiers | ||||||
| Perplexity + GB | 24.25 % | 47.23 % | 11.68 | 34.94 % | 59.80 % | 07.46 |
| Perplexity + LogReg | 23.75 % | 42.15 % | 15.80 | 33.50 % | 57.56 % | 09.25 |
| DetectGPT + GB | 19.79 % | 37.40 % | 08.35 | 21.69 % | 43.52 % | 06.87 |
| DetectGPT + LogReg | 19.45 % | 33.82 % | 09.03 | 15.35 % | 41.43 % | 07.22 |
| Perplexity-based regression | 12.58 % | 36.67 % | 06.89 | 19.74 % | 54.03 % | 04.89 |
| Topological Time Series | ||||||
| PHD + TS Multi-label | 23.50 % | 46.32 % | 14.14 | 17.29 % | 35.81 % | 14.45 |
| TLE + TS Binary | 12.58 % | 30.41 % | 22.23 | 20.02 % | 34.58 % | 18.52 |
| Length + GB | 14.64 % | 33.43 % | 16.55 | 25.72 % | 46.18 % | 18.99 |
| Majority class | 15.26 % | 25.43 % | 27.58 | 13.83 % | 24.42 % | 26.46 |
| SRoBERTa (Cutler et al., 2021) | 42 % | – | – | – | ||
| Human Baseline | 22.62 % | 40.31 % | 13.88 | – | ||
Table 1 presents the main results of our experiments on artificial text boundary detection on RoFT and RoFT-chatgpt datasets.
The simplest baseline in Table 1 is the majority class prediction. In both datasets, the majority class is the last th class, consisting of fully human-written texts. On the original RoFT dataset, we include two more baselines for comparison: the human baseline and the best result reported by Cutler et al. (2021); it was obtained by a classifier built upon concatenated SRoBERTa embeddings of each sentence.
Apart from accuracy (Acc), we report two other metrics reflecting the sequential nature of predicted labels: soft accuracy, calculated as the percentage of predictions that differ from the correct label by at most one (SoftAcc1), and mean squared error (MSE). The motivation for computing SoftAcc1 was our observation that a big part of misclassifications produced by the considered models tends to be on the neighboring class (see Figure 16 in Appendix E); a slight relaxation of the exact classification setting for finding the boundary position also seems to be acceptable in many real-world applications.
As for the results, we first of all note that on the original RoFT dataset, RoBERTa-based classifiers outperform others by a factor of almost 2x in terms of accuracy metrics and also significantly outperform the previously best reported SRoBERTa model (Cutler et al., 2021). This model also provides the lowest MSE () among all the methods. We note, however, that our RoBERTa classifier has significantly more trainable parameters than any other method in the table because no other approaches require language model fine-tuning.
Second, topological and perplexity features allow us to beat the human baseline. Perplexity-based classifiers are the best in terms of accuracy, while the perplexity regressor provides good MSE values. Note, however, that as we have discussed in Section 2.3, the problem humans were solving was more challenging and had a somewhat different objective.
Third, the RoBERTa model has difficulties with the exact classification of ChatGPT data: the accuracy drops by 6% compared to the original RoFT, while soft accuracy and MSE are roughly the same. Surprisingly, we observe the opposite situation for perplexity-based methods: on RoFT-chatgpt the results are significantly better than for data generated by older language models, by all metrics. The reason for this might be that we used a GPT-like model (i.e. GPT-2) for perplexity calculation, and the GPT-3.5-turbo model that we used to generate fake samples in RoFT-chatgpt belongs to the same family. However, it is interesting that we used a smaller model (GPT-2) to detect text generated by a larger model (GPT-3.5) and got second-best results among other approaches, despite Mitchell et al. (2023) reporting that smaller models are not capable of detecting text generated by bigger models.
Another interesting comparison between the datasets is that the accuracy of the baseline length-based classifier also improves significantly (by 1.8x) when transferring to RoFT-chatgpt. We hypothesize that this kind of a shallow feature emerges in ChatGPT generation and makes the task easier. We provide an analysis of some of such features in our data and discuss their influence on the quality of boundary detection in Section 5.
The other perplexity-based approach, DetectGPT, exhibits lower accuracy compared to the RoBERTa and perplexity-based classifiers on both RoFT and RoFT-chatgpt. Indeed, as Mitchell et al. (2023) have pointed out, this approach is used to detect whether the sample is generated by a specific base model, but we use several models in our setup. Moreover, the lengths of text samples could be too small for an efficient application of this approach. On the other hand, the DetectGPT classifier demonstrates quite good MSE, close to the regression approach that is designed to optimize this value directly. Nevertheless, we exclude this method from further experiments for the sake of the balance of quality and computational complexity.
4.3 Cross-domain generalization
| Pre- | Pres. Speeches | Recipes | New York Times | Short Stories | Avg | ||||||
| dictor | Model | Context | IN | OUT | IN | OUT | IN | OUT | IN | OUT | |
| Text | RoBERTa SEP | global | |||||||||
| Text | RoBERTa | global | |||||||||
| Perpl. | GB | sentence | |||||||||
| Perpl. | LogRegr | sentence | -17% | ||||||||
| Perpl. | Regr. (GB) | sentence | -10% | ||||||||
| PHD | TS multilabel | 100 tokens | -16% | ||||||||
| TLE | TS Binary | 20 tokens | -31% | ||||||||
| Length | GB | sentence | -44% | ||||||||
| Length | LogRegr | sentence | -47% | ||||||||
| Majority | — | — | |||||||||
| Approximated human | global | ||||||||||
In artificial text detection, supervised methods with fine-tuning such as RoBERTa are more sensitive to spurious correlations in a dataset and often demonstrate poor cross-domain transfer ability, especially in comparison to topology-based approaches (Tulchinskii et al., 2023). Table 2 reports the results of cross-domain transfer for our methods on the RoFT-chatgpt dataset between four text topics presented in the data. We report in-domain and out-of-domain accuracy: the IN column shows results from domains seen during training, while the OUT column reflects the model’s ability to detect artificial texts in the unseen domain corresponding to this column. MSE scores are additionally reported in Table 3 in Appendix B. For each model, training was done on three out of the four domains, and the resulting model was tested on the fourth, unseen domain; we used of these subsets, mixed together, as the training set, as the validation set, and as the test set for in-domain evaluation.
First, we can see that RoBERTa performance drops for all subsets with a very significant relative change from to . The perplexity-based classifier demonstrates excellent cross-domain generalization for two subsets: Presidential Speeches and Short Stories. For the Recipes domain, the most stable results are provided by topological time series classifiers. For the New York Times subset, we observe a significant generalization gap for all classifiers. These results mean that each type of classifier can handle its own set of spurious features well, and no classifier is universally better than the others. We hypothesize that the aggregation of different features together can improve the results and leave this for future research.
Another observation is related to the absolute values of classification accuracy. Surprisingly, on two subsets out of four the perplexity-based classifier outperforms a fully fine-tuned RoBERTa. Moreover, for the Recipes subset the multilabel topological time series method is the best. Note that this happens because TDA-based methods are extremely stable under the domain shift on this dataset split despite being significantly worse than others in absolute values. We also note significant differences in the format of sentences in the Recipes domain compared to others (see Section 5 below).
In general, we can conclude that perplexity-based classifiers and RoBERTa perform roughly equally on average in the out-of-domain setting. This is a remarkable property, taking into account the training budget of these classifiers: the former is a simple classifier trained on ten features extracted by a language model with frozen weights, while the latter involves full LM fine-tuning.
Our final observation in this setting is related to the length-based baseline. For in-domain data, average sentence length provides a strong signal, leading to accuracy between 20% to 32% depending on the data split and even outperforming topological methods. But cross-domain generalization fails, which means that we should prefer the classifiers that ignore this feature in order to achieve good generalization (see more details in Section 5).
4.4 Cross-model generalization
The original RoFT dataset contains data generated by different models. Appendix C shows detailed experimental results for cross-generator generalization (Tables 4 and 5). We tune our classifiers on generation results produced by one model and test the performance for all other models. In general, this task is harder for all considered classifiers: there are models for which prediction accuracy drops down to virtually zero values. But we observe an interesting result for the perplexity-based classifier: it achieves good generalization when transferring to very large models such as GPT3-davinci and GPT2-XL, while for other models the generalization is poor. We provide possible explanations of such results in the next section.
5 Discussion and analysis of the results
In this section, we present some interesting conclusions that we have arrived at when analyzing data generated by different models as well as the performance of our artificial text detectors.
First, the length of sentences seems to play an important role in detection, deceiving our classifiers. We connect it with a significant difference between distributions of sentence lengths written by humans and generated by large language models (see Figures 4, 4, and 4). This observation is supported by our experiments with the length-based classifier (Section 3), which outperforms several other methods in terms of accuracy (Table 1).
As for the data itself, we note that some interesting peculiarities in the texts from the Recipes topic. First, it often contains the index of the current step in a recipe (such as “1.”, “2.” etc.) as a distinct sentence, which could easily be picked up as a domain feature. Second, the first sentence of these texts tends to be very long compared to all the rest ones. We suppose that this may have made our classifiers perform worse on this particular topic after training on other topics that do not have these anomalous properties.
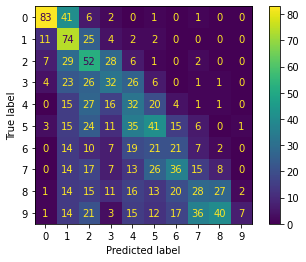
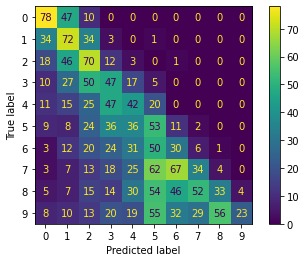
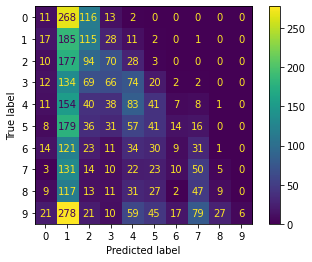
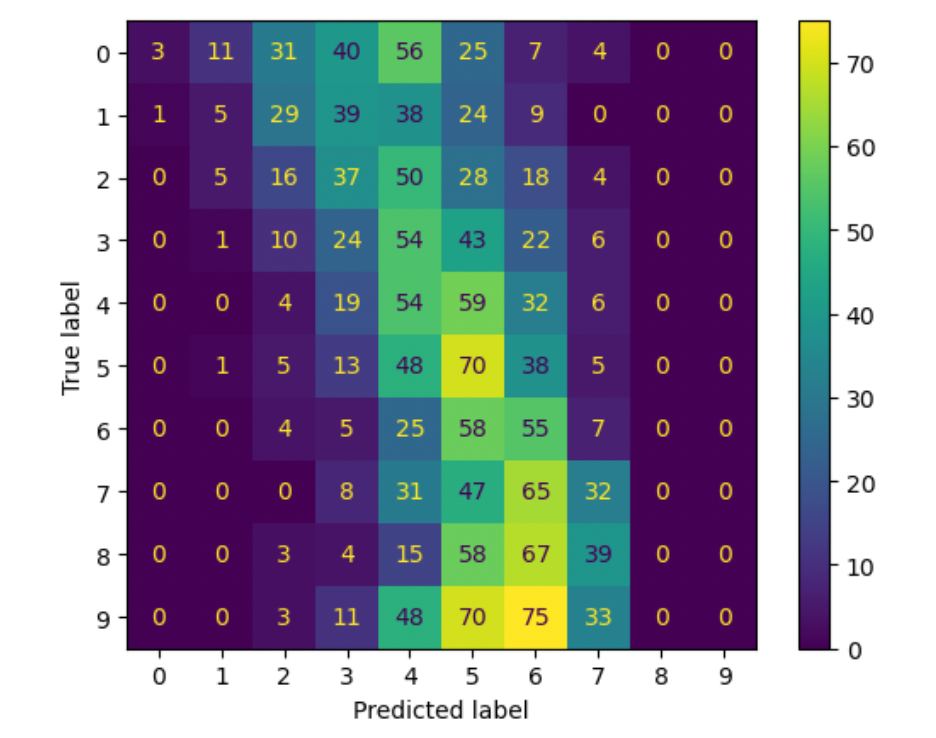
The RoBERTa classifier has the largest quality drop on Recipes when Recipes is used as an out-of-domain part, so we investigated its confusion matrices, shown in Figure 5. One can clearly see the anomaly in its confusion matrix on the Recipes domain: RoBERTa tends to predict the label “1” most of the time, while on other domains its predictions are distributed much more evenly and adequately. The only approach able to handle cross-domain transfer to this subset is topological time series; we suggest that unlike other methods it is able to ignore sentence length variations.
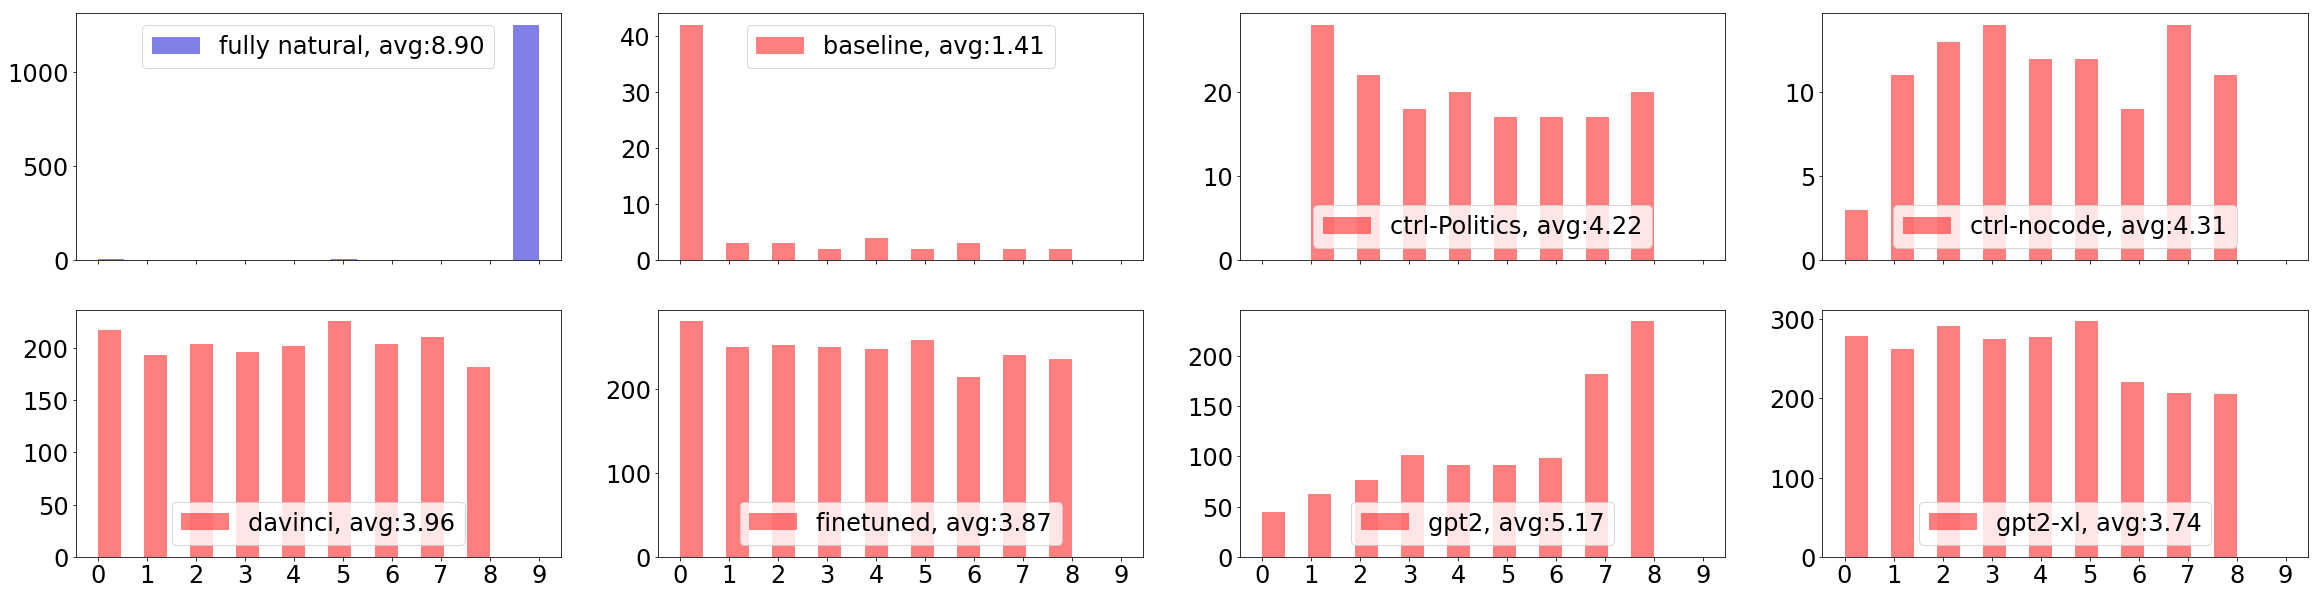
Next, we have visualized the distributions of labels in the original RoFT dataset across different topics (Figure 9) and models (Figure 8). One can see that these distributions vary significantly across models. More specifically, we can look at the baseline and GPT-2 generators: distributions of their labels seem to be quite different from others; since the baseline generator does not utilize any AI model, we focus on the latter one. The behavior of our models in cross-model transfer to GPT-2, as detailed in Appendix C, suggests that the only model stable under the label distribution shift is perplexity-based regression. Although its accuracy numbers are low, it outperforms the human level in terms of MSE even in out-of-domain evaluation.
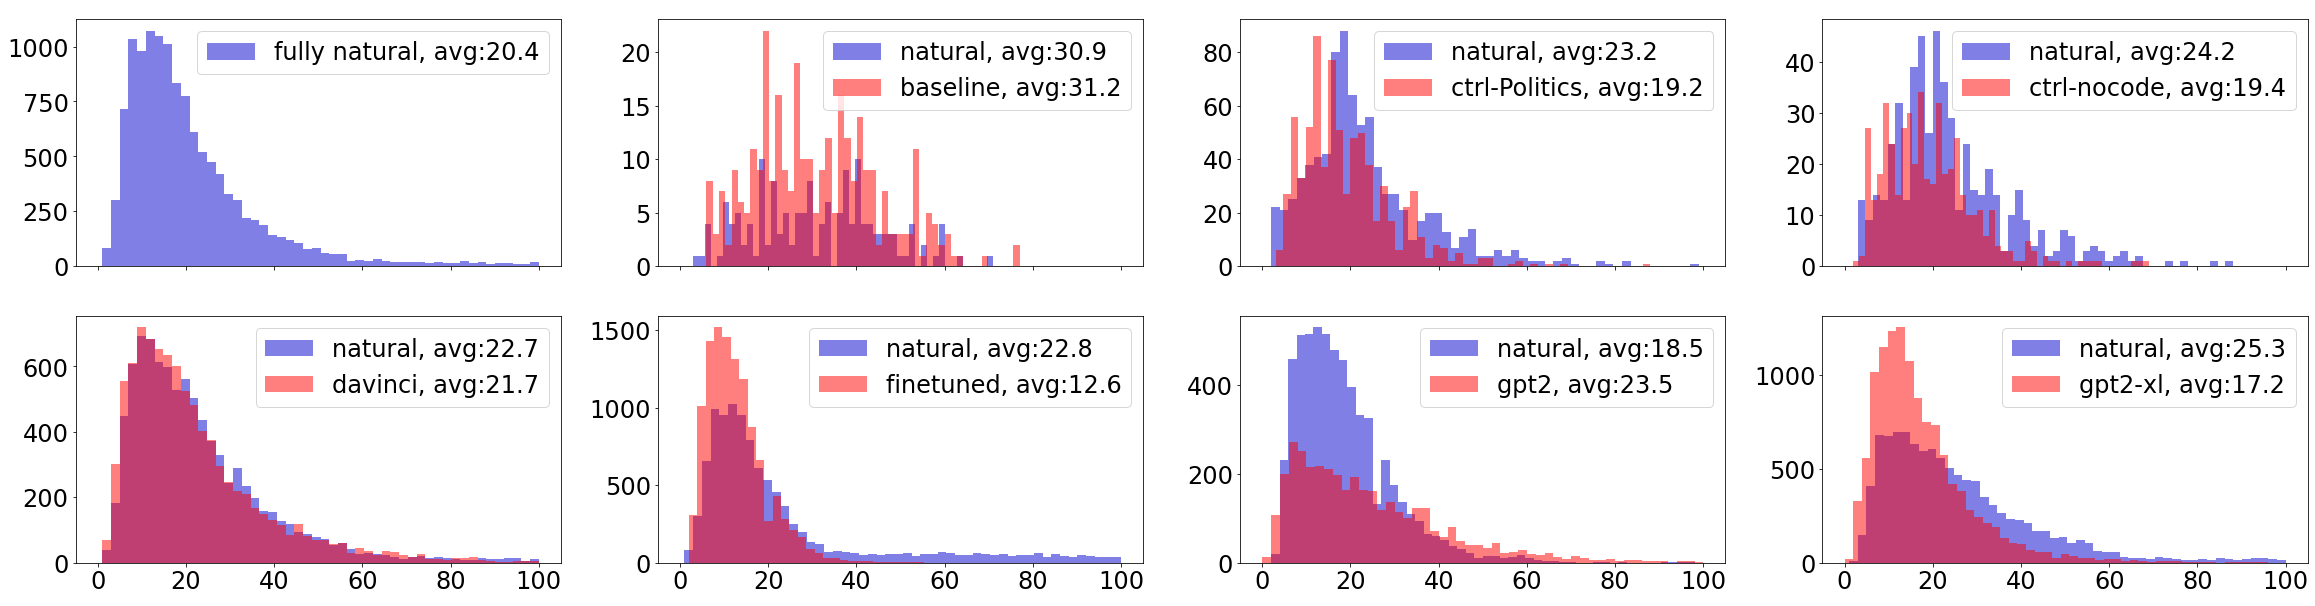
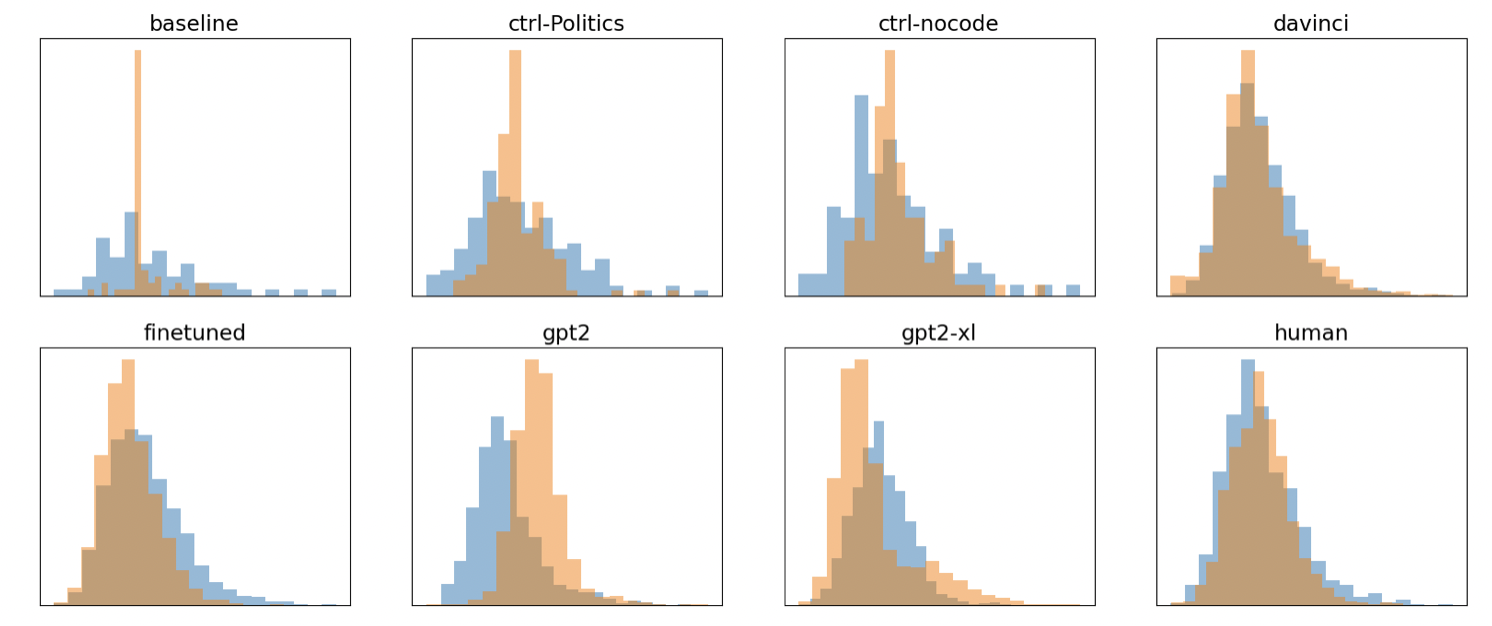
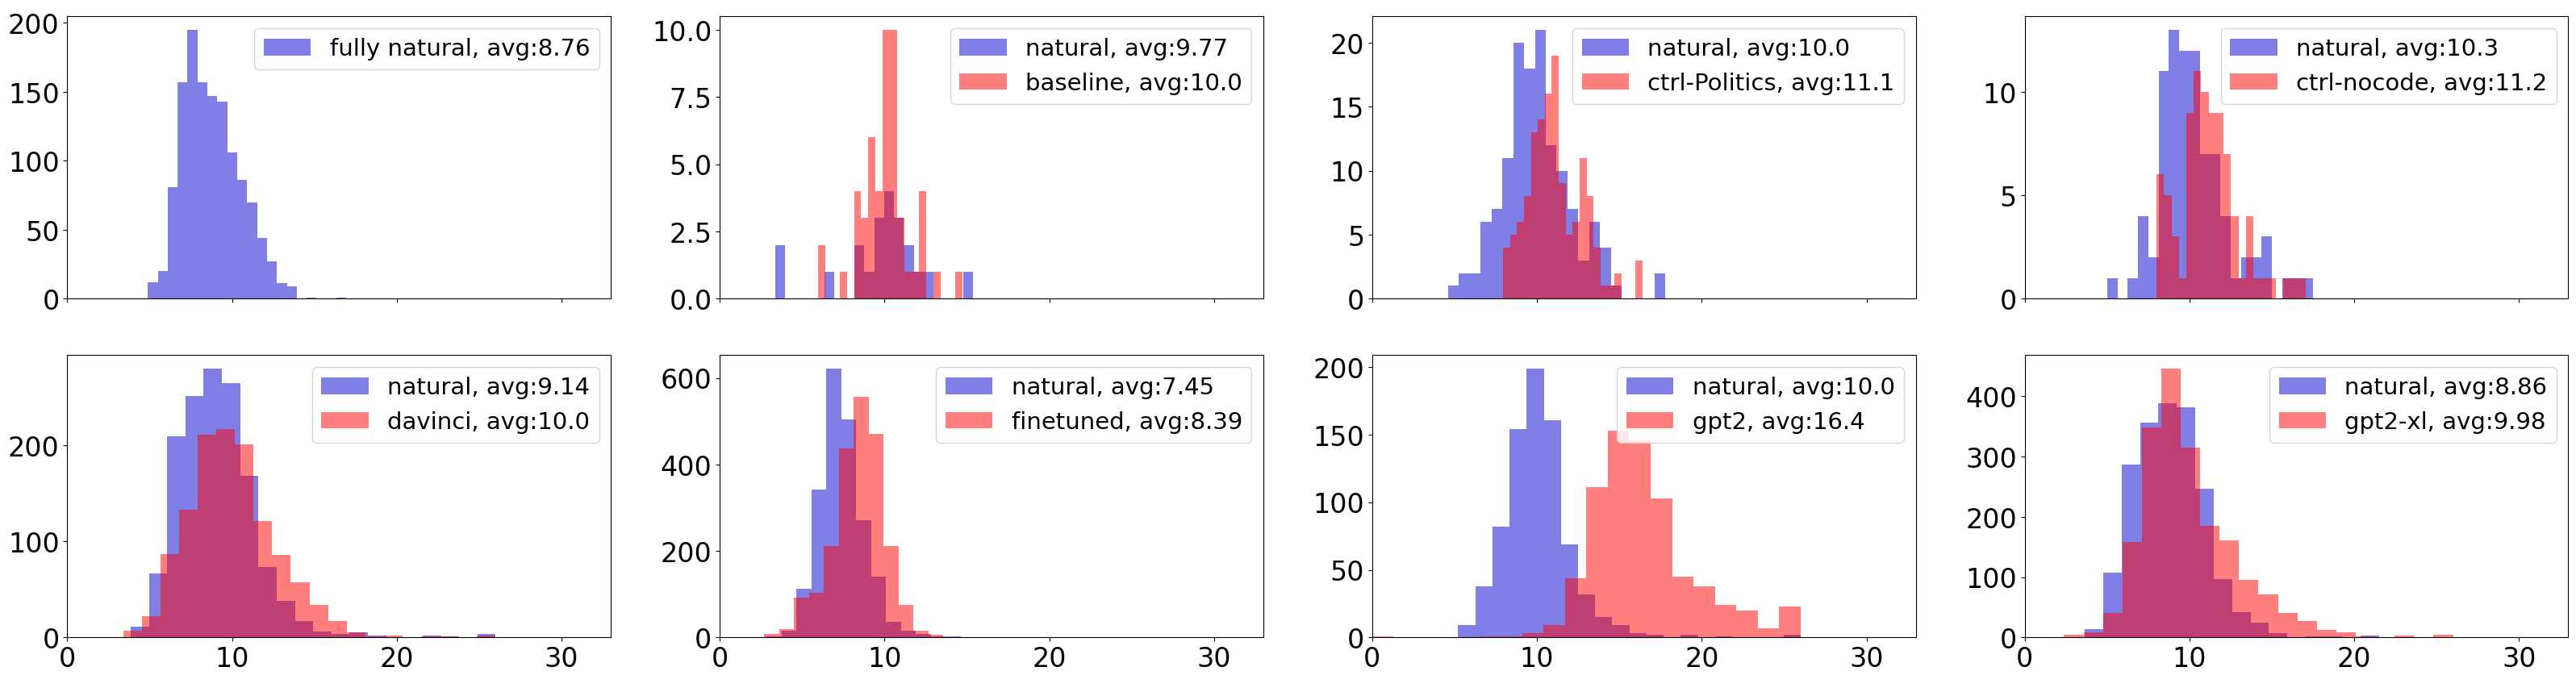
One more observation regards the distributions of values of sentence perplexities across different generators in the original RoFT. Recall that we compute the perplexity of each sentence in the text as the mean perplexity of its words, so each text in the dataset is represented as a vector of length . Figure 6 visualizes the distributions of perplexities of the last, 10th sentence in the texts. We can see that such distributions for data generated by baseline or GPT-2 are different from the distributions of data generated by other models. This might also be a reason for the poor performance of classifiers based on decision trees or linear models in cases when these generators are excluded from the training set. Decision trees base their rules present in each node on the distribution of distinct features, so significant discrepancies between the distributions of features across domains may lead to poor cross-domain transfer for the entire classifier. As an illustration, note that perplexity-based logistic regression and gradient boosting classifiers constructed over exactly the same set of features demonstrate the opposite behavior in GPT2-XL subset transfer: the former fails to generalize, while the latter demonstrates an improvement in the quality metrics (see Appendix C).
Furthermore, distributions of sentence perplexities in texts generated by different generators can vary highly depending on the quality of the generator. We believe that some kind of normalization and/or better choice of a model is needed to mitigate this.
Finally, we note that an empirical study of the geometric properties of the embeddings for both original RoFT and RoFT-chatgpt datasets shows the difference between PHD distributions of real and fake RoFT text for different models (Figure 10) and topics (Figures 11 and 12). We can also see the difference in TLE dimension distributions for sentences corresponding to human-written and AI-generated parts of the texts (Figures 13, 14, and 15).
6 Conclusion
In this work, we address the task of boundary detection between human-written and generated parts in texts that combine both. We believe that this setting is increasingly important in real-world applications and is a natural setting for recognizing artificial text since it is often mixed with and especially prompted by human text. We have considered the RoFT dataset, presented its modification RoFT-chatgpt generated with a more modern large language model, and investigated the performance of features that proved to be useful for artificial text detection in previous works. In particular, we have shown that LM fine-tuning works reasonably well for this task but tends to overfit to spurious features in the data, which leads to generalization failures in some settings. On the other hand, perplexity-based and topological features provide a signal that can help in these situations. We have demonstrated that perplexity features are the best overall on balance between accuracy, generalization, and training complexity, and proposed new algorithms for boundary detection. Finally, our analysis has uncovered gaps in the current approaches and discovered difficult aspects of the task, which we plan to address in future research.
References
- Adams et al. (2020) Henry Adams, Manuchehr Aminian, Elin Farnell, Michael Kirby, Joshua Mirth, Rachel Neville, Chris Peterson, and Clayton Shonkwiler. 2020. A fractal dimension for measures via persistent homology. In Topological Data Analysis: The Abel Symposium 2018, pages 1–31. Springer.
- Amsaleg et al. (2019) Laurent Amsaleg, Oussama Chelly, Michael E Houle, Ken-Ichi Kawarabayashi, Miloš Radovanović, and Weeris Treeratanajaru. 2019. Intrinsic Dimensionality Estimation within Tight Localities. In 2019 SIAM International conference on Data Mining, pages 181–189, Calgary (Alberta), Canada. Society for Industrial and Applied Mathematics.
- Barannikov (1994) Serguei Barannikov. 1994. The framed morse complex and its invariants. Advances in Soviet Mathematics, 21:93–116.
- Birdal et al. (2021) Tolga Birdal, Aaron Lou, Leonidas J Guibas, and Umut Simsekli. 2021. Intrinsic dimension, persistent homology and generalization in neural networks. Advances in Neural Information Processing Systems, 34:6776–6789.
- Brown et al. (2020) Tom Brown, Benjamin Mann, Nick Ryder, Melanie Subbiah, Jared D Kaplan, Prafulla Dhariwal, Arvind Neelakantan, Pranav Shyam, Girish Sastry, Amanda Askell, Sandhini Agarwal, Ariel Herbert-Voss, Gretchen Krueger, Tom Henighan, Rewon Child, Aditya Ramesh, Daniel Ziegler, Jeffrey Wu, Clemens Winter, Chris Hesse, Mark Chen, Eric Sigler, Mateusz Litwin, Scott Gray, Benjamin Chess, Jack Clark, Christopher Berner, Sam McCandlish, Alec Radford, Ilya Sutskever, and Dario Amodei. 2020. Language models are few-shot learners. In Advances in Neural Information Processing Systems, volume 33, pages 1877–1901. Curran Associates, Inc.
- Carlsson (2020) Gunnar Carlsson. 2020. Persistent homology and applied homotopy theory. In Handbook of Homotopy Theory, pages 297–329. Chapman and Hall/CRC.
- Clark et al. (2021) Elizabeth Clark, Tal August, Sofia Serrano, Nikita Haduong, Suchin Gururangan, and Noah A. Smith. 2021. All that’s ‘human’ is not gold: Evaluating human evaluation of generated text. In Proceedings of the 59th Annual Meeting of the Association for Computational Linguistics and the 11th International Joint Conference on Natural Language Processing (Volume 1: Long Papers), pages 7282–7296, Online. Association for Computational Linguistics.
- Clark et al. (2020) Kevin Clark, Minh-Thang Luong, Quoc V. Le, and Christopher D. Manning. 2020. Electra: Pre-training text encoders as discriminators rather than generators. In International Conference on Learning Representations.
- Cutler et al. (2021) Joseph Cutler, Liam Dugan, Shreya Havaldar, and Adam Stein. 2021. Automatic detection of hybrid human-machine text boundaries.
- Cuturi (2011) Marco Cuturi. 2011. Fast global alignment kernels. In Proceedings of the 28th international conference on machine learning (ICML-11), pages 929–936.
- Devlin et al. (2019) Jacob Devlin, Ming-Wei Chang, Kenton Lee, and Kristina Toutanova. 2019. BERT: Pre-training of deep bidirectional transformers for language understanding. In Proceedings of the 2019 Conference of the North American Chapter of the Association for Computational Linguistics: Human Language Technologies, Volume 1 (Long and Short Papers), pages 4171–4186, Minneapolis, Minnesota. Association for Computational Linguistics.
- Dugan et al. (2020) Liam Dugan, Daphne Ippolito, Arun Kirubarajan, and Chris Callison-Burch. 2020. RoFT: A tool for evaluating human detection of machine-generated text. In Proceedings of the 2020 Conference on Empirical Methods in Natural Language Processing: System Demonstrations, pages 189–196, Online. Association for Computational Linguistics.
- Elyasi and Moghadam (2019) Naiereh Elyasi and Mehdi Hosseini Moghadam. 2019. An introduction to a new text classification and visualization for natural language processing using topological data analysis.
- Friedman (2000) Jerome H. Friedman. 2000. Greedy function approximation: A gradient boosting machine. Annals of Statistics, 29:1189–1232.
- Friedman (2001) Jerome H. Friedman. 2001. Greedy function approximation: A gradient boosting machine. The Annals of Statistics, 29(5):1189–1232.
- Friedman (2002) Jerome H. Friedman. 2002. Stochastic gradient boosting. Computational Statistics & Data Analysis, 38(4):367–378. Nonlinear Methods and Data Mining.
- F.R.S. (1901) Karl Pearson F.R.S. 1901. Liii. on lines and planes of closest fit to systems of points in space. The London, Edinburgh, and Dublin Philosophical Magazine and Journal of Science, 2(11):559–572.
- Iyer and Vosoughi (2020) Aarish Iyer and Soroush Vosoughi. 2020. Style change detection using bert. In Conference and Labs of the Evaluation Forum.
- Jiang et al. (2022) Xinyin Jiang, Haoliang Qi, Zhijie Zhang, and Mingjie Huang. 2022. Style change detection: Method based on pre-trained model and similarity recognition. In Conference and Labs of the Evaluation Forum.
- Keskar et al. (2019) Nitish Shirish Keskar, Bryan McCann, Lav Varshney, Caiming Xiong, and Richard Socher. 2019. CTRL - A Conditional Transformer Language Model for Controllable Generation. arXiv preprint arXiv:1909.05858.
- Kushnareva et al. (2021) Laida Kushnareva, Daniil Cherniavskii, Vladislav Mikhailov, Ekaterina Artemova, Serguei Barannikov, Alexander Bernstein, Irina Piontkovskaya, Dmitri Piontkovski, and Evgeny Burnaev. 2021. Artificial text detection via examining the topology of attention maps. In Proceedings of the 2021 Conference on Empirical Methods in Natural Language Processing, pages 635–649, Online and Punta Cana, Dominican Republic. Association for Computational Linguistics.
- Lan et al. (2020) Zhenzhong Lan, Mingda Chen, Sebastian Goodman, Kevin Gimpel, Piyush Sharma, and Radu Soricut. 2020. ALBERT: A lite BERT for self-supervised learning of language representations. In 8th International Conference on Learning Representations, ICLR 2020, Addis Ababa, Ethiopia, April 26-30, 2020. OpenReview.net.
- Lao et al. (2022) Qidi Lao, Li Ma, Wenyin Yang, Zexian Yang, Dong Yuan, Zhenlin Tan, and Langzhang Liang. 2022. Style change detection based on bert and conv1d. In Proceedings of the Working Notes of CLEF 2022 - Conference and Labs of the Evaluation Forum, Bologna, Italy, September 5th - to - 8th, 2022, volume 3180 of CEUR Workshop Proceedings, pages 2554–2559. CEUR-WS.org.
- Lin et al. (2022) Tzu-Mi Lin, Chao-Yi Chen, Yu-Wen Tzeng, and Lung-Hao Lee. 2022. Ensemble pre-trained transformer models for writing style change detection. In Proceedings of the Working Notes of CLEF 2022 - Conference and Labs of the Evaluation Forum, Bologna, Italy, September 5th - to - 8th, 2022, volume 3180 of CEUR Workshop Proceedings, pages 2565–2573. CEUR-WS.org.
- Liu et al. (2019) Yinhan Liu, Myle Ott, Naman Goyal, Jingfei Du, Mandar Joshi, Danqi Chen, Omer Levy, Mike Lewis, Luke Zettlemoyer, and Veselin Stoyanov. 2019. Roberta: A robustly optimized bert pretraining approach. Cite arxiv:1907.11692.
- Magai (2023) German Magai. 2023. Deep neural networks architectures from the perspective of manifold learning. arXiv preprint arXiv:2306.03406.
- Mitchell et al. (2023) Eric Mitchell, Yoonho Lee, Alexander Khazatsky, Christopher D. Manning, and Chelsea Finn. 2023. Detectgpt: Zero-shot machine-generated text detection using probability curvature.
- Narayanan and Mitter (2010) Hariharan Narayanan and Sanjoy K. Mitter. 2010. Sample complexity of testing the manifold hypothesis. In NIPS.
- Radford et al. (2019) Alec Radford, Jeffrey Wu, Rewon Child, David Luan, Dario Amodei, Ilya Sutskever, et al. 2019. Language models are unsupervised multitask learners. OpenAI blog, 1(8):9.
- Raffel et al. (2020) Colin Raffel, Noam Shazeer, Adam Roberts, Katherine Lee, Sharan Narang, Michael Matena, Yanqi Zhou, Wei Li, and Peter J. Liu. 2020. Exploring the limits of transfer learning with a unified text-to-text transformer. Journal of Machine Learning Research, 21(140):1–67.
- Reimers and Gurevych (2019) Nils Reimers and Iryna Gurevych. 2019. Sentence-BERT: Sentence embeddings using Siamese BERT-networks. In Proceedings of the 2019 Conference on Empirical Methods in Natural Language Processing and the 9th International Joint Conference on Natural Language Processing (EMNLP-IJCNLP), pages 3982–3992, Hong Kong, China. Association for Computational Linguistics.
- Schweinhart (2020) Benjamin Schweinhart. 2020. Fractal dimension and the persistent homology of random geometric complexes. Advances in Mathematics, 372:107291.
- Skraba et al. (2017) Primoz Skraba, Gugan Thoppe, and D Yogeshwaran. 2017. Randomly weighted complexes: Minimal spanning acycles and persistence diagrams. arXiv preprint arXiv:1701.00239.
- Solaiman et al. (2019) Irene Solaiman, Miles Brundage, Jack Clark, Amanda Askell, Ariel Herbert-Voss, Jeff Wu, Alec Radford, Gretchen Krueger, Jong Wook Kim, Sarah Kreps, et al. 2019. Release strategies and the social impacts of language models. arXiv preprint arXiv:1908.09203.
- Steele (1988) J Michael Steele. 1988. Growth rates of euclidean minimal spanning trees with power weighted edges. The Annals of Probability, 16(4):1767–1787.
- (36) M. Eduard Tudoreanu. Exploring the use of topological data analysis to automatically detect data quality faults. Frontiers in Big Data, 5.
- Tulchinskii et al. (2023) Eduard Tulchinskii, Kristian Kuznetsov, Laida Kushnareva, Daniil Cherniavskii, Serguei Barannikov, Irina Piontkovskaya, Sergey Nikolenko, and Evgeny Burnaev. 2023. Intrinsic dimension estimation for robust detection of ai-generated texts.
- Uchendu et al. (2023) Adaku Uchendu, Thai Le, and Dongwon Lee. 2023. Attribution and obfuscation of neural text authorship: A data mining perspective. ACM SIGKDD Explorations Newsletter, 25(1):1–18.
- Zangerle et al. (2021) Eva Zangerle, Maximilian Mayerl, Martin Potthast, and Benno Stein. 2021. Overview of the style change detection task at pan 2021. In Conference and Labs of the Evaluation Forum.
Appendix A Intrinsic Dimension Estimation Methods
According to the manifold hypothesis (Narayanan and Mitter, 2010), the data lies on a low-dimensional submanifold: , where is the extrinsic dimension and is the intrinsic dimension (ID). The geometric and topological properties of the manifold are of particular interest. There are various methods for estimating the ID that can be divided into global and local methods.
For the tight local intrinsic dimension estimator (TLE) proposed by Amsaleg et al. (2019), we use the neighborhood center point , a set of neighborhood samples and a specially defined distance between points in a sufficiently small neighborhood of :
| (1) |
where is the radius of the neighbourhood. For every three points , , we can compute
If , then the intrinsic dimension can be found by averaging the estimates for all points , as defined by the following formula:
| (2) |
Applied algebraic topology provides effective tools for analyzing the topological structure of data. The theoretical foundations of topological data analysis (TDA) have been described in detail by, e.g., Barannikov (1994) and Carlsson (2020). TDA allows us to consider a dataset from the topological point of view. In order to move from point clouds to topological spaces, it is necessary to approximate the data by a simplicial complex . In our research, we use the Vietoris-Rips complex . The method of constructing the complex is as follows: simplexes are formed by subsets of points from X whose pairwise distances do not exceed (a scaling parameter). An increasing sequence of simplicial complexes is called a filtration: .
Homology groups are a topological invariant that expresses the properties of a topological space . We use , which is known as the th Betti number, a topological feature equal to the dimension of the homology group; for the Betti number corresponds to the number of connectivity components, cycles, and cavities respectively.
Topological features appear and disappear at different values of , which leads to the next core concept in TDA: the barcode. It summarises the dynamics of topological features in the filtration process. A bar is the lifetime of the th homology feature . A long bar in the barcode means that the data contains a fairly persistent and informative topological feature.
Schweinhart (2020) introduced the persistent homological fractal dimension (PHD) that generalized Steele (1988) for higher dimensions of the homology group and used the topological properties of the point cloud. The PHD has already been proven to be useful in the study of the properties of deep learning models (Birdal et al., 2021; Magai, 2023).
Let us denote the power-weighted sum of bars for the th degree of homology as follows:
| (3) |
It is interesting to note that is equal to the length of the Euclidean minimum spanning tree (MST) of (Skraba et al., 2017).
Then the persistent homological fractal dimension (PHD) can be defined as follows:
| (4) |
where
| (5) |
and are sampled independently from . That is, if scales as and (we take , ). Persistent homological fractal dimension can be estimated by analyzing the asymptotical behavior at of for every . In other words, to calculate PHD we must find a power law that shows how scales as increases. See Adams et al. (2020) and Schweinhart (2020) for more details.
Appendix B Cross-domain transfer
| Pre- | Pres. Speeches | Recipes | New York Times | Short Stories | Avg | ||||||
| dictor | Model | Context | IN | OUT | IN | OUT | IN | OUT | IN | OUT | |
| Text | RoBERTa SEP | global | 334% | ||||||||
| Text | RoBERTa | global | 211% | ||||||||
| Perpl. | GB | sentence | 40% | ||||||||
| Perpl. | LogReg | sentence | 64% | ||||||||
| Perpl. | Regr. (GB) | sentence | 39% | ||||||||
| PHD | TS multilabel | 100 tokens | 10% | ||||||||
| TLE | TS Binary | 20 tokens | 24% | ||||||||
| Length | GB | sentence | 26% | ||||||||
| Length | LogReg | sentence | 26% | ||||||||
| Majority | — | — | |||||||||
| Approximated human** | global | 13.88 | 13.88 | 13.88 | 13.88 | ||||||
Table 3 supplements Table 2 from the original text, reporting the results of cross-domain transfer for our methods on the RoFT-chatgpt dataset between four text topics presented in the data. We report in-domain and out-of-domain accuracy: the IN column shows results from domains seen during training, while the OUT column reflects the model’s ability to detect artificial texts in the unseen domain corresponding to this column. For each model, training was done on three out of the four domains, and the resulting model was tested on the fourth, unseen domain; we used of these subsets, mixed together, as the training set, as the validation set, and as the test set for in-domain evaluation.
Appendix C Cross-model transfer
| Model | Metric | GPT2-XL | GPT2 | davinci | |||
|---|---|---|---|---|---|---|---|
| ID | OOD | ID | OOD | ID | OOD | ||
| RoBERTa + SEP | Acc, % | 46.38 | 40.94 | 45.95 | 08.78 | 63.25 | 19.73 |
| RoBERTa + SEP | SoftAcc1, % | 76.85 | 76.83 | 76.71 | 31.22 | 85.52 | 47.27 |
| RoBERTa + SEP | MSE | 03.90 | 02.92 | 04.17 | 06.77 | 03.04 | 07.59 |
| RoBERTa | Acc, % | 46.68 | 32.56 | 40.30 | 06.94 | 57.20 | 14.48 |
| RoBERTa | SoftAcc1, % | 77.30 | 72.07 | 75.52 | 25.31 | 84.61 | 40.49 |
| RoBERTa | MSE | 03.73 | 03.10 | 03.70 | 07.18 | 02.94 | 08.56 |
| Perplexity + GB | Acc, % | 23.00 | 23.43 | 28.12 | 04.08 | 23.75 | 19.78 |
| Perplexity + GB | SoftAcc1, % | 40.35 | 47.90 | 47.96 | 30.61 | 46.03 | 42.46 |
| Perplexity + GB | MSE | 15.39 | 10.51 | 12.19 | 15.99 | 11.85 | 15.38 |
| Perplexity + LogRegr | Acc, % | 21.27 | 08.86 | 23.67 | 03.47 | 21.43 | 08.31 |
| Perplexity + LogRegr | SoftAcc1, % | 33.33 | 22.14 | 39.80 | 27.45 | 35.35 | 25.19 |
| Perplexity + LogRegr | MSE | 21.52 | 24.48 | 16.99 | 18.98 | 19.71 | 22.06 |
| Perplexity + Regr | Acc, % | 11.68 | 15.78 | 14.56 | 14.18 | 13.91 | 15.30 |
| Perplexity + Regr | SoftAcc1, % | 34.84 | 49.37 | 39.36 | 47.86 | 46.10 | 44.43 |
| Perplexity + Regr | MSE | 07.67 | 04.62 | 06.80 | 06.40 | 06.73 | 06.64 |
| PHD + TS multilabel | Acc, % | 31.84 | 04.02 | 25.64 | 04.49 | 31.38 | 02.05 |
| PHD + TS multilabel | SoftAcc1, % | 56.08 | 14.14 | 44.28 | 35.85 | 53.31 | 13.82 |
| PHD + TS multilabel | MSE | 11.13 | 28.18 | 16.37 | 10.74 | 11.82 | 27.03 |
| TLE + TS Binary | Acc, % | 14.17 | 03.15 | 12.36 | 07.76 | 14.48 | 00.98 |
| TLE + TS Binary | SoftAcc1, % | 31.14 | 13.10 | 29.19 | 32.14 | 34.01 | 11.58 |
| TLE + TS Binary | MSE | 21.58 | 28.20 | 21.36 | 16.35 | 18.12 | 30.45 |
| Length + GB | Acc, % | 21.70 | 04.75 | 18.30 | 01.22 | 19.18 | 06.33 |
| Length + GB | SoftAcc1, % | 36.0 | 09.48 | 33.20 | 22.02 | 36.09 | 22.07 |
| Length + GB | MSE | 23.56 | 33.32 | 27.00 | 19.27 | 17.35 | 20.00 |
| Human Baseline | Acc, % | 22.48 | 17.23 | 22.59 | 22.53 | 24.74 | 14.06 |
| Human Baseline | SoftAcc1, % | 41.91 | 37.03 | 39.73 | 48.01 | 42.44 | 33.47 |
| Human Baseline | MSE | 13.49 | 14.69 | 14.29 | 09.86 | 14.03 | 12.91 |
| Model | Metric | ctrl-Politics | ctrl-nocode | tuned | baseline | ||||
|---|---|---|---|---|---|---|---|---|---|
| ID | OOD | ID | OOD | ID | OOD | ID | OOD | ||
| RoBERTa + SEP | Acc, % | 49.35 | 59.12 | 50.20 | 60.61 | 49.55 | 23.85 | 51.35 | 06.35 |
| RoBERTa + SEP | SoftAcc1, % | 78.49 | 89.31 | 80.10 | 84.85 | 81.55 | 56.96 | 79.84 | 15.87 |
| RoBERTa + SEP | MSE | 02.86 | 01.24 | 02.93 | 01.87 | 02.33 | 06.33 | 02.51 | 39.32 |
| RoBERTa | Acc, % | 47.46 | 44.03 | 46.07 | 54.55 | 45.91 | 20.98 | 47.29 | 04.76 |
| RoBERTa | SoftAcc1, % | 78.43 | 85.53 | 78.01 | 86.87 | 80.13 | 52.88 | 78.49 | 15.87 |
| RoBERTa | MSE | 02.80 | 01.21 | 02.79 | 01.07 | 02.37 | 06.49 | 02.69 | 36.00 |
| Perpl. + GB | Acc, % | 25.27 | 10.69 | 25.32 | 07.07 | 30.88 | 10.15 | 24.44 | 06.35 |
| Perpl. + GB | SoftAcc1, % | 48.89 | 27.04 | 47.71 | 24.24 | 53.87 | 29.20 | 47.64 | 14.29 |
| Perpl. + GB | MSE | 11.81 | 20.96 | 12.27 | 22.70 | 11.67 | 17.86 | 12.01 | 39.62 |
| Perpl. + LogRegr | Acc, % | 24.08 | 07.55 | 21.88 | 07.07 | 28.50 | 08.04 | 24.77 | 03.17 |
| Perpl. + LogRegr | SoftAcc1, % | 42.23 | 23.90 | 38.84 | 19.19 | 42.78 | 22.28 | 42.45 | 15.87 |
| Perpl. + LogRegr | MSE | 15.70 | 23.27 | 16.69 | 25.38 | 17.46 | 24.20 | 15.72 | 40.86 |
| Perpl. + Regr | Acc, % | 14.80 | 13.21 | 13.96 | 14.14 | 15.70 | 11.90 | 13.62 | 03.17 |
| Perpl. + Regr | SoftAcc1, % | 42.06 | 40.25 | 41.89 | 33.33 | 43.08 | 36.03 | 39.25 | 14.29 |
| Perpl. + Regr | MSE | 06.40 | 07.78 | 06.55 | 08.31 | 06.81 | 07.10 | 06.84 | 22.86 |
| PHD + TS multilabel | Acc, % | 25.70 | 08.18 | 25.18 | 11.11 | 21.44 | 12.58 | 23.13 | 03.70 |
| PHD + TS multilabel | SoftAcc1, % | 47.33 | 32.70 | 47.30 | 39.39 | 35.31 | 26.37 | 45.64 | 05.56 |
| PHD + TS multilabel | MSE | 14.09 | 11.23 | 13.62 | 09.41 | 18.28 | 18.43 | 13.42 | 52.39 |
| TLE + TS binary | Acc, % | 10.98 | 05.03 | 11.53 | 04.04 | 14.51 | 06.56 | 12.39 | 03.18 |
| TLE + TS binary | SoftAcc1, % | 29.08 | 18.87 | 28.21 | 22.22 | 30.21 | 17.26 | 28.21 | 15.88 |
| TLE + TS binary | MSE | 20.36 | 23.28 | 20.84 | 21.82 | 21.82 | 26.64 | 20.59 | 25.55 |
| Length + GB | Acc, % | 17.32 | 03.77 | 18.05 | 0.0 | 21.64 | 0.04 | 15.24 | 26.98 |
| Length + GB | SoftAcc1, % | 33.96 | 18.86 | 35.71 | 15.15 | 35.80 | 10.87 | 32.56 | 34.92 |
| Length + GB | MSE | 22.48 | 23.87 | 24.16 | 26.53 | 23.59 | 32.78 | 16.25 | 16.0 |
| Human Baseline | Acc, % | 22.60 | 21.6 | 22.57 | 23.94 | 21.46 | 25.90 | 22.41 | 46.15 |
| Human Baseline | SoftAcc1, % | 40.61 | 41.6 | 40.59 | 45.07 | 39.17 | 44.92 | 40.46 | 63.46 |
| Human Baseline | MSE | 13.87 | 10.57 | 13.87 | 07.70 | 13.92 | 13.48 | 13.82 | 11.51 |
Tables 4 and 5 show our experimental results on cross-model transfer for all considered text generation models. The artificial text boundary detection models were trained on the parts of the dataset generated by all language models except one, which is held out for cross-model testing, and tested in-domain (ID) on the same parts and out-of-domain (OOD) on the remaining part generated by the held-out model.
Appendix D Additional Dataset Analysis
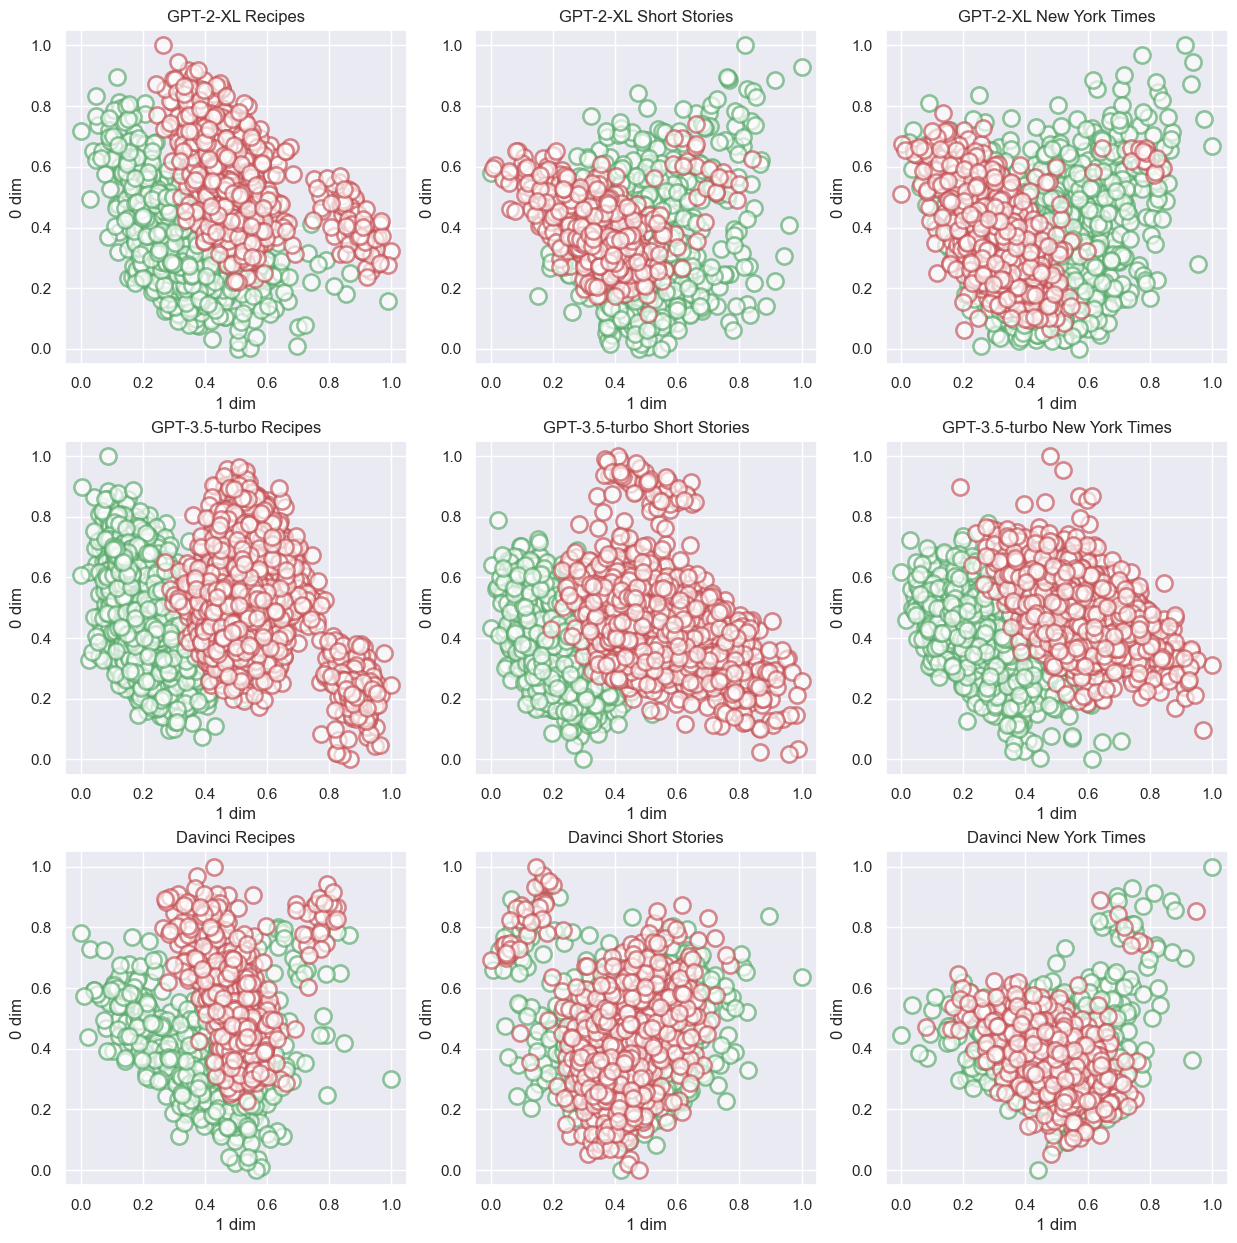

In this section we provide additional statistics and visualizations for the distributions of various features in the data. In particular, we note that on most diagrams, real texts have smaller PHD than fake texts, which is a very different result from the statistics presented by Tulchinskii et al. (2023), who noted that the PHD of real texts is larger than that of fake texts. We hypothesize that it can be due either to very short lengths of texts in our work compared to the texts considered by Tulchinskii et al. (2023) or due to differences in the sampling strategy used by Dugan et al. (2020) and Tulchinskii et al. (2023) when generating texts. Another observation is that the TLE dimension is very different for all generator models in the original RoFT dataset. This may be the reason for the bad generalization performance of intrinsic dimension-based algorithms across domains. For RoFT-chatgpt PHD and TLE, real and fake texts are close to each other.
We show dataset statistics in the following figures:
-
•
Figure 7 shows the distribution of pretrained (but not fine-tuned) RoBERTa [CLS] embeddings for real and fake parts of text samples from the original RoFT and RoFT-chatgpt datasets;
-
•
Figure 8 shows the distribution of labels in the original RoFT dataset by generator;
-
•
Figure 9 shows the distribution of labels in the original RoFT dataset by topic; this distribution is identical to the corresponding distribution for the RoFT-chatgpt dataset;
-
•
Figure 10 shows the distribution of PH dimensions of real and fake parts of the text by generator;
- •
-
•
Figure 13 shows the distribution of TLE dimensions of different sentences by generator;
- •
Appendix E Detailed experimental results

 |
 |
| (a) | (b) |
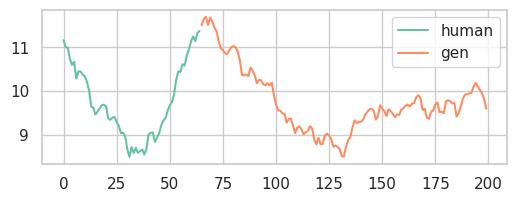
In this section, we provide additional statistics and visualizations regarding our experimental results. First, Figure 17 visualizes the changes in perplexities for sentences from the texts in RoFT-chatgpt by their labels. We make the following observations.
First, perplexities of the first couple of sentences across all texts are quite high, and the average perplexity of sentences decreases by the end of the text. This is probably due to the fact that for the words of the first sentences the length of the text prefix is not enough for a stable calculation of perplexity. One solution to mitigate this effect and hence make perplexity-based classifiers more stable might be to generate new prefixes for the text using some generative model (e.g. gpt-3.5) and calculate perplexities of original text words using this generated prefix. We leave this idea for further research.
Second, there is no evident spike of perplexity at the start of the fake text. This is an additional indication for the fact that artificial text boundary detection may be a far harder problem than artificial text detection by classifying full texts into real and fake.
Third, Figure 18a visualizes the coefficients of a logistic regression model trained on sentence perplexities from the RoFT-chatgpt dataset (Perplexity + LogRegr rows in the tables). We can see a distinct pattern in this figure. For the label k, which means that the first fake sentence in the text is the (k+1)st, the highest value of the coefficient is the kth one, and the lowest one is often the (k+2)nd. This could mean that the model is “searching” for a sudden drop of perplexity at a point where the fake part is starting. This fits together well with the idea that GPT-2 sees text generated by a similar model (GPT-3.5-turbo) as a more “natural” one than real human-produced text. Therefore, perplexity often drops at the point where fake text begins, and logistic regression can pick up this effect and use it as a decision rule.
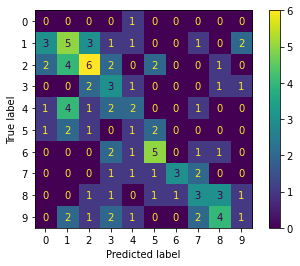
Finally, Figure 18b visualizes the confusion matrix on the test set of a gradient boosting regressor trained on the original RoFT dataset. We can see that its predictions are highly concentrated around the center labels (3-6), although MSE scores of the gradient boosting regressor on both in-domain and out-of-domain sets are in top-2 among other approaches for almost any test set (Tables 4 and 5). This suggests that further research on the errors of different models on different data subsets is needed.