Monitoring broad emission-line components in spectra of the two low-metallicity dwarf compact star-forming galaxies SBS 1420540 and J14444840
Abstract
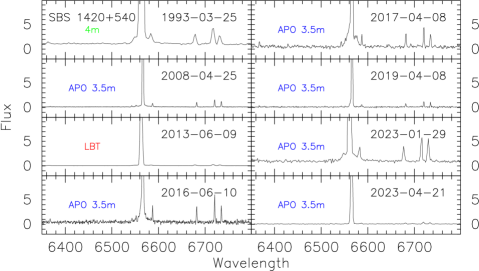
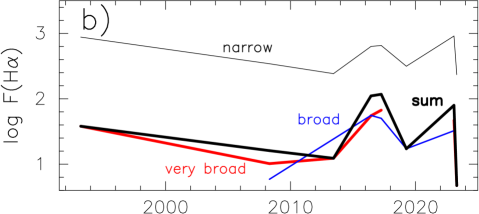
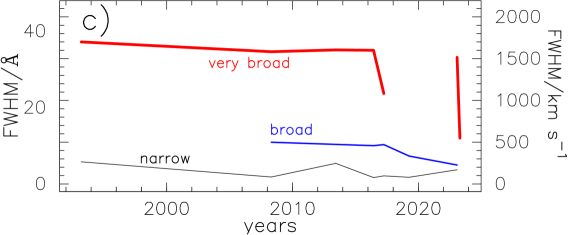
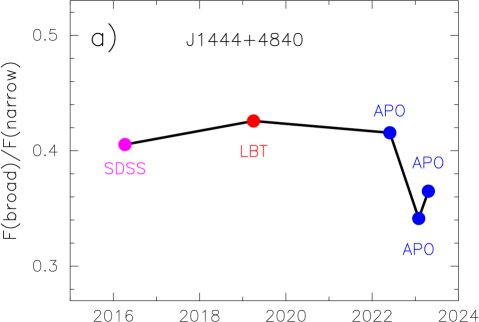
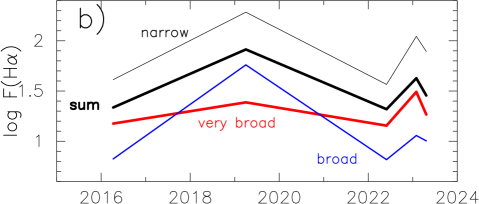
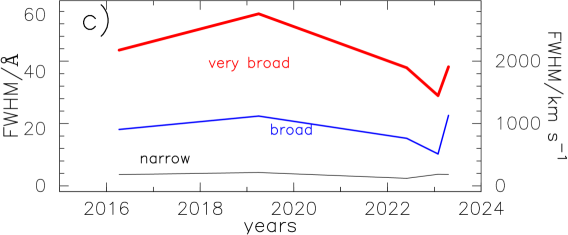
We report the discovery of broad components with P-Cygni profiles of the hydrogen and helium emission lines in the two low-redshift low-metallicity dwarf compact star-forming galaxies (SFG) SBS 1420540 and J14444840. We found small stellar masses of 10 and 10 M, low oxygen abundances 12 log O/H of 7.75 and 7.45, high velocity dispersions reaching 700 and 1200 km s, high terminal velocities of the stellar wind of 1000 and 1000–1700 km s, respectively, and large EW(H) of 300 Å for both. For SBS 1420540, we succeeded in capturing an eruption phase by monitoring the variations of the broad-to-narrow component flux ratio. We observe a sharp increase of that ratio by a factor of 4 in 2017 and a decrease by about an order of magnitude in 2023. The peak luminosity of 10 erg s of the broad component in (H) lasted for about 6 years out of a three-decades monitoring. This leads us to conclude that there is probably a Luminous Blue Variable candidate (LBVc) in this galaxy. As for J14444840, its very high (H) of about 10 ergs s, close to values observed in active galactic nuclei (AGNs) and Type IIn Supernovae (SNe), and the variability of no more than 20 per cent of the broad-to-narrow flux ratio of the hydrogen and helium emission lines over a 8-year monitoring do not allow us to definitively conclude that it contains a LBVc. On the other hand, the possibility that the line variations are due to a long-lived stellar transient of type AGN/SN IIn cannot be ruled out.
keywords:
galaxies: dwarf – galaxies: starburst – galaxies: ISM – galaxies: abundances.1 Introduction
The Luminous Blue Variable (LBV) stage is a very short high luminous phase in the evolution of the most massive stars, with masses greater than 20 – 30M, during their thansition from early young O stars to Wolf-Rayet (WR) stars and/or supernovae/black holes (SN/BHs) (Crowther2007; Solovyeva2020). Besides being very hot and luminous massive stars, LBVs show significantly greater variability of brightness, observed both photometrically and spectroscopically, than other variable stars (HumphreysDavidson1994; Vink2012). They exhibit strong enhancement in emission and absorption lines, in the continuum level and in the blue shape of the UV and optical continuum. The most prominent spectral features are broad components of hydrogen and often of helium lines, with P-Cygni profiles. The source of the broad emission can be stellar winds or eruptions of massive stars propagating in dense circumstellar envelopes (HumphreysDavidson1994; Smith1994; Drissen1997; Drissen2001). There are two types of variability in LBV stars: (1) the first type consists of moderate irregular quasi-periodic variations in brightness, due to variations in photospheric temperatures and to strong and variable stellar wind mass-loss on timescales from several years to several decades (see e.g. Massey2000; Humphreys2013; Humphreys2017; Humphreys2019; Grassitelli2020; Weis2020). Photometric variability of up to 0.5 – 2 mag on a relatively short time-scale of several years is characteristic of the S Dor type of LBV stars. About a hundred such stars are known in the Galaxy and in the nearest galaxies of the Local Group. Their proximity, especially for the LBVs in our Galaxy, allows a more detailed study of the individual stars and their envelopes. However, these young stars are located in the Galactic plane and are subject to large extinction. In addition, the parameters of these massive stars, as well as those of the interstellar environment in more distant galaxies, can be quite different. In particular, the metallicity, the interstellar medium density, the star-formation rate (SFR) and the specific SFR (sSFR) can vary; (2) the second type of variability is found among a special class of rare LBVs with giant eruptions and brightening of more than 2.5 – 3 mag, on timescales of up to thousands of years (DavidsonHumphreys1997; Smith2011; Vink2012; Weis2020). These are very rare events. Only two well established variable stars of this type are known in our Galaxy: Carinae and P-Cygni (Davidson1999; Lamers1983).
Until now, the origin of LBV variability remains uncertain and many questions concerning the nature of LBVs are left open: do all most massive stars go through a LBV phase in their evolution? Can a giant eruption and a S Dor-type variability occur in the same star or only in different ones? We are also interested in investigating possible metallicity effects on the properties of LBV stars. The well-studied nearest star-forming dwarf galaxies Small Magellanic Cloud (SMC) and Large Magellanic Cloud (LMC) have respective metallicities of 0.2 and 0.5 that of the Sun, so they do not offer very metal-deficient environments. Investigating the LBV phenomenon in star-forming galaxies (SFGs) with lower metallicities will allow us to better study the abundance dependence of stellar wind and mass loss properties of LBVs.
As of now, these properties are still weakly constrained by existing observations (CrowtherHadfield2006; Bestenlehner2023; Vink2023). That is because only a few LBV/cLBV are now known in metal-poor distant SFGs (see e.g. Pustilnik2008; IzT09; Pustilnik2017; Annibali2019; Annibali2019a; Weis2020; Guseva2022, and references therein).
The scarcity of known LBVs in distant galaxies is due to the difficulty of detecting them. While it is impossible to obtain the spectrum of an individual LBV star in a distant galaxy, it is still quite a challenge to find signs of LBVs in the integral spectra of far-away galaxies. The chance of finding a short-lived LBV in a distant galaxy increases with the number of massive stars in it. The latter depends in turn on the age of the starburst and hence on the value of the equivalent width of the H emission line. Up to thousands and tens of thousands young massive stars may be present in the super-star clusters contained in SFGs with EW(H) 100Å, corresponding to a starburst age of less than 4 Myrs at a metallicity 12 + log(O/H) 8 (see e.g. SchaererVacca1998; SchaererGus2000). Broad component luminosities of 10 – 10 ergs s are observed in such SFGs which are attributed to massive stars with strong stellar winds or to LBV/SN (Drissen1997; Drissen2001; IzTG07; Guseva2022).
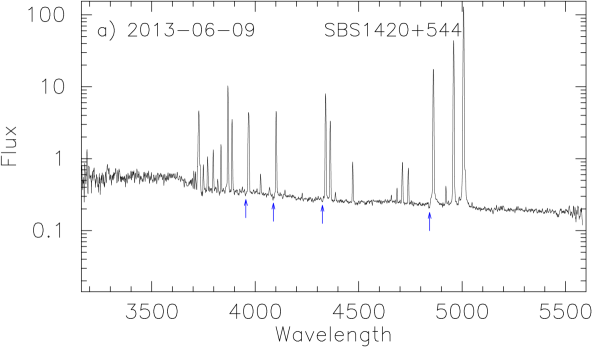
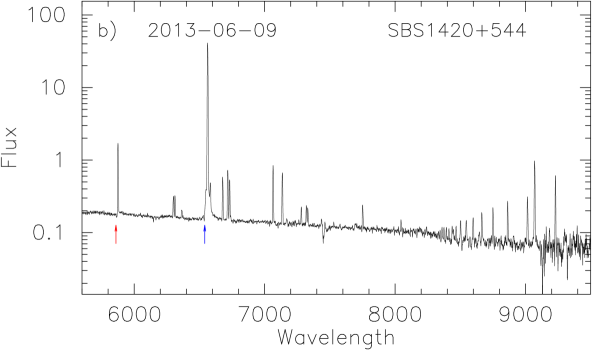
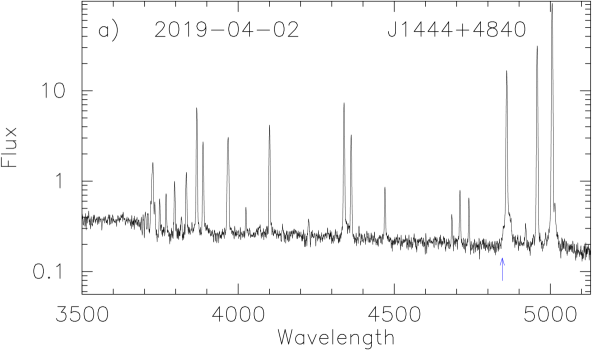
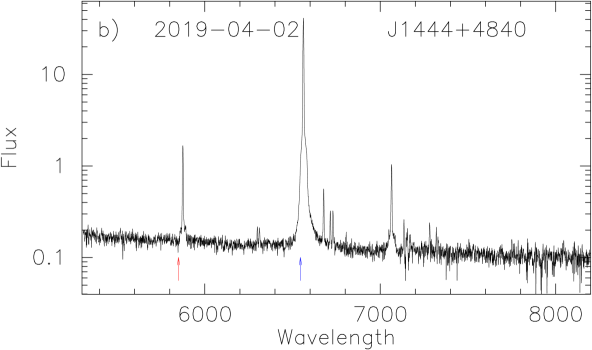
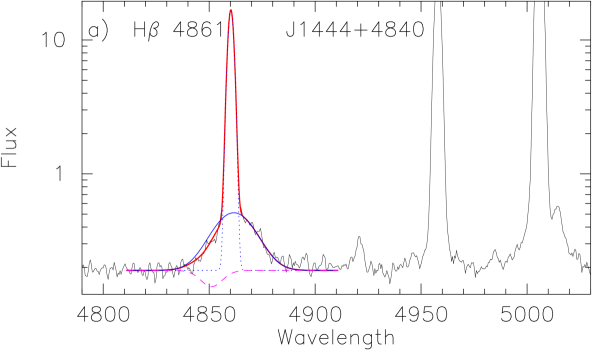
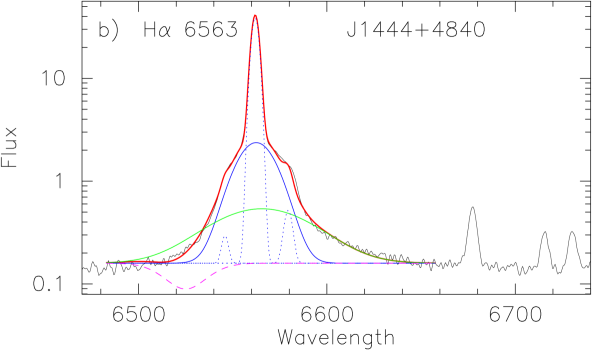
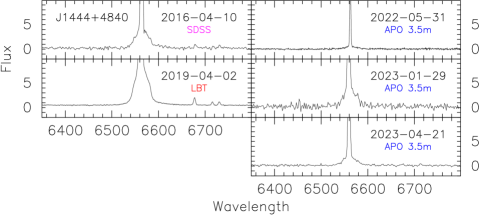
In this paper, we present long-slit spectrophotometric observations with high signal-to-noise ratio of two compact dwarf SFGs, SBS 1420544 and J14444840, which have respectively EW(H) = 328 Å and 288 Å. SBS 1420544 was selected from the Second Byurakan Survey (SBS) and J14444840 from the Sloan Digital Sky Survey (SDSS) Data Release 16 (DR16) (Ahumada2020). Both show strong emission lines with a strong broad component in the hydrogen and helium lines. These broad features are often used to find LBV stars in the integral spectra of galaxies in the local Universe.
The observations were obtained with the Large Binocular Telescope (LBT), equipped with the Multi-Object Double Spectrograph (MODS). In addition, SBS 1420544 was also observed with the LBT Utility Camera in the Infrared (LUCI). We use the LBT observations to derive the physical and chemical properties of the two galaxies with high accuracy. In addition to the LBT data, we have also collected SDSS data and other observations of the two objects from previous studies. We have also added several new observations obtained with the 3.5m Apache Point Observatory (APO) telescope. This allows us to extend our monitoring baseline of the two galaxies to as long a duration as possible.
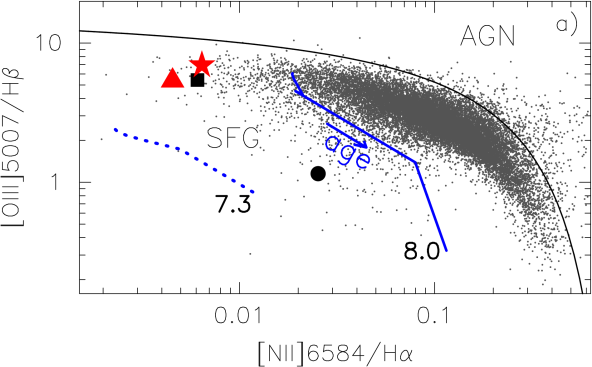
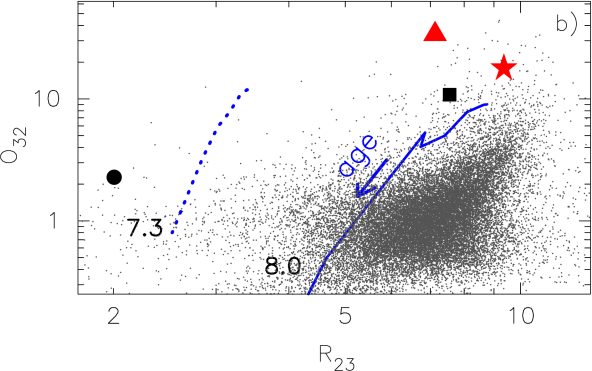
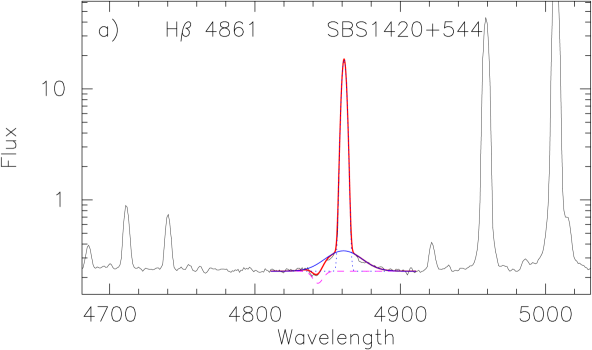
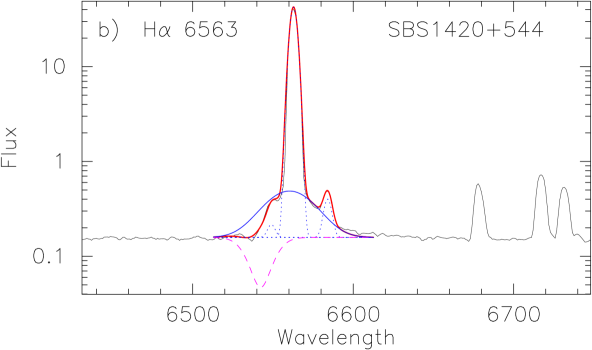
The LBT observations and data reduction of SBS 1420544 and J14444840 are described in Section LABEL:sec:observations. General properties of the studied galaxies are considered in subsection LABEL:sec:general. Subsection LABEL:sec:diagnostic discusses their locations in various emission-line diagnostic diagrams. Derived element abundances are presented in subsection LABEL:subsec:abundances. Subsection LABEL:sec:broad describes the decomposition of the broad emission-line profiles of hydrogen and helium lines into various components. In subsection LABEL:sec:signs we discuss the evidence for the presence of LBV candidates in the two galaxies. Subsubsections LABEL:sec:S1420 and LABEL:sec:J1444 discuss the properties of SBS 1420540 and J14444840 in detail. We summarize our main results in Sect. LABEL:sec:conclus.
| Parameter | SBS 1420544 | J14444840 |
|---|---|---|
| R.A.(J2000) | 14:22:38.78 | 14:44:59.01 |
| Dec.(J2000) | +54:14:09.76 | +48:40:06.80 |
| 0.021130.00001 | 0.064690.00005 | |
| , mag | 19.280.13 | 22.010.41 |
| , mag | 19.330.09 | 22.180.42 |
| , mag | 17.690.01 | 20.710.03 |
| , mag | 16.420.06 | … |
| , mag | 15.060.06 | 17.590.51 |
| , mag | 10.420.06 | 11.720.19 |
| , mag | 7.350.09 | … |
| , Mpc | 92.5 | 292.5 |
| , mag | 17.140.01 | 16.620.03 |
| log /M | 6.240.33 | 6.590.35 |
| (H), erg s | (1.20.1)10 | (1.20.1)10 |
| SFR, Myr | 0.270.03 | 2.650.03 |
| log sSFR, log yr | 6.81 | 6.17 |
Corrected for Milky Way extinction.
Derived from the extinction- and aperture-corrected SDSS spectrum.
Corrected for extinction.
Derived from the K98 relation using the extinction- and aperture-corrected H luminosity.
| Parameter | SBS 1420544 | J14444840 |
|---|---|---|
| MODS | ||
| Date | 2013-06-09 | 2019-04-02 |
| Exposure (s) | 1800 | 7200 |
| Slit (arcsec) | 601.0 | 601.2 |
| Airmass | 1.29 | 1.04 |
| LUCI | ||
| Date | 2016-06-16 | … |
| Exposure (s) | 1440 | … |
| Slit (arcsec) | 601.0 | … |
| Airmass | 1.10 | … |

| 100()/(H) | ||
| Line | SBS 1420544 | J14444840 |
| 3187.74 He i | 5.853.22 | 3.140.52 |
| 3691.55 H18 | … | 0.790.14 |
| 3697.15 H17 | 0.920.25 | 1.040.17 |
| 3703.30 H16 | 2.210.31 | 1.660.18 |
| 3711.97 H15 | 3.480.52 | 1.990.34 |
| 3721.94 H14 | 1.720.21 | 2.450.20 |
| 3727.00 [O ii] | 38.871.28 | 15.850.58 |
| 3734.37 H13 | 2.370.23 | 2.800.24 |
| 3750.15 H12 | 4.150.44 | 3.160.32 |
| 3770.63 H11 | 5.890.44 | 4.300.35 |
| 3797.90 H10 | 7.270.43 | 5.980.37 |
| 3819.64 He i | 1.060.18 | 1.130.14 |
| 3835.39 H9 | 8.810.44 | 8.270.42 |
| 3868.76 [Ne iii] | 60.851.92 | 47.571.54 |
| 3889.00 He i+H8 | 20.490.72 | 19.810.72 |
| 3968.00 [Ne iii]+H7 | 36.651.18 | 32.301.07 |
| 4009.26 He i | 0.350.10 | … |
| 4026.19 He i | 1.860.13 | 2.110.17 |
| 4068.60 [S ii] | 0.720.12 | … |
| 4101.74 H | 27.030.86 | 29.030.95 |
| 4120.84 He i | 0.220.07 | … |
| 4143.76 He i | 0.380.08 | 0.680.10 |
| 4227.20 [Fe v] | 0.390.08 | 1.290.11 |
| 4287.33 [Fe ii] | … | 0.620.12 |
| 4340.47 H | 46.081.37 | 49.531.51 |
| 4363.21 [O iii] | 18.430.56 | 20.480.64 |
| 4387.93 He i | 0.560.08 | 0.690.02 |
| 4471.48 He i | 3.730.14 | 4.120.18 |
| 4562.50 [Mg i] | 0.150.06 | … |
| 4571.10 Mg i] | 0.200.07 | … |
| 4658.10 [Fe iii] | 0.320.05 | … |
| 4685.94 He ii | 0.850.07 | 1.520.14 |
| 4712.00 [Ar iv]+He i | 3.920.14 | 4.140.19 |
| 4740.20 [Ar iv] | 2.850.11 | 3.040.16 |
| 4754.72 [Fe iii] | 0.180.04 | … |
| 4861.33 H | 100.002.87 | 100.002.91 |
| 4921.93 He i | 1.110.07 | 1.230.12 |
| 4958.92 [O iii] | 234.576.71 | 181.065.23 |
| 4988.00 [Fe iii] | 0.520.05 | … |
| 5006.80 [O iii] | 690.3519.8 | 536.3115.4 |
| 5015.68 He i | 0.910.04 | 1.570.10 |
| 5199.00 [N i] | 0.190.05 | … |
| 5270.63 [Fe iii] | 0.130.05 | … |
| 5411.52 He ii | … | 0.350.08 |
| 5517.71 [Cl iii] | 0.340.12 | 0.230.05 |
| 5537.88 [Cl iii] | 0.170.06 | … |
| 5875.60 He i | 10.860.33 | 11.460.36 |
| 6300.30 [O i] | 1.150.05 | 0.460.04 |
| 6312.10 [S iii] | 1.130.05 | 0.540.04 |
| 6363.80 [O i] | 0.440.04 | 0.190.01 |
| 6548.10 [N ii] | 0.950.04 | … |
| 6562.80 H | 278.818.63 | 275.598.64 |
| 6583.40 [N ii] | 1.790.07 | 1.250.07 |
LBT extinction-corrected emission-line fluxes 100()/(H) Line SBS 1420544 J14444840 6678.10 He i 2.920.10 2.870.11 6716.40 [S ii] 4.170.14 1.170.06 6730.80 [S ii] 2.770.10 1.290.06 7065.30 He i 4.330.14 5.630.19 7135.80 [Ar iii] 3.490.12 1.580.06 7170.62 [Ar iv] 0.190.03 … 7237.00 [Ar iv] 0.120.03 … 7262.76 [Ar iv] 0.100.03 … 7281.35 He i 0.600.04 0.780.05 7319.90 [O ii] 0.810.05 0.520.05 7330.20 [O ii] 0.670.04 0.380.03 7751.12 [Ar iii] 0.850.05 0.260.03 8045.63 [Cl iv] 0.270.04 … 8345.44 P23 0.140.03 … 8359.01 P22 0.200.04 … 8374.48 P21 0.240.04 … 8392.40 P20 0.240.04 … 8413.32 P19 0.190.04 … 8437.96 P18 0.280.04 … 8446.34 O i 0.210.04 … 8467.26 P17 0.260.04 0.370.05 8502.49 P16 0.550.05 0.540.06 8545.38 P15 0.560.06 0.440.06 8598.39 P14 0.680.06 0.520.05 8665.02 P13 0.770.06 0.720.06 8750.47 P12 0.960.06 0.990.07 8862.79 P11 1.130.07 1.470.11 9014.91 P10 1.540.09 2.250.16 9069.00 [S iii] 5.740.23 2.460.16 9229.02 P9 2.920.18 1.790.15 9530.60 [S iii] 15.160.60 … 9545.98 P8 2.370.18 … 10050.00 P 6.090.25 … 10829.00 He i 39.971.57 … 10941.00 P 7.740.32 … 12790.00 He i 0.860.06 … 12821.00 P 14.200.59 … (H) 0.2050.037 0.2750.037 (H) 76.072.20 59.942.20 EW(H) 328.01.0 288.01.0 EW(abs) 2.40.5 0.80.4
* Note that for bright hydrogen lines only nebular narrow
emission components were measured.
Extinction coefficient, derived from the observed nebular
hydrogen Balmer lines.
Observed flux of narrow H in units of 10 erg s cm.
Rest-frame equivalent width in Å.
| Property | SBS 1420544 | J14444840 |
|---|---|---|
| (O iii), K | 17500350 | 21600550 |
| (O ii), K | 15100280 | 15600360 |
| (S iii), K | 16200290 | 19300450 |
| (S ii), cm | 1010 | 970240 |
| O/H10 | 3.4380.200 | 1.4080.096 |
| O/H10 | 5.2730.279 | 2.6400.159 |
| O/H10 | 0.4990.051 | 0.4420.050 |
| O/H10 | 5.6670.280 | 2.8250.159 |
| 12+log(O/H) | 7.7530.021 | 7.4510.024 |
| N/H10 | 1.2980.058 | 0.8600.050 |
| ICF(N) | 14.465 | 17.779 |
| N/H10 | 1.8780.095 | 1.5290.101 |
| log(N/O) | 1.4800.031 | 1.2670.038 |
| Ne/H10 | 1.0650.060 | 0.5080.030 |
| ICF(Ne) | 1.019 | 1.027 |
| Ne/H10 | 1.0850.064 | 0.5220.032 |
| log(Ne/O) | 0.7180.034 | 0.7330.036 |
| S/H10 | 6.5800.238 | 2.4400.129 |
| S/H10 | 4.6280.293 | 1.3800.129 |
| ICF(S) | 2.060 | 2.895 |
| S/H10 | 1.0890.061 | 0.4700.038 |
| log(S/O) | 1.7160.032 | 1.7790.043 |
| Cl/H10 | 1.1140.292 | 0.6280.111 |
| ICF(Cl) | 1.529 | 1.507 |
| Cl/H10 | 1.7020.447 | 0.9460.168 |
| log(Cl/O) | 3.5220.116 | 3.4750.081 |
| Ar/H10 | 1.2290.050 | 0.4300.018 |
| Ar/H10 | 1.9690.102 | 1.3240.083 |
| ICF(Ar) | 1.662 | 1.872 |
| Ar/H10 | 2.0420.189 | 0.8050.159 |
| log(Ar/O) | 2.4430.046 | 2.5460.089 |
| Fe/H10 | 0.5890.094 | … |
| ICF(Fe) | 21.789 | … |
| Fe/H10 | 1.2840.206 | … |
| log(Fe/O) | 1.6450.073 | … |


| Line | FWHM | Flux | ||||||
| ratio | ||||||||
| SBS 1420544 | ||||||||
| H (narrow) | 4861.4 | 76.1 | 7.8 | 3.8 | 234 | 100 | ||
| H (absorb.) | 4843.3 | 0.5 | 8.6 | |||||
| H (broad) | 4860.9 | 3.5 | 0.4 | 27.5 | 1697 | 721 | ||
| H broad/narrow | 1090 | 0.046 | ||||||
| H (narrow) | 6562.8 | 242.2 | 24.8 | 5.4 | 247 | 105 | ||
| H (absorb.) | 6542.4 | 2.4 | 20.4 | |||||
| H (broad) | 6560.4 | 12.3 | 1.3 | 35.1 | 1604 | 681 | ||
| H broad/narrow | 823 | 0.050 | ||||||
| J14444840 | ||||||||
| H (narrow) | 4860.2 | 55.0 | 56.3 | 3.2 | 197 | 84 | ||
| H (absorb.) | 4851.1 | 0.6 | 12.5 | |||||
| H (broad) | 4861.6 | 7.7 | 7.9 | 22.5 | 1389 | 590 | ||
| H broad/narrow | 650 | 0.140 | ||||||
| He i (narrow) | 5874.9 | 7.3 | 7.5 | 4.7 | 240 | 102 | ||
| He i (absorb.) | 5849.7 | 0.3 | 10.2 | |||||
| He i (broad) | 5875.8 | 2.5 | 2.6 | 32.4 | 1654 | 702 | ||
| He i broad/narrow | 1330 | 0.338 | ||||||
| H (narrow) | 6561.9 | 192.6 | 197.0 | 4.7 | 215 | 91 | ||
| H (absorb.) | 6525.0 | 2.1 | 28.6 | |||||
| H (broad) | 6561.5 | 57.6 | 59.0 | 24.5 | 1120 | 476 | ||
| H (v.broad) | 6565.5 | 24.4 | 25.0 | 60.4 | 2761 | 1172 | ||
| H broad/narrow | 1670 | 0.426 | ||||||
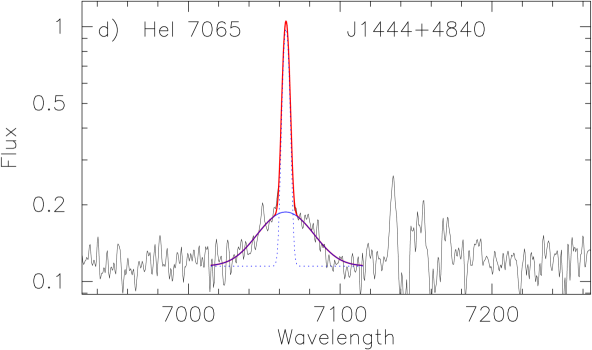
| He i (narrow) | 7064.4 | 4.4 | 4.5 | 4.8 | 204 | 86 | ||
| He i (broad) | 7064.2 | 3.0 | 3.1 | 39.0 | 1656 | 703 | ||
| He i broad/narrow | 0.682 | |||||||
Rest-frame wavelength in Å. Observed flux in units 10 erg scm. Extinction-corrected luminosity in 10 erg s. Full width at half maximum in Å. Full width at half maximum in km s. Velocity dispersion in km s. The terminal velocity, = (br) – (abs) in km s. Broad-to-narrow component flux ratio. Broad means the sum of the broad and very broad emission components.