∎
[⋆]e1Corresponding author: Marcello Abbrescia, e-mail: marcello.abbrescia@ba.infn.it
High-rate tests on Resistive Plate Chambers operated with eco-friendly gas mixtures
Abstract
Results obtained by the RPC ECOgas@GIF++ Collaboration, using Resistive Plate Chambers operated with new, eco-friendly gas mixtures, based on Tetrafluoropropene and carbon dioxide, are shown and discussed in this paper. Tests aimed to assess the performance of this kind of detectors in high-irradiation conditions, analogous to the ones foreseen for the coming years at the Large Hadron Collider experiments, were performed, and demonstrate a performance basically similar to the one obtained with the gas mixtures currently in use, based on Tetrafluoroethane, which is being progressively phased out for its possible contribution to the greenhouse effect. Long term aging tests are also being carried out, with the goal to demonstrate the possibility of using these eco-friendly gas mixtures during the whole High Luminosity phase of the Large Hadron Collider.
Keywords:
Resistive Plate Chambers Gaseous detectors Eco-friendly gas mixtures GIF++pacs:
29.40.Cs1 Introduction
Resistive Plate Chambers (RPCs) are a widespread detector, used both for astro-particle and accelerator physics experiments, as well as environmental monitoring and medical applications. In particular, at the Large Hadron Collider (LHC) at CERN, all four big experiments, namely ALICE, ATLAS, CMS and LHCb, use, or plan to use, RPCs, in slightly different configurations and for multiple purposes ALICE1 ATLAS1 CMS1 LHCb1 . The RPCs of the LHC experiments have been in operation for more than ten years now, contributing to some of the most important discoveries in particle physics in the last dozen years.
Presently, the RPCs used at the LHC experiments are operated with gas mixtures with Tetrafluoroethane (TFE) as main component. TFE, whose empirical formula is C2H2F4 and is also commercially known as R-134a, is usually mixed with iso-butane (i-C4H10) and Sulfur hexafluoride (SF6) in various percentages, to exploit the well-known discharge quenching properties of these gases. However, TFE is characterized by a Global Warming Potential (GWP111The GWP of a certain gas depends on the time frame considered. Here and in the following we will refer to the GWP over 100 years. For all tables and calculations, moreover, we will use the GWP reported in Europe .) around 1430, namely it contributes to the greenhouse effect 1430 times more than an equivalent mass of CO2, and regulations by the European Community, derived from the adoption of the Kyoto protocol, prohibit it for many applications Europe . Even if scientific applications do not fall within these restrictions, the collaborations of the LHC experiments decided to investigate for possible replacements of TFE with other, more eco-friendly, gases.
Studies with the goal of finding a new eco-friendly gaseous component suitable to replace TFE in RPCs started several years ago. Given the fact that the present RPC systems of the experiments at LHC feature several cubic meters of gas volume, this search could not consider the whole set of eco-friendly gases, but only the ones that are available on the market at a reasonable cost. Summarizing the work of many years, the main idea was to replace TFE with tetrafluoropropene, whose empirical formula is C3H2F4, which is an hydrofluoroolefin (HFO) characterized by a quite low GWP. In particular, its allotropic form, commercially known as HFO-1234ze, proved to be the most suitable for applications in detectors for particle physics, and is characterized by a GWP around 7 Europe . HFO-1234ze is widely used in refrigeration industry, making it easily to procure and relatively not expensive.
HFO-1234ze has a molecule quite similar to TFE, nevertheless its first effective Townsend coefficient, at a given electric field strength, is lower with respect to the one of TFE (for a recent measurement of gas parameters of HFO-1234ze and a comparison with TFE, see Fan ). In the present-day RPCs, replacing TFE with HFO-1234ze would result in too large operating voltages to be compatible with the high voltage systems and readout electronics used at the LHC experiments. Therefore, in order to keep the operating voltage within an acceptable range, it was proposed to replace TFE with a binary mixture, made either of HFO-1234ze and CO2, or HFO-1234ze and He. However, He cannot be used at collider experiments, for problems it might cause to photomultipliers in some other experimental subsystems (see, for instance, Photo1 Photo2 ), therefore the studies concentrated mainly on mixtures made out of HFO-1234ze and CO2, in various percentages.
Note that it has been pointed out that HFO-1234ze, in the high atmosphere, can dissociate giving eventually origin to trifluoroacetic acid (TFA), which is potentially harmful for the environment and the human health, if removed from the atmosphere by rainfalls TFA1 TFA2 . A long debate has been going on the subject, whose outcome seems to demonstrate that the actual impact should be irrelevant (see TFA3 and references therein). Nevertheless, this is one of the potential issues to be considered, and will probably require deeper insights in the future.
Some studies about the performance of RPCs filled with HFO-1234ze/CO2 mixtures have already been reported, showing encouraging results, in terms of performance obtained ALICE2 ATLAS2 CMS2 EP-DT LHCb2 . Nevertheless, at the moment, a long term aging test of RPCs filled with eco-friendly gas mixtures based on HFO-1234ze and CO2, operated under a high particle radiation background, is still missing, and this is a crucial point if such gas mixtures are to be considered for use during the High-Luminosity phase of the LHC (HL-LHC).
Joined by the common interest for this topic, a collaboration across multiple groups working on RPCs at the LHC experiments was established, with the specific goal to carry out these long term, high irradiation conditions, tests. Groups from the ALICE, ATLAS, CMS, LHCb/SHiP experiments, together with the EP-DT gas group from CERN, are components of this collaboration, usually called the "RPC ECOGas@GIF++ Collaboration"222Later on, activities related to the search of eco-friendly gas mixtures for RPCs were also carried out in the framework of the Working Group 7.2 of the AidaInnova project AidaInnova ..
Testing the very same HFO-1234ze/CO2 gas mixtures, with the different detector layouts and front-end electronics brought by the various groups, provides deep insights both on the gas and the detector behaviours, and, in principle, may allow to disentangle the various effects that could be related either to the specific designs and/or to the production techniques, and/or the electronics used.
2 Experimental set-up
The results presented in this paper were obtained during several beam tests, which took place from July until October 2021, using the H4-SPS secondary beam line available at the Gamma Irradiation Facility at CERN GIF++ (usually simply referred to as GIF++). Here detectors can be kept under irradiation with photons from a 12.5 TBq 137Cs source, simulating the irradiation conditions foreseen during the HL-LHC, while measuring their performance using the beam. Usually a 100 GeV muon beam was used for this purpose Beam . A system of five absorption filters (ABS), made in Lead, mounted on movable supports, can be used to adjust the intensity of the radiation field produced by the 137Cs source, namely the rate of photons impinging onto the detectors, down to a factor 50000 from its maximum intensity. An additional Aluminium filter, positioned close to the source and suitably shaped, is also used to make the flux as uniform as possible in vertical planes perpendicular to the muon beam and the bunker walls; this is a useful feature to uniformly irradiate large planar detectors.
Inside the GIF++, the detectors to be tested were mounted onto two mechanical support structures, positioned at around 3 and 6 m from the 137Cs source. In particular, chambers from ATLAS, CERN EP-DT and CMS groups were mounted on a trolley positioned 3 m away from the source, while chambers from ALICE and LHCb/SHiP on a trolley 6 m away. A simplified sketch of the GIF++ layout, re-elaborated from GIF++2 , with, highlighted, the position of the two trolleys, as well as other features, is shown in Figure 1. The characteristics of the chambers under test, in terms of distance from the source, dimensions, gap size, electrode thickness, number of strips, strip pitch, are listed in Table 1. Note that the chambers from ALICE, ATLAS, CERN EP-DT and LHCb/SHiP groups were rectangular in shape, and single-gap, while the chamber from CMS was double-gap and trapezoidal in shape, equal to the ones actually used in the endcaps of the experiment CMS1 . Also the chamber from ALICE was of the same kind of the ones currently in use ALICE1 in the experiment, while the others were prototypes built for these and other performance studies.
For signal readout purposes, the chambers under test were equipped with sets of copper strips. While the chambers from the CMS and CERN EP-DT groups featured one set of strips, horizontally directed, chambers from ALICE and LHCb/SHiP had two sets of strips, perpendicular to each other, positioned on the opposite sides of the gas gaps. The chamber from ATLAS was equipped with one single central strip, 3 cm wide, while the trapezoidal shape of the CMS chamber resulted in a variable strip pitch.

| Group | Distance from the 137Cs (m) | Dimensions (cm cm) | Gap thickness (mm) | Electrode thickness (mm) | # of strips | Strip pitch (mm) |
| ALICE | 6.0 | 50 50 | 2 | 2 | 16 + 16 | 30 |
| ATLAS | 3.2 | 55 10 | 2 | 1.8 | 1 | N/A |
| CMS | 3.5 | (41.5 23.9) 100.5 | 2 + 2 | 2 | 128 | 5.5 11 |
| EP-DT | 3.0 | 70 100 | 2 | 2 | 7 | 21 |
| LHCb/SHiP | 6.2 | 70 100 | 1.6 | 1.6 | 32+32 | 10.6 |
In the ALICE, CMS and LHCb/SHiP chambers, signals induced on the readout strips were amplified, discriminated and formed by means of suitable front-end electronics which was connected to Time to Digital Converters (TDCs), downstream in the Data Acquisition (DAQ) chain. ATLAS and the CERN EP-DT groups used suitable digitizers, which directly acquired the wave-forms from the readout strips and stored them for subsequent analysis. Each experiment analyzed the data, either from TDCs or from the digitizers, with its own custom analysis algorithms. Some characteristics of the readout electronics used, namely the Front-End (FE) electronics chip type, FE equivalent threshold, DAQ (TDC or Digitizer), are reported in Table 2. Note that the front-end electronics used for these tests is also currently used in two of the RPC systems at LHC, namely the FFERIC chip in the ALICE RPC system, and the electronics mounted on the CMS (for details on the front-end electronics employed, see FEERIC CMSRPC ).
Throughout the data acquisition, a custom made Detector Control Software (DCS) package collected information about the environmental parameters in the GIF++ bunker, as well as the state of each detector, and stored them for later analysis GIF++ . During the performance tests using the muon beam, the trigger was obtained using the coincidence of the signals from four scintillators, two of them located outside the irradiation zone and two inside it, defining by their intersection a 10 10 cm2 area.
| Group | FE chip | FE equivalent threshold | DAQ type |
|---|---|---|---|
| ALICE | FEERIC ASICs | -200 mV for horizontal strips, 106 mV vertical strips (after amplification) | TDC CAEN mod.V1190A |
| ATLAS | N/A | 130 fC | Digitizer CAEN mod.DT5730 |
| CMS | CMS/RPC standard electronics | 220 mV = 150 fC (after amplification) | TDC CAEN mod.V1190A |
| EP-DT | N/A | 2 mV | Digitizer CAEN mod.V1730 |
| LHCb/SHiP | FEERIC ASICs | - 70 mV for horizontal strips, 80 mV for vertical strips (after amplification) | TDC CAEN mod.V1190A |
The tests, whose results are reported in this paper, were performed when flushing the RPCs with the so called "standard" gas mixture (STD mixture in the following), used in the RPCs of the CMS experiment, whose main component, as already pointed out, is TFE. Subsequently, the RPCs were filled with gas mixtures where TFE was replaced by HFO-1234ze and CO2, in different percentages. We tested, in particular, two gas mixtures, hereafter conventionally called ECO2 and ECO3 333The ECO1 gas mixture was studied in an earlier phase of the tests on eco-friendly gas mixtures performed by the RPC ECOGas@GIF++ collaboration, and featured a larger content of HFO-1234ze. It was soon discarded because first tests indicated a too large operating voltage and an increase, with time, of the current absorbed by the detectors, maybe associated to an augmented production of impurities in the gas volume, with respect to the STD gas mixture Rigol .. The percentage compositions, in volume, of the gas mixtures used, and their GWP, are listed in Table 3. The ECO2 and ECO3 gas mixtures were designed to reduce the greenhouse gases emissions with respect to the STD gas mixture, and in fact they feature, respectively, a GWP of around 476 and 527, namely, roughly a factor three less than the STD mixture.
Note that the GWP of the gas mixtures, listed in Table 3, are computed, as prescribed in Europe , as the weighted average of the GWPs of the respective gaseous components, where the weights used for the average are their fractions in mass. This implies that the GWPs reported are meaningful only if one wants to compare the potential contribution to the greenhouse effect of equal masses of different gas mixtures.
However, as a matter of fact, the RPC detectors at the LHC are usually operated at constant fractions of gas volumes exchanges. Therefore, it is also useful to compute the carbon dioxide equivalent (CO2e) of one liter of the various gas mixtures considered, namely the amount (in grams) of CO2 that, if injected into the atmosphere, would contribute to the greenhouse effect for the same amount of the one liter of gas mixture considered. This CO2e is computed by calculating the amount (in grams) of the various gaseous components in one liter of the gas mixture, multiplying them for their respective GWP, and summing up. The CO2e values computed in this way are also reported in Table 3, and indeed show that the CO2e for one liter of ECO2 and ECO3 is around 4.5 times lower than the CO2e of one liter of STD mixture. Moreover, ECO2 and ECO3 mixtures feature similar values of CO2e because most of it is due to the emission of SF6, which is quite similar in the two cases.
| R134a (%) | HFO-1234ze (%) | CO2 (%) | i-C4H10 (%) | SF6 (%) | GWP | CO2e (g/l) | |
| STD | 95.2 | 4.5 | 0.3 | 1485 | 6824 | ||
| ECO2 | 35 | 60 | 4 | 1 | 476 | 1522 | |
| ECO3 | 25 | 69 | 5 | 1 | 527 | 1519 | |
| Density (g/l) | 4.68 | 5.26 | 1.98 | 2.69 | 6.61 | ||
| GWP | 1430 | 7 | 1 | 3 | 22800 |
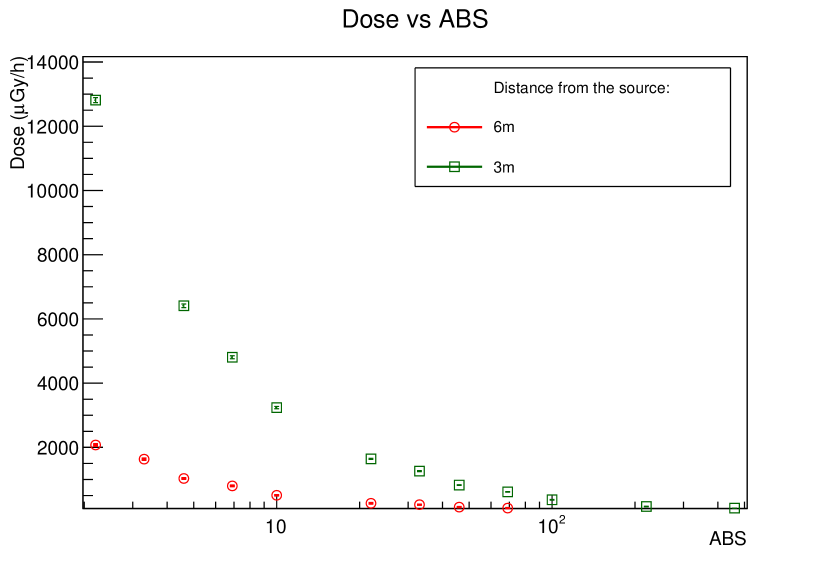
Due to the fact that the detectors under test were placed at different distances from the 137Cs source, different rates of photons were impinging on them, even when the same filter was placed in front of the source. On the other hand, meaningful comparisons across the various detectors are to be done at the same flux of impinging photons, therefore, using different filter configurations. This strategy could be actuated by using a dosimeter, mod. MIRION RDS-31iTx S/R dosimeter , with which the actual gamma ray dose at various positions inside the GIF++ irradiated area was measured. The measured doses at two positions, 3 and 6 m from the source, corresponding to the positions of the trolleys where the detectors were hosted, is shown in Figure 2, as a function of the ABS used. From the figure, it is clear that an increase in the ABS has the result of reducing the dose measured at a certain position and that, fixed the ABS, the dose measured reduces when moving away from the 137Cs source, as expected.
.
3 Experimental Results
Results from the tests described in this paper will be presented in two parts: first, the idea is to assess if the chambers, listed in the previous section, performed, without any irradiation from the 137Cs source, in similar ways when filled, in sequence, with the STD, ECO2 and ECO3 gas mixtures. For this purpose, in particular, chamber efficiency, current drawn, and cluster size will be examined.
The chambers efficiencies were measured requiring that the coincidence between the signals from the chambers under test and the trigger signal provided by the scintillators was in an acceptance time window of 20 ns. This guaranteed that accidentals, deriving from the random background of photons, constituted a negligible fraction with respect to the total amount of events acquired.
In order to easily compare data from different chambers, of different areas, here we will graph current density, obtained from the measured values of the absorbed current of the HV power supply channels connected to the chambers under test, and dividing it by the area computed using the dimensions reported in Table 1. It is a parameter important for estimating possible aging effects in these detectors.
Also, in order to compare data collected at different environmental conditions, efficiency and current density are plotted here as a function of a variable which we will denote as . This was computed from the actual voltage applied to the chambers using the following formula:
| (1) |
where is the atmospheric pressure and the temperature when the measure actually took place, and and are arbitrarily chosen reference values. Here we chose = 990 hPa and = 293.15 K, so that to be close to the average values of temperature and pressure actually measured at GIF++. This procedure is standardly followed in many gaseous detectors studies, and in particular for RPCs EffectiveVoltage .
The second part of the tests was intended to study the performance of the chambers when irradiated with the photons from the 137Cs source. Multiple ABS factors were used, causing hit rates in the RPCs up to several hundred Hz/cm2, and the measurements were repeated with the STD, ECO2 and ECO3 mixtures. For the sake of brevity, here we will report results obtained with just few (up to five) of the ABS settings actually used.
Note also that, often, we will not show the plots obtained from all the chambers under test, but just part of them. Unless otherwise specified, they are intended to be representative of the general behaviour of the chambers.
3.1 Chambers performance with no irradiation
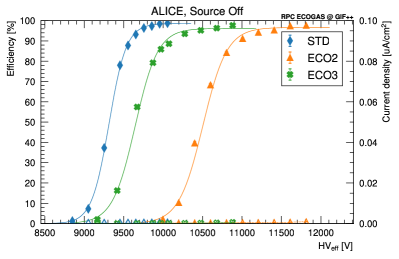
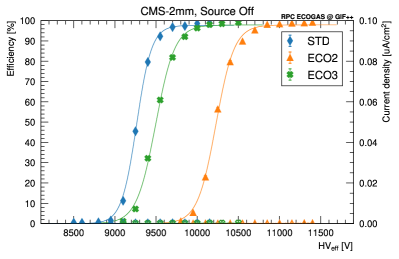
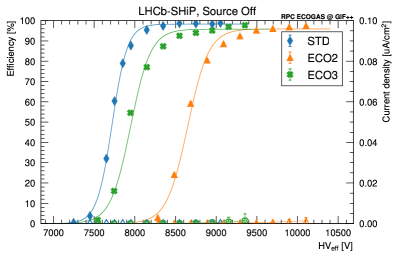
The efficiency and current density curves, measured without any irradiation, for the ALICE, CERN EP-DT, CMS and LHCb/SHiP detectors, filled, in sequence, with the STD, ECO2 and ECO3 gas mixtures, are shown as a function of in the panels of Figure 3. As it can be seen, all efficiency curves reach a plateau efficiency above 95%. The CMS chamber reaches higher efficiencies at lower voltage with respect to the chambers from ALICE and CERN EP-DT, due to the fact that it is a double-gap chamber, and signals from the two gaps add up on the same readout strips. This is also at the base of the fact that the transition from low to high efficiency, for the CMS chamber, is generally steeper with respect to the other devices. The chamber from LHCb/SHiP features the efficiency curves positioned at the lowest voltages, due to the fact that its gap is just 1.6 mm thick, while the others are 2 mm. In all cases, the efficiency curve for the ECO2 mixture is the rightmost one, featuring full efficiency above 11.5 kV for 2 mm gap RPCs.
Note that the current density measured with the CERN EP-DT chamber, is larger than the one measured with the other chambers; this is probably related to construction details and to the fact that this particular chamber was also used for other tests in the past.

For an easy comparison across the results obtained from the various chambers, the efficiency curves were fitted with a logistic function, of the form:
| (2) |
Fit parameters were the plateau efficiency (namely the asymptotic value of the logistic function fitted), the voltage at which the chamber efficiency reaches 50% of , denoted here as HV50, and the steepness of the curve, . From these parameters, we also extracted another parameter, indicated here as , which is the voltage at which the chamber efficiency reaches 95% of the plateau efficiency . , also briefly indicated as the "knee" of the efficiency curves, is a good indication of the optimal voltage for operating the chamber considered, and is given by the expression:
| (3) |
The values of all these parameters, obtained from the fit, for the detectors from ALICE, CMS, CERN EP-DT and LHCb/SHiP, and the three gas mixtures used, are reported in Table 4. In the same Table 4 also the current densities , as previously defined, measured at , with the various chambers, are listed. Results from the ATLAS chamber are not present in Figure 3 and Table 4, since this chamber was not used for these tests, but for charge measurements, as will be discussed later on in this section.
| Detector | Gas Mix. | (kV) | (kV) | () | (kV-1) | (nA/cm2) |
| ALICE | STD | 9.31 | 9.64 | 98.60.1 | 9.1 0.1 | 0.1480.001 |
| ALICE | ECO2 | 10.50 | 10.91 | 96.70.2 | 6.9 0.1 | 0.35 0.01 |
| ALICE | ECO3 | 9.64 | 10.07 | 96.20.2 | 6.9 0.1 | 0.10 0.01 |
| CMS | STD | 9.27 | 9.69 | 97.70.6 | 11.0 0.4 | 0.20.1 |
| CMS | ECO2 | 10.23 | 10.71 | 97.90.7 | 9.0 0.4 | 0.20.1 |
| CMS | ECO3 | 9.49 | 9.98 | 97.90.9 | 8.6 0.5 | 0.20.1 |
| EP-DT | STD | 9.42 | 9.79 | 97.30.1 | 8.0 0.1 | 2.250.04 |
| EP-DT | ECO2 | 10.64 | 11.18 | 96.90.2 | 5.40.1 | 6.30.4 |
| EP-DT | ECO3 | 9.79 | 10.29 | 95.60.2 | 5.80.1 | 7.70.1 |
| LHCb/SHiP | STD | 7.72 | 8.00 | 98.30.1 | 10.7 0.1 | 0 |
| LHCb/SHiP | ECO2 | 8.65 | 9.03 | 95.90.1 | 7.70.1 | 0.210.08 |
| LHCb/SHiP | ECO3 | 7.95 | 8.31 | 95.80.1 | 8.10.1 | 0.10.1 |
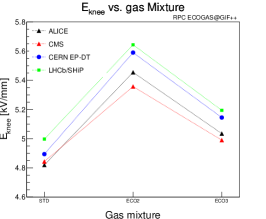
Using the data reported in Table 4 we can easily compare the performance of the various chambers when filled with the different gas mixtures examined. For comparison across chambers characterized by a different gas gap thickness , it is useful to refer to the electric field in the gas gap at the knee = /. With respect to the STD mixture, the ECO3 is characterized by a value of between 200 and 280 V/mm higher, while the ECO2 mixture by a value of between 650 and 700 V/mm higher. The increase of from STD to ECO2 is related to the replacement of TFE with HFO-1234ze, characterized, as already pointed out, by a lower first effective Townsend coefficient for the same electric field strength. The decrease of from ECO2 to ECO3 is due to the 10% larger percentage of HFO-1234ze in ECO2. values for the ALICE, CERN EP-DT, CMS and LHCb/ShiP chambers are shown in the left panel of Figure 4, where both these effects are clearly visible. It also shows that for the LHCb/SHiP chamber is the largest in this set, because of the reduced gas thickness available for amplification processes. The double gap layout is at the base of the lowest for the CMS chamber.
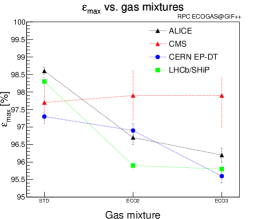
From the data shown in Table 4, it can also be noted that, as a general trend, the plateau efficiency decreases when passing from STD, to ECO2, and to ECO3 mixtures, namely when the fraction of CO2 in the gas mixture considered increases. In the last two cases, this effect might be related to the reduced number of primary ion-electron pairs produced by the impinging particles, as well as the increased distance among them. In fact, it is more evident for the RPC characterized by the thinnest gas gap here, from LHCb/SHiP, while is virtually not present for the CMS detector, because of the double gap layout and the consequent larger total thickness of the gas layers. is shown in the central panel of Figure 4, for the four chambers under test and the three gas mixtures considered.
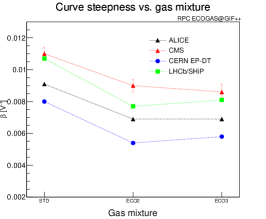
The steepness of the logistic functions fitted to the efficiency curves is shown in the right panel of Figure 4. As expected, steepness is larger for the chamber from CMS, because of the double gap configuration, and for the LHCb/ShiP chamber, because of the thinner gas gap, signalling in both cases a fast transition from zero to full efficiency. Moreover, the steepness of the efficiency curves of all the four chambers under test decreases, when using ECO2 and ECO3, with respect to the STD mixture, showing that the transition from low to high efficiency in these cases takes place more slowly. This is a hint of the fact that charge distributions for ECO2 and ECO3 are wider with respect to STD mixture, as it was experimentally verified and discussed in the following.
Charge distributions of the induced signals at were measured with the ATLAS chamber, using the digitizer it was equipped with, for the three gas mixtures tested, and are shown in Figure 5. In this case, a "finger" scintillator was put in front of the one readout strip, in order to select only events actually passing through it. A peak at the left end of the distributions is clearly visible, with an average charge of few pC, corresponding to the events where a Townsend avalanche developed in the gas gap, which is the case for most of them. Moreover, the horizontal scale is suitably calibrated in order to show also the presence, for ECO2 and ECO3, of a small fraction of events with a charge typically an order of magnitude larger than the one corresponding to avalanches in the same mixture. These events, however, are characterized by an average charge lower then streamers and are not delayed in time from a precursor as streamers usually are. Therefore they cannot be classified as streamers and fall in a somewhat intermediate category, whose properties need to be further investigated.

Basically, these results show that with respect to the STD gas mixture, the increased percentage of CO2 in the eco-friendly mixtures broadens the charge distributions and increases the fraction of signals at a larger charge. Vice versa, the fraction of these events is smaller for larger HFO-1234ze concentrations because the quenching properties of HFO-1234ze limit the transition probability from avalanches to streamers.
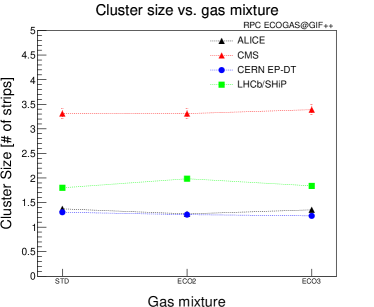
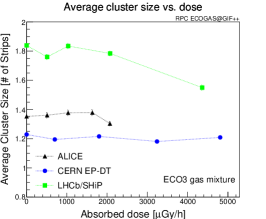
The average cluster size, intended as the average number of adjacent strips transmitting an over-threshold signal related to the passage of the same muon, is shown in Figure 6 for the detectors from ALICE, CMS, CERN EP-DT and LHCb/SHiP, and the three gas mixtures used. Values reported in the plot were measured at and are expressed in number of strips, this implying that they actually refer to different cluster physical dimensions. Moreover, the measured values depend on the amplifications and electronic thresholds used. Nevertheless, the cluster size stays approximately constant when passing from STD to ECO2 and ECO3 gas mixtures, indicating that spatial resolution is not significantly affected.
A similar behaviour has been verified for what concerns time resolution as well, which stays basically constant in the 12 ns range. Nevertheless, the technical layout used for the tests discussed in this paper does not allow a direct precise measure of such a parameter, which will be accurately measured in the ongoing tests.
3.2 Chambers performance when irradiated from the 137Cs source
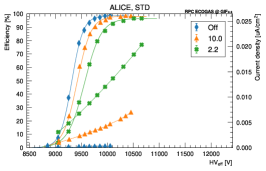
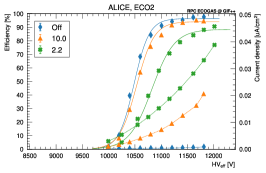
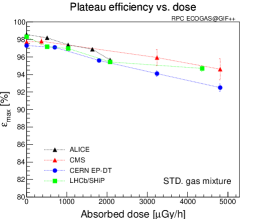
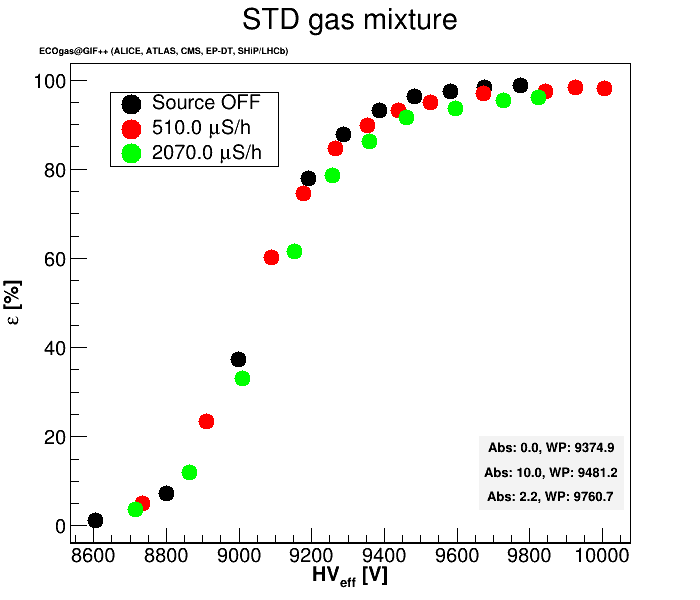
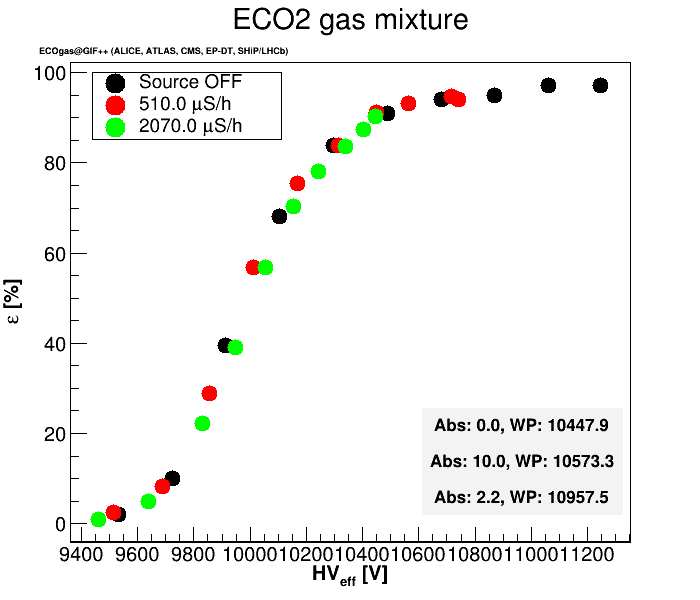
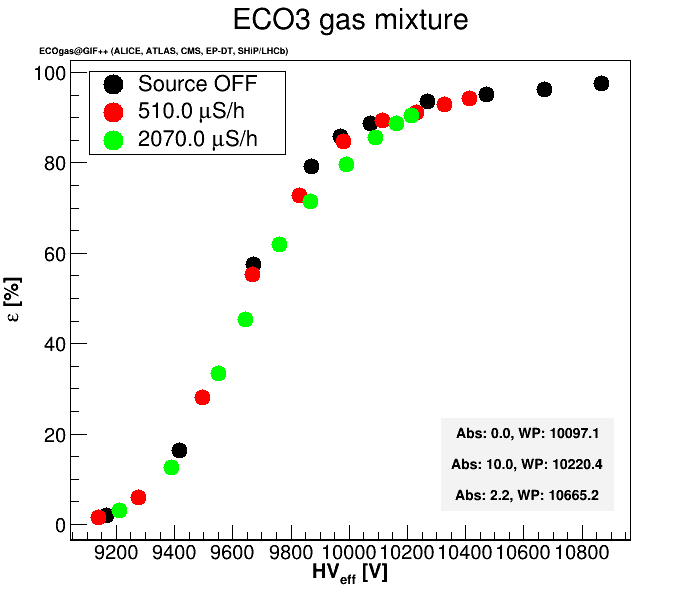
Efficiency and current density curves as a function of , obtained with the ALICE chamber, when subjected to irradiation from the 137Cs source, are plotted in Figure 7, and in particular, the left panel refers to the chamber filled with the STD gas mixture, central and right panels to the chamber filled with ECO2 and ECO3, respectively. Results reported here were taken using the absorption filters ABS = 10 and ABS = 2.2, which correspond to an absorbed dose on the chamber of 510 and 2070 Gy/h, as can be deduced from Figure 2 considering that the ALICE chambers was on the trolley at 6 m from the source. On the same plots, also results obtained without any irradiation are superimposed, for ease of comparison.

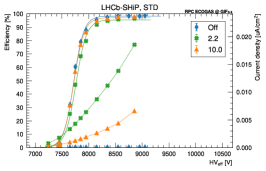

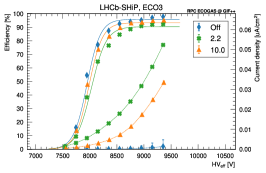
Similar plots were also obtained with the chambers from CMS, CERN EP-DT and LHCb/SHiP; for exemplification, only the ones using data collected with the LHCb/SHiP chamber are shown in Figure 8. Moreover, the efficiency data points resulting from these tests were fitted with a logistic function of the type described in Eq.(2), and the relative fit parameters extracted, analogously to what done and described in Section 3.1.
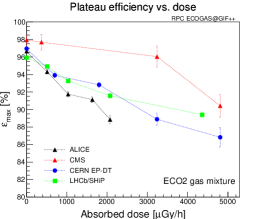
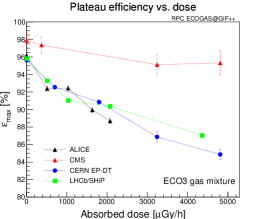
There are three basic aspects that can be inferred from the results reported in Figures 7 and 8, and the others from CMS and CERN EP-DT groups. The first is that, as a general trend, the plateau efficiency decreases when increasing the absorbed dose. In addition, this decrease appears to be larger when using ECO2 and ECO3 mixtures with respect to STD. , as obtained from the fit with the logistic function, versus the absorbed dose is shown for the four chambers under test in the three panels of Figure 9, and indeed shows this behaviour, which can be quantified with a 34 % drop in efficiency when passing from 0 to 5000 Gy/h using the STD mixture. This has to be compared to an around 10 % efficiency drop in the same conditions but using ECO2 and ECO3. Again the efficiency drop for the CMS chamber is relatively contained with respect to the others, due to the double gap configuration. Note that the ALICE chamber was tested only up to around 2000 Gy/h, given the lower maximum rate expected at the experimental site with respect to the other experiments.
The second aspect is that current densities , measured at , are generally larger when using ECO2 and ECO3 with respect to STD mixture. as a function of the absorbed dose is shown in Figure 10 for the four chambers under test and the three gas mixtures used. Since one could expect an approximately linear proportionality between current density and dose absorbed, a fit with a straight line has been superimposed to the data points, demonstrating this proportionality. Overall, the increase in when using ECO2 or ECO3 with respect to the STD gas mixture can be quantified in around a factor of two for the single gap chambers; for the CMS chamber this is much reduced, very likely due to the double-gap configuration. Note that the value of reported here for the CMS chamber is the average across the ones measured on the relative HV channels. The fact that, even without irradiation, current density for the CERN EP-DT chamber is not negligible has already been noted and commented in the previous Section. Finally, note that the different slopes in the lines plotted in Figure 10 denote that, as a matter of fact, the various chambers are operating with a different value of the average charge per count. This is related to the different configurations and front-end electronics used.
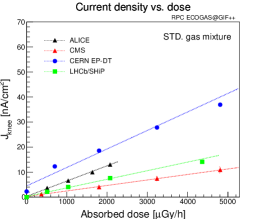

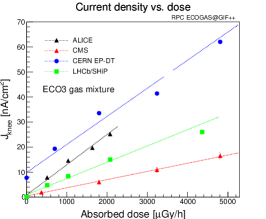
The increased observed can be related to the wider charge distributions shown in Figure 5 for ECO2 and ECO3, the presence of events characterized by a higher charge and, at the end, to the increased fraction of CO2 in ECO2 and ECO3.
In general, large currents are known to cause aging effects in RPCs, and should be avoided or, at least, limited. One possible solution could be, in principle, adding some iso-butane to the mixture used. Being an hydrocarbon with many vibrational and rotational degrees of freedom, iso-butane is known for its UV photon absorption capability and quenching properties and, in fact, is presently used in the gas mixtures for the RPCs of the LHC experiments exactly for this purpose. However, one has to be cautious about the maximum fraction of iso-butane usable, because the resulting mixture should be not flammable to be used at the LHC experiments, due to the flammability security limits. The exact fraction usable should be measured, with dedicated tests, since this depends not only on the percentage of iso-butane, but also on the other gases in the mixture and their relative fractions.
An increase in the fraction of SF6 would also probably help, for analogous reasons, in particular for its high attachment coefficient for the electrons in the Townsend avalanches, but, as already pointed out and reported in Table 3, this gas is characterized by a very high GWP, which would compromise the eco-friendly characteristics of these mixtures and, moreover, would push at too large operating voltages. These lines of reasoning is at the base of the gas mixtures composition optimization which led to the definition of the ECO2 and ECO3 mixtures tested.
The electric field in the gas gap at the knee, for the four chambers under test, is shown in Figure 11 as a function of the absorbed dose. The left panel shows data obtained with chambers filled with the STD mixture, central and right panels with ECO2 and ECO3, respectively.
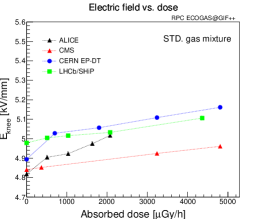

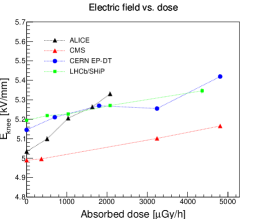
As expected, the shift of the efficiency curves toward higher operating voltages, observed in Figures 7 and 8 at increasing irradiation, reflects itself in increased values of at larger absorbed dose. This is a well known-effect, due to the intrinsic resistive nature of the electrodes in RPCs and the consequent voltage drop across them necessary to keep the current flowing from their outer to their inner surfaces. Basically, the voltage across the gas gap, , is lower than the applied voltage, the difference generally computed, in first approximation, applying the Ohm’s law. In the case of ECO2 and ECO3 mixtures, this drop is larger with respect to STD, due to the larger current densities involved. This might limit the chambers rate capability and, in fact, lower plateau efficiencies are observed with ECO2 and ECO3, as already pointed out and shown in Figure 9.
To check if the drop across the resistive electrode plates accounts for the observed features, the same efficiency curves of the ALICE chambers reported in Figure 7 are plotted in Figure 12 as a function of the voltage drop across the gas gap, namely , where is the total resistance across the HV electrodes, the current measured, and and are the bakelite resistivity and current density already introduced. Here a value for R was used, quite close to the resistance actually measured for the same chamber, in Autumn 2021, by filling it with Argon and measuring the slope of the current vs. applied voltage characteristic curve in its linear part. In fact, at high voltage, Argon behaves very much like a short circuit between the RPC electrodes. Indeed, as it can be seen from the figure, the curves roughly superimpose, supporting the hypothesis.
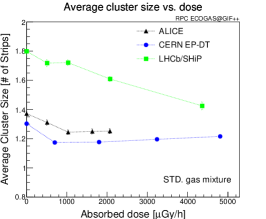
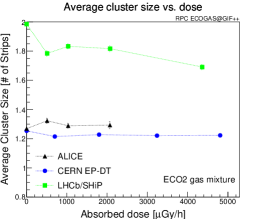
The muon average cluster size, as already defined, was measured under irradiation from the 137Cs source, and is shown in Figure 13 for the detectors from ALICE, CERN EP-DT and LHCb/SHiP, and the three gas mixtures used as a function of the absorbed dose. Again, values reported in the plot were measured at and are expressed in number of strips. ALICE and CERN EP-DT chambers feature a cluster size between 1.2 and 1.4 strips, while the cluster size measured with the LHCb/SHiP reaches around 2, due the reduced strip pitch in this case.
As a general trend, the average cluster size slightly decreases with increasing absorbed dose, following a behaviour similar to and, due, essentially, to the slightly lower electric field at across the gas gap. However, even at high irradiation, muon average cluster size remains essentially comparable across STD, ECO2 and ECO3 mixtures, demonstrating that this is not a critical issue for what concerns the new eco-friendly gas mixtures, and spatial resolution stays approximately constant when passing from STD to ECO2 and ECO3 gas mixtures.
Similar considerations can be done about time resolutions, which, as already been pointed out, was not possible to precisely measure during this beam test, and will be the subject of a thorough study in the near future.
The cluster counting rate, namely the number of clusters related to photons from the 137Cs per unit of area and unit of time, measured with the ALICE, CERN EP-DT, CMS and LHCb/SHiP chambers when operated at , is shown in Figure 14 as a function of the absorbed dose, for the same values used for the plots shown in Figures 9, 10, 11 and 13. Left panel refers to the chambers filled with the STD gas mixture, while central and right panels refer to ECO2 and ECO3. To be sure that these counts refer indeed to photons, they were counted out of the muon spill time.
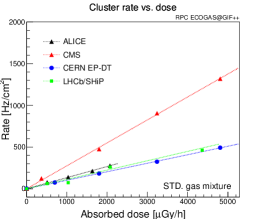
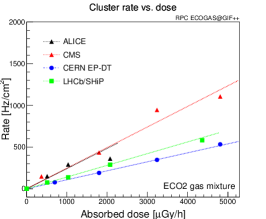
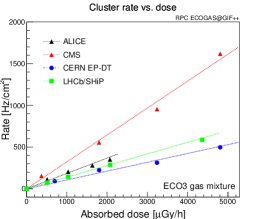
To guide the eye, a fit with a straight line constrained to pass through the origin is superimposed to the data points. Indeed, the expected direct proportionality of the cluster counting rate vs. absorbed dose is observed, with the largest fluctuations around this behaviour for the data taken with the chambers filled with the ECO2 mixture. Different slopes, namely different proportionality coefficients between cluster counting rate and dose are visible, and this implies that the measured counting rate, at the same ABS, changes depending on the chamber considered and the gas mixtures used to operate it. Actually, when inferring the counting rate from the absorbed dose, one has to consider the conversion probability of the impinging in the detector, whose exact value depends on the specific detector layout and materials, and the threshold of the electronics used. In addition, the doses measured at 3 and 6 m from the 137Cs source were considered and used in the graph, while the various chambers were not exactly at those distances from the source, as reported in Table 1. Finally, note that the efficiency at of the various chambers, at different doses and different gas mixtures, is not the same, and all these factors should be taken into account when comparing the data shown in Figure 14.
The measured rates range from few hundreds Hz/cm2 up to around 1.2 kHz/cm2, featuring in the range of the expected backgrounds in the RPC systems of the ALICE, ATLAS and CMS experiments during the LHC-HL phase. For LHCb, where the use of RPCs in the future is still under discussion, rates might be much higher, and this demands for additional tests.
4 Conclusions and Outlook
The adoption of eco-friendly gas mixtures in RPCs presents a promising avenue for reducing the environmental impact and carbon footprint of high energy physics experiments.
In this paper we have presented results obtained with eco-friendly gas mixtures, which could be used in the RPCs of the experiments at the LHC, replacing the one presently used, thereby significantly reducing the equivalent emission of CO2 in the atmosphere. Focus was put on two mixtures, conventionally labelled as ECO2 and ECO3, whose main components are HFO-1234ze and CO2 in various percentages (reported in Table 3), which substitutes TFE, being phased out because of its too large GWP.
Experimental studies have shown that RPCs operated with these eco-friendly gas mixtures exhibit comparable detection efficiency, spatial and timing resolution to those using conventional gas mixtures. In particular we have proved that the ECO2 and ECO3 can be used for multiple RPC detector configurations and front-end electronics, operating with an efficiency larger than 90% at a rate up to several hundreds Hz/cm2.
However, the performance obtained with STD, ECO2 and ECO3 are not exactly superimposable. At similar irradiation and efficiency conditions, ECO2 and ECO3 exhibit larger current densities with respect to the STD mixture. This finds its counterpart in the measured charge distributions, characterized, for ECO2 and ECO3, by longer tails of large charge events. This leads to a decrease in efficiency with ECO2 and ECO3, up to around 10%, at the highest rates tested here. For the rates expected during the HL-LHC phase in the RPC systems of the ALICE, ATLAS and CMS experiments, the efficiency drop ranges between 2 and 4%.
This is not an issue for what concerns detection and trigger capabilities for the existing RPC systems of the LHC experiments, even during the High Luminosity phase, but it could be important for what concerns detector aging. As a matter of fact, aging processes are driven by the amount of current flowing through the electrodes and, more importantly, the gas. Gas pollutants produced in the avalanche and streamer processes can sometimes damage the inner electrode surfaces, producing local alterations in the electric field and/or points where pollutants accumulate more rapidly than elsewhere.
If the increase in the current density observed with ECO2 and ECO3 is really an issue in this respect is an open question. That is the reason why the test described in this paper must be complemented by long duration aging tests, which are the main task that the RPC ECOGas@GIF++ collaboration is presently taking care of. We plan to keep the chambers under test at the GIF++ for several years, collecting data all the way along, and continuously monitoring the performance of the detectors, to check if any deterioration is observed or not. The high irradiation conditions at GIF++ present the advantage to accelerate the aging processes with respect to what will happen during the HL-LHC phase, allowing to draw significant conclusions even after a limited (one-two years) period of time. We plan to continue these test even after that period, in order to prove, hopefully, that aging with these eco-friendly gas mixtures is at negligible, predictable, levels. Results obtained on this important topic will be the subject of future publications.
Note that also other technical challenges need to be addressed, including the optimization of gas mixture composition, compatibility with RPC materials, and integration with existing systems. Therefore, continued research and development efforts are necessary to overcome these challenges, in order to ensure the successful implementation of eco-friendly gas mixtures in the RPC systems at the LHC experiments.
Also, in principle, other gases may exist, with better properties than HFO-1234ze when used in gaseous detectors for particle physics, but whose usage is limited in industry and therefore whose procurement is difficult, if not virtually impossible. Nevertheless, the situation could change in the future, due to different requirements to the market.
At another level, the search for eco-friendly gas mixtures in RPCs had also broader implications. It served as a catalyst for establishing a collaboration transversal to the LHC experiments, putting in common resources, fostering the exchange of ideas and sharing of best practises, experiences, and lessons learned. Through collaborative efforts and continuous innovation, the transition to eco-friendly gas mixtures in RPCs can serve as an exemplary model for sustainable scientific practices.
Data Availability Statement
Data are available under reasonable request to the authors of this paper.
References
- (1) ALICE Collaboration, Performance of the RPC-based ALICE muon trigger system at the LHC, 2012, JINST 7 T12002, https://doi.org/10.1088/1748-0221/7/12/T12002
- (2) ATLAS Collaboration, Technical Design Report for the Phase-II Upgrade of the ATLAS Muon Spectrometer, CERN-LHCC-2017-017, CERN, 15th December 2017
- (3) CMS collaboration, 2013, The performance of the CMS muon detector in proton-proton collisions at = 7 TeV at the LHC, 2013, JINST 8 P11002
- (4) LHCb Collaboration, Framework TDR for the LHCb Upgrade II, CERN-LHCC-2021-012, LHCb TDR 23
- (5) Council of European Union, Regulation (EU) No 517/2014 of the European Parliament and of the Council of 16 April 2014 on fluorinated greenhouse gases and repealing Regulation (EC) No 842/2006 Text with EEA relevance (2014), https://eur-lex.europa.eu/legal-content/EN/TXT/?uri=CELEX%3A32014R0517
- (6) D. F. Bartlett et al., Afterpulses in a Photomultiplier Tube poisoned with Helium, FERMILAB-PUB-80-121-E (1980), https://inspirehep.net/files/39c7943c1cb99733c663ebadcfe23de8
- (7) J. Incandela et al, The performance of photomultipliers exposed to Helium, Nuclear Inst. and Methods in Physics Research, A 69 (1988) 237-245
- (8) Young, C. J. et al., Atmospheric Perfluorinated Acid Precursors: Chemistry, Occurrence, and Impacts, Rev. Environ. Contam. T., 208, 1–109, 2010.
- (9) George, C. at al., Kinetics of mass transfer of carbonyl fluoride, trifluoroacetyl fluoride, and trifluoroacetyl chloride at the air/water interface, J. Phys. Chem., 98, 10857–10862, https://doi.org/10.1021/j100093a029, 1994.
- (10) L. M. David et al., Trifluoroacetic acid deposition from emissions of HFO-1234yf in India, China, and the Middle East Atmos. Chem. Phys., 21, 14833–14849, 2021, https://doi.org/10.5194/acp-21-14833-2021
- (11) X. Fan et al., Precise measurement of gas parameters in a realistic RPC configuration: The currently used R134a gas and a potential alternative eco-gas, Nuclear Inst. and Methods in Physics Research, A 1024 (2022) 166124, https://doi.org/10.1016/j.nima.2021.166124
- (12) A. Bianchi et al., Characterization of tetrafluoropropene-based gas mixtures for the Resistive Plate Chambers of the ALICE muon spectrometer, 2019, JINST 14 P11014, https://doi.org/10.1088/1748-0221/14/11/P11014
- (13) B. Liberti et al., Further gas mixtures with low environment impact, 2016, JINST 11 C09012, https://doi.org/10.1088/1748-0221/11/09/C09012
- (14) CMS Collaboration, The Phase-2 Upgrade of the CMS Muon Detectors, CERN-LHCC-2017-012, CMS-TDR-016
- (15) R. Guida et al., Performance studies of RPC detectors with new environmentally friendly gas mixtures in presence of LHC-like radiation background, Nuclear Inst. and Methods in Physics Research, A 958 (2020) 162073, https://doi.org/10.1016/j.nima.2019.04.027
- (16) R. Albanese et al., RPC-based Muon Identification System for the neutrino detector of the SHiP experiment, 2023, JINST 18 P02022, https://doi.org/10.1088/1748-0221/18/02/P02022
- (17) https://aidainnova.web.cern.ch/wp7"
- (18) R. Guida on behalf of the EN, EP, AIDA GIF++ collaborations, GIF++: A new CERN Irradiation Facility to test large-area detectors for the HL-LHC program, Proceedings of Science, prepared for ICHEP2016 (2016), 260
- (19) G. Rigoletti et al., Studies of RPC detector operation with eco-friendly gas mixtures under irradiation at the CERN Gamma Irradiation Facility, Proceedings of Science (EPS-HPE2019) 164
- (20) R. Margraf et al., Muon Beam Studies in the H4 beam line and the Gamma Irradiation Facility (GIF++), CERN-ACC-NOTE-2018-0029, https://cds.cern.ch/record/2310593/files/CERN-ACC-NOTE-2018-0029.pdf
- (21) D. Pfeiffer et al., The radiation field in the Gamma Irradiation Facility GIF++ at CERN, Nuclear Inst. and Methods in Physics Research, A 866 (2017) 91-103, https://doi.org/10.1016/j.nima.2017.05.045
- (22) https://www.mirion.com/products/rds-31-modular-radiation-survey-meter"
- (23) M. Abbrescia et al., Resistive Plate Chambers performances at cosmic ray fluxes, Nuclear Inst. and Methods in Physics Research, A 359 (1995) 603-609, https://doi.org/10.1016/0168-9002(94)01698-4
- (24) A. Fagot, Consolidation and extension of the CMS Resistive Plate Chamber system in view of the High-Luminosity LHC Upgrade, Thesis in fulfillment of the requirements for the PhD in Physics, Academic year 2019-2020, University of Ghent.
- (25) P. Dupieux et al., Upgrade of the ALICE muon trigger electronics, 2014, JINST 9 C09013
- (26) M. Abbrescia et al., New developments on front-end electronics for the CMS Resistive Plate Chambers, Nuclear Inst. and Methods in Physics Research, A 456 (2000), 143-149
- (27) NIST Chemistry WebBook, the NIST Standard Reference Database Number 69, https://webbook.nist.gov/chemistry/", retreived on April 2, 2023