IKERBASQUE-Basque Foundation for Science, Plaza Euskadi 5, Bilbao, 48009 Spain. \alsoaffiliationInstitut Laue-Langevin, 71 Avenue des Martyrs, 38042 Grenoble, France
Softness Matters: Effects of Compression on the Behavior of Adsorbed Microgels at Interfaces
Abstract
Deformable colloids and macromolecules adsorb at interfaces, as they decrease the interfacial energy between the two media. The deformability, or softness, of these particles plays a pivotal role in the properties of the interface. In this study, we employ a comprehensive in situ approach, combining neutron reflectometry with molecular dynamics simulations, to thoroughly examine the profound influence of softness on the structure of microgel Langmuir monolayers under compression. Lateral compression of both hard and soft microgel particle monolayers induces substantial structural alterations, leading to an amplified protrusion of the microgels into the aqueous phase. However, a critical distinction emerges: hard microgels are pushed away from the interface, in stark contrast to the soft ones, which remain steadfastly anchored to it. Concurrently, on the air-exposed side of the monolayer, lateral compression induces a flattening of the surface of the hard monolayer. This phenomenon is not observed for the soft particles as the monolayer is already extremely flat even in the absence of compression. These findings significantly advance our understanding of the pivotal role of softness on both the equilibrium phase behavior of the monolayer and its effect when soft colloids are used as stabilizers of responsive interfaces and emulsions.
1 Introduction
Colloidal particles and macromolecules are known to reduce interfacial energies, allowing them to be confined at the interface of immiscible liquids 1. This property has been extensively utilized to stabilize emulsions, employing surfactants 2, proteins 3, and polymers 4. Microgel particles can be used in Pickering emulsions as they are stabilized by rigid colloidal particles protruding into both hydrophobic and hydrophilic phases 5, 6, 7.
Polymer crosslinked particles, i.e., microgels, are also often used to realize Pickering-like emulsions which can be broken on demand by changing external stimuli such as temperature or pH 8, 9, 10. Unlike hard colloids, microgels exhibit significant deformations upon adsorption 11, 12, and their protrusion in the two sub-phases is sensitive to their softness 13. Moreover, the diverse compressibility within their volume gives rise to intriguing phase behavior, including the formation of different hexagonal lattices 14. In this framework, mechanical and visco-elastic properties of air-water and oil-water microgel-covered interfaces have been investigated by means of interfacial rheology and surface pressure measurements to determine how microgel conformation, packing and film stability change in response to compression 15, 16, 17, 18. In accordance with the terminology from our recent works, we name microgels prepared with low cross-linker content as ‘soft’ and those with high cross-linker content, having a bulk modulus two orders of magnitude larger than the ultra-low crosslinked microgels 19, as ‘hard’.
Softness is known to strongly affect the properties of microgels at interfaces, such as the formation of crystalline lattice, the contact angle they form and the final architecture they assume once adsorbed 12. The softest pNIPAM-based microgels that can be synthesized by precipitation polymerization are the so-called ultra-low crosslinked (ULC) microgels 20, 21. They exhibit properties that lie between those of hard particles and linear polymers 22, 13. Their unique characteristics become particularly important in emulsion stabilization, allowing the formation of stable emulsions with properties in between those stabilized with macromolecules and those stabilized by responsive hard microgels 23.
Very recently, it was demonstrated that the limited deformability of soft microgels is key for the formation of stimuli-responsive emulsions 24. The study also indicated that changes in the in-plane dimension of the microgels above and below the VPT temperature cannot be responsible for emulsion destabilization. Therefore, changes in the vertical structure of the microgel monolayers are pivotal for droplet stability and resistance against flocculation and coalescence interfacial behavior. However, the experimental technique utilized by the authors did not prove the vertical distribution of the microgels under external stimuli since the observations were based on cryo-scanning electron microscopy (cryo-SEM).
Recent interfacial measurements of microgels highlighted that they also share common properties with proteins and antibodies confined at air-water and oil-water interfaces 25. For instance, antibody monolayers show similar values of the elastic modulus compared to hard microgels 26 and, in both cases, the elastic properties of the monolayer are related to particle deformation and interaction upon adsorption suggesting similarities in the microscopic structures of microgels and bio-molecules at interfaces27.
Hard and soft colloids at the interface are also often used as model systems to study fundamental problems, such as those related to two-dimensional crystallization. For instance, hard particles at the air-water interface have been used to investigate melting and self-diffusion, in two dimensions, of neutral and charged hard spheres 28, 29, 30. Similarly, soft colloids have been instrumental in exploring the polymer-to-particle duality 22 and understanding the impact of particle softness and deformability on the phase behavior of soft spheres in two dimensions at rest 14, 31, 32, 12 and under flow 18.
To better understand both the monolayer interfacial phase behavior and the stability of the microgel-covered interface, one must consider not only the in-plane structure of the microgel but also how the out-of-plane morphology of these particles responds in different liquid (water and oil) and gas (air) phases.
Traditional techniques for characterizing the out-of-plane profile of microgels at interfaces rely on ex situ analysis, involving monolayer deposition on solid substrates followed by methods like atomic force microscopy (AFM) 33, 34, and cryo-transmission electron microscopy (cryo-TEM) or regular TEM 35, 36. However, these approaches lack the capability to study the in situ properties of the monolayer, making it challenging to investigate dynamic responses to external conditions like compression forces or temperature changes. Furthermore, the transfer of a microgel monolayer from a fluid interface to a solid substrate might introduce artifacts, raising concerns about the reliability of observed solid-to-solid isostructural phase transitions 37, 38.
Among surface-sensitive techniques, neutron reflectometry (NR) can be used to determine the out-of-plane profile of the microgels orthogonal to the interface and to assess their volume fraction in situ 39, 13. In this work, by combining NR, surface pressure measurements, and computer simulations, we comprehensively describe the out-of-plane behavior of microgel monolayers under compression at the air-water interface.
To probe the effect of softness, 5 mol% crosslinked microgels 13 (for simplicity named as hard’ microgels) and ultra-low crosslinked ones 13 (referred as soft’ microgels) are used. NR experiments are performed on a null-reflecting interface using partially deuterated polymers to highlight the structural changes taking place at the nano-scale in the microgel Langmuir monolayer upon compression. Furthermore, computer simulations are exploited to evaluate the structural changes taking place upon lateral compression for in silico microgels synthesized at different cross-link contents 40.
Our results show that despite similar surface elasticity of hard and soft monolayers, upon compression hard microgels are pushed further away from the interface, with a significant decrease in their protrusion in air and the formation of a thicker polymer-dense phase in water. In contrast, soft microgels remain anchored at the interface: an increase in the density of the microgels in water is observed but at the same time, their protrusion in air is not affected by compression and remains constant and limited to few nanometers.
2 Experimental
2.1 Synthesis
Deuterated 5 mol% crosslinked and ultra-low crosslinked microgels measured here are the same as those investigated in our previous study at the water interface 13.
Precipitation polymerization was used to synthesize deuterated regular 5 mol% crosslinked microgels. 1.5072 g of a NIPAM monomer with 7 hydrogen atoms substituted by deuterium (D7-pNIPAM, [C6D7H4NO]n) was added to 0.1021 g of N,N’-methylenebisacrylamide (BIS, crosslinker agent), and 20.2 mg of sodium dodecyl sulfate (SDS) and dissolved in 83 mL of filtered double-distilled water. The solution was heated to 60 ∘C under constant stirring while purged with nitrogen for 1 h. The reaction was started by rapid addition of the initiator, a degassed solution of 37.1 mg of potassium peroxydisulfate (KPS) in 5 mL water. The reaction continued for 4 h under constant stirring before temperature was lowered to room temperature.
Deuterated ultra-low crosslinked (ULC) microgels were obtained without the addition of any crosslinker agent from free radical precipitation polymerization of D3-NIPAM (C6D3H8NO) 21. Briefly, the monomer solution consisted of 70 mmol/L of D3-NIPAM and 1.2 mmol/L SDS in water. The reaction solution was purged with nitrogen under stirring at 100 rpm and heated to 70 ∘C. At the same time, a solution of KPS (1.6 mmol/L in the reaction solution) was degassed. To initiate the reaction, the KPS solution was then transferred into the monomer solution. The reaction proceeded for 4 hours under constant stirring at 70 ∘C before being stopped by decreasing the temperature to room temperature.
Both microgels were purified by threefold centrifugation and lyophilization was applied for storage. The choice of using deuterated microgels was made to increase the signal originating from the particles at the air-water interface during NR experiments.
2.2 Monolayer preparation and compression
All measurements were performed at the air-liquid interface.
For neutron reflectometry measurements, a temperature-controlled PTFE Langmuir trough equipped with a single PTFE movable barrier (Kibron, Finland) was used as sample environment. Surface pressure was measured and monitored continuously using paper Wilhelmy plates.
By moving the PTFE barrier, the trough area could be varied from 160 cm2 to 70 cm2, being the smaller value defined by instrumental constraints such as the footprint of the neutron beam and the presence of the pressure sensor.
Before and between measurements on different samples, the trough was cleaned and a fresh interface created.
The liquid phase consisted of a mixture of MilliQ-grade H2O and D2O (91.9:8.1, v/v), known as air contrast matched water (ACMW), which has a scattering length of zero (equal to that of air) and provides no contribution to the specular reflectivity 41.
Using this approach, reflectivity originated only by the microgel particles localised at the interface.
Microgels dissolved at a concentration of 1 mg mL-1 in deuterated chloroform were spread drop-wise at the air-water interface with a Hamilton syringe.
The Langmuir monolayer was then compressed to the desired surface pressure and reflectivity was measured.
The measured surface pressure ranged from 1 to 30 mN m-1, but the entire interval could not be probed by a single compression. Therefore, different initial amounts of the microgel solutions were spread onto fresh interfaces to reach all measurement points.
The temperature was set to T = 20 0.5 ∘C.
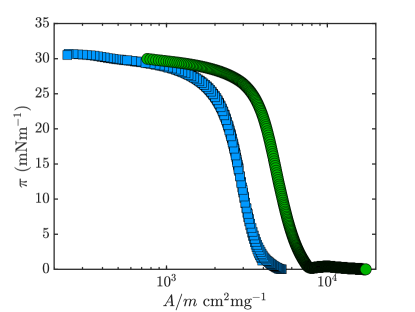
Compression isotherms (Fig. S1) were measured to probe the mechanical response of the monolayers. From the curves (being the area normalised by the amount of microgel), the surface compression modulus (also called surface Gibbs elasticity) was calculated as 42
| (1) |
2.3 Neutron reflectometry
NR measurements have been performed using the time-of-flight Fluid Interfaces Grazing Angles Reflectometer (FIGARO) at the Institut Laue-Langevin (ILL) in Grenoble, France 43. Briefly, reflectivity , i.e., the ratio between the number of reflected and incident neutrons, is measured as a function of the exchanged wave-vector and, to a first approximation, it is proportional to the Fourier transform of the first derivative of the scattering length density (SLD) with respect to , which is the distance, in the perpendicular direction, from the horizontal plane defined by the air-water interface.
Since the SLD depends on the type of nuclei present in the sample, from the analysis of NR data, it is possible to determine the sample structure and the volume fraction profiles (along ) of its components.
The range of interest was covered using two configurations with the incoming beam wavelengths between 2 and 20 Å at two different angles of incidence, namely : 0.615∘ and 3.766∘. The resolution was set to 7% for all the measurements and the footprint of the neutron beam at the sample position was kept constant at 1 4 cm2. Reflected neutrons were collected on a bi-dimensional 3He detector and converted to reflectivity curves by using the COSMOS routine provided by the ILL 44.
2.4 NR data modeling
The main objective of NR data analysis was to accurately represent the projection of the microgel volume fraction profile () along the vertical axis (). It is well-known that individual microgel particles in the swollen state in solution can be described using the fuzzy sphere form factor 45 characterized by a Gaussian-like decay of the radial polymer distribution in the shell region. On the contrary, microgel particles do not maintain a spherical shape when adsorbed at an interface, either in dilute or crowded conditions 46, 11, 12 and their interactions with the neighbouring particles in the monolayer can induce further deformations. This, together with the presence of internal regions (core and shell) characterised by different polymer concentration, and therefore softness 47, makes it challenging to develop an analytical model able to accurately describe the particle morphology at an interface. Moreover, given the large size of swollen microgel particles with respect to the typical distances probed by neutrons in NR experiments, the use of the common representation of the monolayer in terms of a finite number of slabs 48 might not be sufficient to quantitatively describe the changes taking place in the microgel volume fraction profile (VFP) under compression.
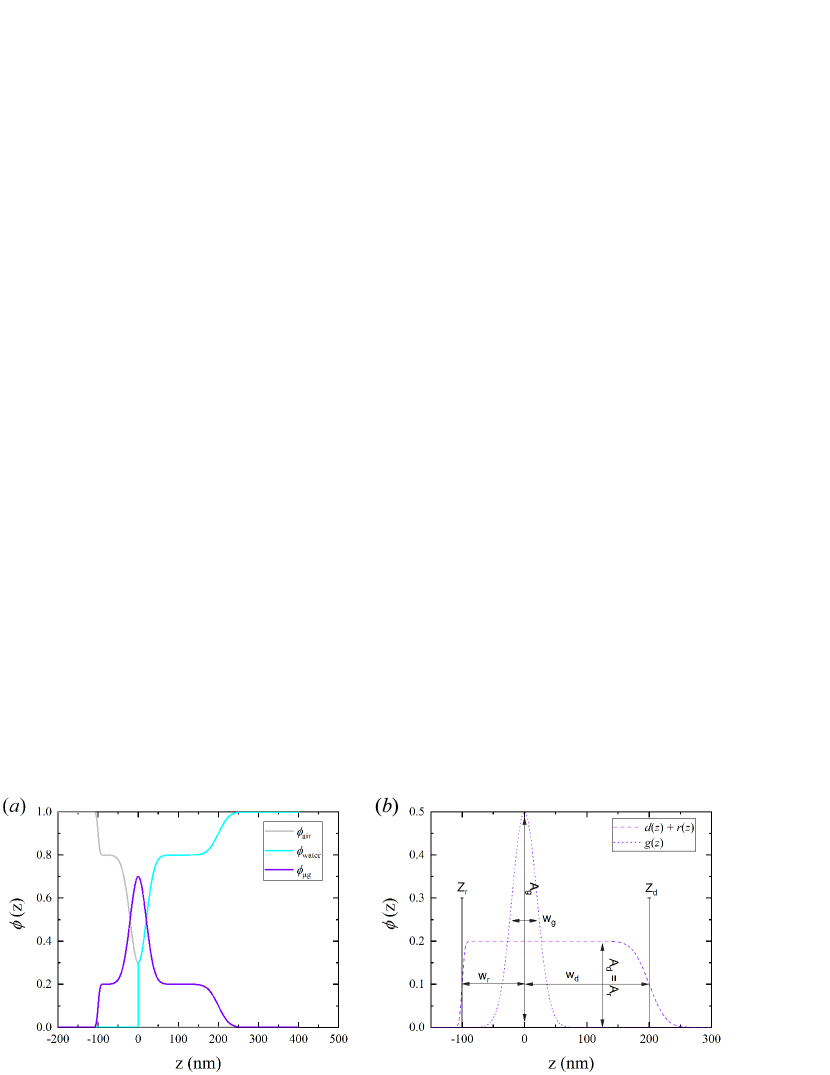
In this work, these limitations are circumvented by using a phenomenological description of the projection of the microgel volume fraction profile orthogonal to the interface. Based on previous experimental and computational evidences 13, a microgel monolayer is characterised by a denser region at the interface ( nm), modeled in our approach by a Gaussian peak (Eq. S1), and by two regions, in water and in air, with lower polymer density that also gradually decreases to zero moving away from the interface. These two regions, called protrusions in the manuscript, are modeled using error functions (Eq. S2 and Eq. S3). As detailed in the Supporting Information material, the width, the position along and the amplitude of the error functions, as well as the position along , width and amplitude of the Gaussian peak are the model parameters optimised during data analysis. The VFPs of air and water phases, namely and (Eqs. S4 and S5), are described using error functions centered at with a fixed width of 0.3 nm, matching the expected surface roughness due to capillary waves in a free water surface at ambient pressure and temperature 49. Generic VFPs for air, water and microgel layer are shown in Fig. S2 in the Supporting Information material. The total SLD profile was computed by multiplying each VFP contribution by the respective material SLD value as
| (2) | |||||
In the present study, by using ACMW as liquid phase (), Eq. 2 was simplified to , where is the SLD value for the microgel determined experimentally by means of small angle neutron scattering, namely Å-2 for D3-pNIPAM 50 and Å-2 for D7-pNIPAM 51, respectively.
As detailed in the literature52, reflectivity curves can be computed from an SLD profile by dividing the latter into a large number of finite-size slabs with zero interfacial roughness, which are then used as input for algorithms based on the Parratt’s formalism 53 or on the Abeles matrix method 54. In the present case, calculation of SLD profiles and of reflectivity curves was performed using algorithms, based on the Parratt’s formalism, present in the Aurore software application 55 and the computed reflectivity was then fitted to the experimental data using a least squares minimization approach. During this step, the smearing effect due to the instrumental resolution as well as the presence of a flat background were taken into account. This iterative procedure led to the optimization of the parameters characterising the microgel VFP.
2.5 Numerical section
2.5.1 Modeling and interaction potentials
In silico microgels are designed to reproduce in a coarse-grained manner a standard PNIPAM network. In the presence of BIS acting as crosslinking agent, we assemble the network by exploiting patchy particles with two and four patches, representing monomers and crosslinkers, respectively. We focus on microgels with c=5% of crosslinkers as in experiments, using a total number of particles and . Four patches particles also experience an additional design force to concentrate them more in the center of the network56. The spherical shape of the microgel is obtained by applying a spherical confinement of radius , with the unit of length in simulations and the size of each particle. For a fast assembly, we make use of the oxdna simulation package 57 on GPU processors. As already reported in our previous work 13, for the ULC microgels, we use the same approach based on patchy particles, but the fraction of crosslinkers, amounting to self-crosslinks among PNIPAM monomers, is equal to c=0.3%, as estimated from a comparison with experimental data in Ref. 58. In this case, we use and a much lower network density, with the spherical confinement taking place in a sphere of radius . More details on the assembly protocol and on the interaction potentials for patchy particles can be found in Refs. 59, 56, 13, 58.
Subsequently, for preserving the topology of the assembled patchy particles, each link is substituted with a permanent bond as in the Kremer-Grest bead-spring model for polymers. In this way, all beads interact via the Weeks-Chandler-Anderson (WCA) potential
| (3) |
with setting the energy scale and the distance between two particles. Connected beads also interact via the Finitely Extensible Nonlinear Elastic (FENE) potential,
| (4) |
with which determines the stiffness of the bond and is the maximum bond distance.
To study in silico microgels at an interface, we then make use of explicit solvent particles. These are treated as soft beads within the dissipative particle dynamics (DPD) framework 60, 61. Therein, the total interaction force among beads is , where:
| (5) | |||||
| (6) | |||||
| (7) |
As from previous works 62, 63, we set , , for the interactions between fluid 1 and fluid 2. Instead, for the monomer-solvent interactions, and , making fluid 1, representing water, the preferred phase. The cut-off radius was always set to be , the reduced solvent density .
2.5.2 System setup and simulation details
For the microgels with c=5%, we create a monolayer of microgels with monomers by disposing twelve of them in a rectangular simulation box with periodic boundary conditions. We first let the system equilibrate at low densities in the presence of explicit solvent, so that the particles acquire the characteristic “fried-egg” shape that they usually retain at a fluid interface. We then progressively reduce the size of the simulation box in the and directions, leaving unaltered the direction, perpendicular to the plane of the interface, and keeping constant the solvent density.
We also perform compression runs of single microgels of larger size ( beads for c=5% and beads for ULC ones) by imposing an external force of cylindrical symmetry, with as the main axis. In this way, all the monomers experience a harmonic force with if , where is the distance from the monomer to the center axis of the cylinder, is the equilibrium radius of the cylinder and is the intensity of the force. Solvent beads are not subjected to . The increased size of ULC microgels in simulations makes it unfeasible with present computational resources to run multiple microgels or larger system sizes for the single ones, due to the larger box size filled with solvent molecules.
Simulations are run in the NVT ensemble fixing the reduced temperature of the system via the DPD thermostat, and they are performed with lammps 64. In all cases, we record the microgel density profile , that is obtained by dividing the simulation box along the axis into three dimensional bins that are parallel to the interface. For the case of the microgel monolayer, we measure for each microgel and then average it over all particles.
3 Results
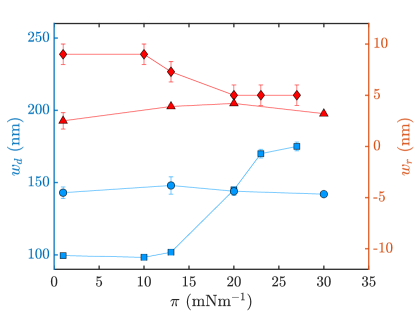
The surface compression modulus was calculated using Eq. 1 from the compression isotherms shown in Fig. S1. Its dependence on the surface pressure is shown in Fig. 1 for both hard and soft microgel monolayers. During the compression, the elasticity of both monolayers first increases, up to a maximum of 49 3 mN m-1 for surface pressure in the range 12 - 16 mN m-1, then it decreases down to zero as approaches 30 mN m-1. The maximum elasticity occurs at slightly higher surface pressure for the soft microgel monolayer (circles), namely at 14.4 mN m-1 versus 13.0 mN m-1 for the hard particles (squares).
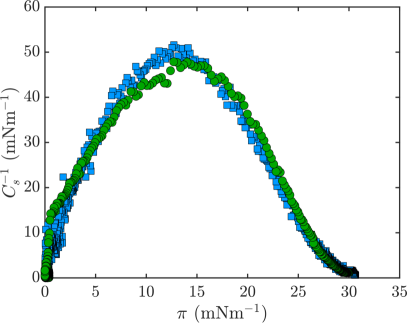
This behavior is similar to what was reported by Picard et al. 65 and Pinaud et al. 11 for pNIPAM monolayers at the air-water and at the oil-water interface respectively, using particles with cross-linker concentration varying from 1 mol% 65 to 5 mol% 65, 11. In both studies, the authors attributed the maximum surface elasticity to the flattened conformation of the microgel particles at the interface. Despite the similar trend of , the structure and arrangement of the hard and soft monolayers investigated in this study are different and may play a critical role in their overall behavior at the interface.
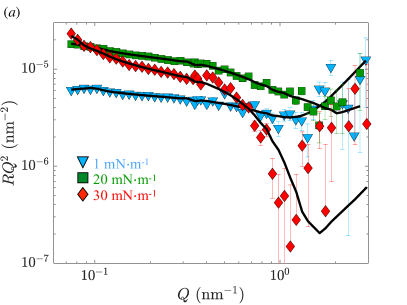
Fig. 2(a) shows the measured reflectivity, , (symbols) for the hard microgel monolayer measured using ACMW as liquid phase and deuterated (D7-pNIPAM) microgel particles along with the model curves obtained from the data analysis (lines). Data are shown on a scale to highlight the oscillations present in the entire -range investigated. The experimental data were collected upon compression of the monolayer at surface pressure values indicated in the figure legend.
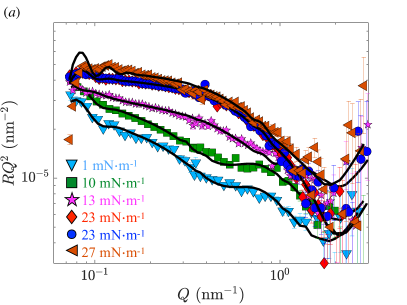
At first glance, it is evident that reflectivity increases from the lowest (represented by down-side triangles) to the highest levels of applied compression (indicated by circles and left-side triangles). This rise in reflectivity can be attributed to the increased polymer content within the area illuminated by the neutron beam, resulting from the lateral movement of the trough barriers. Notably, in the very low- regime, changes in reflectivity are of a similar order of magnitude as the changes in the illuminated area. However, it is important to note that it is challenging to establish a precise proportionality between these values due to their dependence on the formation of a film. For the -range examined, this film cannot be considered extremely thin and leads to the presence of fringes in the reflectivity 66.
In addition to changes in overall intensity, the shape of the experimental curves also changes in response to monolayer compression, indicating variations in and, consequently, in SLD. The analysis of NR data, performed using the model described in the Supporting Information and summarised by Eq. 2, allowed us to determine the microgel volume fraction in the direction orthogonal to the interface, (Fig. 2(b)). The chosen model effectively replicates the experimental data across the entire -range investigated and accurately captures fringes, common for thick films, visible at low-.
The value of at the interface is given by (amplitude of the peak function and of the error functions respectively) as indicated in the schematic volume fraction profile reported in Fig. S2(b). It first increases from ( mN m-1) to ( mN m-1). This indicates the formation of a hydrated microgel monolayer and an increase in the number of microgel particles exposed to the neutron beam. With further compression of the monolayer, slightly decreases to , suggesting a possible rearrangement of the polymer chains being pushed away from the surface.
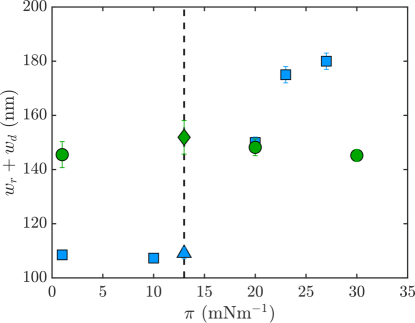
As described in the Supporting Information, the full extension of the microgel across the interface is given by ; it remains almost constant at nm for surface pressures in the range mN m-1, while it continuously increases for larger compressions, reaching nm at mN m-1 (blue symbols in Fig. 3).
Although the most significant changes in occur in the water phase, the model also accurately captures the differences in the protrusion of the microgel into the air phase (represented by ). Notably, measurements on the microgel protrusion in hydrophobic phases are limited in the literature and are commonly conducted using freeze-fracture shadow-casting cryo-SEM 46, 35, 62, 32, a technique that requires freezing and fracturing of the interface, actions that might not preserve the original monolayer properties 37. Only recently, the shape of microgel particles at a fluid oil-water interface was characterised by AFM 67. In the inset of Fig. 2(b), it can be observed that the microgels, upon initial interaction, protrude approximately nm into the air, a value comparable to what was previously reported by Bochenek et al. 13. As compression is increased, the microgels are pushed away from the air, leading to a decrease in their protrusion to nm (solid triangles in Fig. S3). It is important to note that, as illustrated in Fig. S2, the protrusion is defined by the inflection point in the error function that describes the rise of the volume fraction profile. When the stretching parameter is large, the profile extends further into the air phase, as is evident in Fig. 2(b) for the hard microgels at low compression.
As already mentioned and also reported in the literature 23, the elastic response to compression of an ultra-low cross-linked microgel monolayer is virtually the same as that of a hard microgel monolayer in the pressure range investigated in the current work. However, NR measurements indicate substantial differences in the organisation and deformation of soft microgel particles at the interface.
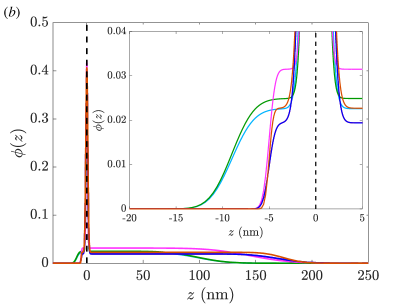
The NR curves in Fig. 4(a) show that the reflectivity measured for the soft microgel monolayer is generally lower than that measured for their hard counterpart at the same (or very similar) surface pressure values, leading to NR data characterised by a lower S/N ratio. This difference is mainly due to the fact that ultra-soft microgels consist of less polymer 22 and that deuteration was performed only for three 1H atoms instead of seven. Since reflectivity is proportional to the square of the contrast, a significant amount of soft microgel particles at the interface would be necessary to achieve a reflectivity of the same order of magnitude as that measured for the hard microgel particles. Therefore, differences in the magnitude of the reflectivity alone cannot be reliably used to determine structural changes in the soft microgel monolayer. Instead, structural changes were quantified employing the same model used for the hard microgels. The theoretical curves and the corresponding profiles obtained from the analysis are shown in Fig. 4(a) (solid lines) and Fig. 4(b), respectively.
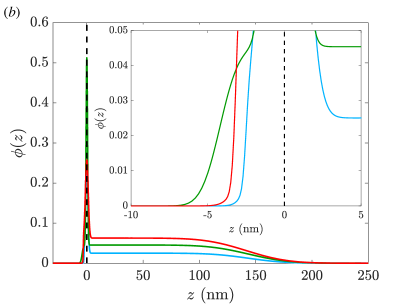
At the onset of the interaction between microgel particles, denoted by the increase of the surface pressure from 0 mN m-1 to 1 mN m-1, is weak and almost featureless. At larger compressions, the reflectivity increases and the shape of the experimental data indicates the formation of an interfacial monolayer. This observation is reflected in the monolayer volume fraction profiles measured at different surface pressures. In particular, the value attained by increases from 0.24 0.05 for =1 mN m-1 to 0.57 0.05 for =13 mN m-1 after which it decreases to its initial value with further compression. The amount of polymer present in the interfacial region of the profile, i.e. within 3 from z=0, is however increasing continuously because of the increase of the width, , of the Gaussian function. Conversely, the amplitude of the volume fraction profiles in water and air, denoted by in Eqs. S2 and S3, steadily increases from 0.02 0.01 to 0.06 0.01. In the case of the hard microgel monolayer, this parameter did not show any large variation, remaining almost constant in the range 0.02 - 0.03 for all investigated pressures. Furthermore, in the case of the soft microgel monolayer, the protrusion of particles into the air and water phases remains nearly constant, approximately 3.5 nm and 148 nm, respectively (green circles in Fig.3, and blue circles and red triangles in Fig. S3).
The findings from NR experiments were further supported and validated through molecular dynamics simulations. The simulations provided additional evidence and insights into the behavior and structural changes of the microgel monolayers under compression at the interface.
As an accurate determination of the surface pressure in the simulated systems was not feasible, we utilized, as parameter representing the effect of lateral compression, the relative compression , where is the area of the box upon compression and is the interfacial area of the largest box simulated. During the experiments, the area of the interface was reduced to 5% (hard) and 10% (soft) of its initial value. The determination of the latter was based on the onset of the surface pressure increase. Similarly, in the computer simulations, the available area at the interface was reduced to 21% and 17% of its initial value for the hard and soft particles, respectively, while maintaining constant the number of microgel particles in the simulation box.
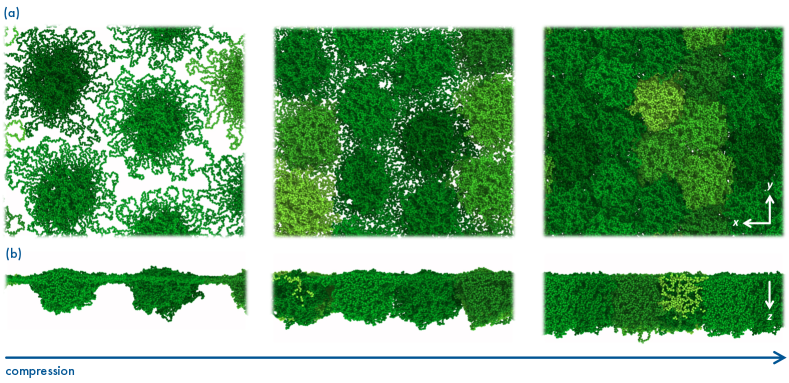
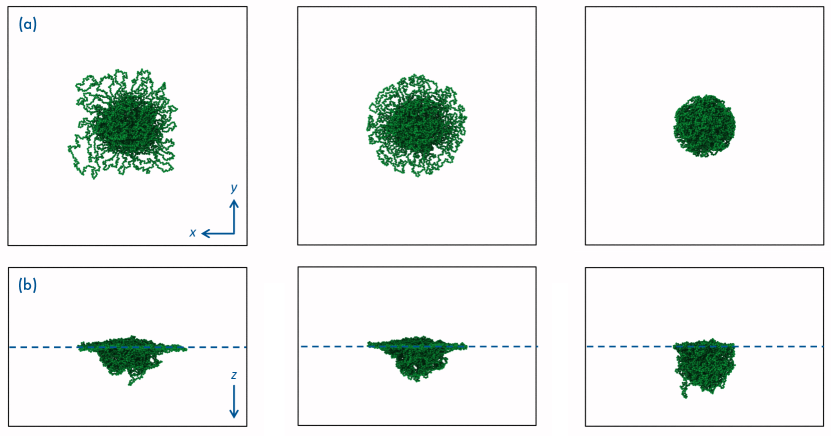
Fig. 5 presents selected snapshots of the simulated compressed states ( = 1.0, 0.40, and 0.21 from left to right) for the hard microgels, viewed from both the top (a) and the side (b). These snapshots roughly represent equivalent surface pressure in experiments ranging from mN m-1 (left) to mN m-1 (right), with the central snapshot corresponding to mN m-1.
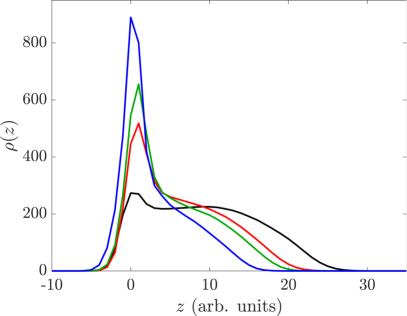
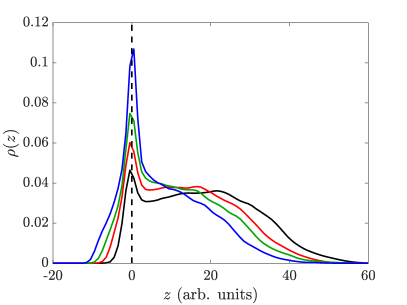
The density profiles depicted in Fig. 6 for the hard microgels exhibit a consistent overall shape reminiscent of the profiles determined through NR experiments. These profiles feature a denser region around the interface (at =0), and protrusions extending into both the air phase () and the water phase (). As observed in the experiments, upon compression the latter gets more extended, the height of the profiles in the water phase remains almost constant while the height of the central peak, , and the protrusion in air, , decrease. The reduction of is also clearly visible in Fig. 6. These findings, derived from an ensemble of twelve particles, closely resemble the outcomes achieved when simulating the compression of an individual microgel particle (refer to Fig. S4).
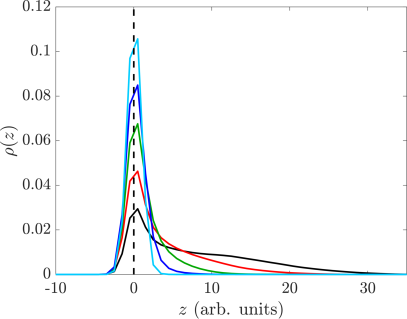
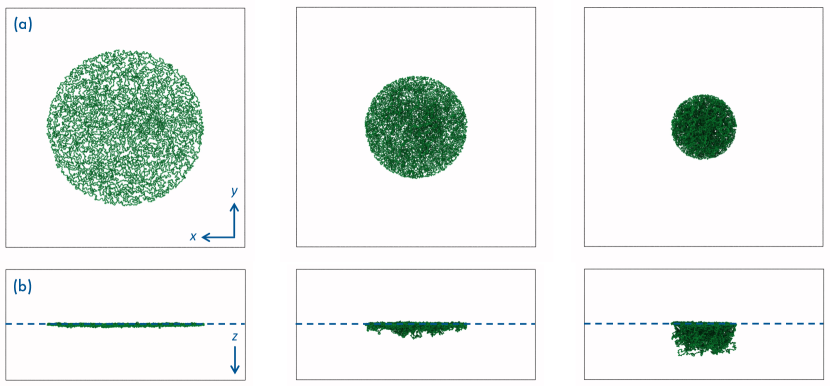
In the case of soft microgel particles, compression simulations were performed only on an individual particle because of the large system size and the corresponding high demand of computational resources (see Methods). As shown in the snapshots (Fig. S6) and in the microgel density profiles (Fig. 7) the soft particles remained mostly localised at the interface for a broad range of compression. The protrusion in water starts to emerge at (green line in Fig. 7) to become more evident at larger compressions. ULC particles featuring a flat oblate shape were very recently found at the interface in dodecane-water emulsions 24. This observation is fully compatible with the direct measurement of the ULC microgel shape along the vertical direction provided in the current work. The absence of cross-linker is also responsible of the increased flattening of the particles at the interface and is consistent with previous observations 47, 22, 13.
4 Discussion
The precise characterisation of the vertical structure in microgel monolayers is of vital importance for understanding the behaviour of stimuli-responsive microgels 24. Such information is not directly accessed by conventional interfacial technique, while it is the main result of a specular neutron reflectometry experiment. Indeed, the analysis of NR data allowed us to determine the volume fraction profiles () of the microgel monolayer along the direction perpendicular to the interface. The model we employed successfully captured the complex behavior of the microgels, revealing a denser region at the interface surrounded by distinct protrusions in the air and water phases. Notably, we observed that the maximum volume fraction occupied by the microgel particles was consistently found at the air-water interface for all investigated samples. The shape of the volume fraction profiles indicates that both soft and hard microgel particles undergo significant deformation, with many polymer chains spreading at the air-water interface due to NIPAM surface activity. The deformation is particularly pronounced for the soft particles as they are characterised by a lower polymer density and by a larger hydration 22 than their hard counterpart. As expected, initially increases upon compression for both samples.
Consistent with surface pressure measurements performed on similar systems by other groups 11, 65, the microgel particles exhibit a transition from a gas phase to a denser phase (indicated as a liquid expanded-like state 11, 65) as their coronas start to interact. This transition is accompanied by the emergence of a hexagonal order, as demonstrated by AFM measurements 65, 12. Together with the lateral compression of microgels, this transition causes the observed increase in surface pressure (see Fig. S1) and in surface elasticity (Fig. 1).
Both NR and MD simulations indicate that, in addition to the polymer at the interface, a more hydrated polymer region is formed in the water phase. However, despite the larger hydration, the total amount of polymer in this region is 6-10 times larger than that at the interface due to its significant extension. As both hard and soft microgels are compressed in the range mN m-1, the overall microgel VFP increases, reflecting the greater amount of material in the probed surface area, without undergoing noticeable changes in shape as determined by the comparison of the profiles. This is in agreement with the observation that microgels, independently of their cross-linker content, interact at these compression levels through their polymer chains flattened at the interface. This results in particle coronas that can interpenetrate without inducing significant structural and morphological changes in the microgel particles.
Upon further compression ( mN m-1), both monolayers exhibit a peak in their surface elasticity, , which then starts to decrease while the surface pressure continues to increase, suggesting the formation of more rigid and compact film. In the literature, this pressure range has been interpreted as the continuation of an ordered liquid phase, where the packing of microgel particles remains hexagonal but is characterized by a decreasing lattice distance 65. Despite the apparent lack of changes in the monolayer structure in this interval of compressions, NR data indicates that the pressure at which the maximum elasticity is displayed represents a turning point for the structure of the hard microgel monolayer. Indeed, at this compression threshold, changes significantly. The amount of polymer at the interface levels off to a value corresponding to approximately 40% surface coverage, representing probably the saturation limits at which polymer chains belonging to the particle corona can interpenetrate. Simultaneously, the protrusion of polymer chains in the air drastically reduces, while it substantially increases (by 75%) in the water phase, as confirmed by MD simulations. These changes are possible if the polymer chains in the particle corona can desorb from the interface to move deeper into the water phase. As the portion of the microgel protruding in the air should not be affected by interpenetration at these compression levels, the reduction of the corresponding region in the VFP is very likely due to the vertical displacement of the entire microgel particle 4 nm deeper into the water phase.
This tendency of the hard microgels to move away from the interface can be related to their behavior once the maximum in surface compressibility is reached. In this condition, microgel particles are prone either to desorb into the aqueous sub-phase, forming multi-layers, or promoting the buckling of the surface 11. At the highest surface pressure utilized in the NR experiments, which is very close to the collapse of the monolayer, clear fringes appeared in the low- portion of the data. These are commonly associated to the beginning of the formation of a compact and thick layer, presumably indicating the onset of the transition between the liquid expanded and solid-like phases. This behavior is driven by the interaction of the microgel particles via their portion flattened at the interface, as indicated by the pronounced asymmetry of the volume fraction profiles and by the constant height () of the protrusion in the water.
The ultra-soft microgels exhibit a behavior similar to that of the hard particles in the gas phase and at the onset of the transition, particularly at surface pressures lower than the one corresponding to the maximum in surface elasticity, mN m-1. Here, the raise in surface pressure is caused by the interaction and interpenetration of the polymer chains at the interface. For further compression levels, elasticity decreases, as previously observed for the hard particle monolayer. However, the molecular reorganization responsible for this is different; for monolayers of soft microgels, a broadening of the interfacial region identified by the Gaussian function is observed, indicating that the polymer chains at the interface deform upon compression. Despite the visual decrease in the maximum of (Fig. 4(b)), the broadening of the interface leads to an increasing amount of polymer at the interface, as determined by . Unlike the hard microgels, polymer chains located in water, just below the interface, can also interpenetrate without causing migration of some of them deeper into the water, as indicated by the constant extension of the protrusion in water found for the soft monolayer. This enhanced interpenetration in water is consistent with the fact that the sparsely crosslinked network of swollen ultra-soft microgels present a larger mesh-size compared to crosslinked hard microgels 22.
The broadening of the peak at the interface, determined experimentally to be less than 1 nm, is not visible in the density profiles obtained from the computer simulations. This is because the coarse-grained simulations were performed using particles with a size larger than the measured broadening. However, they are able to capture the increase in the water protrusion, confirming to a good extent the validity of the experimental results.
5 Conclusions
The different behavior of soft and hard microgels under compression can be attributed to their different architectures. Cross-linked microgels are characterized by a dense core surrounded by a fuzzy shell 45, while soft microgels synthesized without the addition of any cross-linker have a more homogeneous polymer distribution within their volume 22. These differences are preserved at the interface, where hard microgels resemble fried eggs with the hard core in their center, while soft microgels assume a pancake-like structure 22, 47, as depicted in the top of the sketches in Figs. 8(a) and 8(b). The grey areas represent the protrusion of microgels in the air, as can be observed the hard microgels protrude more into air as compared to the soft ones (the proportion of the extension in air and water in the sketches are altered for clarity).
The lateral compression of hard microgels, horizontal black arrows in the bottom of panel 8(a), initially leads to the interaction of coronas of neighboring particles and then to the interpenetration of these regions with limited interaction of their cores. As a result, polymer chains that belong to the corona regions can rearrange, forming loops in the water, and the entire microgel particles can slip on each other, moving away from the interface. This scenario is illustrated in the bottom of Fig. 8(a) where the vertical arrows show that the hard microgels are pushed more in the water (blue arrows) and away from the interface (grey arrows).
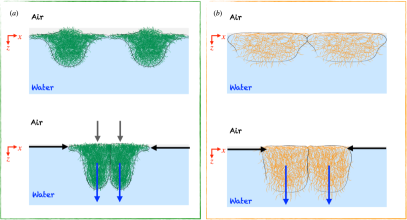
On the other hand, soft microgels do not have a significant gradient of compressibility within their volume 47. When pushed together, they can deform easily and reach a uniform coverage of the interface, as also observed in their dry state 22. Yet, at one point, further compression becomes harder, and the microgels expand orthogonal to the interface, leading to an increased protrusion in water and to the broadening of the interfacial film as depicted by the vertical blue arrows in in Fig. 8(b). However, the protrusion of ultra-soft microgels in the air remains almost constant as shown by the shaded gray ares in Fig. 8(b).
It is also noteworthy that the same level of protrusion as observed for the ULC microgels in air ( nm, Fig. 4(b)) is only reached by the hard microgels at a higher surface pressure, specifically mNm-1 (Fig. 2(b)).
These observations offer a key to understanding the reasons behind the phenomenon observed when emulsions stabilized by thermo-responsive microgels break upon temperature increases 8: we have revealed that above a certain concentration, the amount of material localised at the interface remains constant. When temperature rises, the collapsing polymers from the water phase cannot adsorb onto an interface already occupied by adsorbed polymer chains and this imbalance can induce mechanical stresses, ultimately resulting in the rupture of the droplet.
Our findings, and the combination of simulations and NR experiments can be of importance also to advance the rational design and consequently the use of soft colloids for biomedial applications. For instance, recently “synthetic antibodies” have been prepared for a broad range of target molecules combining NIPAM and a limited set of charged and hydrophobic monomers 68. These abiotic receptors are currently being assessed as robust substitutes for antibodies in diagnostic and therapeutic applications. The ability of these PNIPAM-based nanogels to bind multimeric receptors, along with their demonstrated equilibrium kinetics that depend on the swelling state of the microgels (i.e., its softness), have shown the potential of these materials in various application.
6 Acknowledgements
MMS, SB, WR and AS thank the Deutsche Forschungsgemeinschaft within projects A3 and B8 of the SFB 985 - Functional Microgels and Microgel Systems. EZ acknowledges support from EU MSCA Doctoral Network QLUSTER, Grant Agreement 101072964 and ICSC – Centro Nazionale di Ricerca in High Performance Computing, Big Data and Quantum Computing, funded by European Union – NextGenerationEU - PNRR, Missione 4 Componente 2 Investimento 1.4. EZ also acknowledges CINECA-ISCRA for HPC resources. AM acknowledges the financial support from MICINN under grant PID2021-129054NA-I00 and the IKUR Strategy of the Basque Government. The authors thank M. Brugnoni for the microgel synthesis. The authors acknowledge the Institut Laue – Langevin for the awarded beamtime (DOIs: 10.5291/ILL-DATA.EASY-462 and 10.5291/ILL-DATA.9-11-2099) on the neutron reflectometer FIGARO. The data generated and analysed during this study are openly available in RADAR4Chem at https://doi.org/10.22000/1747. The software utilised for the analysis of neutron reflectometry (Aurore - VFP version) data is available on the SOURCEFORGE platform.
Supporting Information material
7 Compression isotherms
The mechanical properties of monolayers of soft and hard microgels were probed at the air-water interface. Compression isotherms were measured using a KSV-NIMA Langmuir trough (Biolin Scientific Oy) equipped with two parallel-moving barriers. The trough and the barriers were made of polyoxymethylene. Compression of microgel monolayers was achieved by closing the barriers at a speed of 10 mm/min. The surface pressure was measured by the Wilhelmy plate method utilizing a roughened platinum plate. The plate was placed perpendicular to the long axis of the trough and connected to a pressure sensor acquiring data in a continuous mode. For temperature control, the troughs were connected to an external water bath and circulating thermostated water through the base of the troughs. Ultrapure water (Astacus2, membraPure GmbH, Germany), with a resistivity of 18.2 MOhmcm was used as aqueous sub-phase. Aqueous solutions of microgels (concentration of 10 mg mL-1) were mixed with 50 vol of propan-2-ol (Merck KGaA, Germany) to facilitate spreading. For each measurement, the Langmuir trough was cleaned and a fresh air-water interface was created. After filling the water, the aqueous subphase was subjected to temperature equilibration and the surface was cleaned by suction. Then the solution was spread at the interface by dropwise addition with a L syringe. After addition of the microgels, the interface was let to set for 30 minutes before compression began. Compression isotherms were all conducted at C and are shown in Fig. S1 for the hard (squares) and soft microgels (circles).
8 NR modeling
The analysis of the NR data was based on the optimisation of a volume fraction profile (VFP) describing the microgel at the air-ACMW interface. The VFP of the microgel was modeled as the sum of a rising error function, , a decaying one, and of a Gaussian peak, . and were used to describe the protrusion of the microgel in the air and in the water phases respectively. They were assumed to have equal amplitude to have a constant baseline value for the peak region.
| (S1) |
| (S2) |
| (S3) |
-
•
: amplitude of the error function profiles;
-
•
: amplitude of the peak function;
-
•
, and : position along the z-axis (orthogonal to the interface) of the Gaussian peak, and of the rising and decaying error functions, respectively;
-
•
and : stretching parameters associated to the steepness of the error functions, =0: step function, : fully stretched profile;
-
•
: Gaussian width;
The use of stretching parameters to describe the steepness of the error functions is necessary to keep the shape of the profiles within meaningful physical limits. Indeed, if the error function is too stretched it does not reach, within a fixed range, the expected asymptotic values and, therefore, the generated profile will not match the nominal parameter values.
The full extension of the microgel VFP along () can be determined from the position of the error functions inflection point as depicted in Figure S2, where and indicate the extension of the protrusions above and below the interface.
The VFP of the gas and liquid phases were described by error functions with width fixed to nm, to represent the surface roughness due to capillary waves for a free water surface at ambient pressure and temperature. Since by definition all VFP contributions must have sum 1 for every z-point, the air and water VFPs were defined as
| (S4) |
| (S5) |
Generic VFP profiles of microgel layer and air and water phases are given in Figure S2(a). In Figure S2(b) the individual contributions to the microgel VFP of and of are shown together with the visual indication of the model parameters.
The computation of the theoretical reflectivity was performed as described in the main manuscript.
9 Microgel protrusion parameters
10 Simulations
References
- Binks 2002 Binks, B. P. Particles as surfactants—similarities and differences. Current opinion in colloid & interface science 2002, 7, 21–41
- Dekker et al. 2023 Dekker, R. I.; Velandia, S. F.; Kibbelaar, H. V.; Morcy, A.; Sadtler, V.; Roques-Carmes, T.; Groenewold, J.; Kegel, W. K.; Velikov, K. P.; Bonn, D. Is there a difference between surfactant-stabilised and Pickering emulsions? Soft Matter 2023, 19, 1941–1951
- Singh and Sarkar 2011 Singh, H.; Sarkar, A. Behaviour of protein-stabilised emulsions under various physiological conditions. Advances in colloid and interface science 2011, 165, 47–57
- Hobson et al. 2018 Hobson, J. J.; Edwards, S.; Slater, R. A.; Martin, P.; Owen, A.; Rannard, S. P. Branched copolymer-stabilised nanoemulsions as new candidate oral drug delivery systems. RSC advances 2018, 8, 12984–12991
- Ramsden 1904 Ramsden, W. Separation of solids in the surface-layers of solutions and ‘suspensions’(observations on surface-membranes, bubbles, emulsions, and mechanical coagulation).—Preliminary account. Proceedings of the royal Society of London 1904, 72, 156–164
- Pickering 1907 Pickering, S. U. Emulsions. Journal of the Chemical Society, Transactions 1907, 91, 2001–2021
- Hossain et al. 2021 Hossain, K. M. Z.; Deeming, L.; Edler, K. J. Recent progress in Pickering emulsions stabilised by bioderived particles. RSC advances 2021, 11, 39027–39044
- Richtering 2012 Richtering, W. Responsive emulsions stabilized by stimuli-sensitive microgels: emulsions with special non-Pickering properties. Langmuir 2012, 28, 17218–17229
- Destribats et al. 2011 Destribats, M.; Lapeyre, V.; Wolfs, M.; Sellier, E.; Leal-Calderon, F.; Ravaine, V.; Schmitt, V. Soft microgels as Pickering emulsion stabilisers: role of particle deformability. Soft Matter 2011, 7, 7689
- Kwok et al. 2019 Kwok, M.-h.; Sun, G.; Ngai, T. Microgel particles at interfaces: phenomena, principles, and opportunities in food sciences. Langmuir 2019, 35, 4205–4217
- Pinaud et al. 2014 Pinaud, F.; Geisel, K.; Massé, P.; Catargi, B.; Isa, L.; Richtering, W.; Ravaine, V.; Schmitt, V. Adsorption of microgels at an oil–water interface: correlation between packing and 2D elasticity. Soft Matter 2014, 10, 6963–6974
- Scotti et al. 2022 Scotti, A.; Schulte, M. F.; Lopez, C. G.; Crassous, J. J.; Bochenek, S.; Richtering, W. How softness matters in soft nanogels and nanogel assemblies. Chemical Reviews 2022, 122, 11675–11700
- Bochenek et al. 2022 Bochenek, S.; Camerin, F.; Zaccarelli, E.; Maestro, A.; Schmidt, M. M.; Richtering, W.; Scotti, A. In-situ study of the impact of temperature and architecture on the interfacial structure of microgels. Nature Communications 2022, 13, 3744
- Rey et al. 2016 Rey, M.; Fernández-Rodríguez, M. Á.; Steinacher, M.; Scheidegger, L.; Geisel, K.; Richtering, W.; Squires, T. M.; Isa, L. Isostructural solid–solid phase transition in monolayers of soft core–shell particles at fluid interfaces: structure and mechanics. Soft Matter 2016, 12, 3545–3557
- Brugger et al. 2010 Brugger, B.; Vermant, J.; Richtering, W. Interfacial layers of stimuli-responsive poly-(N-isopropylacrylamide-co-methacrylicacid) (PNIPAM-co-MAA) microgels characterized by interfacial rheology and compression isotherms. Physical Chemistry Chemical Physics 2010, 12, 14573
- Akentiev et al. 2017 Akentiev, A. V.; Rybnikova, G. S.; Novikova, A. A.; Timoshen, K. A.; Zorin, I. M.; Noskov, B. A. Dynamic elasticity of films formed by poly(N-isopropylacrylamide) microparticles on a water surface. Colloid Journal 2017, 79, 571–576
- Tatry et al. 2023 Tatry, M.-C.; Laurichesse, E.; Vermant, J.; Ravaine, V.; Schmitt, V. Interfacial rheology of model water–air microgels laden interfaces: Effect of cross-linking. Journal of Colloid and Interface Science 2023, 629, 288–299
- Schmidt et al. 2023 Schmidt, M. M.; Ruiz-Franco, J.; Bochenek, S.; Camerin, F.; Zaccarelli, E.; Scotti, A. Interfacial fluid rheology of soft particles. arXiv preprint arXiv:2308.15933 2023,
- Houston et al. 2022 Houston, J. E.; Fruhner, L.; de la Cotte, A.; Rojo González, J.; Petrunin, A. V.; Gasser, U.; Schweins, R.; Allgaier, J.; Richtering, W.; Fernandez-Nieves, A., et al. Resolving the different bulk moduli within individual soft nanogels using small-angle neutron scattering. Science Advances 2022, 8, eabn6129
- McPhee et al. 1993 McPhee, W.; Tam, K. C.; Pelton, R. Poly (N-isopropylacrylamide) latices prepared with sodium dodecyl sulfate. Journal of colloid and interface science 1993, 156, 24–30
- Brugnoni et al. 2019 Brugnoni, M.; Nickel, A. C.; Kröger, L. C.; Scotti, A.; Pich, A.; Leonhard, K.; Richtering, W. Synthesis and structure of deuterated ultra-low cross-linked poly (N-isopropylacrylamide) microgels. Polymer Chemistry 2019, 10, 2397–2405
- Scotti et al. 2019 Scotti, A.; Bochenek, S.; Brugnoni, M.; Fernandez-Rodriguez, M.-A.; Schulte, M. F.; Houston, J.; Gelissen, A. P.; Potemkin, I. I.; Isa, L.; Richtering, W. Exploring the colloid-to-polymer transition for ultra-low crosslinked microgels from three to two dimensions. Nature Communications 2019, 10, 1418
- Petrunin et al. 2023 Petrunin, A. V.; Bochenek, S.; Richtering, W.; Scotti, A. Harnessing the polymer-particle duality of ultra-soft nanogels to stabilise smart emulsions. Physical Chemistry Chemical Physics 2023, 25, 2810–2820
- Rey et al. 2023 Rey, M.; Kolker, J.; Richards, J. A.; Malhotra, I.; Glen, T. S.; Li, N. Y. D.; Laidlaw, F. H. J.; Renggli, D.; Vermant, J.; Schofield, A. B.; Fujii, S.; Löwen, H.; Clegg, P. S. Interactions between interfaces dictate stimuli-responsive emulsion behaviour. Nature Communications 2023, 14
- Nussbaum et al. 2022 Nussbaum, N.; Bergfreund, J.; Vialetto, J.; Isa, L.; Fischer, P. Microgels as globular protein model systems. Colloids and Surfaces B: Biointerfaces 2022, 217, 112595
- Tein et al. 2020 Tein, Y. S.; Zhang, Z.; Wagner, N. J. Competitive Surface Activity of Monoclonal Antibodies and Nonionic Surfactants at the Air-Water Interface Determined by Interfacial Rheology and Neutron Reflectometry. Langmuir 2020, 36, 7814–7823
- Wood et al. 2023 Wood, C. V.; Razinkov, V. I.; Qi, W.; Roberts, C. J.; Vermant, J.; Furst, E. M. Antibodies Adsorbed to the Air-Water Interface Form Soft Glasses. Langmuir 2023, 39, 7775–7782
- Zahn et al. 1999 Zahn, K.; Lenke, R.; Maret, G. Two-stage melting of paramagnetic colloidal crystals in two dimensions. Physical review letters 1999, 82, 2721
- Zahn and Maret 2000 Zahn, K.; Maret, G. Dynamic criteria for melting in two dimensions. Physical Review Letters 2000, 85, 3656
- Kelleher et al. 2017 Kelleher, C. P.; Guerra, R. E.; Hollingsworth, A. D.; Chaikin, P. M. Phase behavior of charged colloids at a fluid interface. Phys. Rev. E 2017, 95, 022602
- Deshmukh et al. 2014 Deshmukh, O. S.; Maestro, A.; Duits, M. H.; van den Ende, D.; Stuart, M. C.; Mugele, F. Equation of state and adsorption dynamics of soft microgel particles at an air–water interface. Soft matter 2014, 10, 7045–7050
- Scheidegger et al. 2017 Scheidegger, L.; Fernández-Rodríguez, M. Á.; Geisel, K.; Zanini, M.; Elnathan, R.; Richtering, W.; Isa, L. Compression and deposition of microgel monolayers from fluid interfaces: particle size effects on interface microstructure and nanolithography. Physical Chemistry Chemical Physics 2017, 19, 8671–8680
- Schmidt et al. 2010 Schmidt, S.; Zeiser, M.; Hellweg, T.; Duschl, C.; Fery, A.; Möhwald, H. Adhesion and mechanical properties of PNIPAM microgel films and their potential use as switchable cell culture substrates. Advanced Functional Materials 2010, 20, 3235–3243
- Cors et al. 2017 Cors, M.; Wrede, O.; Genix, A.-C.; Anselmetti, D.; Oberdisse, J.; Hellweg, T. Core–shell microgel-based surface coatings with linear thermoresponse. Langmuir 2017, 33, 6804–6811
- Geisel et al. 2014 Geisel, K.; Isa, L.; Richtering, W. The Compressibility of pH-Sensitive Microgels at the Oil–Water Interface: Higher Charge Leads to Less Repulsion. Angewandte Chemie 2014, 126, 5005–5009
- Geisel et al. 2014 Geisel, K.; Richtering, W.; Isa, L. Highly ordered 2D microgel arrays: compression versus self-assembly. Soft Matter 2014, 10, 7968–7976
- Kuk et al. 2023 Kuk, K.; Abgarjan, V.; Gregel, L.; Zhou, Y.; Fadanelli, V. C.; Buttinoni, I.; Karg, M. Compression of colloidal monolayers at liquid interfaces: in situ vs. ex situ investigation. Soft Matter 2023, 19, 175–188
- Kawamoto et al. 2023 Kawamoto, T.; Yanagi, K.; Nishizawa, Y.; Minato, H.; Suzuki, D. The compression of deformed microgels at an air/water interface. Chemical Communications 2023,
- Zielińska et al. 2016 Zielińska, K.; Sun, H.; Campbell, R. A.; Zarbakhsh, A.; Resmini, M. Smart nanogels at the air/water interface: structural studies by neutron reflectivity. Nanoscale 2016, 8, 4951–4960
- Gnan et al. 2017 Gnan, N.; Rovigatti, L.; Bergman, M.; Zaccarelli, E. In silico synthesis of microgel particles. Macromolecules 2017, 50, 8777–8786
- Campbell et al. 2018 Campbell, R. A.; Saaka, Y.; Shao, Y.; Gerelli, Y.; Cubitt, R.; Nazaruk, E.; Matyszewska, D.; Lawrence, M. J. Structure of surfactant and phospholipid monolayers at the air/water interface modeled from neutron reflectivity data. J. Colloid Interf. Sci. 2018, 531, 98–108
- Davies and Rideal 1963 Davies, J. T.; Rideal, E. K. Interfacial Phenomena, 2nd ed.; Academic Press: San Diego, CA, 1963
- Campbell et al. 2011 Campbell, R.; Wacklin, H.; Sutton, I.; Cubitt, R.; Fragneto, G. FIGARO: The new horizontal neutron reflectometer at the ILL. Eur. Phys. J. Plus 2011, 126
- Gutfreund et al. 2018 Gutfreund, P.; Saerbeck, T.; Gonzalez, M. A.; Pellegrini, E.; Laver, M.; Dewhurst, C.; Cubitt, R. Towards generalized data reduction on a chopper-based time-of-flight neutron reflectometer. Journal of Applied Crystallography 2018, 51, 606–615
- Stieger et al. 2004 Stieger, M.; Richtering, W.; Pedersen, J. S.; Lindner, P. Small-angle neutron scattering study of structural changes in temperature sensitive microgel colloids. The Journal of chemical physics 2004, 120, 6197–6206
- Geisel et al. 2012 Geisel, K.; Isa, L.; Richtering, W. Unraveling the 3D localization and deformation of responsive microgels at oil/water interfaces: a step forward in understanding soft emulsion stabilizers. Langmuir 2012, 28, 15770–15776
- Schulte et al. 2021 Schulte, M. F.; Bochenek, S.; Brugnoni, M.; Scotti, A.; Mourran, A.; Richtering, W. Stiffness tomography of ultra-soft nanogels by atomic force microscopy. Angewandte Chemie International Edition 2021, 60, 2280–2287
- Gerelli 2020 Gerelli, Y. Applications of neutron reflectometry in biology. EPJ Web of Conferences 2020, 236, 04002
- Braslau et al. 1985 Braslau, A.; Deutsch, M.; Pershan, P. S.; Weiss, A. H.; Als-Nielsen, J.; Bohr, J. Surface Roughness of Water Measured by X-Ray Reflectivity. Physical Review Letters 1985, 54, 114–117
- Scotti et al. 2020 Scotti, A.; Houston, J.; Brugnoni, M.; Schmidt, M.; Schulte, M.; Bochenek, S.; Schweins, R.; Feoktystov, A.; Radulescu, A.; Richtering, W. Phase behavior of ultrasoft spheres show stable bcc lattices. Physical Review E 2020, 102, 052602
- Scotti 2021 Scotti, A. Characterization of the volume fraction of soft deformable microgels by means of small-angle neutron scattering with contrast variation. Soft Matter 2021, 17, 5548–5559
- Armanious et al. 2022 Armanious, A.; Gerelli, Y.; Micciulla, S.; Pace, H. P.; Welbourn, R. J. L.; Sjöberg, M.; Agnarsson, B.; Höök, F. Probing the Separation Distance between Biological Nanoparticles and Cell Membrane Mimics Using Neutron Reflectometry with Sub-Nanometer Accuracy. Journal of the American Chemical Society 2022, 144, 20726–20738
- Parratt 1954 Parratt, L. G. Surface Studies of Solids by Total Reflection of X-Rays. Phys. Rev. 1954, 95, 359–369
- Abelès 1950 Abelès, F. La théorie générale des couches minces. Journal de Physique et le Radium 1950, 11, 307–309
- Gerelli 2016 Gerelli, Y. Aurore: new software for neutron reflectivity data analysis. J. Appl. Crystallogr. 2016, 49, 330–339
- Ninarello et al. 2019 Ninarello, A.; Crassous, J. J.; Paloli, D.; Camerin, F.; Gnan, N.; Rovigatti, L.; Schurtenberger, P.; Zaccarelli, E. Modeling Microgels with a Controlled Structure across the Volume Phase Transition. Macromolecules 2019, 52, 7584–7592
- Rovigatti et al. 2015 Rovigatti, L.; Šulc, P.; Reguly, I. Z.; Romano, F. A comparison between parallelization approaches in molecular dynamics simulations on GPUs. Journal of computational chemistry 2015, 36, 1–8
- Hazra et al. 2023 Hazra, N.; Ninarello, A.; Scotti, A.; Houston, J.; Mota-Santiago, P.; Zaccarelli, E.; Crassous, J. Structure of Responsive Microgels down to Ultra Low Crosslinkings. Macromolecules 2023,
- Gnan et al. 2017 Gnan, N.; Rovigatti, L.; Bergman, M.; Zaccarelli, E. In silico synthesis of microgel particles. Macromolecules 2017, 50, 8777–8786
- Groot and Warren 1997 Groot, R. D.; Warren, P. B. Dissipative particle dynamics: Bridging the gap between atomistic and mesoscopic simulation. The Journal of chemical physics 1997, 107, 4423–4435
- cam 2018 Modelling realistic microgels in an explicit solvent. Scientific reports 2018, 8, 14426
- Camerin et al. 2019 Camerin, F.; Fernández-Rodríguez, M. A.; Rovigatti, L.; Antonopoulou, M.-N.; Gnan, N.; Ninarello, A.; Isa, L.; Zaccarelli, E. Microgels adsorbed at liquid–liquid interfaces: A joint numerical and experimental study. ACS nano 2019, 13, 4548–4559
- Camerin et al. 2020 Camerin, F.; Gnan, N.; Ruiz-Franco, J.; Ninarello, A.; Rovigatti, L.; Zaccarelli, E. Microgels at interfaces behave as 2D elastic particles featuring reentrant dynamics. Physical Review X 2020, 10, 031012
- Plimpton 1995 Plimpton, S. Fast Parallel Algorithms for Short-Range Molecular Dynamics. Journal of Computational Physics 1995, 117, 1–19
- Picard et al. 2017 Picard, C.; Garrigue, P.; Tatry, M.-C.; Lapeyre, V.; Ravaine, S.; Schmitt, V.; Ravaine, V. Organization of Microgels at the Air–Water Interface under Compression: Role of Electrostatics and Cross-Linking Density. Langmuir 2017, 33, 7968–7981
- Campbell et al. 2016 Campbell, R. A.; Tummino, A.; Noskov, B. A.; Varga, I. Polyelectrolyte/surfactant films spread from neutral aggregates. Soft Matter 2016, 12, 5304–5312
- Vialetto et al. 2022 Vialetto, J.; Ramakrishna, S. N.; Isa, L. In situ imaging of the three-dimensional shape of soft responsive particles at fluid interfaces by atomic force microscopy. Science Advances 2022, 8
- Haupt et al. 2020 Haupt, K.; Medina Rangel, P. X.; Bui, B. T. S. Molecularly imprinted polymers: Antibody mimics for bioimaging and therapy. Chemical reviews 2020, 120, 9554–9582