Salt effects on the mechanical properties of ionic conductive polymer: a molecular dynamics study
Abstract
Functoinal polymers can be used as electrolyte and binder materials in solid-state batteries. This often requires performance targets in terms of both transport and mechanical properties. In this work, a model ionic conductive polymer system, i.e., poly(ethylene oxide)-LiTFSI, was used to study the impact of salt concentrations on mechanical properties, including different types of elastic moduli and the visoelasticity with both non-equilibrium and equilibrium molecular dynamics simulations. We found an encouragingly good agreement between experiments and simulations regarding the Young’s modulus, bulk modulus and viscosity. In addition, we identified an intermediate salt concentration at which the system shows high ionic conductivity, high Young’s modulus and short elastic restoration time. Therefore, this study laid down the groundwork for investigating ionic conductive polymer binders with self-healing functionality from molecular dynamics simulations.
![[Uncaptioned image]](/html/2311.08144/assets/Fig_TOC.png)
1 Introduction
Electrochemical energy storage, in particular, batteries, are key enablers for the green energy transition and the deployment of electric vehicles. This has led to an ever-increasing activities from both academia and industry with focuses on discovering new battery materials and cell chemistry leading to much higher energy density. However, due to the complexity of novel materials, they can be difficult to implemented in battery products at scale. To address this issue, large-scale research initiatives, e.g. the BATTERY 2030+ 1, have identified thematic areas, e.g. integrating smart functionalities of sensing and self-healing 2, into to the battery design.
One of the promising approach to implement the self-healing functionality into the next generation anode materials (Si as a prominent example) is to explore functional polymers as binder materials 3, 4, 5. For example, functional groups that involve hydrogen bonding 6, 7, 8 is a popular choice for polymer binders that can mitigate the large volume expansion of Si anodes during the cycling. Other types of self-healing mechanisms 9, 10, such dynamical covalent bonds 11, ionic cross-linking 12 and host-guest interactions 13, are also interesting options.
In all these cases, an understanding of the mechanical properties of ionic conductive polymer is necessary. Besides its electrochemical stability, a good ionic conductive polymer should satisfy the requirement of both ionic conductivity ( S cm-1 at 25 ∘C) and mechanical strength ( MPa at 25 ∘C) 14, 15. In this regard, molecular modelling 16 can be rather useful to disentangle different factors that influence the mechanical properties of ionic conductive polymers and to extract design principles.
In contrast to ionic transport properties (e.g. transference number) where much has been understood recently with the help of molecular modelling 17, 18, 19, 20, 21, 22, 23, 24, 25, 26, the mechanical properties of ionic conductive polymers are less studied 27, 28, 29, 30, 31, in particular, at atomistic scale. Therefore, in this work, we used a model ionic conductive polymer system, i.e., poly(ethylene oxide)-LiTFSI, and all-atom molecular dynamics (MD) simulations to study the impact of salt concentrations on mechanical properties, including different types of elastic moduli and the visoelasticity. It is found that all-atom force fields popularly used in the studies of ion transport in polymer systems can reproduce quite well the experimental results of Young’s modulus, bulk modulus and viscosity. Despite of the general trade-off between the transport property and the mechanical property as bounded by the Maxwell relation, we are able to identified an intermediate salt concentration at which the system possess both high ionic conductivity and high Young’s modulus. Regarding the self-healing capability, we show that the elastic restoration time is correlated with the Young’s modulus in a non-linear manner, which is interesting for further investigation.
In the following, we first present the theory of elasticity and viscoelasticity as well as the non-equilibrium and equilibrium MD methods used to investigate these mechanical properties. It follows with the results of salt effects on both elastic moduli and relaxation modulus. Then, we present our attempt to identify an optimal salt concentration and to quantify the self-healing capability. At the last, a conclusion of this study and a perspective for future works are also provided.
2 Theory and Methods
2.1 Elastic moduli from non-equilibrium MD
According to Hooke’s law for elasticity32, the 66 elastic constant matrix C is determined by the partial derivatives of the stress tensor, , with respect to the deformation or strain is,
| (1) |
where and . With the Voigt notation , , , , and , the stiffness matrix involving 21 unique elements can be written as follows
For an isotropic and cubic system, is only dependent on two variable and called Lamé’s constants,33
A least square procedure can be used to obtain Lamé’s constants according to equations 3-5,33
| (2) | |||||
| (3) | |||||
| (4) | |||||
| (5) |
Further, they can be used to calculate elastic moduli such as Young’s modulus (), shear modulus (), bulk modulus () and Poisson’s ratio () according to the following equation.
| (6) |
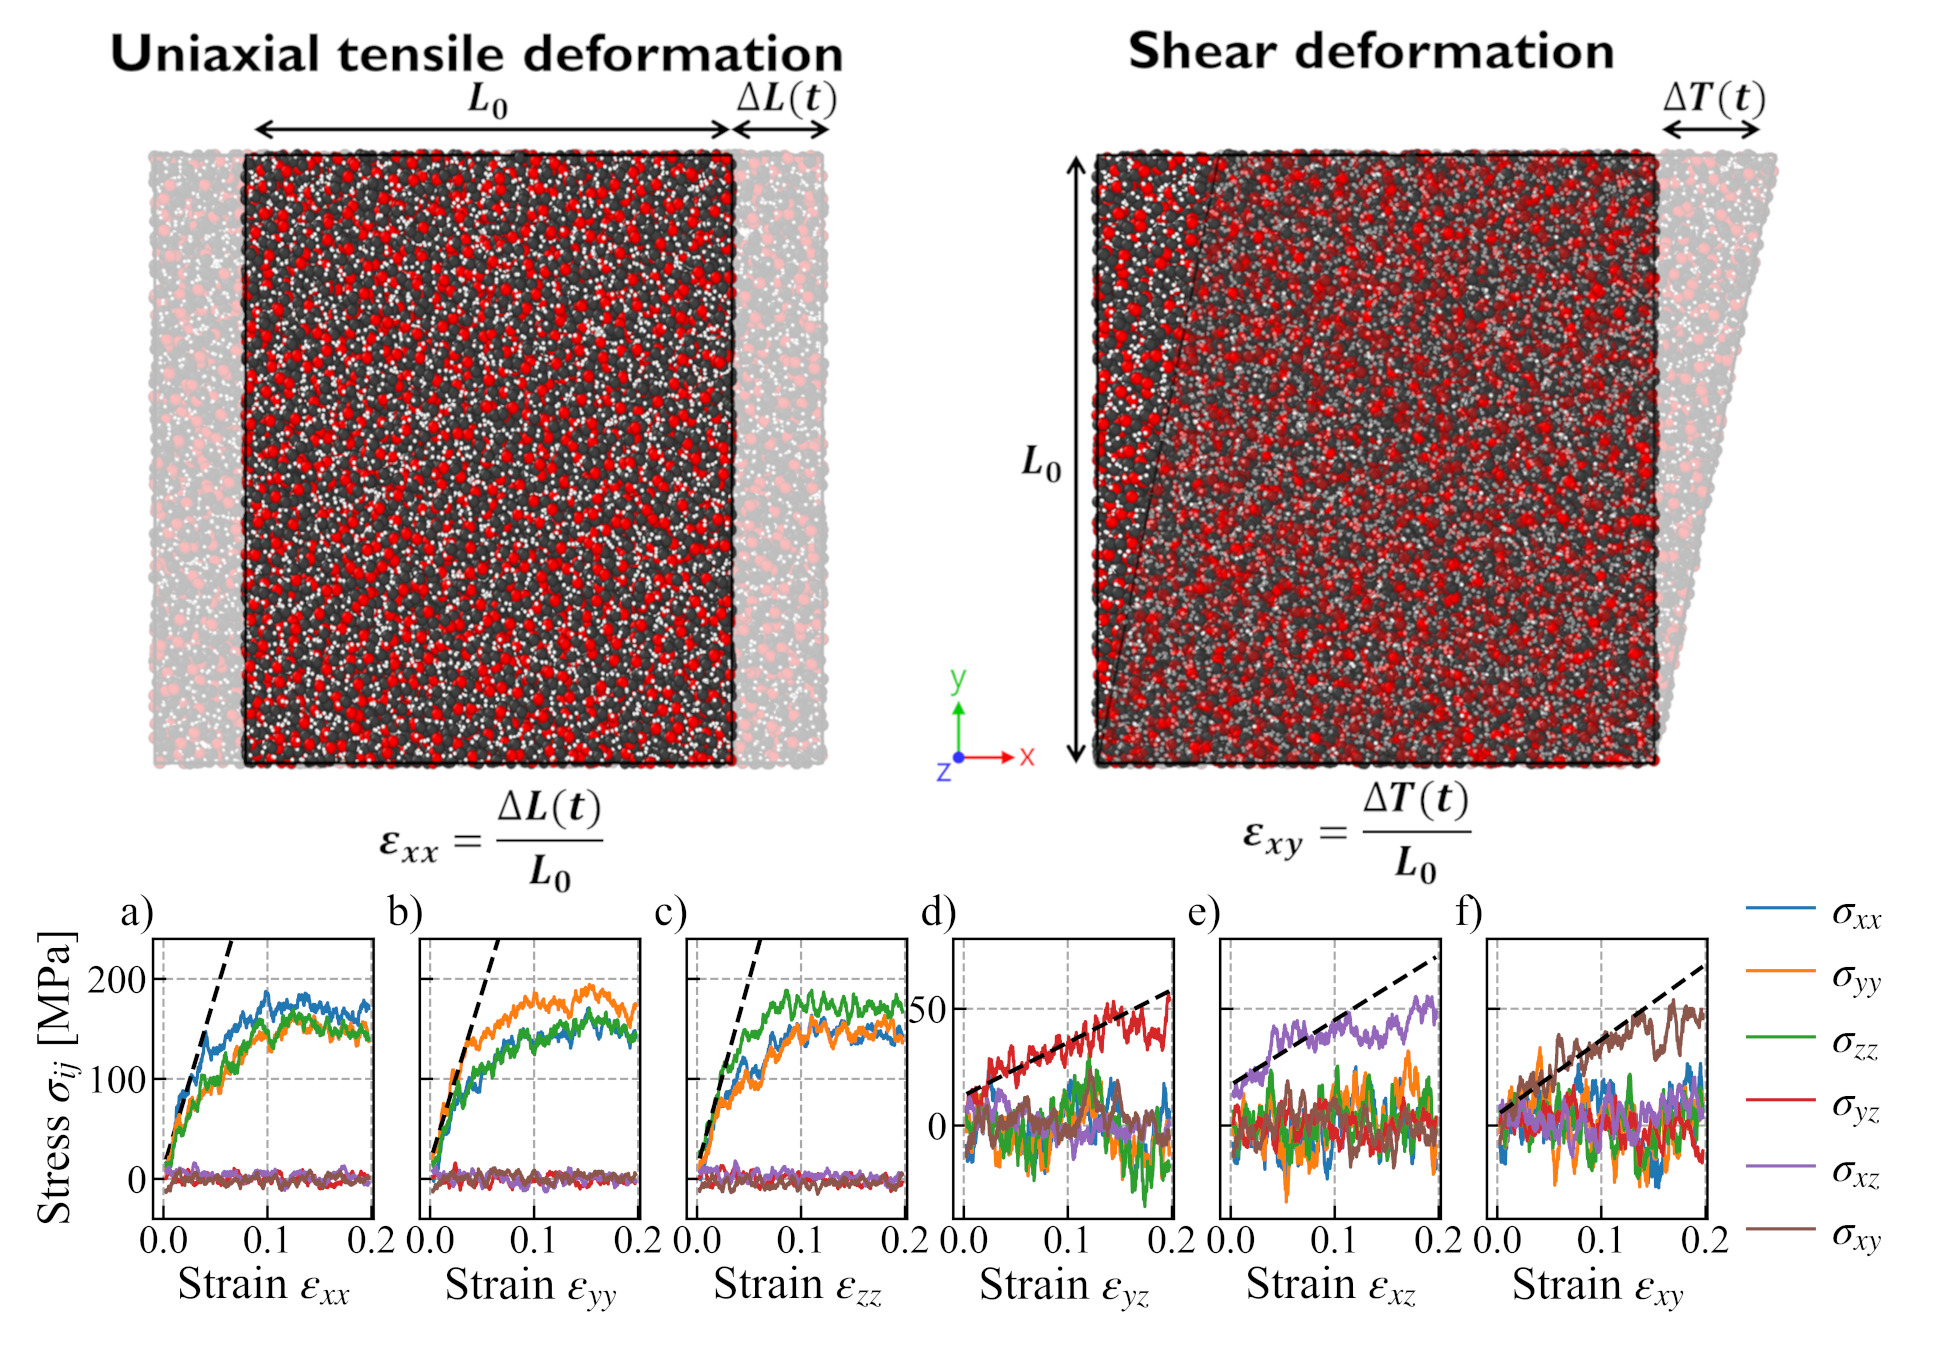
A series of deformations, i.e. uniaxial tensile deformation and shear deformation (see Fig. 1 top), were applied to the periodic simulation cell in order to estimate values of matrix element 34. For the uniaxial tensile deformation simulation, a strain was applied to the direction and the remaining two dimensions () were unchanged. This was repeated for the and directions, while keeping the remaining ( and , respectively) dimensions fixed. Likewise, for three shear deformation simulations where shear strains were applied to , and planes. All deformations were in the positive direction, the strain was applied in a continuous fashion at every time step at a constant rate and six different strain rates varying from - were considered in each case. For example, as shown in Fig. 1 bottom, in the case of the deformation of the direction, the was plotted as a function of the strain up to 20%, and the slope of this curve in the elastic regime over 5% of strain was obtained. Similarly, plots of and versus the strain and the corresponding slopes were obtained. These results were placed in the 1st column of the matrix. The first three columns of the matrix were therefore obtained from the three independent tensile deformation simulations in , and directions. Instead, the last three columns were obtained from the three independent shear deformation simulations in , and planes.
2.2 Viscoelastic properties from equilibrium MD
From the Green-Kubo relation, the relaxation modulus of the system can be obtained from the autocorrelation functions of off-diagonal stress component recorded during the equilibrium MD simulations.35 In the isotropic systems, can be obtained by averaging autocorrelations over the symmetrized traceless stress tensor () components according to Eq. 8 to reduce the statistical error 36.
| (7) | |||||
| (8) |
where is the volume of the system, is the temperature and is the Boltzmann constant.
The storage modulus and the loss modulus can be computed from the in-phase (real) and out-of-phase (imaginary) components of the relaxation modulus in the frequency domain (Eq. 9).
| (9) |
To reduce the fluctuations in the stress time-autocorrelation functions, the multi-tau correlator method37 was used to calculate by implementing the python code “multipletau” 38. The numerical evaluations of and were carried by following the method proposed by Adeyemi 39, 40.
Then, the modulus of the frequency-dependent viscosity can then be estimated from the storage and loss moduli using the following expression:
| (10) |
Taking the zero frequency limit, one obtains the equilibrium viscosity :
| (11) |
Equivalently, the equilibrium viscosity can also be obtained from the the following expression:
| (12) |
2.3 MD simulations of PEO-LiTFSI systems
The GAFF force field parameters41 and simulation protocol for PEO-LiTFSI systems (25 monomer units in each PEO chain with the molecular weight of 1.11 kg/mol) at six different concentrations can be found in our previous studies 22, 23, 25, 26. In this study, all MD simulation were carried out using LAMMPS 42 instead of GROMACS43 for the convenience of computing mechanical properties. To ensure the consistency with our previous studies, glass transition temperatures and Nernst-Einstein ionic conductivity () at different concentrations were computed using two codes but the same force field parameters and compared (see Fig.S1 in the Supporting Information). Non-equilibrium MD simulation were performed for 1-10 ns depending on the strain rate and equilibrium MD simulations were carried out for 500-600 ns. For non-equilibrium MD simulations, we have applied Nosé-Hoover thermostat44 with SLLOD equations of motion45 at K (room temperature) and K (about 430 K) respectively. For equilibrium MD simulations, Nosé-Hoover thermostat44 and barostat46 were applied at K and 1 bar.
3 Results and Discussion
3.1 Effects of strain rate and salt concentration on elastic properties
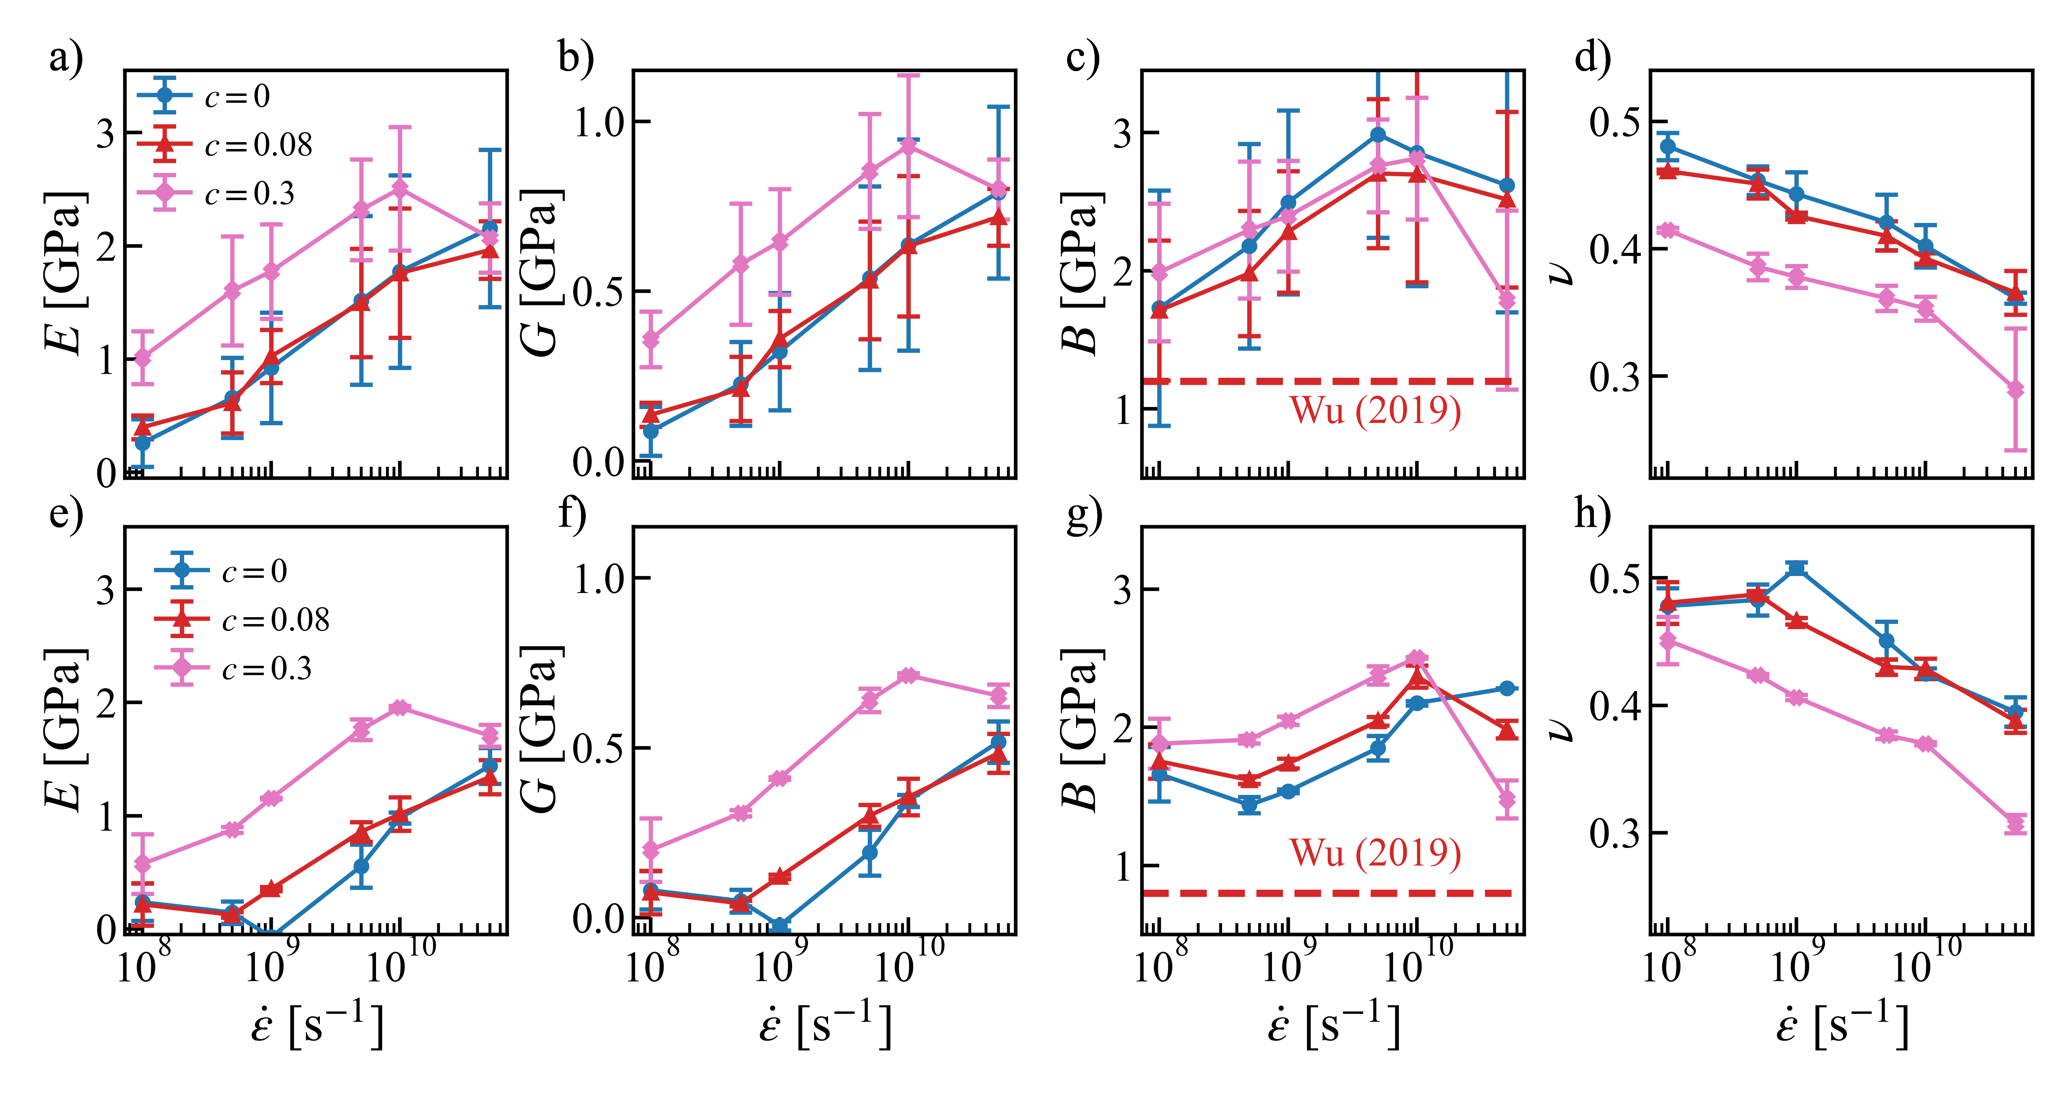
The elastic moduli and Poisson’s ratio calculated from Eq. 6 as a function of strain rate at two different effective temperatures () and three salt concentrations () are shown in Fig. 2. The error bars were estimated using the standard deviation from simulations with 5 different initial configurations. As shown in Fig. 2, both Young’s modulus and shear modulus were found to increase with the strain rate, as the polymer chains have less time to response to the strain which makes the chains look stiffer. The opposite was seen for the Poisson’s ratio, which approaches a perfect incompressible rubber state at a lower strain rate 48. In contrast, the bulk modulus seems to be insensitive to the strain rate. This explains why the simulation results agree quite well with the experimental bulk modulus 47, despite of the order of magnitude difference in the strain rate. Since the Lamé constant is the dominating contribution to (see Eq. 6, Figs. S3b,d), this also explains why the Poisson’s ratio has an opposite strain-rate dependence as compared to and .
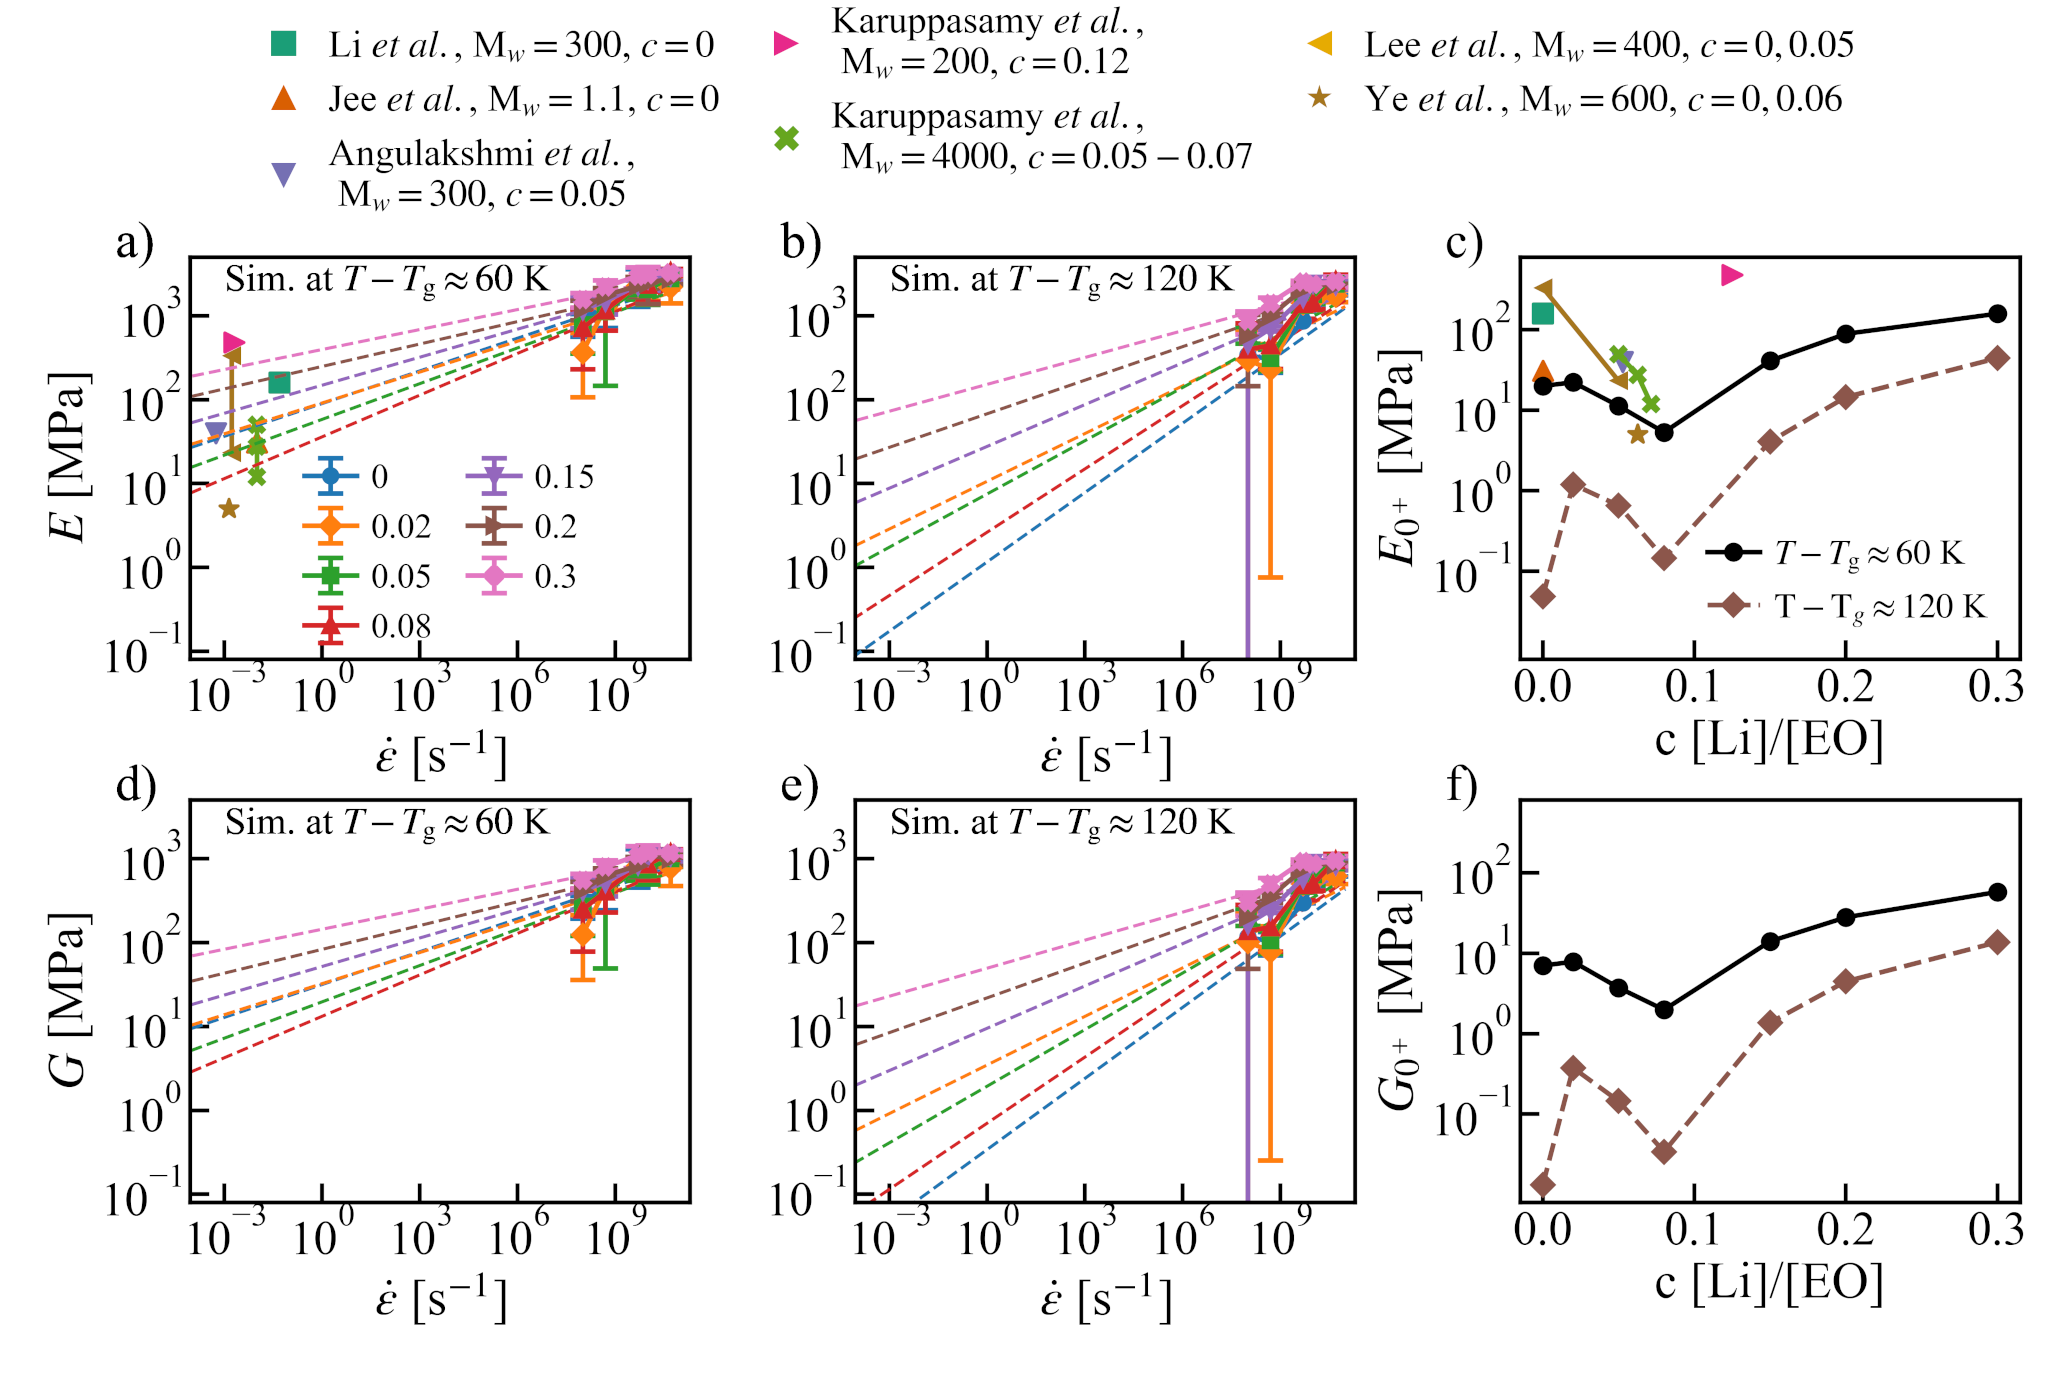
The strain rates used in the simulations are 8–10 orders of magnitude higher in comparison to the experimental strain rates ( s-1). Therefore, in order to compare with experimental Young’s modulus, the extrapolation was used. In Figs. 3a, b, d, and e, the and were plotted as function of strain rates and linear fittings in the log-log scale were carried out to estimate the near zero strain-rate Young’s modulus i.e., at a strain rate ( s-1) similar to the experimental one. As shown Fig. 3a, the extrapolations (dashed line) to the low strain rate are in very good agreement with the experimental values for PEO-based electrolytes in the same effective temperatures K.49, 50, 51, 52, 53, 54, 55 As shown in Figs. 2 and 3b and 3e, it is clear that increasing the effective temperature will reduce both the Young’s modulus and the shear modulus.
The salt concentration has a non-monotonic effect on both elastic moduli and Poisson’s ratio, which can be already seen in Fig. 2. At high salt concentration , both and become much larger as compared to the neat PEO system. However, at low and moderate concentrations, the effect can be the opposite and the increase in temperature may further convolute the situation. This can be clearly seen in Figs. 3c and 3f, which shows the salt concentration-dependence of and . Simulations results agree with the experimental trend that the elastic moduli decreases with a moderate increment in salt concentration (Figs. 3c). However, a further increase in the salt concentration beyond leads to enhanced elastic moduli instead as predicted by simulations.
3.2 Salt effects on relaxation modulus and viscosity
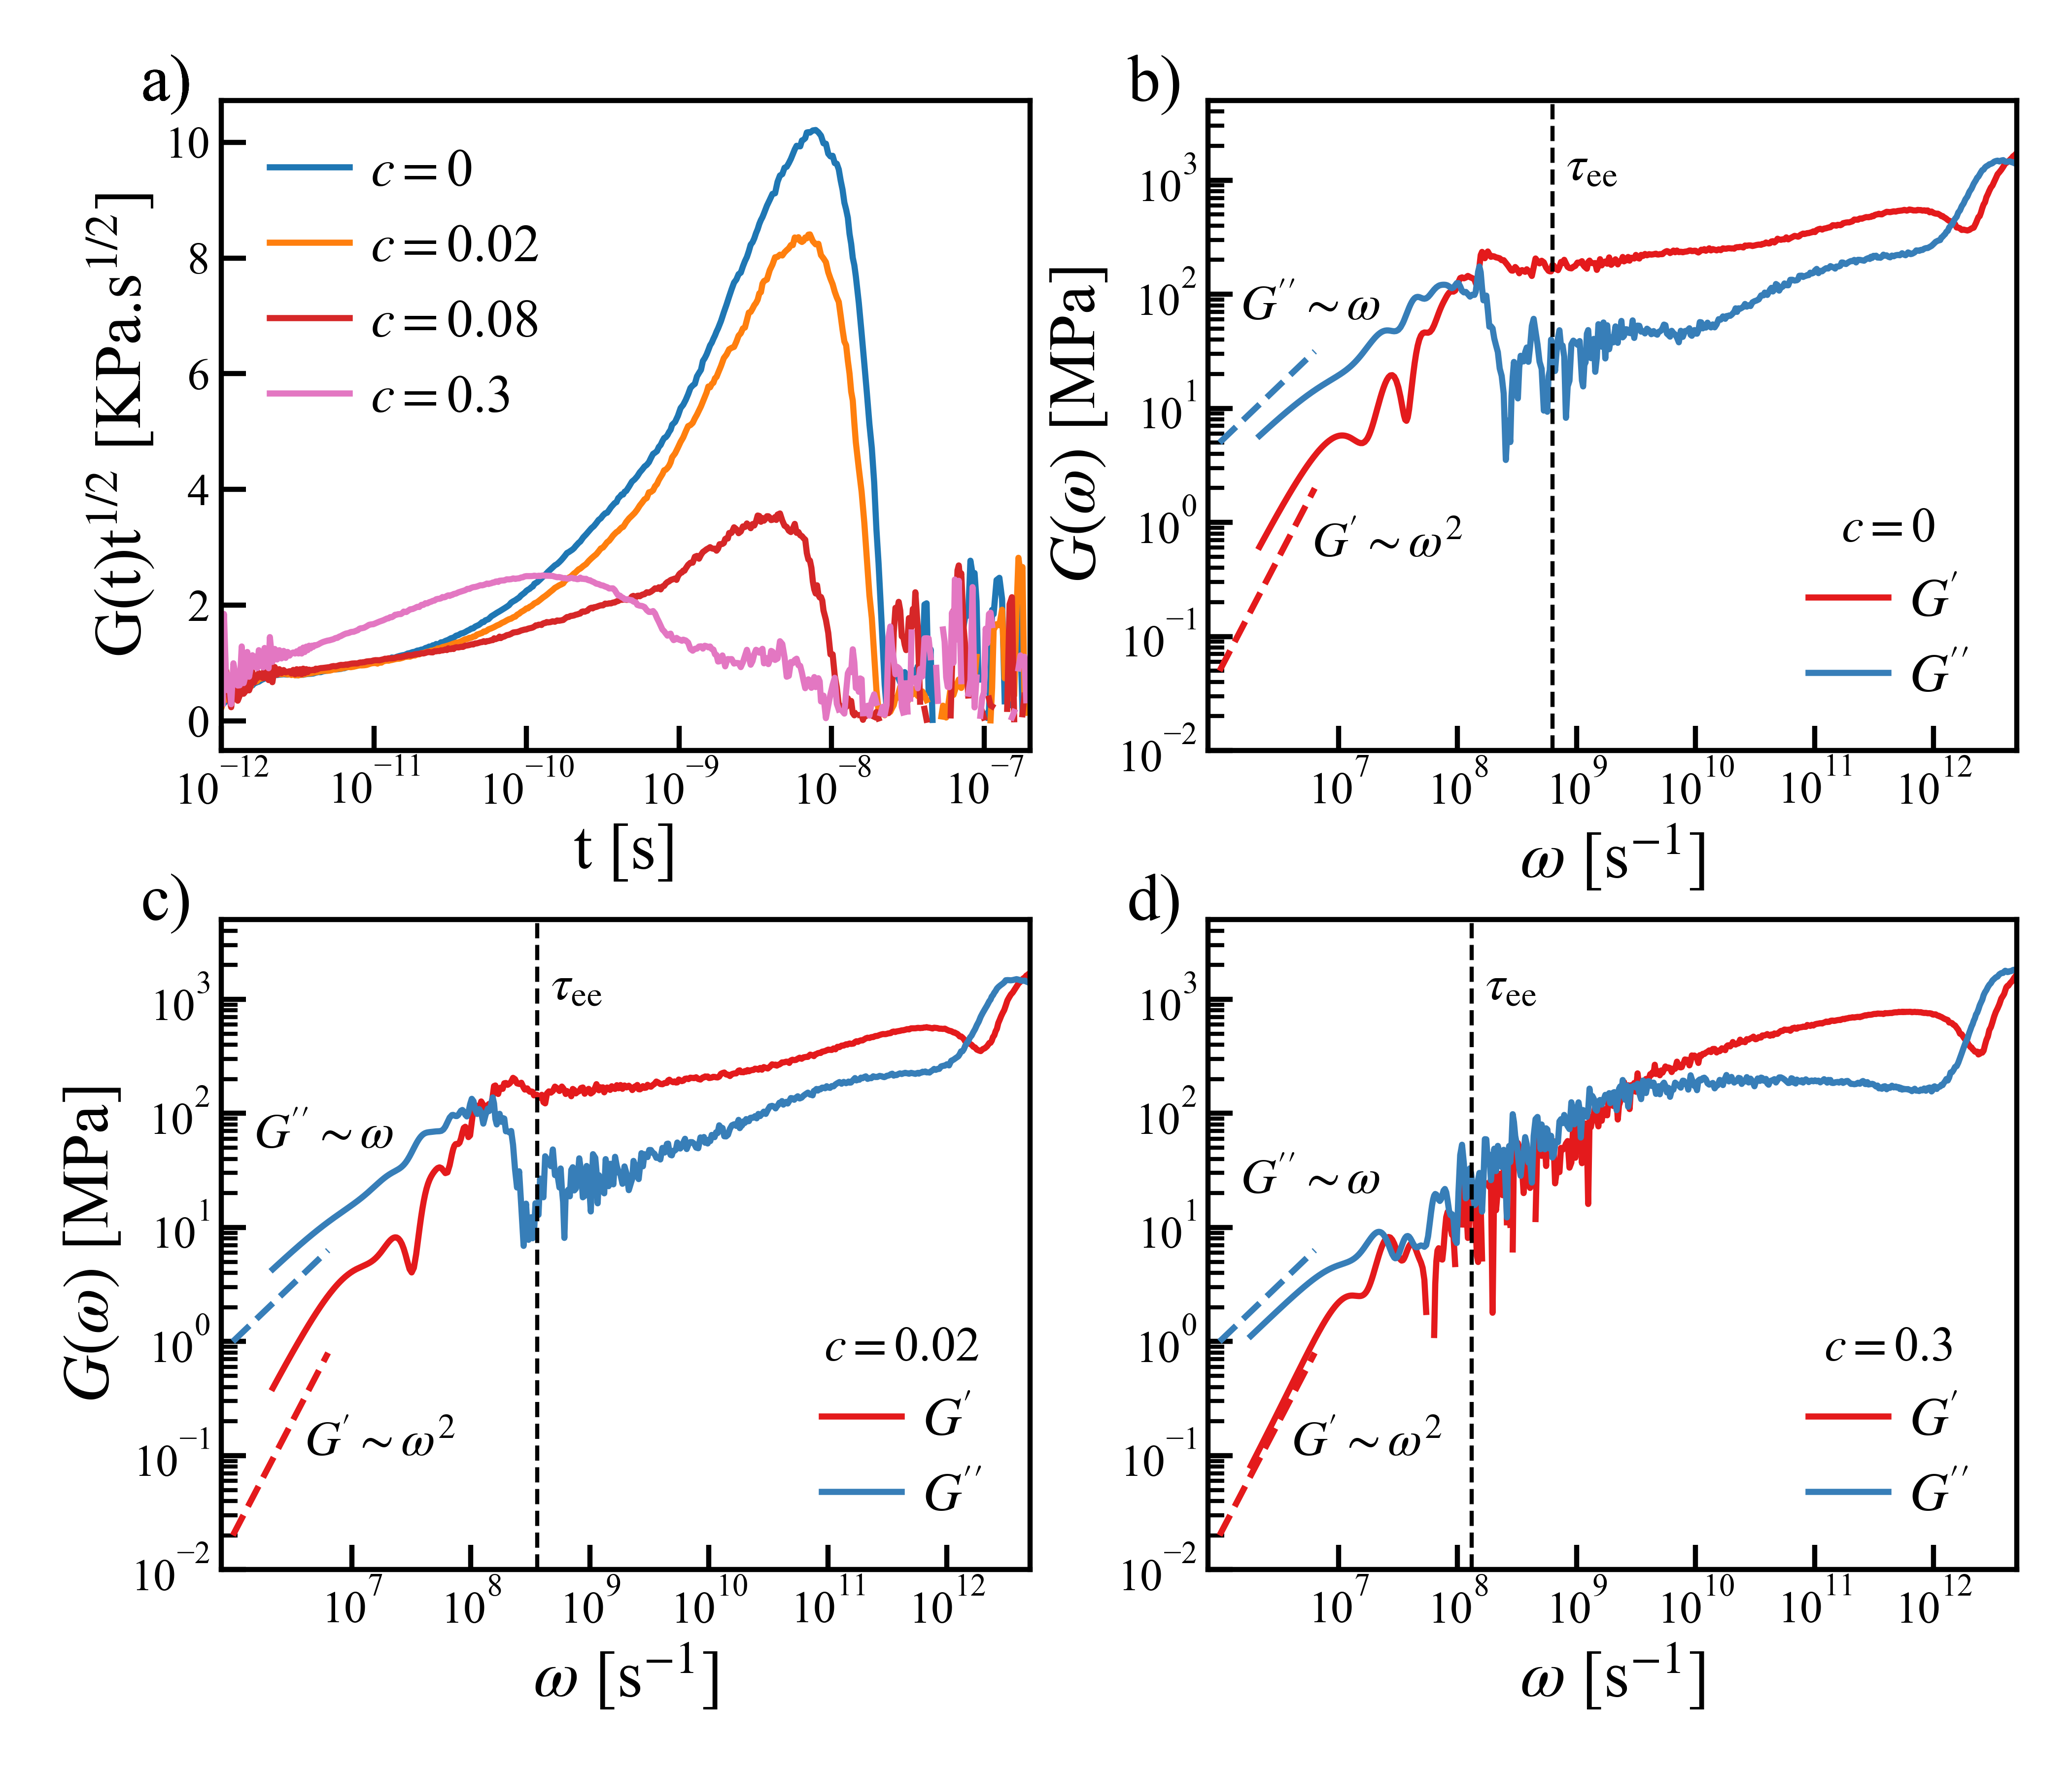
The shear stress relaxation moduli calculated from EMD simulations for different salt concentrations are shown in Fig. 4a. Likthman 56 has identified four time scales to the stress relaxation modulus by using a simple bead-spring model of polymer melt, namely i) the oscillatory behaviours at short time arises due to bond length relaxations; ii) the colloidal or glassy mode due to collisions between atoms; iii) the Rouse dynamics i.e. polymer relaxation according to the Rouse theory ; iv) the polymer entanglement. Given the rigid bond model and low molecular weight systems used in this study, it is natural for us to focus on identifying the Rouse dynamics. If the system follows the Rouse dynamics, then the product would equal to a constant. As shown in Fig. 4a, with the addition of salt, these dynamics seem to gradually deviate from the Rouse dynamics. The system with the highest salt concentration () shows the largest deviation from the Rouse theory. It is also interesting to note that the large peak shown in Fig. 4a resembles the entanglement behaviour of high molecular weight systems revealed in Ref. 56, and we will come back to this point in the paragraph below.
The storage modulus and the loss modulus for the neat PEO () and two concentrations ( and were plotted in Fig. 4 b, c, d. In all cases, a clear crossover from the solid-like behaviours to the liquid-like behaviours was observed. In the low frequency range, the asymptotic behaviors of viscoelastic liquid 59 and were also evinced in our simulations. In addition, a second cross-over at high frequency were seen in all cases from simulations. It is worth noting that the linear rheology experiments are usually conducted at much lower frequency (longer time scale) and at higher molecular weights 58, 60 and the second cross-over between and signals the entangled polymer dynamics 61. Nevertheless, similar observations made here suggest that the viscoelastic properties from low molecular weight system and equilibrium MD simulations may emulate the realistic polymer dynamics at much higher molecular weight and longer time scale.
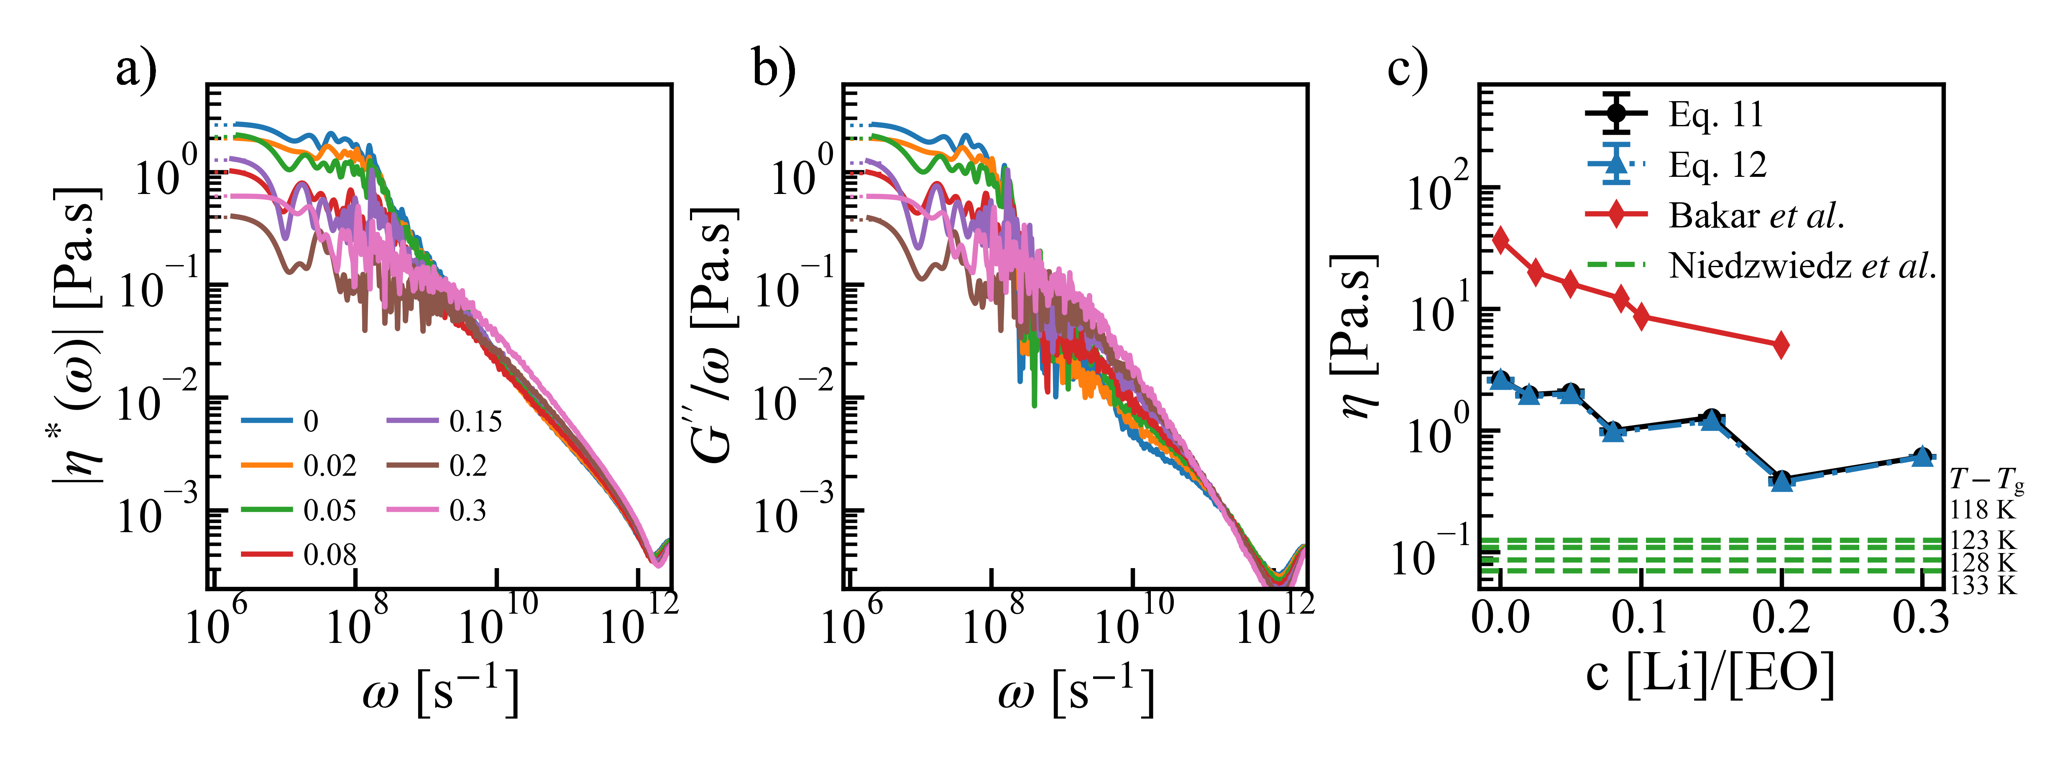
To make a further connection to experiment, we plotted the modulus of the complex viscosity in Fig. 5a for different salt concentrations at . As expected from Eq. 11, we observed that at lower frequency the values tend to become a constant and can be used to estimate the equilibrium viscosity . The same applies to the estimator based on Eq. 12 using the loss modulus (see Fig. 5b). The results of are shown in Fig. 5c. With an increase in concentration, tends to decrease with oscillations. A similar trend was also observed in the experiments 57 for PEO-LiTFSI systems (the red line in Fig. 5c). However, the viscosity values reported in experiment are 1 order of magnitude higher than the simulation results obtained here because of the difference in the molecular weight (20 kg/mol in experiment versus 1.1 kg/mol in simulation). Indeed, our results come closer to experimental reference58 measured at similar molecular weight (green dashed lines in Fig. 5c).
Before closing this section, it is worth noting that both the storage and loss modulus decrease with the increment in salt concentration (see Fig. 4b, c, d), which is similar to that of the equilibrium viscosity . This may appear in contradiction with the finding shown in Fig. 3f that the shear modulus increases with salt doping especially at high concentration. However, in the solid-like regime, i.e. at high frequency, the magnitude of indeed becomes larger by adding salts. Therefore, this contrast just reflects the opposite effects of salts on the shear modulus of ionic conductive polymers at different time scales. Furthermore, according to the Maxwell model, which is the combination of a Hookean solid and a Newtonian fluid, the shear stress relaxation time is determined by the ratio . This means the shear stress relaxation time should decrease more rapidly with the increase of the salt concentration. Indeed, this is borne, as shown by the cross-over time at the low frequency in Fig. 4.
3.3 Optimal salt concentration and self-healing capability
As stated in the Introduction, searching ionic conductive polymers that satisfy the requirements for both transport and mechanical properties and demonstrate self-healing functionality is an emerging topic in battery field. Therefore, it would be interesting to address this point from our simulations.
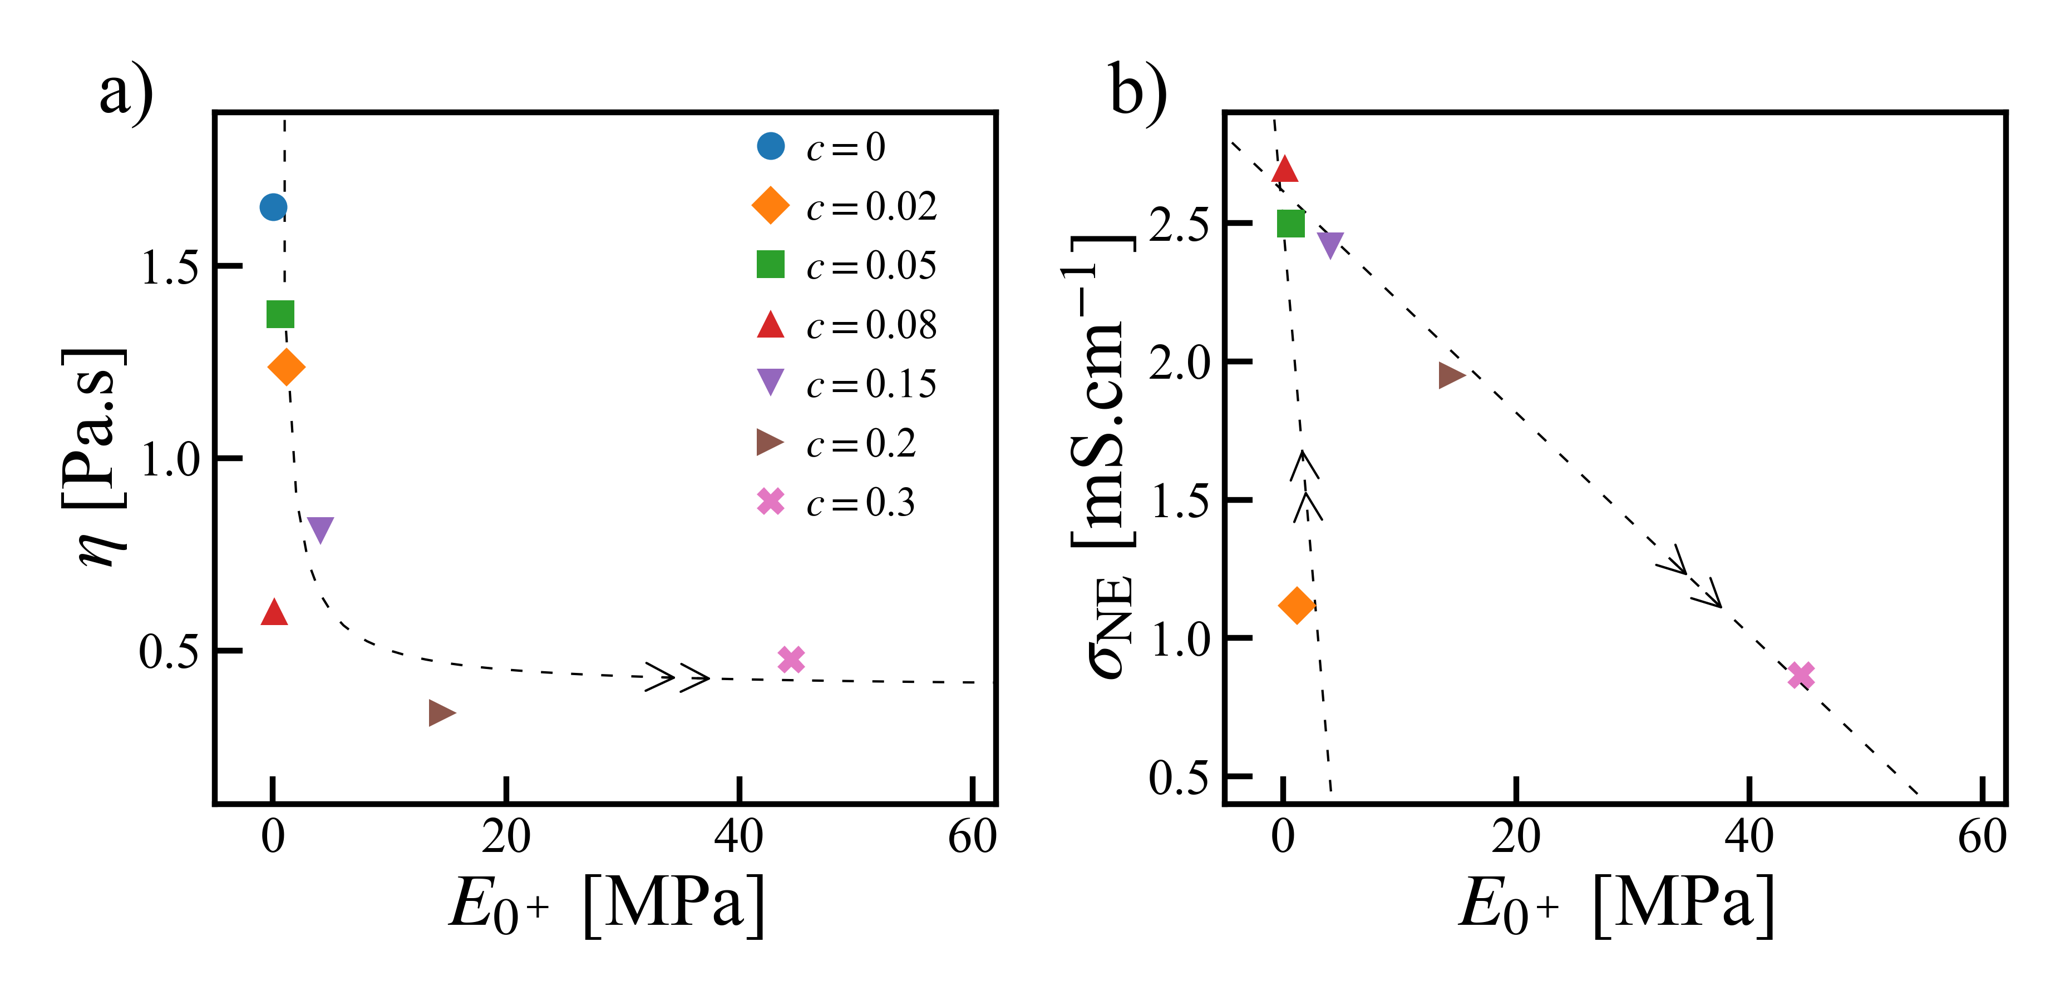
As shown in Fig. 6a, the salt effects on the equilibrium viscosity and the near zero strain-rate Young’s modulus are opposite, which makes these two quantities anti-correlated to each other. This means, there is a trade off between a good Newtonian fluid and a good Hookean solid, which is what the Maxwell relation implies 62.
However, when making the correlation between the ionic conductivity and the Youngs’ modulus , the situation is more interesting. Despite that and is also anti-correlated in general, there exist two regimes. From the low to the intermediate concentrations, goes up rapidly while slightly goes down; with a further increment in the concentration, goes down while goes up in a comparable degree. As a consequence, there is an intermediate salt concentration at where the system processes both high ionic conductivity and high Young’s modulus. It is worth noting that at a lower temperature, goes down while goes up. Therefore, an optimal salt concentration may be located where the requirements for both ionic conductivity and mechanical strength as mentioned in the Introduction can be achieved.
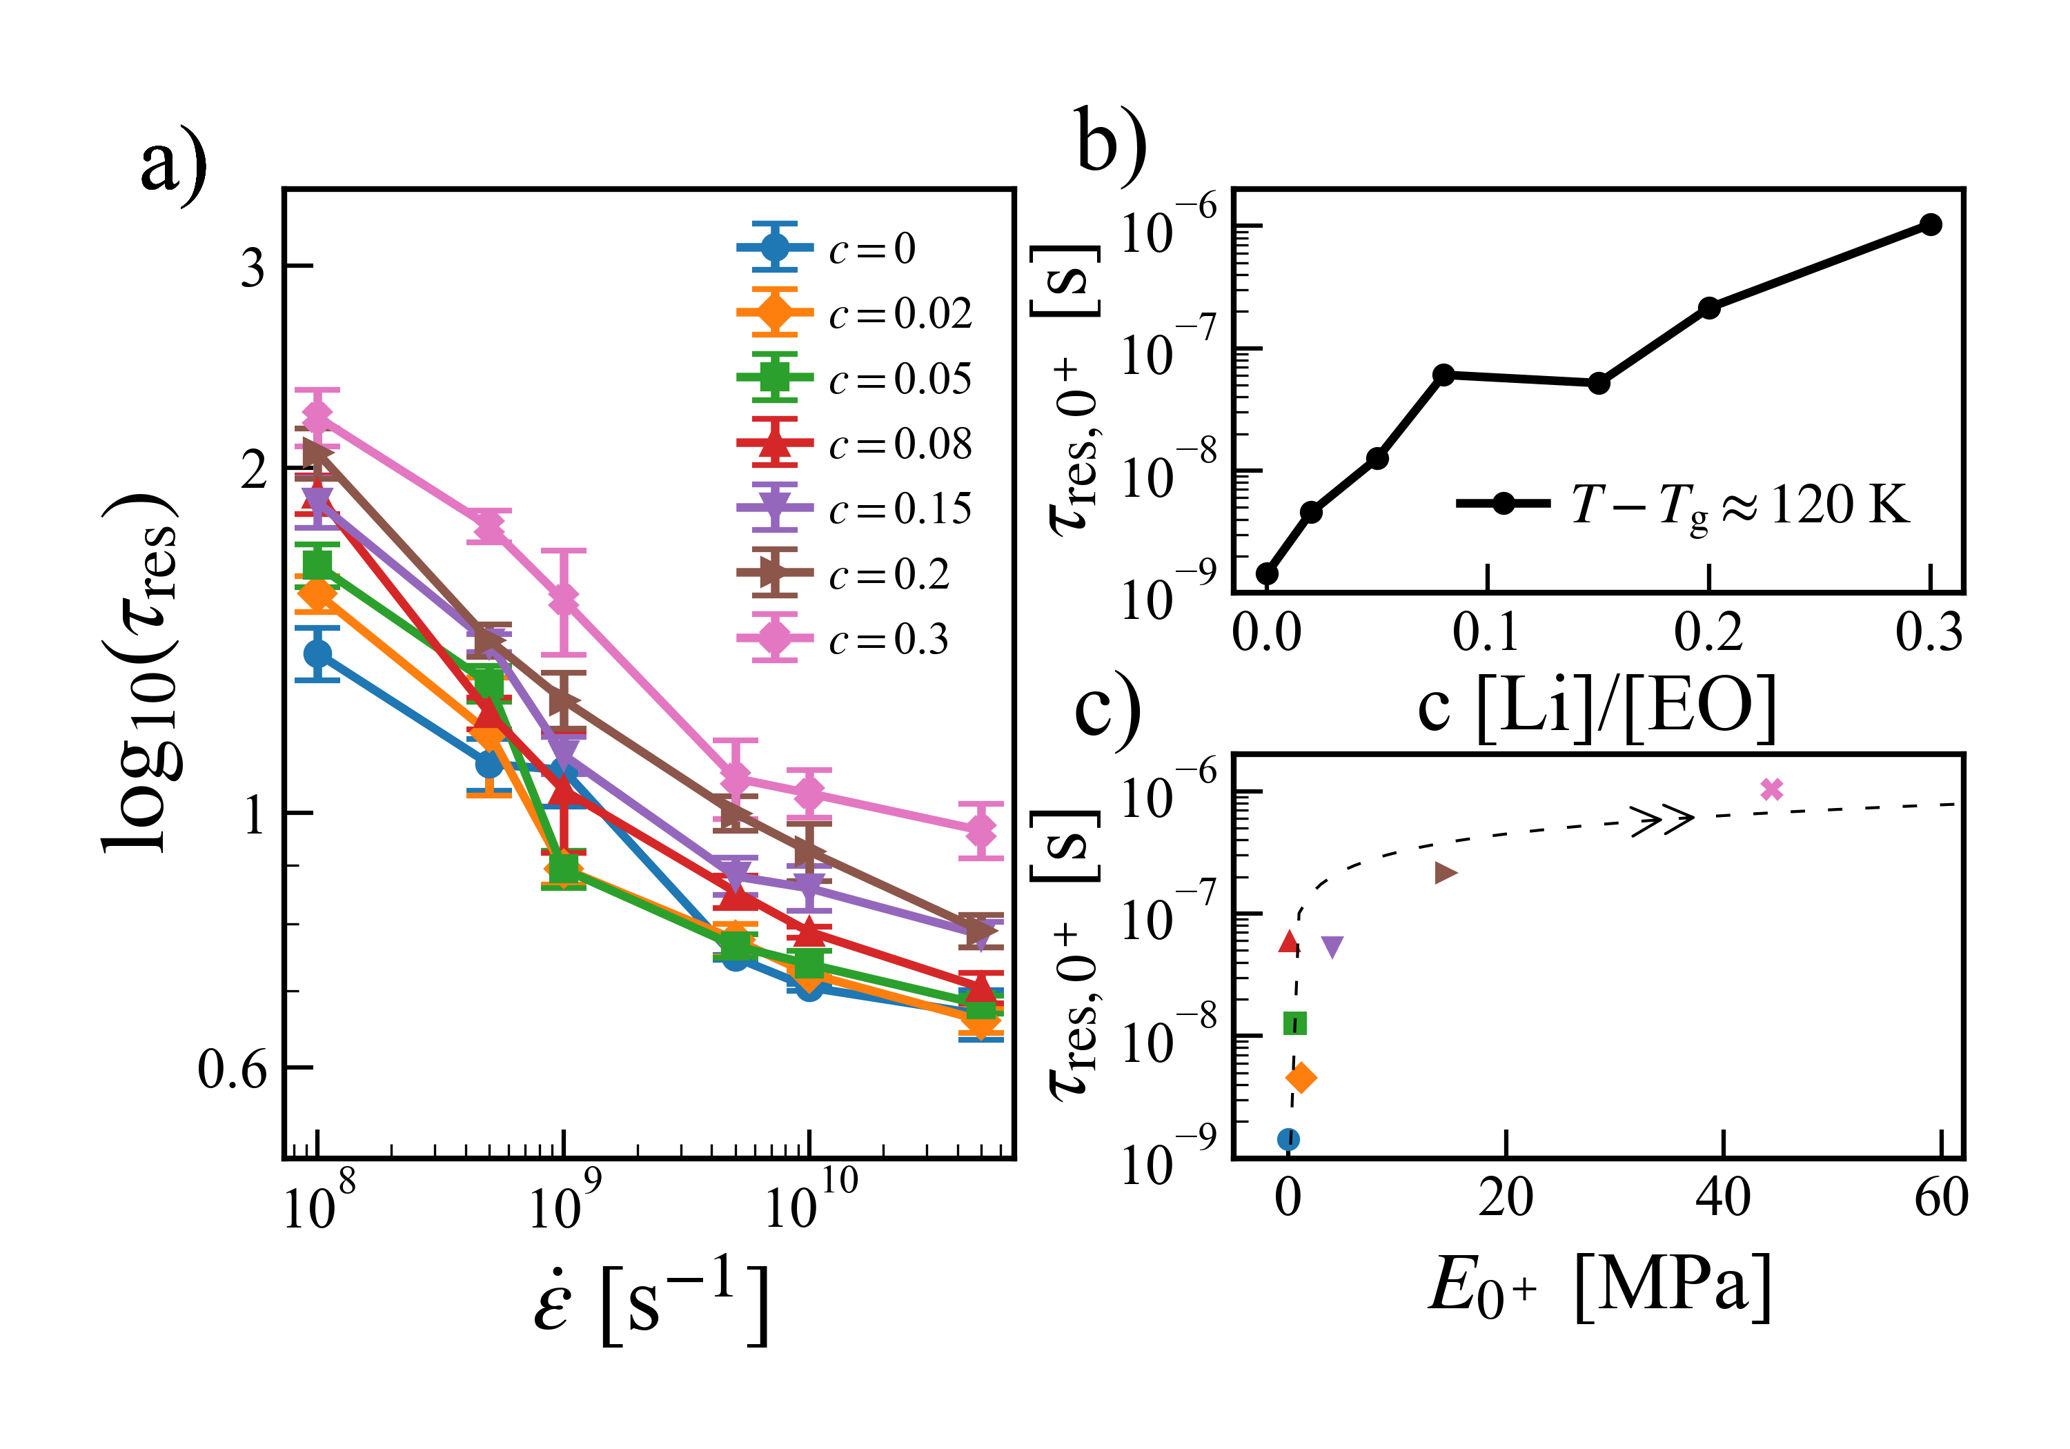
The final point that we want to address here is about the self-healing capability of ionic conductive polymers. Here, we define the self-healing capability as the elastic restoration time for the system to restore its equilibrium density after the expansion under a tensile strain (see the Supporting Information). As shown in Fig. 7a, despite all simulations used to compute the restoration time started with the same expansion rate of 20%, the resulting depends on the strain rate used in the generated these initial structures. This suggests that the self-healing capability depends on the history of how fast the deformation has taken place. Therefore, we used the elastic restoration time extrapolated to the near zero strain rate as a benchmark index.
As shown in Fig. 7b, increases with the salt concentration. This implies that correlate positively with the Young’s modulus , as seen in Fig. 7c. In other words, ionic conductive polymers of the highest Young’s modulus do not have the best self-healing capacity. However, this correlation is non-linear, and the system with shows a good balance between high Young’s modulus and short elastic restoration time.
4 Conclusions
In this study, we have carried out all-atom MD simulations to investigate salt effects on the mechanical properties of poly(ethylene oxide)-LiTFSI as a model ionic conductive polymer system with both non-equilibrium and equilibrium methods. The focus has been on both the elastic moduli and the relaxation modulus.
Regarding the elastic moduli, it is found that all-atom force fields commonly used in studying ion transport can reproduce quite well the experimental results of Young’s modulus and bulk modulus. Further, we found that the Poisson’s ratio goes down by increasing the strain-rate while the opposite happens to the Young’s modulus and shear modulus . We confirmed the experimental observation that in the low concentration regime, the Young’s modulus becomes smaller by adding salts. However, our simulation also revealed that a further increasing of the salt concentration can enhance the Young’s modulus instead.
In terms of the relaxation modulus, our MD simulations showed that the low molecular weight system and equilibrium MD simulations may emulate the entanglement features of the relaxation modulus, which should only happen in principle to polymer systems at much higher molecular weight and longer time scale. Moreover, the computed viscosity is in a good agreement with experimental results at a comparable molecular weight and we confirmed the experimental observation of a decrement in viscosity with salt concentration. The same trend was also seen for both the storage modulus and the loss modulus at the low frequency regime from simulations.
Besides comparing the results with experiments and studying the trends, we were able to identify an intermediate salt concentration at which the system possess both high ionic conductivity and high Young’s modulus. This intermediate salt concentration also leads to a short elastic restoration time, which can be relevant to the self-healing capacity of ionic conductive polymer.
We expect that more follow-up studies will come out to relate the self-healing capacity of ionic conductive polymers to their mechanical properties with all-atom MD simulations. In particular, questions such as how to define self-healing capacities from MD simulations and how to relate them to measurable experimental quantities should be addressed. By making these efforts, we would be able to understand the molecular mechanisms of self-healing functionality and to extract design principles for novel polymer binder materials.
This work was supported by the Knut and Alice Wallenberg Foundation (INTELiSTORE 139501042). The authors thank the funding from the Swedish National Strategic e-Science program eSSENCE, STandUP for Energy, and BASE (Batteries Sweden). The simulations were performed on the resources provided by the National Academic Infrastructure for Supercomputing in Sweden (NAISS) at PDC partially funded by the Swedish Research Council through Grant Agreement No. 2022-06725 and through the project access to the LUMI supercomputer, owned by the EuroHPC Joint Undertaking, hosted by CSC (Finland) and the LUMI consortium.
Comparison between LAMMPS and GROMACS simulations with the same force field implementation; strain-rate dependence of Lamé’s constants and ; summary of experimental references on the Youngs’ modulus and viscosity; calculations of elastic restoration time .
References
- Amici et al. 2022 Amici, J. et al. A Roadmap for Transforming Research to Invent the Batteries of the Future Designed within the European Large Scale Res earch Initiative BATTERY 2030+. Adv. Energy Mater. 2022, 12, 2102785
- Narayan et al. 2021 Narayan, R.; Laberty-Robert, C.; Pelta, J.; Tarascon, J.-M.; Dominko, R. Self-Healing: An Emerging Technology for Next-Generation Smart Batteries. Adv. Energy Mater. 2021, 2102652
- Liu et al. 2017 Liu, Y.; Tai, Z.; Zhou, T.; Sencadas, V.; Zhang, J.; Zhang, L.; Konstant̃inov, K.; Guo, Z.; Liu, H. K. An All-Integrated Anode via Interlinked Chemical Bonding between Double-Shelled–Yolk-Structured Silicon and Binder for Lithium-Ion Batteries. Adv. Mater. 2017, 29, 1703028
- Yang et al. 2021 Yang, S.; Zhang, Y.; Li, Z.; Takenaka, N.; Liu, Y.; Zou, H.; Chen, W. n.; Du, M.; Hong, X.-J.; Shang, R.; Nakamura, E.; Cai, Y.-P.; Lan, Y.-Q.; Zheng, Y., Qifeng a nd Yamada; Yamada, A. Rational Electrolyte Design to Form Inorganic–Polymeric Interphase on Silicon-Based Anodes. ACS Energy Lett. 2021, 6, 1811–1820
- Zhou et al. 2022 Zhou, Y.; Li, L.; Han, Z.; Li, Q.; He, J.; Wang, Q. Self-Healing Polymers for Electronics and Energy Devices. Chem. Rev. 2022, 123, 558–612
- Chen et al. 2019 Chen, J.; Li, F.; Luo, Y.; Shi, Y.; Ma, X.; Zhang, M.; Boukhvalov, D. W.; Lũo, Z. A self-healing elastomer based on an intrinsic non-covalent cross-linking mechanism. J. Mater. Chem. A 2019, 7, 15207–15214
- Mi et al. 2019 Mi, H.; Yang, X.; Li, F.; Zhuang, X.; Chen, C.; Li, Y.; Zhang, P. Self-healing silicon-sodium alginate-polyaniline composites originated from the enhancement hydrogen bonding for lith ium-ion battery: A combined simulation and experiment study. J. Power Sources 2019, 412, 749–758
- Xie et al. 2021 Xie, Z.; Hu, B.-L.; Li, R.-W.; Zhang, Q. Hydrogen Bonding in Self-Healing Elastomers. ACS Omega 2021, 6, 9319–9333
- Yang et al. 2015 Yang, Y.; Ding, X.; Urban, M. W. Chemical and physical aspects of self-healing materials. Prog. Polym. Sci. 2015, 49-50, 34 – 59
- Li et al. 2022 Li, B.; Cao, P.-F.; Saito, T.; Sokolov, A. P. Intrinsically Self-Healing Polymers: From Mechanistic Insight to Current Challenges. Chem. Rev. 2022, 123, 701–735
- Dufort and Tibbitt 2019 Dufort, B. M.; Tibbitt, M. Design of moldable hydrogels for biomedical applications using dynamic covalent boronic esters. Mater. Today Chem. 2019, 12, 16–33
- Zhang et al. 2014 Zhang, L.; Zhang, L.; Chai, L.; Xue, P.; Hao, W.; Zheng, H. A coordinatively cross-linked polymeric network as a functional binder for high-performance silicon submicro-particle anodes in lithium-ion batteries. J. Mater. Chem. A 2014, 2, 19036–19045
- Kwon et al. 2015 Kwon, T.-w.; Jeong, Y. K.; Deniz, E.; AlQaradawi, S. Y.; Choi, J. W.; Coskun, A. Dynamic Cross-Linking of Polymeric Binders Based on Host–Guest Interactions for Silicon Anodes in Lithium Ion Batteri es. ACS Nano 2015, 9, 11317–11324
- Yue et al. 2016 Yue, L.; Ma, J.; Zhang, J.; Zhao, J.; Dong, S.; Liu, Z.; Cui, G.; Chen, L. All solid-state polymer electrolytes for high-performance lithium ion batteries. Energy Storage Mater. 2016, 5, 139–164
- Mindemark et al. 2018 Mindemark, J.; Lacey, M. J.; Bowden, T.; Brandell, D. Beyond PEO—Alternative Host Materials for Li+-Conducting Solid Polymer Electrolytes. Prog. Polym. Sci. 2018, 81, 114–143
- Zhang et al. 2023 Zhang, C. et al. 2023 roadmap on molecular modelling of electrochemical energy materials. JPhys Energy 2023, 5, 041501
- France-Lanord and Grossman 2019 France-Lanord, A.; Grossman, J. C. Correlations from Ion Pairing and the Nernst-Einstein Equation. Phys. Rev. Lett. 2019, 122, 136001
- Fong et al. 2019 Fong, K. D.; Self, J.; Diederichsen, K. M.; Wood, B. M.; McCloskey, B. D.; Persson, K. n. A. Ion Transport and the True Transference Number in Nonaqueous Polyelectrolyte Solutions for Lithium Ion Batteries. ACS Cent. Sci. 2019, 5, 1250 – 1260
- Zhang et al. 2020 Zhang, Z.; Wheatle, B. K.; Krajniak, J.; Keith, J. R.; Ganesan, V. Ion Mobilities, Transference Numbers, and Inverse Haven Ratios of Polymeric Ionic Liquids. ACS Macro Lett. 2020, 9, 84–89
- Shen and Hall 2020 Shen, K.-H.; Hall, L. M. Effects of Ion Size and Dielectric Constant on Ion Transport and Transference Number in Polymer Electrolytes. Macromolecules 2020, 53, 10086–10096
- Bollinger et al. 2020 Bollinger, J. A.; Stevens, M. J.; Frischknecht, A. L. Quantifying Single-Ion Transport in Percolated Ionic Aggregates of Polymer Melts. ACS Macro Lett. 2020, 9, 583–587
- Gudla et al. 2020 Gudla, H.; Zhang, C.; Brandell, D. Effects of Solvent Polarity on Li-Ion Diffusion in Polymer Electrolytes: An All-atom Molecular Dynamics Study with Charge Scaling. J. Phys. Chem. B 2020, 124, 8124–8131
- Gudla et al. 2021 Gudla, H.; Shao, Y.; Phunnarungsi, S.; Brandell, D.; Zhang, C. Importance of the Ion-Pair Lifetime in Polymer Electrolytes. J. Phys. Chem. Lett. 2021, 12, 8460–8464
- Halat et al. 2022 Halat, D. M.; Fang, C.; Hickson, D.; Mistry, A.; Reimer, J. A.; Balsara, N. P.; Wang, R. Electric-Field-Induced Spatially Dynamic Heterogeneity of Solvent Motion and Cation Transference in Electrolytes. Phys. Rev. Lett. 2022, 128, 198002
- Shao et al. 2022 Shao, Y.; Gudla, H.; Brandell, D.; Zhang, C. Transference Number in Polymer Electrolytes: Mind the Reference-Frame Gap. J. Am. Chem. Soc. 2022, 144, 7583–7587
- Shao and Zhang 2023 Shao, Y.; Zhang, C. Bruce–Vincent transference numbers from molecular dynamics simulations. J. Chem. Phys. 2023, 158, 161104
- Mogurampelly et al. 2016 Mogurampelly, S.; Sethuraman, V.; Pryamitsyn, V.; Ganesan, V. Influence of nanoparticle-ion and nanoparticle-polymer interactions on ion transport and viscoelastic properties of p olymer electrolytes. J. Chem. Phys. 2016, 144, 154905
- Verners et al. 2016 Verners, O.; Thijsse, B. J.; Duin, A. C. v.; Simone, A. Salt concentration effects on mechanical properties of LiPF6/poly(propylene glycol) diacrylate solid electrolyte: Ins ights from reactive molecular dynamics simulations. Electrochim. Acta 2016, 221, 115–123
- Sampath and Hall 2017 Sampath, J.; Hall, L. M. Impact of ionic aggregate structure on ionomer mechanical properties from coarse-grained molecular dynamics simulatio ns. J. Chem. Phys. 2017, 147, 134901
- Verners et al. 2018 Verners, O.; Lyulin, A. V.; Simone, A. Salt concentration dependence of the mechanical properties of LiPF6/poly(propylene glycol) acrylate electrolyte at a graphitic carbon interface: A reactive molecular dynamics study. J. Polym. Sci., Part B: Polym. Phys. 2018, 56, 718–730
- Sampath and Hall 2018 Sampath, J.; Hall, L. M. Impact of ion content and electric field on mechanical properties of coarse-grained ionomers. J. Chem. Phys. 2018, 149, 163313
- Brinson and Brinson 2015 Brinson, H. F.; Brinson, L. C. Polymer Engineering Science and Viscoelasticity: An Introduction; 2015; pp 1–482
- Suter and Eichinger 2002 Suter, U.; Eichinger, B. Estimating elastic constants by averaging over simulated structures. Polymer 2002, 43, 575–582
- Clancy et al. 2009 Clancy, T. C.; Frankland, S. J.; Hinkley, J. A.; Gates, T. S. Molecular modeling for calculation of mechanical properties of epoxies with moisture ingress. Polymer 2009, 50, 2736–2742
- David et al. 2019 David, A.; De Nicola, A.; Tartaglino, U.; Milano, G.; Raos, G. Viscoelasticity of Short Polymer Liquids from Atomistic Simulations. J. Electrochem. Soc. 2019, 166, B3246–B3256
- Liu et al. 2012 Liu, H.; Maginn, E.; Visser, A. E.; Bridges, N. J.; Fox, E. B. Thermal and Transport Properties of Six Ionic Liquids: An Experimental and Molecular Dynamics Study. Ind. Eng. Chem. Res. 2012, 51, 7242–7254
- Ramírez et al. 2010 Ramírez, J.; Sukumaran, S. K.; Vorselaars, B.; Likhtman, A. E. Efficient on the fly calculation of time correlation functions in computer simulations. J. Chem. Phys. 2010, 133
- Paul Müller 2012 Paul Müller, Python multiple-tau algorithm (Version 0.3.3). \urlhttps://pypi.python.org/pypi/multipletau/, 2012; Accessed: 2023-09-01
- Adeyemi 2022 Adeyemi, O. Molecular dynamics investigation of viscoelastic properties of polymer melts. Ph.D. thesis, 2022
- Adeyemi et al. 2022 Adeyemi, O.; Zhu, S.; Xi, L. Equilibrium and non-equilibrium molecular dynamics approaches for the linear viscoelasticity of polymer melts. Phys. Fluids 2022, 34
- Wang et al. 2004 Wang, J.; Wolf, R. M.; Caldwell, J. W.; Kollman, P. A.; Case, D. A. Development and testing of a general amber force field. J. Comput. Chem. 2004, 25, 1157–1174
- Thompson et al. 2022 Thompson, A. P.; Aktulga, H. M.; Berger, R.; Bolintineanu, D. S.; Brown, W. M.; Crozier, P. S.; in ’t Veld, P. J.; Kohlmeyer, A.; Moore, S. G.; Nguyen, T. D.; Shan, R.; Stevens, M. J.; Tranchida, J.; Trott, C.; Plimpton, S. J. LAMMPS - a flexible simulation tool for particle-based materials modeling at the atomic, meso, and continuum scales. Comp. Phys. Comm. 2022, 271, 108171
- Abraham et al. 2015 Abraham, M. J.; Murtola, T.; Schulz, R.; Páll, S.; Smith, J. C.; Hess, B.; Lindah, E. GROMACS: High performance molecular simulations through multi-level parallelism from laptops to supercomputers. SoftwareX 2015, 1-2, 19–25
- Evans and Holian 1985 Evans, D. J.; Holian, B. L. The Nose–Hoover thermostat. J. Chem. Phys. 1985, 83, 4069–4074
- Evans and Morriss 1984 Evans, D. J.; Morriss, G. P. Nonlinear-response theory for steady planar Couette flow. Phys. Rev. A 1984, 30, 1528–1530
- Nosé and Klein 1983 Nosé, S.; Klein, M. Constant pressure molecular dynamics for molecular systems. Mol. Phys. 1983, 50, 1055–1076
- Wu 2019 Wu, C. Bulk modulus of poly(ethylene oxide) simulated using the systematically coarse-grained model. Comput. Mater. Sci. 2019, 156, 89–95
- Greaves et al. 2011 Greaves, G. N.; Greer, A. L.; Lakes, R. S.; Rouxel, T. Poisson’s ratio and modern materials. Nat. Mater. 2011, 10, 823–837
- Li et al. 2020 Li, J.; Zhu, K.; Yao, Z.; Qian, G.; Zhang, J.; Yan, K.; Wang, J. A promising composite solid electrolyte incorporating LLZO into PEO/PVDF matrix for all-solid-state lithium-ion batteries. Ionics 2020, 26, 1101–1108
- Jee et al. 2013 Jee, A.-Y.; Lee, H.; Lee, Y.; Lee, M. Determination of the elastic modulus of poly(ethylene oxide) using a photoisomerizing dye. Chem. Phys. 2013, 422, 246–250
- Angulakshmi et al. 2014 Angulakshmi, N.; Kumar, R. S.; Kulandainathan, M. A.; Stephan, A. M. Composite Polymer Electrolytes Encompassing Metal Organic Frame Works: A New Strategy for All-Solid-State Lithium Batteries. J. Phys. Chem. C 2014, 118, 24240–24247
- Karuppasamy et al. 2016 Karuppasamy, K.; Rhee, H. W.; Reddy, P. A.; Gupta, D.; Mitu, L.; Polu, A. R.; Sahaya Shajan, X. Ionic liquid incorporated nanocomposite polymer electrolytes for rechargeable lithium ion battery: A way to achieve improved electrochemical and interfacial properties. J. Ind. Eng. Chem. 2016, 40, 168–176
- Karuppasamy et al. 2017 Karuppasamy, K.; Kim, D.; Kang, Y. H.; Prasanna, K.; Rhee, H. W. Improved electrochemical, mechanical and transport properties of novel lithium bisnonafluoro-1-butanesulfonimidate (LiBNFSI) based solid polymer electrolytes for rechargeable lithium ion batteries. J. Ind. Eng. Chem. 2017, 52, 224–234
- Lee et al. 2019 Lee, J.; Howell, T.; Rottmayer, M.; Boeckl, J.; Huang, H. Free-Standing PEO/LiTFSI/LAGP Composite Electrolyte Membranes for Applications to Flexible Solid-State Lithium-Based Batteries. J. Electrochem. Soc. 2019, 166, A416–A422
- Ye et al. 2015 Ye, Y.-S.; Wang, H.; Bi, S.-G.; Xue, Y.; Xue, Z.-G.; Zhou, X.-P.; Xie, X.-L.; Mai, Y.-W. High performance composite polymer electrolytes using polymeric ionic liquid-functionalized graphene molecular brushes. J. Mater. Chem. A 2015, 3, 18064–18073
- Likhtman et al. 2007 Likhtman, A. E.; Sukumaran, S. K.; Ramirez, J. Linear viscoelasticity from molecular dynamics simulation of entangled polymers. Macromolecules 2007, 40, 6748–6757
- Bakar et al. 2023 Bakar, R.; Darvishi, S.; Aydemir, U.; Yahsi, U.; Tav, C.; Menceloglu, Y. Z.; Senses, E. Decoding Polymer Architecture Effect on Ion Clustering, Chain Dynamics, and Ionic Conductivity in Polymer Electrolytes. ACS Appl. Energy Mater. 2023, 6, 4053–4064
- Niedzwiedz et al. 2008 Niedzwiedz, K.; Wischnewski, A.; Pyckhout-Hintzen, W.; Allgaier, J.; Richter, D.; Faraone, A. Chain dynamics and viscoelastic properties of poly(ethylene oxide). Macromolecules 2008, 41, 4866–4872
- Verdier 2003 Verdier, C. Rheological Properties of Living Materials. From Cells to Tissues. Theor. Med. 2003, 5, 67–91
- Behbahani et al. 2021 Behbahani, A. F.; Schneider, L.; Rissanou, A.; Chazirakis, A.; Bačová, P.; Jaña, P. K.; Li, W.; Doxastakis, M.; Polińska, P.; Burkhart, C.; Müller, M.; Harmandar̃is, V. A. Dynamics and Rheology of Polymer Melts via Hierarchical Atomistic, Coarse-Grained, and Slip-Spring Simulations. Macromolecules 2021, 54, 2740–2762
- Rubinstein and Colby 2016 Rubinstein, M.; Colby, R. H. Polymer physics, 1st ed.; Oxford University Press Oxford: Oxford, 2016
- Angell et al. 1998 Angell, C. A.; Imrie, C. T.; Ingram, M. D. From simple electrolyte solutions through polymer electrolytes to superionic rubbers: some fundamental cons iderations. Polym. Int. 1998, 47, 9–15