Modal Analysis of the Wake Shed Behind a Horizontal Axis Wind Turbine with Flexible Blades
Abstract
The proper orthogonal decomposition (POD) has been applied on a full-scale horizontal-axis wind turbine (HAWT) to shed light on the wake characteristics behind the wind turbine. In reality, the blade tip experiences high deflections even at the rated conditions which definitely alter the wake flow field, and in the case of a wind farm, may complicate the inlet conditions of the downstream wind turbine. The turbine under consideration is the full-scale model of the NREL 5MW onshore wind turbine which is accompanied by several simulation complexities including turbulence, mesh motion and fluid-structure interaction (FSI). Results indicated an almost similar modal behaviour for the rigid and flexible turbines at the wake region. In addition, more flow structures in terms of local vortices and fluctuating velocity fields take place at the far wake region. The flow structures due to the wake shed from the tower tend to move towards the center and merge with that of the nacelle leading to an integral vortical structure 2.5D away from the rotor. Also, it is concluded that the exclusion of the tower leads to missing a major part of the wake structures, especially at far-wake positions.
I Introduction
Clean energies are considered to be a suitable substitute for conventional carbon-intensive energy resources to decrease environmental disasters such as climate change, global warming and acid rain. In this matter, a great portion of the global energy demand due to the world population surge in the last decades can be addressed with renewable energy resources (Alkhabbaz et al., 2022; Siddiqui et al., 2022). Therefore, more investments have been drawn to the development and optimization of utilization of these energy sources (Bajuri et al., 2022; Spyropoulos et al., 2022).
Wind energy is characterized as a feasible substitute owing to its availability, reliability and cleanness. Wind Turbines are one of the major sources of energy production burdening low impact on the environment and are associated with high efficiency and performance(Majidi Nezhad et al., 2022; Zhang et al., 2020). This led to a great rise in the installation of wind turbines around the world and it is predicted that the share of wind turbines in electricity production will rise to 5% by 2030 (Moghaddam et al., 2011). To meet the increasing demand for energy production, large-scale wind turbines are going to be clustered in more extensive areas with condensed configurations to ensure enough energy production. In fact, two challenges are always highlighted among the vital design factors of the large-scale offshore wind farm (Uchida et al., 2021; Bastankhah and Portagel, 2019; Jaiswal et al., 2022): (i) the wake shed by the upstream turbines which can decrease the amount of power generated by the downstream turbines and (ii) the probability of failure of the wind turbine structures including nacelle and blades. An efficient and reliable design of wind turbine heavily depends on the identification of the dynamics of wind turbine wakes and their effects associated with neighbouring wind turbines for optimization and development of next-gen wind turbines and wind farms (Regodeseves and Morros, 2021; Uchida and Gagnon, 2022). Moreover, a full analysis of the near and far wake regions of the wind turbine is necessary to accomplish the performance assessment of the blades and further acoustic analysis. The wake region behind a wind turbine can exhibit flow structures ranging from millimetres to hundred meters which correspond to the size of wind turbine components (Kabir and Ng, 2019; Kabir et al., 2020; Purohit, Kabir, and Ng, 2021).
Although large-scale offshore wind turbines undergo severe aerodynamic and weight forces, they have attained a lot of attention during recent years due to their high ability in power production, less visual and environmental impacts and abundance of wind in offshore areas (Zhang and Kim, 2018; Liu et al., 2019). To overcome this complication, manufacturers aim to produce lighter blades to mitigate the problem of large loads applied to the tower and mechanical connections (Tarfaoui, Nachtane, and Boudounit, 2020; Liu et al., 2022). As a result, the larger and lighter blades lead to more flexible structures which alter the performance of the wind turbine and flow structures shedding from the rotor needs also to be studied (Hand, Kelly, and Cashman, 2021; Sathish, 2021). Moreover, the wind turbines are typically placed in wind farms in tandem configuration, and therefore, the effect of blade flexibility on the wake shed behind the rotor needs to be investigated as well. As a result, this study, as one of the primary objectives, is intended to investigate the phenomenon of wake shed behind a HAWT. For this purpose, Proper Orthogonal Decomposition (POD) will be utilized to extract the hidden structures of the fluid flow.
The employment of POD to extract different modes of flow dynamics was first proposed by Lumely (Lumley, 1967). This idea was then nurtured and developed into more robust methods in different studies namely, Sirovich (Sirovich, 1987) who put forward the concept of snapshot POD. Consequently, in recent years, the advances in Reduced Order Modelling (ROM) techniques have led to plenty of studies intended to enlighten the hidden flow characteristics by employing methods like POD (Sheidani et al., 2023a; Lassila et al., 2014; Verveld and Kier, 2017; Štefan et al., 2017; Sinha, Chauhan, and Balasubramanian, 2018; Wang, Ma, and Liu, 2018; Chouak, Dufresne, and Seers, 2018; Benner et al., 2021, 2020a, 2020b; Star et al., 2021; Barra et al., 2021). For instance, Premaratne et al. (Premaratne, Tian, and Hu, 2022) investigated coherent vortices embedded in the turbulent wake flow behind a prototype HAWT experimentally. A high-resolution Particle Imaging Velocimetry (PIV) system was used to quantify the evolution of the unsteady wake vortices. The POD analysis was followingly conducted to identify energetic vortex patterns in the turbulent near wake. They concluded that the wake region adjacent to the turbine accounts for a high percentage (62%) of the modal energy. While highly stretched fluctuations, especially in the vertical direction, were observed at the end of the wake region.
Due to the large dimensions of such turbines, the experimental study regarding the blades’ flexibility effects is impractical. In addition, it is hard to establish a complete similarity between the actual model and the prototype. For instance, in the existence of sea waves, an equal value of Froude number should be maintained to ensure hydrodynamic similarity. However, maintaining similar aerodynamic dimensionless numbers such as the Tip Speed Ratio (TSR) and Reynolds Number at the same time is almost impossible (Khosravi, Sarkar, and Hu, 2016; Fontanella et al., 2021; Mancini et al., 2020; Madsen et al., 2020). As a result, the numerical methods may yield more reliable outcomes for offshore wind turbines owing to the fact that all the details are taken into consideration.
From the numerical perspective, to take the effect of blade flexibility into consideration, the structural and fluid dynamics phenomena need to be modelled by independent solvers followed by an interface to transmit the results from one to the other (Tran and Kim, 2018; Deng, Xiao, and Yang, 2020). Obviously, the accuracy and computational cost are the two main factors which govern the Fluid-Structure Interaction (FSI) simulations, and one needs to strike a balance to conduct a cost-efficient study. For instance, Blade Element Momentum (BEM) oriented techniques are mainly employed to reduce the cost of the computational cost associated with the flow simulation (Rafiee, Tahani, and Moradi, 2016). The FAST code was first developed by the National Renewable Energy Laboratory (NREL) to extend the aerodynamic calculation of horizontal off-shore wind (Prowell, Elgamal, and Jonkman, 2010). The code utilized a variety of packages to address fluid and structure models, and more inclusively BEM method for simulating the fluid flow. Several research studies were reported on the utilization of the FAST package to model FSI in wind turbines (Tran and Kim, 2018; Borouji and Nishino, 2019; Yu et al., 2020; Tran and Kim, 2016). In parallel, due to the simplifications related to the BEM theory, many attempts have been made to modify and improve the accuracy of such simulations. To illustrate, Mo et al. (Mo et al., 2015; Rajan and Ponta, 2018) modified the BEM theory by considering the flexional fluctuations and torsional deformations for each element. Rajan and Ponta (Rajan and Ponta, 2018) developed the Dynamic Rotor Dynamics (DRD) – BEM models to capture the three-dimensional effects of blade deformation more accurately by constantly altering the point of element equilibrium.
Some authors took benefits of simplified structural solvers while achieving high-order solutions for fluid flow. Sayed et al. (Sayed et al., 2019) conducted a numerical study on a DTU 10MW HAWT by combining Unsteady Reynolds Average Navier-Stokes (URANS) with a structural solver called Carat++ which calculates the deformation of the blade by Finite Element Method (FEM) under the assumption of non-linear Timoshenko beam. In this work, an increase in the wind turbine power due to the blade flexibility by 1% was reported. On the other hand, the discrepancy between the rigid and flexible simulations has been reported to be more significant for other HAWT types. For instance, Badshash et al. (Badshah, Badshah, and Kadir, 2018) showed almost a 5% difference in the power coefficient of a two-bladed HAWT by taking the effect of blade flexibility into consideration. Generally, the effect of blades’ flexibility plays an important role in larger turbines.
The precise perception of flow characteristics in the wake region of the wind turbine requires the employment of accurate numerical methods accompanied by powerful analysis tools. In spite of the fact that cost-efficient methods like BEM or simplified structure concluded high accuracy in terms of output power, they are not able to accurately predict the wake region behind the wind turbine. Hence, as the main objective of this paper, we aim to implement a fully coupled high-fidelity FSI simulation to account for the wake characteristics behind a large-scale HAWT. On the other hand, POD analysis was implemented to reveal flow structures in the wake region as it is claimed to be a great tool in this respect (Sheidani et al., 2023b). Additionally, as another objective, in order to understand to what extent the blade’s flexibility alternates wake properties, a comparison between the rigid and flexible blades was carried out. NREL 5MW horizontal wind turbine was selected for these goals based on the work of (Dose et al., 2020). At first, a validation study for the FSI solver with respect to the numerical results of (Dose et al., 2018) is performed. Afterwards, the POD analysis of the wake region based on the high-fidelity simulation of rigid and flexible turbines is presented to unfold the physics of the wake followed by a conclusion on the results.
II Numerical Method
The rigid and flexible simulations of the wind turbine have been carried out with STAR CCM+ solver. It incorporates Finite Volume Method (FVM) and Finite Element Method (FEM) solvers, respectively, for the flow and structural simulations. In addition, mesh motion, overset and mesh morphing techniques were employed simultaneously to address the nodes’ movement through the simulation. In the following section, the details of the utilized solvers will be discussed.
II.1 Solver Description
Fluid Flow.
The incompressible fluid flow assumption is often utilized for wind turbines. Especially, in the case of large-scale horizontal wind turbines, Mach number is typically low which assures incompressibility conditions. In order to perform the numerical simulation of the problem, the Unsteady Reynolds Average Navier-Stokes (URANS) was numerically solved using Star CCM+ V12.
The URANS formulation adopted for the continuity and momentum equations of the incompressible fluid is as follows:
| (1) |
| (2) | ||||
where and are the averaged velocity and Reynolds stress tensor, respectively. The latter can be written as:
| (3) |
where the mean strain rate tensor is:
| (4) |
The turbulent viscosity term, , can be addressed with common one- or two- equation eddy viscosity models to provide turbulence closure (Safari, Saffar-Avval, and Amani, 2018).
The selection of the suitable RANS model is vital for HAWT as separation occurs during the blades’ rotation. Many reports have agreed on both the accuracy and simplicity of SST model for capturing turbulent features of the flow around the wind turbines (Muiruri, Motsamai, and Ndeda, 2019; Pinto, Franzini, and Simos, 2020; Cai et al., 2022), and hence, was utilized for this research. All the spatial and temporal terms in Equation 2 were discretized by the second-order method and SIMPLE algorithm was employed to solve the set of equations, as suggested by literature (Moussa, 2020; Marzec, Buliński, and Krysiński, 2021).
Structural.
The deformation of the flexible blades is described using a Lagrangian formulation and is governed by the structural momentum conservation equation, which can be expressed as follows:
| (5) |
where , and represent the mass, damping coefficient and stiffness of the turbine blade, respectively. , and are acceleration, velocity, and displacement of the structure element, respectively.
represents the force vector acting on the solid including pressure, shear, Coriolis, centrifugal and mass forces:
| (6) |
The solution was derived through time integration by solving the motion equation in the Newmark scheme and the solution to the solid displacement was formulated in terms of the time history.
Mesh Morpher.
For the simulation of the strongly coupled FSI problem, a two-way information exchange across the interface is needed. The traction forces across the interface, i.e. the pressure and wall shear, are mapped from the fluid domain to the solid domain. This results in deformations in the solid. The solid deformation across the interface, in turn, is mapped back to the fluid domain. The solid deformation only specifies how the interface nodes are displaced, and hence, the displacements of the inner nodes of the fluid domain must then be determined. To accomplish this, Star CCM+ employs a mesh morphing technique known as Radial Basis Function (RBF) to propagate nodes displacement throughout the whole fluid domain. Accordingly, a couple of control points are placed on the moving boundary, i.e. Fluid-Structure interface, at which the displacement is known, and then, the interpolation field will be constructed to specify the displacements of the inner nodes. A full description of the RBF technique can be found in (Bao and Chen, 2021).
II.2 Two-way Coupling
Generally, there exist two methods for numerical simulations of the fluid-structure interaction in terms of dealing with the system of equations. In the so-called monolithic approach, the coupled problem is considered as one system of equations, and hence, the flow and structural fields are solved simultaneously. Whereas, in the partitioned approach, separate solvers are employed for each of the solid and fluid domains. In the latter, there will be a need for the transfer of forces and displacements between the solvers through time. In fact, there is still no comprehensive discretization method to address both fluid and structural problems accurately. Hence, utilization of the monolithic approach is not common for real-world applications. However, as for the partitioned method, a suitable general-purpose solver can be utilized for each domain in which case we need to implement inter-communication protocols between solvers.
In a general two-way FSI problem, after the solid equations are solved, the boundary displacements are imported into the fluid solver and the mesh morpher determines the new locations for the nodes of the fluid domain. Following the flow solution, aerodynamic forces acting on the body are exported to the structural solver. The data of displacement and force can be passed between solvers with implicit and explicit methods. As for the explicit, data exchange only happens at the end of the time step. While it occurs in the inner loop for the implicit method until convergence takes place. An implicit partitioned approach was utilized for the sake of accuracy and convergence.
The main drawback with the conventional partitioned FSI method is that the convergence decreases dramatically as the density ratio of solid to fluid decreases (so-called added mass effects (Idelsohn et al., 2009; Kassiotis, Ibrahimbegovic, and Matthies, 2010; Stabile, Matthies, and Borri, 2018), and divergence is observed regardless of the time step value in case of the incompressible flow (Fernández, Gerbeau, and Grandmont, 2007; van Brummelen, 2009). To overcome this difficulty, especially in the case of strongly coupled FSI problems, a stabilization method should be employed. Star CCM+ utilizes Boundary Interface Added Mass technique in which the fluid domain traction resulting from the interface deformation and consequently the displaced fluid per unit area are predicted and taken as a force correction in the solver. More details of this technique can be found in (Nordenström, 2022).
In addition, the starting time is typically regarded as the major bottleneck in the convergence of the simulation of FSI problems with large deflections. To guarantee convergence, almost rigid conditions, i.e. high Young’s modules, were applied to the wind turbine at the start of the simulation. Then, the elastic properties decreased to that of the actual values. This corresponds to the oscillatory nature of the results of the generated power depicted in Fig. 7, which will be discussed later on.
Finally, to enhance the numerical stability of such an FSI problem with large deformations, Aitken’s dynamical relaxation method is employed (Küttler and Wall, 2008), in which the values of two previous iterations are used to improve the result of the current iteration to obtain a better convergence. The full procedure of the FSI simulation is shown in Fig. 1.

II.3 Problem Description
Fluid Flow.
The wind turbine model used in the present work is the onshore NREL 5 MW based on the work of (Dose et al., 2020), as shown in Fig. 2. The detailed specifications of the turbine model are presented in Table 1. Other geometrical details of the turbine can also be found in (Coulling et al., 2013; Zhang and Kim, 2018).
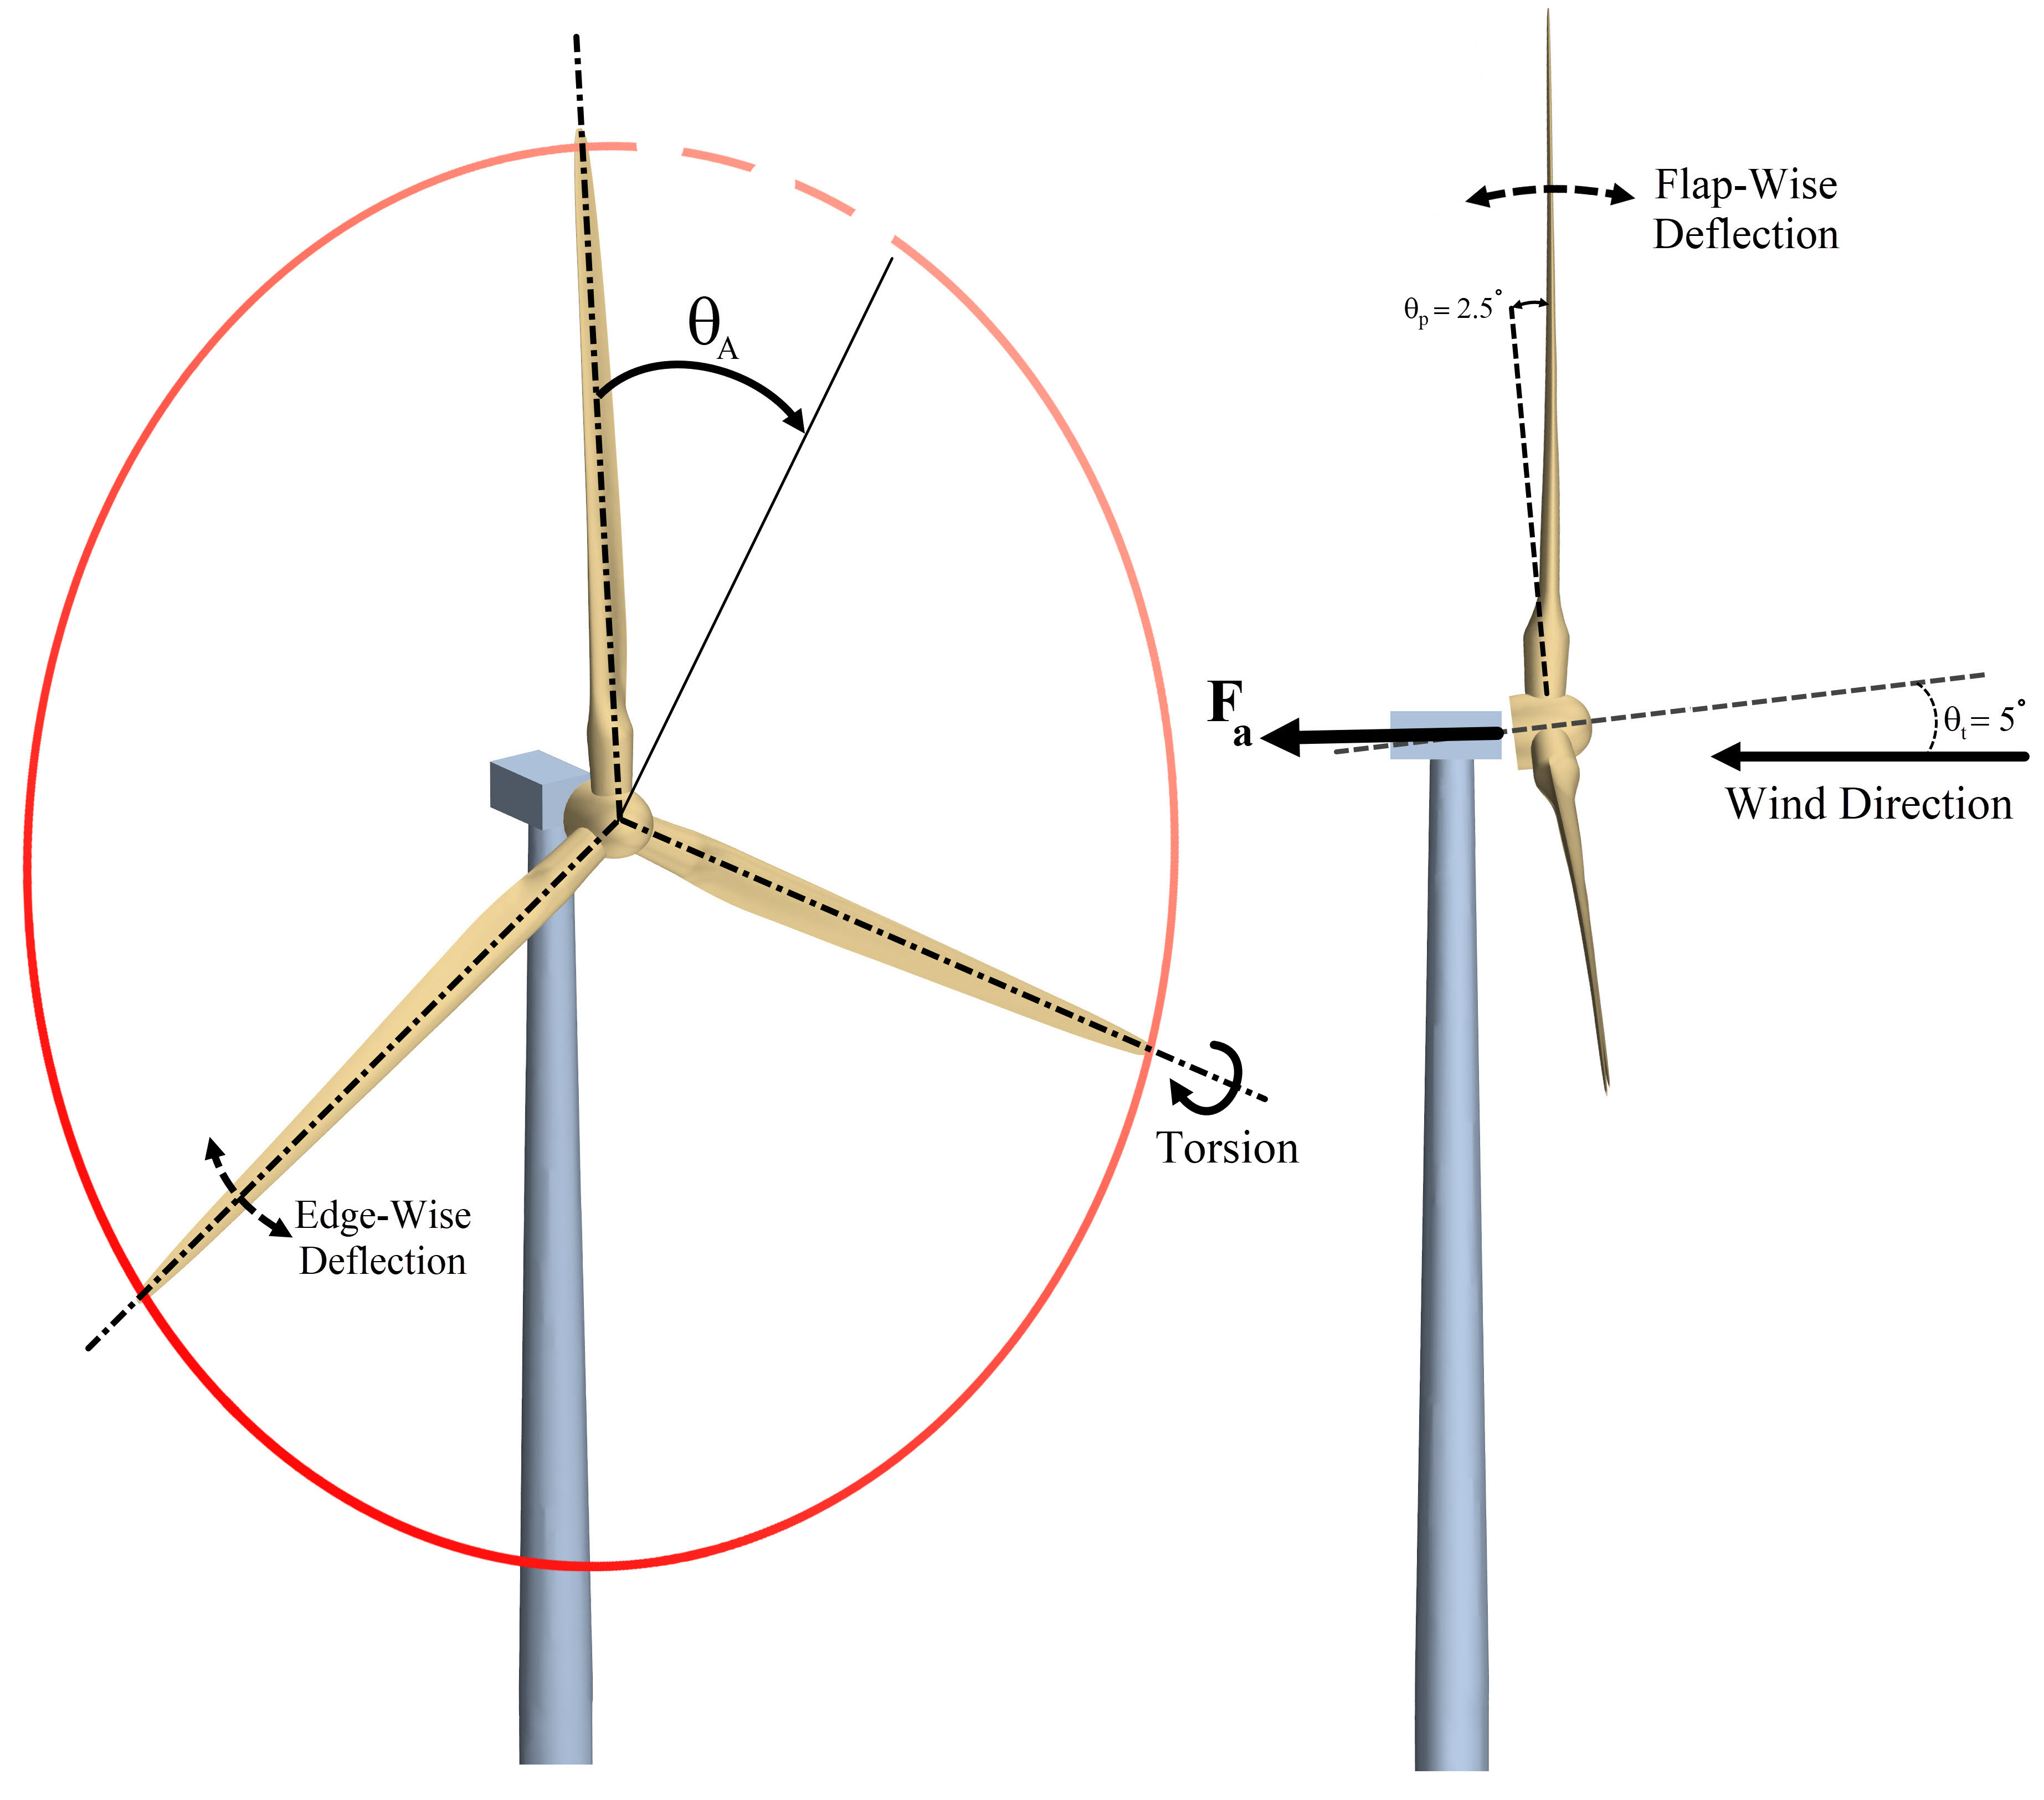
| Rotor Orientation, configuration | Upwind, 3-Blades |
|---|---|
| Blade Sections | DU and NACA airfoils |
| Blade Length | 61.5m |
| Rotor Diameter | 126m |
| Tilt Angle | 5∘ |
| Precone Angle | 2.5∘ |
| Hub Diameter | 3m |
| Tower Height | 90m |
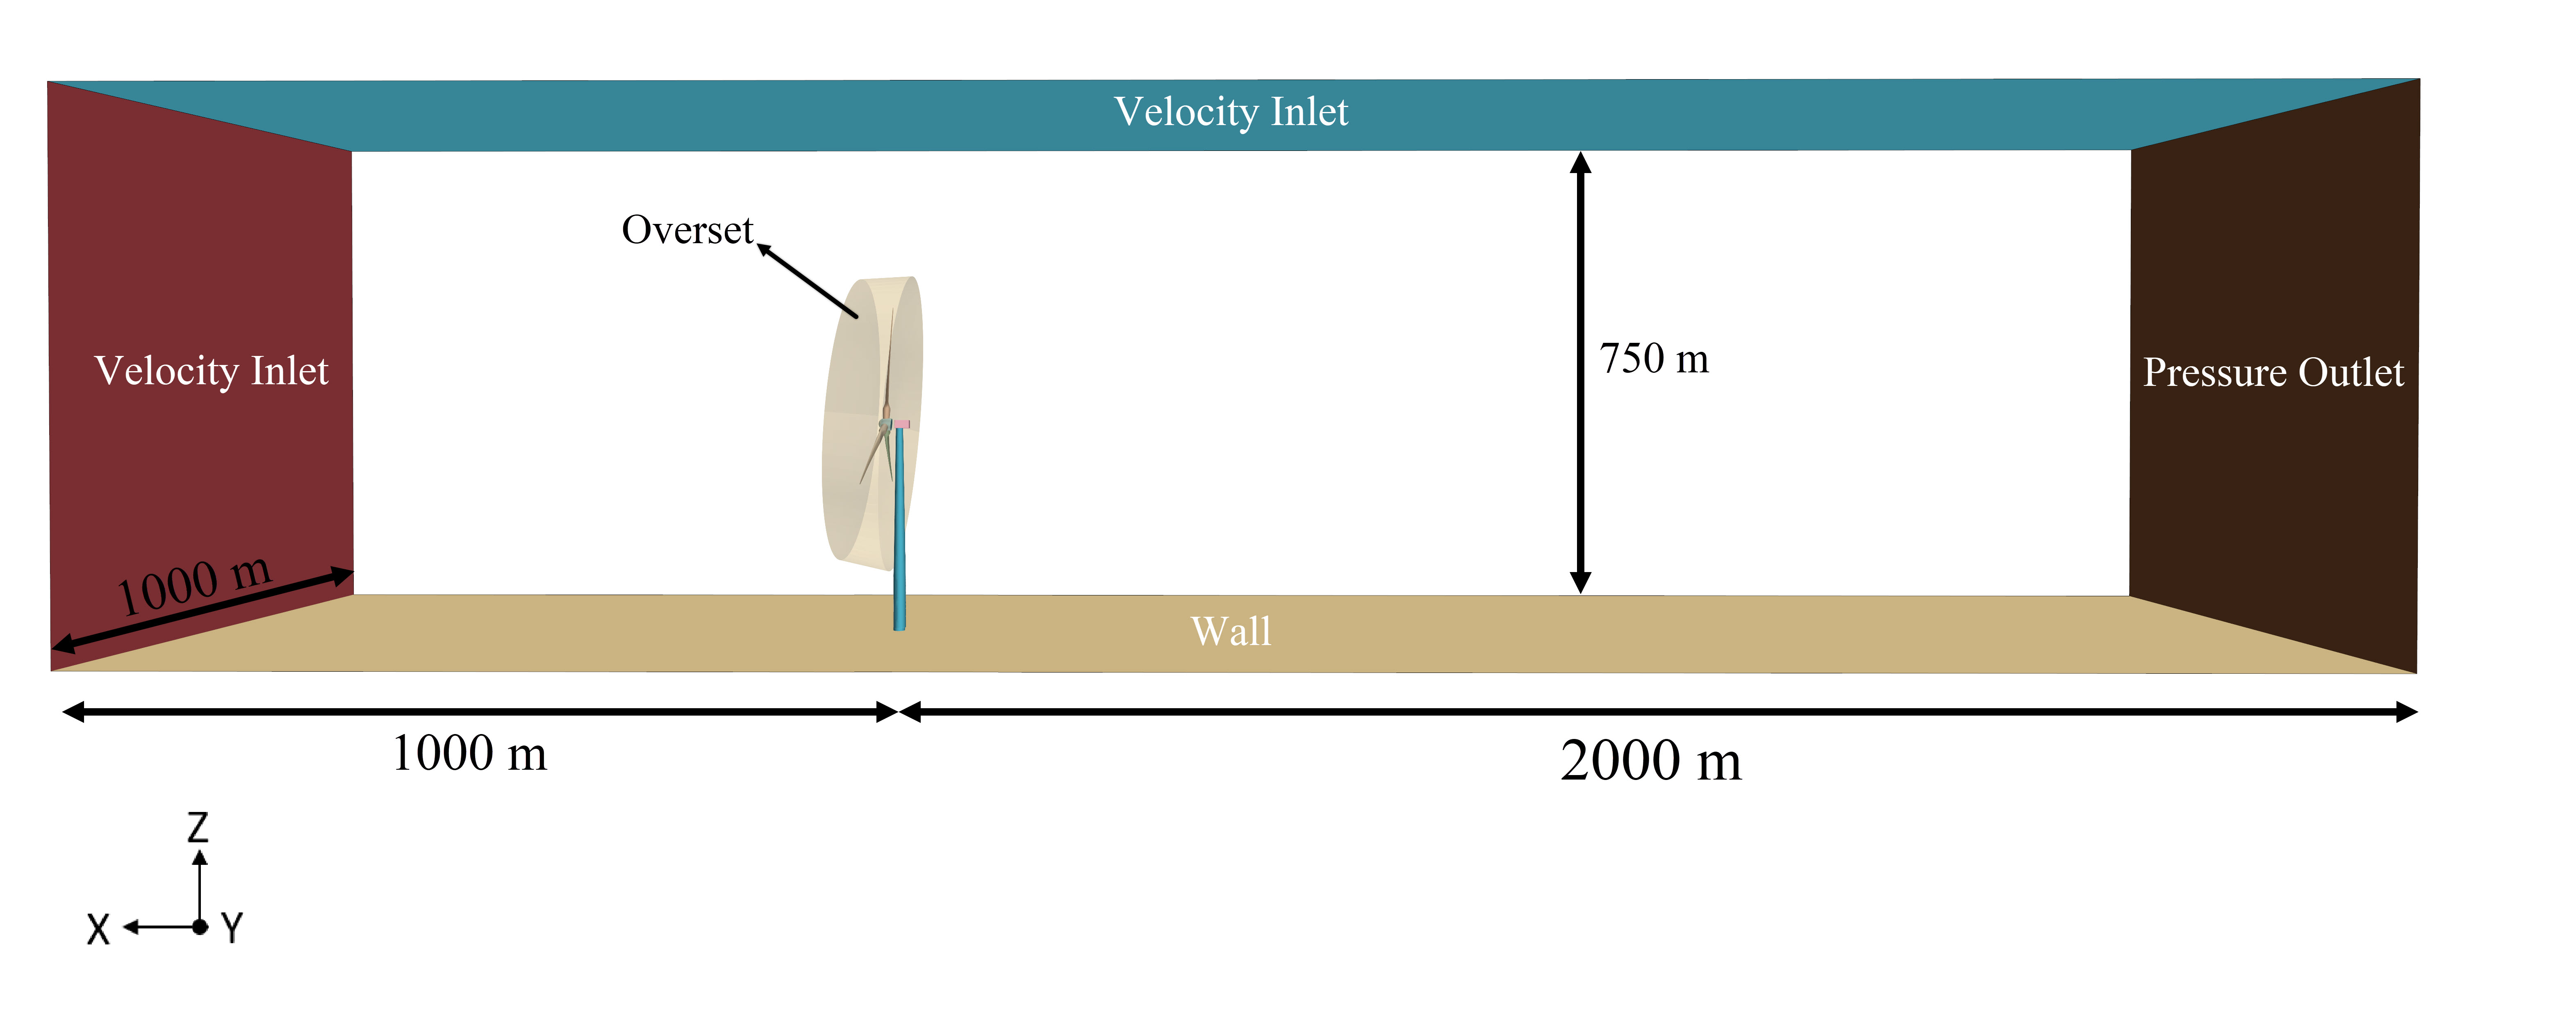
Fig. 3 illustrates the computational domain of the fluid. The upstream and sides boundaries are defined as the velocity inlet boundary condition and the pressure outlet is considered for the downstream boundary. The no-slip wall condition is imposed on the turbine walls and the bottom boundary. All the boundaries were put far enough from the turbine to ensure flow uniformity. Thereby, a hexahedral domain with the size of (length, width, height) was generated.
The rated conditions presented by (Jonkman et al., 2009) were considered for the wind turbine. In this regard, a uniformly distributed wind velocity and rotor angular velocity of and 12.1 were employed, respectively. A turbulence intensity of 0.14 was considered at the inlet boundary. The air density and viscosity were set to and , respectively.
Solid Structure.
Finite element simulation of the structural model was carried out with Star CCM+ as well. The advantage of using the same software for both physics is the accessibility to the solver settings and the ability to implement advanced post-processing techniques for the fluid and solid simultaneously.
The current research study only focuses on the effect of blade deformation on the wake properties behind the wind turbine. Hence, there would be no need to model the deformation of the tower and nacelle. Structural properties were considered similar to that of (Asareh and Volz, 2013).
Fluid-Structure Interface.
The boundary condition at the interface of the solid and the fluid, , can be defined as follows. Assuming the no-slip condition at the wall, the displacement of the solid, is equal to the displacement of the fluid, , at the interface:
| (7) |
This is true for the rate of change of displacement as well. Simply, substituting the fluid displacement at the boundary with the velocity yields:
| (8) |
and is the interface normal vector. Moreover, based on Newton’s third law, a balance of forces exists on the interface between the fluid and solid:
| (9) |
where and are the solid and fluid stresses at the interface, respectively. In essence, Eq. 8 and 9 describe the kinematics and dynamics of the fluid-structure interface, respectively.
II.4 Mesh Generation
Precise considerations need to be taken for the mesh generation of the large-scale blade-resolved simulation of wind turbines. While it is required to implement either the sliding mesh or overset technique for rigid wind turbines, flexible FSI simulations impose an additional complexity caused by the blade deformation. To address this difficulty, a combination of the overset technique with mesh morphing was implemented.
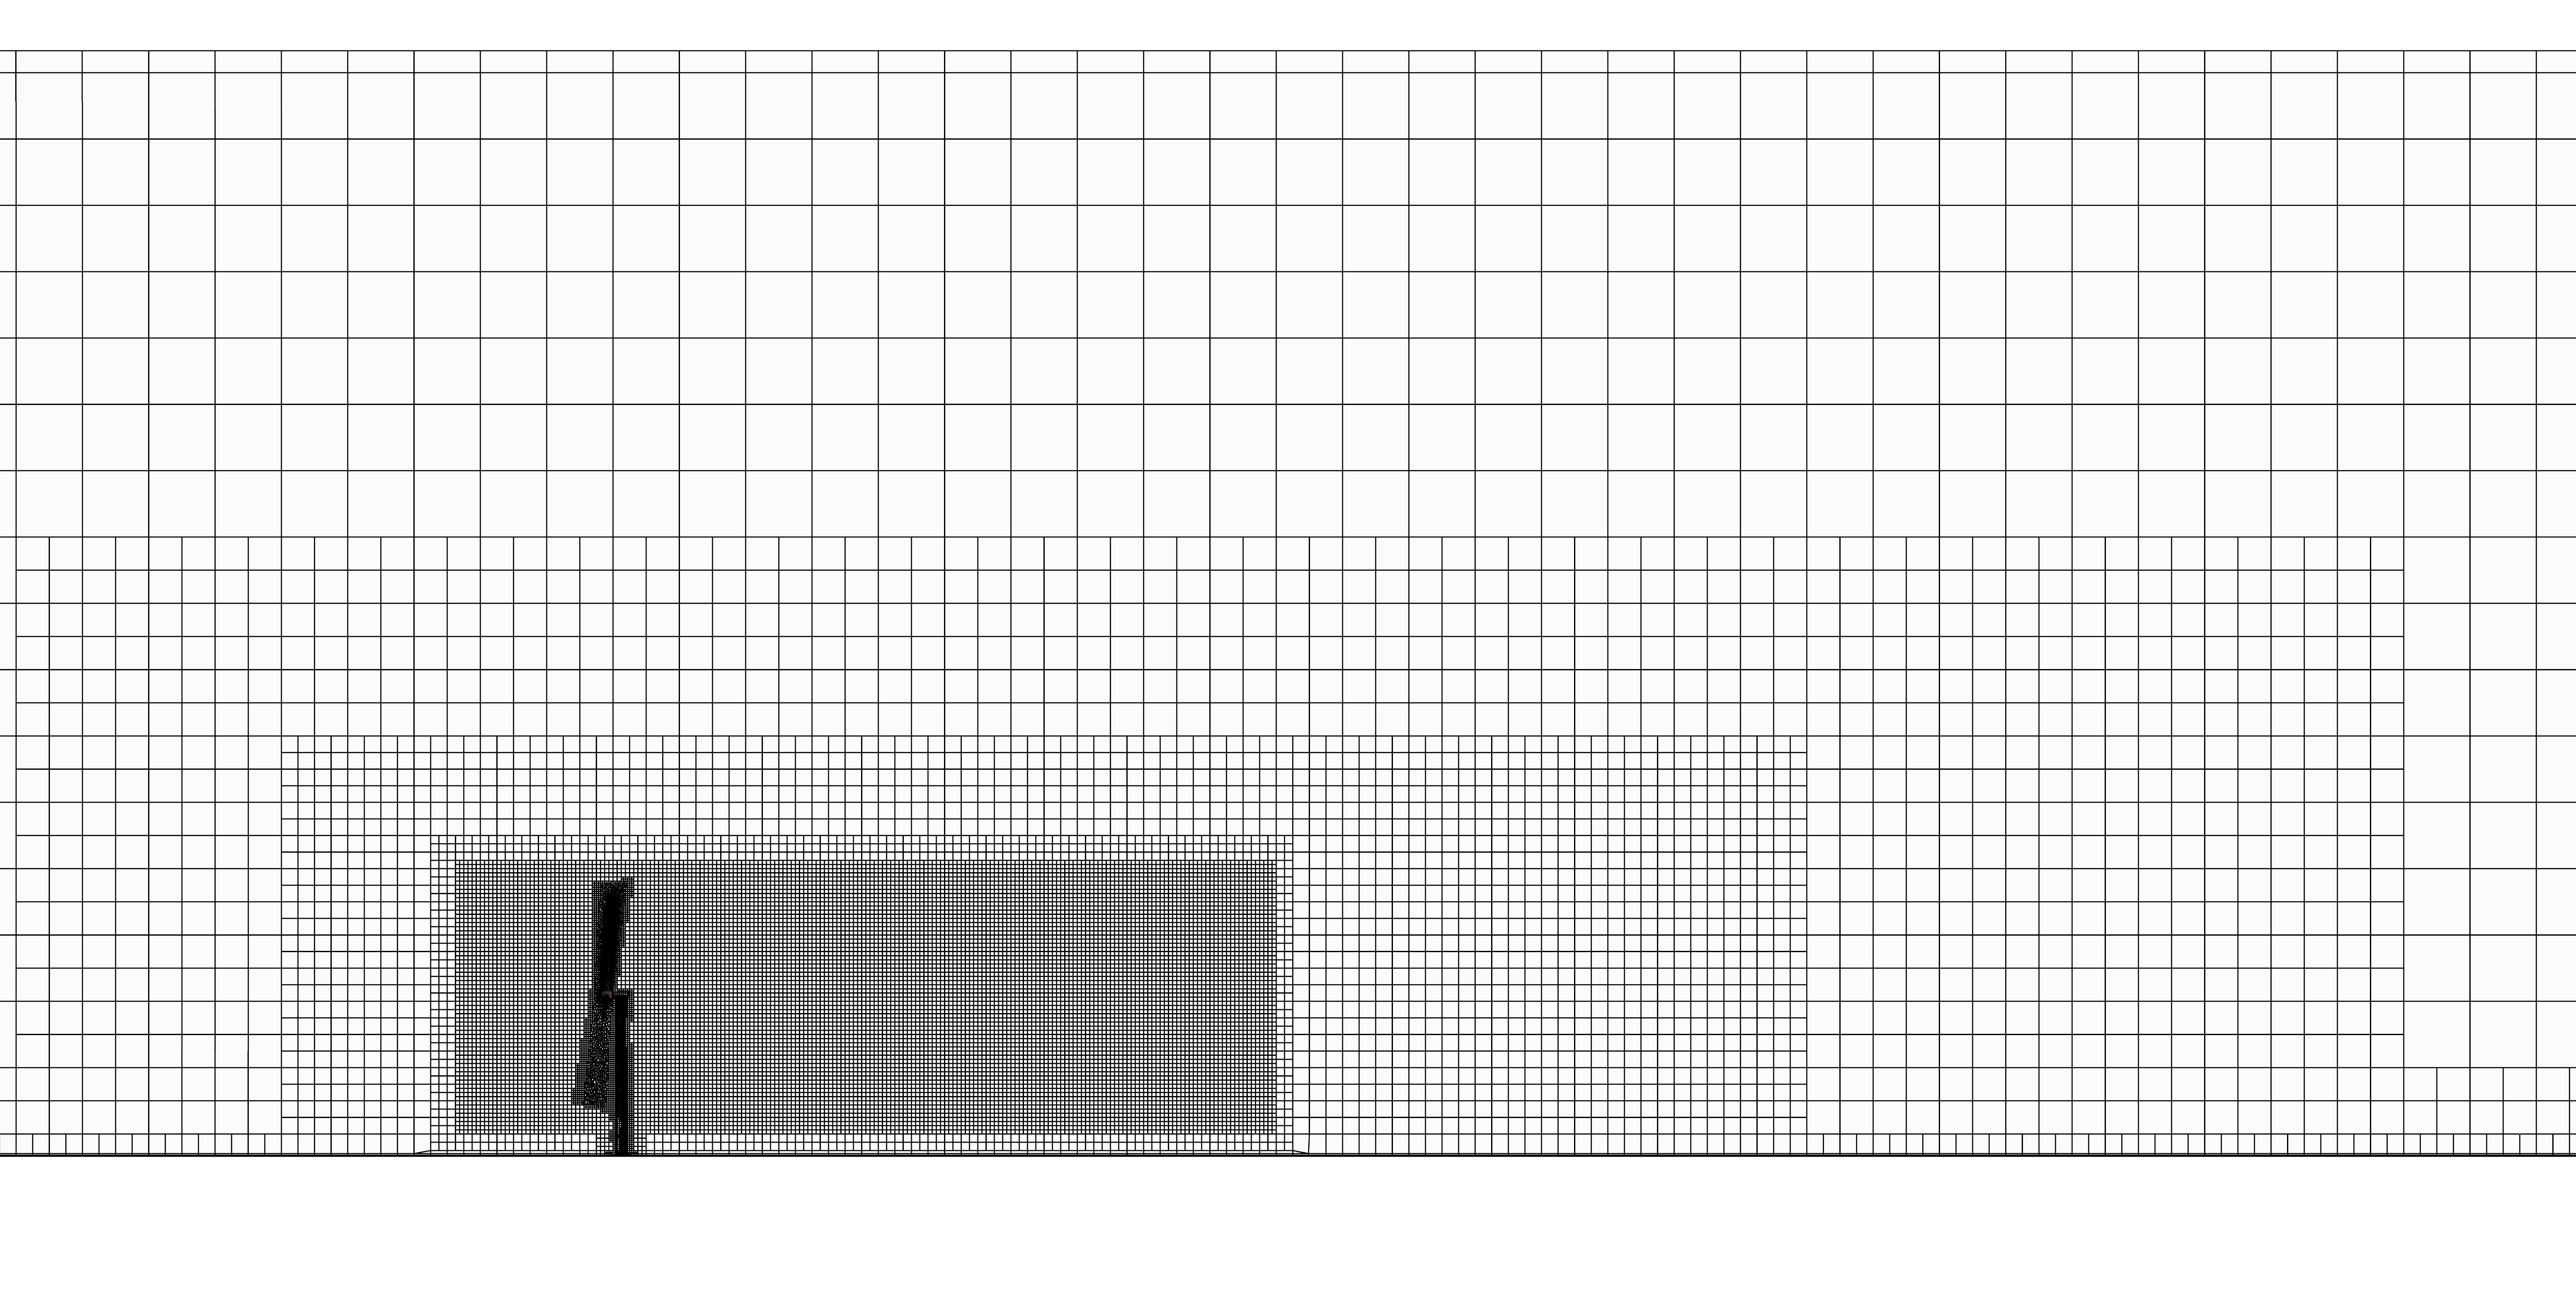
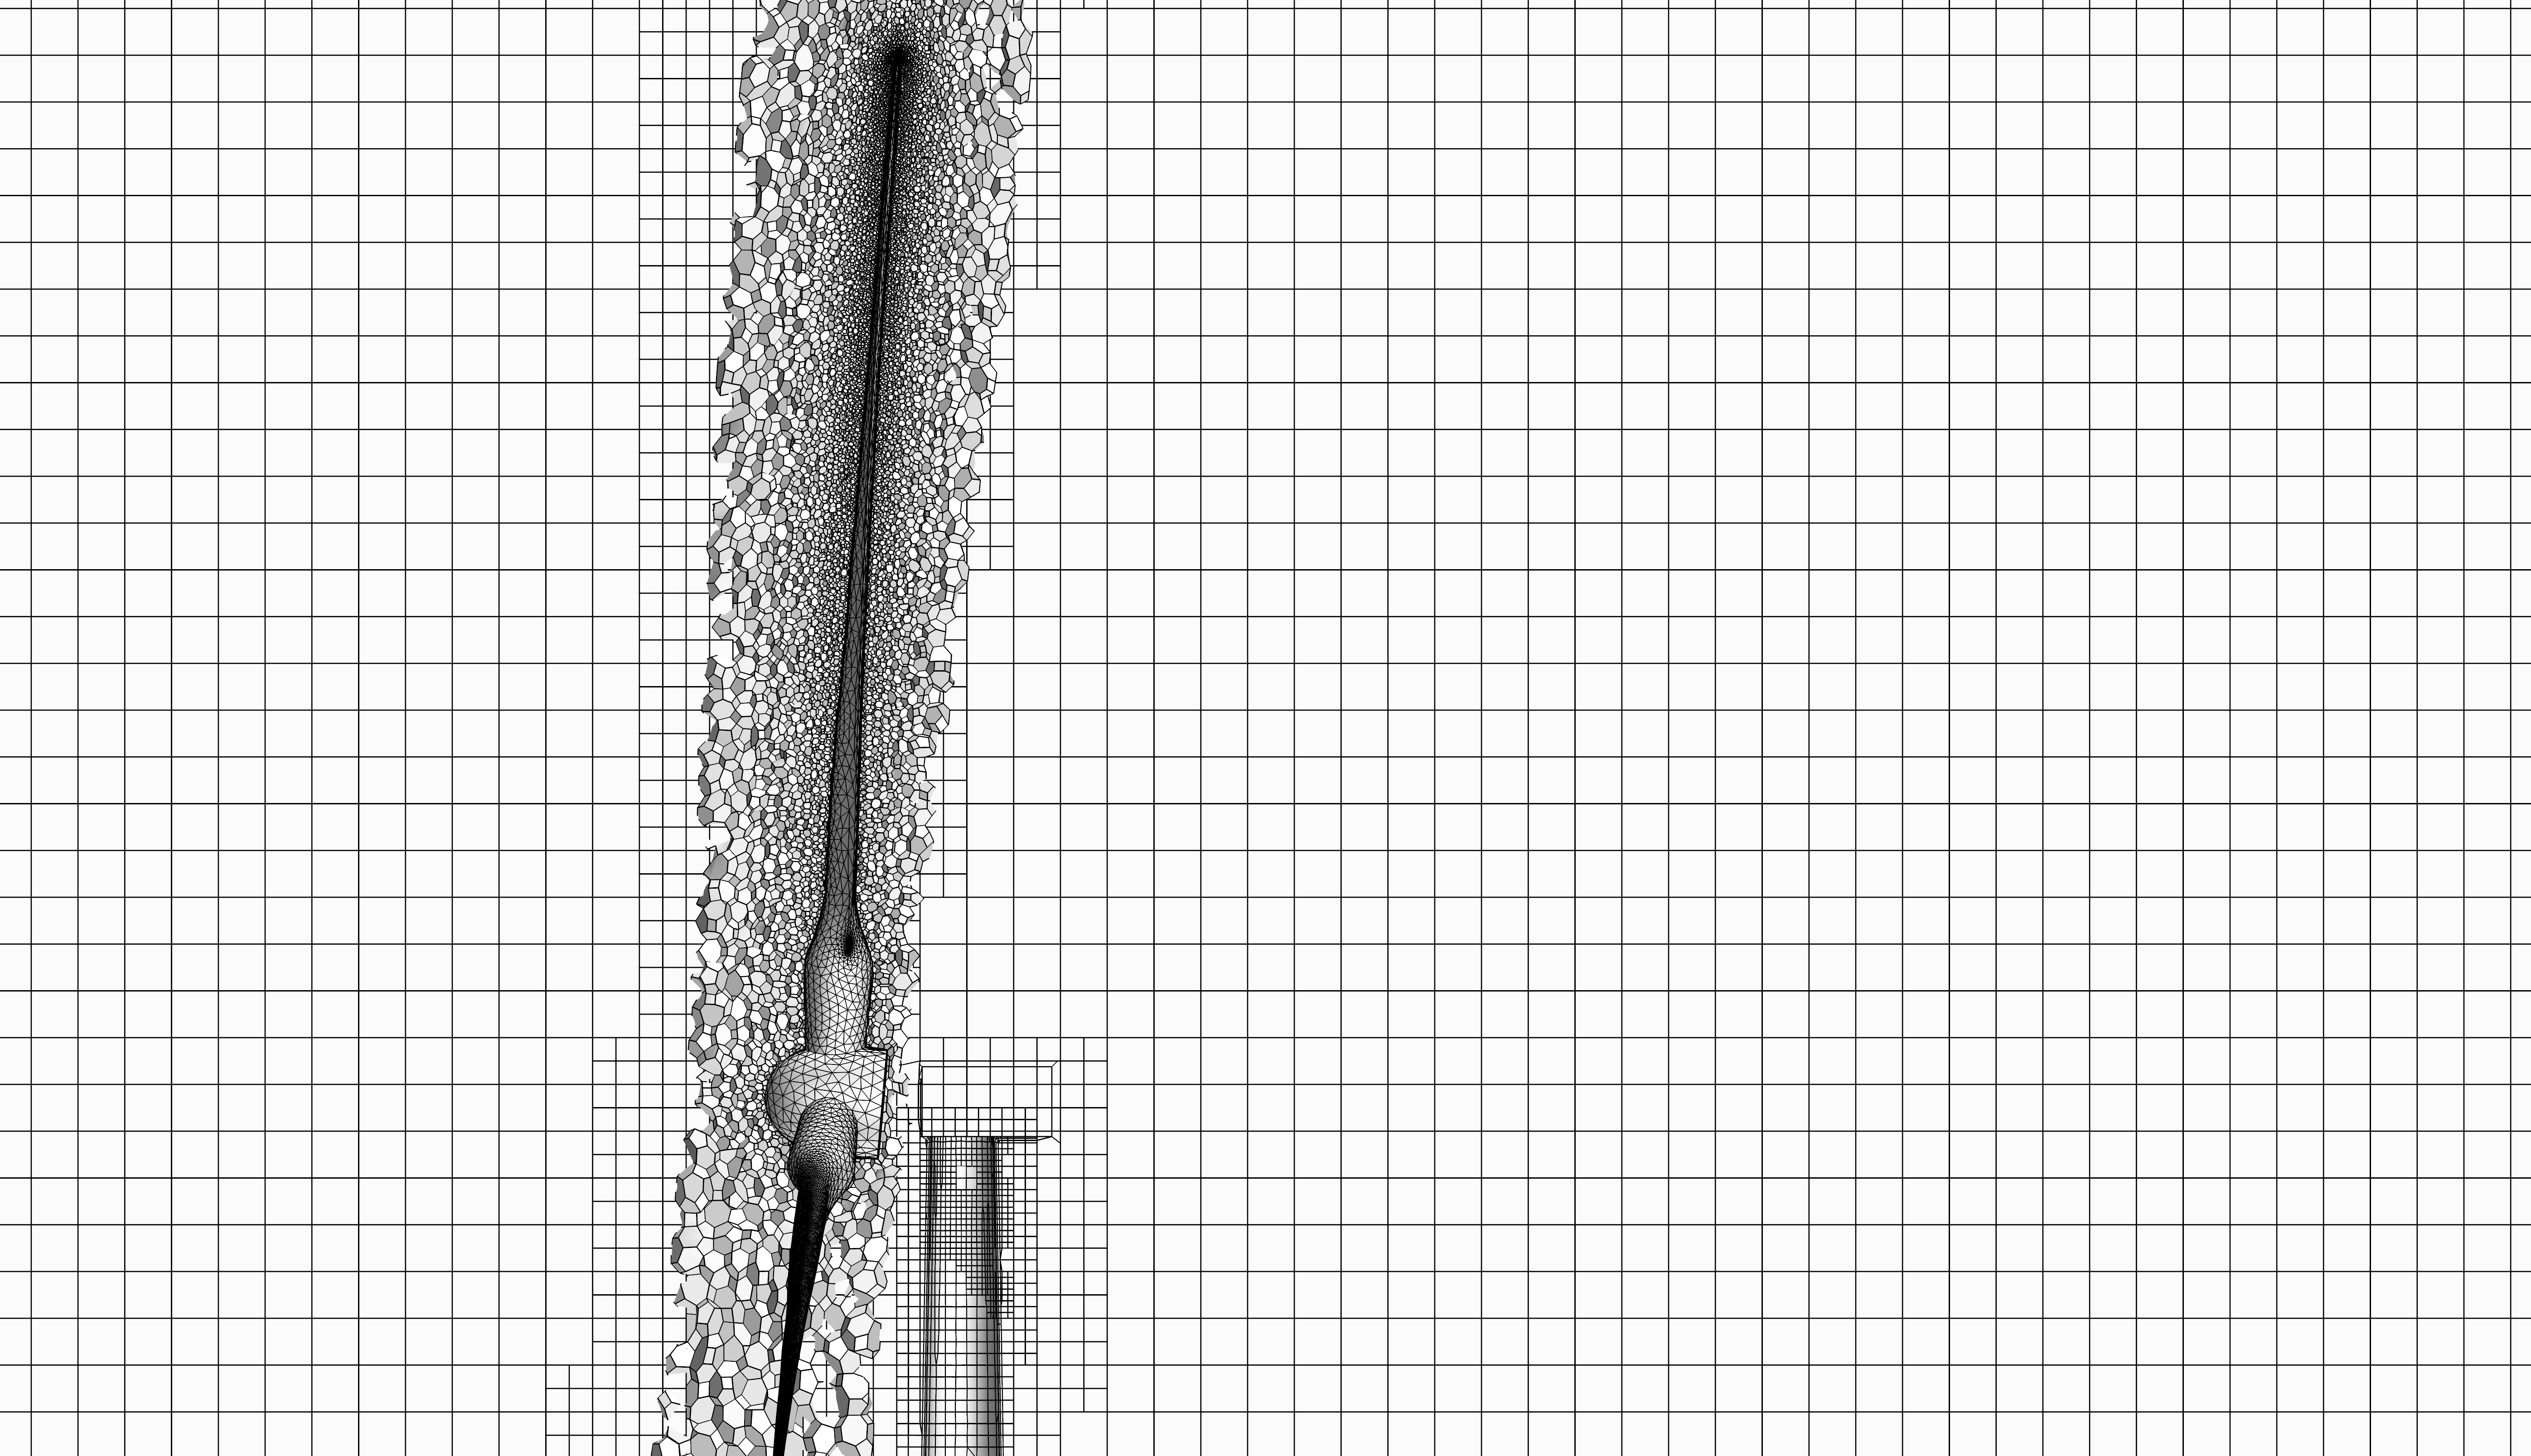
As for the CFD, hexahedral elements are suited for simplified geometries which can guarantee a better orthogonal quality, and therefore, result in better accuracy, whereas the polyhedral elements are suited for models with geometrical complexities such as the blade tip and leading edge (Wang, Cao, and Okaze, 2021). For implementing the overset solver, two fluid regions namely background and overset, as shown in Fig. 4, were created. Hexahedral elements were utilized for the rectangular background and for the overset region, which encompasses the blades, polyhedral elements with a refined boundary layer mesh were considered. Fig. 4 shows the corresponding meshes for the fluid regions.
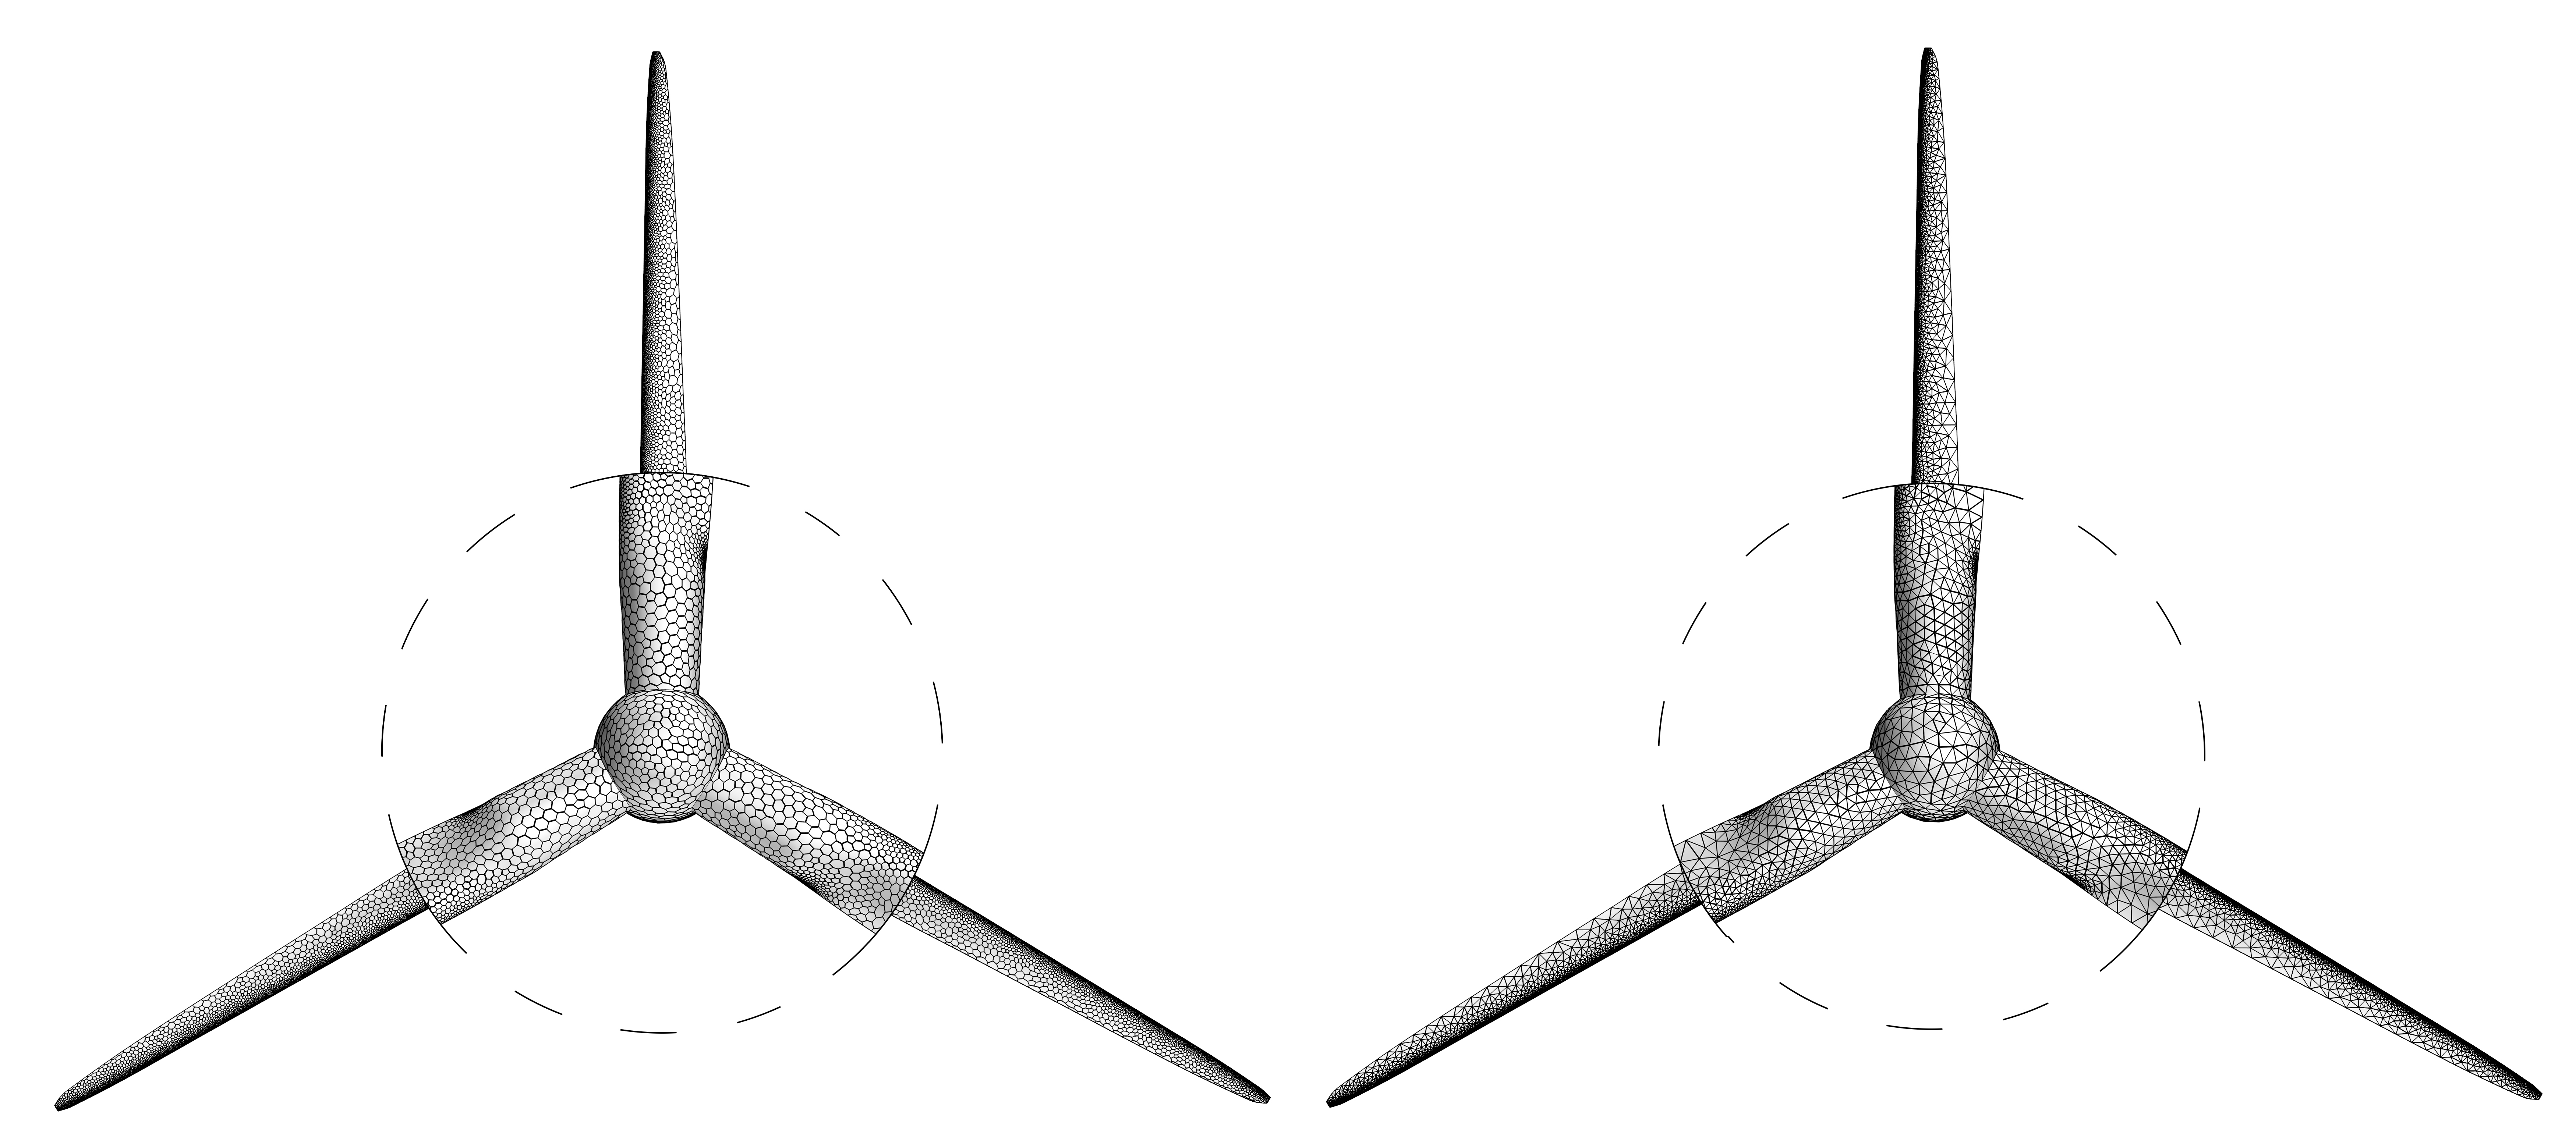
Star CCM+ FEM solver supports hexahedral and tetrahedral elements. The latter was utilized for the structural model of the wind turbine, due to the mentioned reasons. A comparison between the fluid and structural meshes of the blade is depicted in Fig. 5.
II.5 Proper Orthogonal Decomposition Method
Proper Orthogonal Decomposition is employed to extract the coherent structures both in the spatial and temporal domain (Li et al., 2013). It should be noted that the POD method implemented in this study is based on the work of Taira et al. (Taira et al., 2017). In order for POD to be implemented, the Singular Value Decomposition (SVD) method was employed owing to its robustness against round-off errors (Lengani et al., 2014). In order to perform SVD, the ’matrix of snapshots’ denoted as ’’ needs to be formed. The rows of include the value of the variable of interest corresponding to its position in the computational domain and the columns correspond to the time instance at which the data has been extracted. Having formed the matrix, SVD is applied as follows:
| (10) |
Where and are called the left and right eigenvectors, respectively. Also, is a diagonal matrix containing the eigenvalues organized in descending order. Therefore, each element of the matrix demonstrates the importance of each column of . It should be noted that the left eigenvector corresponds to the spatial coherent structures which are in other words, the modes of the flow. On the other hand, the right eigenvector indicates the evolution of each mode in the time domain.
II.6 Verification and Validation
The mesh sensitivity analysis needs to be carried out for the output parameters to asses meshing-related numerical error. To do so, coarse, medium and fine meshes with the total number of , and elements were created and examined. The corresponding number of elements for each region is presented in Table 2.
As for the dimensionless wall distance index, , the average value was kept below 40 for all cases, as instructed by (Siddiqui et al., 2017), with at least 10 prism layers (Lillahulhaq and Djanali, 2019) to capture the near-wall phenomena and optimize the element number, simultaneously.
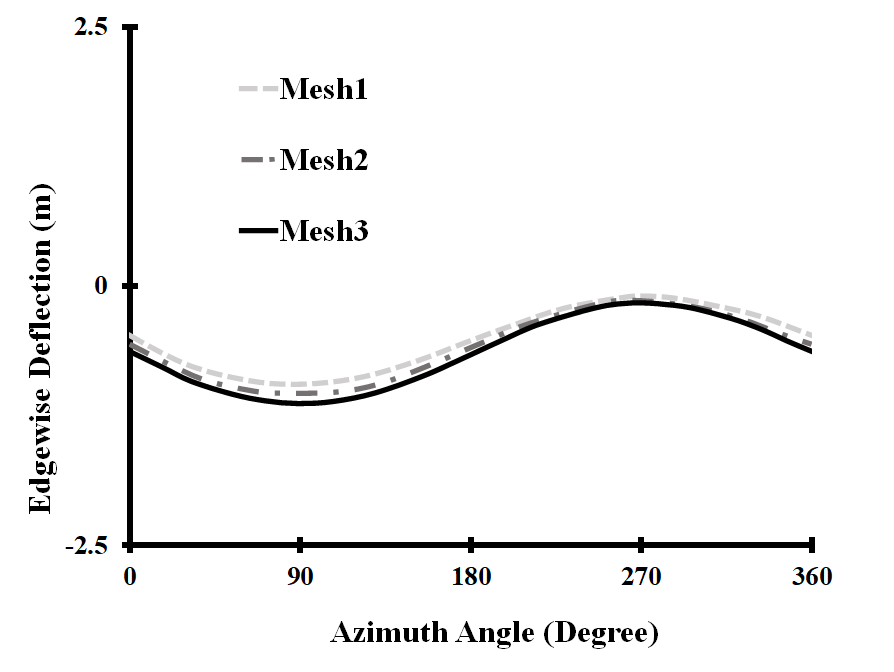
A comparison between edgewise deflection for three meshes is shown in Fig. 6. There exist a negligible difference between the results of the second and third mesh, and hence, the rest of the post-processing including POD extraction was carried out for the second mesh.
| Mesh #1 | Mesh #2 | Mesh #3 | |
|---|---|---|---|
| Solid | 305915 | 593197 | 794005 |
| Fluid Overset | 788520 | 1436501 | 2391163 |
| Fluid Background | 1362236 | 2561289 | 2752772 |
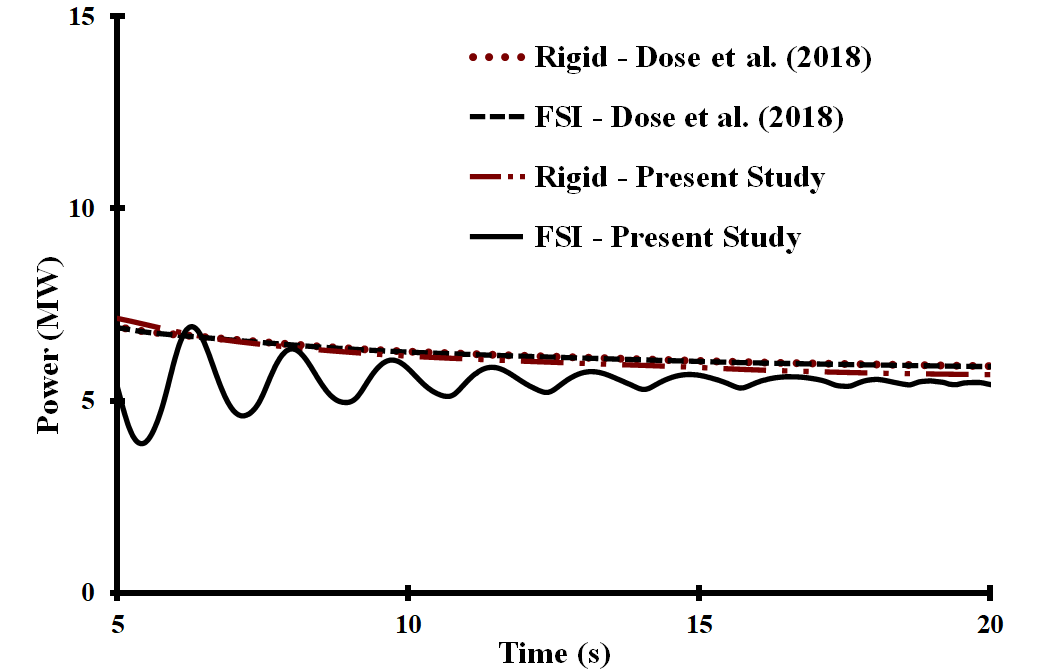
To validate the flow solver the generated power of the wind turbine for the rigid and FSI cases was compared with the results of (Dose et al., 2018), which is shown in Fig. 7. As mentioned earlier, the oscillatory nature of FSI results corresponds to the change of elastic properties of the blade at the initial times (see section II.2. After approximately three revolutions (i.e. ), the numerical results almost reached that of (Dose et al., 2018).
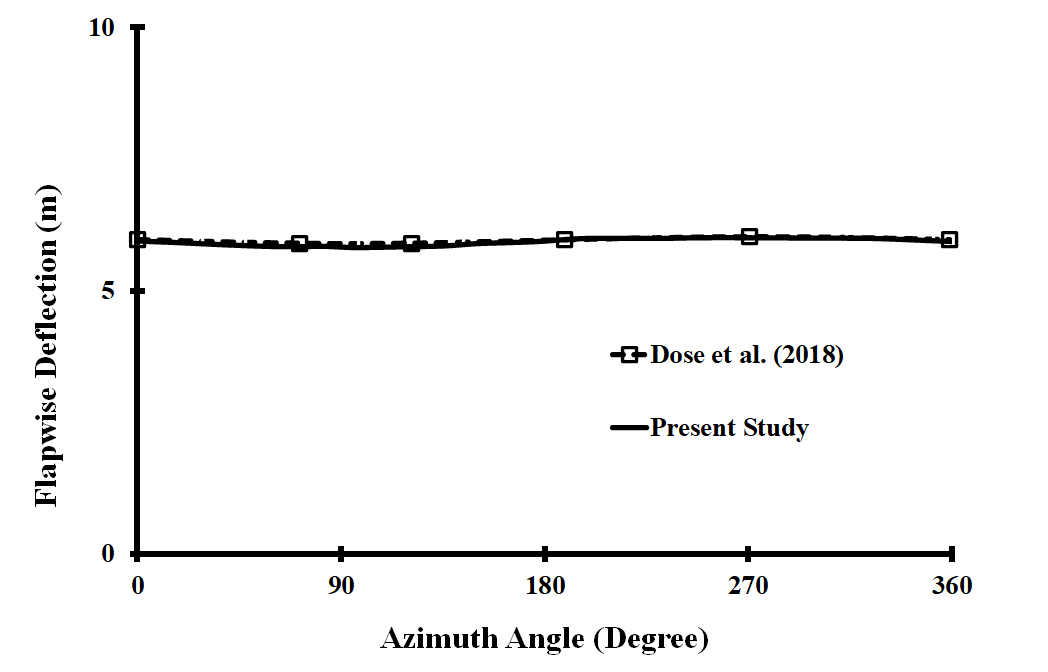
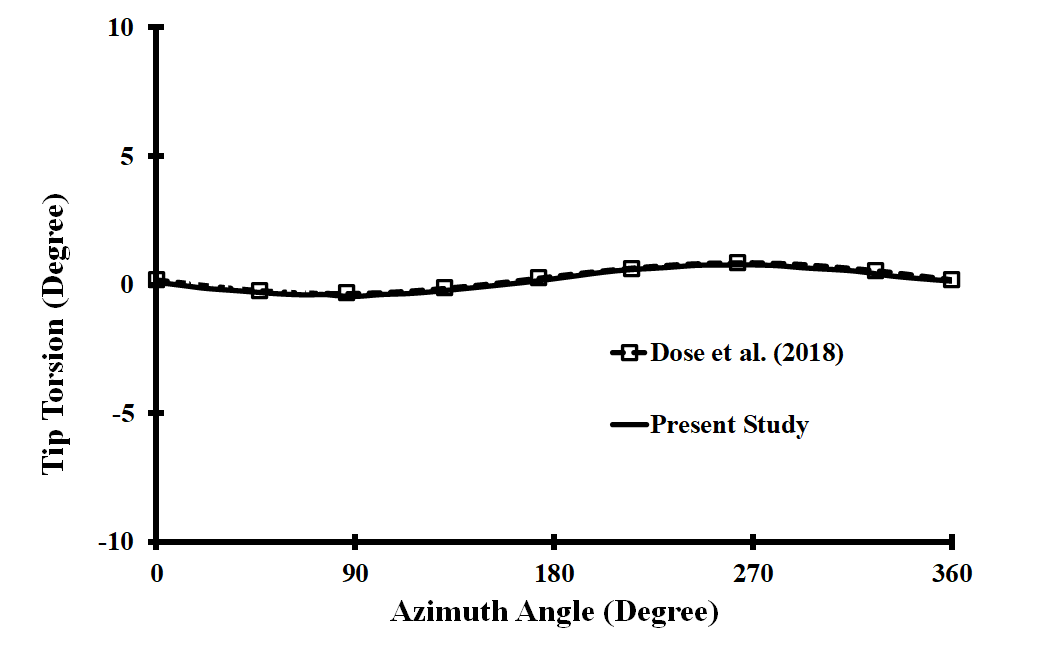
The flap-wise deflection and tip torsion were selected to assess the FEM solver. The average tip deflection as indicated by (Dose et al., 2018) is which is comparable to our results, as depicted in Fig. 8. Moreover, the tip portion through one revolution of the turbine is shown in Fig. 9. These conclude that the FSI solver could accurately capture the blade deformation through time.
| Flap-Wise | Edge-Wise | Rotor | Thrust | |
| Deflection (m) | Deflection (m) | Power (MW) | Force (kN) | |
| Sabale and Gopal (Sabale and Gopal, 2019) | 4.41 | -0.57 | 4.97 | 490 |
| Jonkman et al. (Jonkman et al., 2009) | 5.47 | -0.61 | 5.28 | 814 |
| Yu and Kwon (Yu and Kwon, 2014) | 4.72 | -0.63 | 5.22 | 656 |
| Ponta et al. (Ponta et al., 2016) | 3.85 | -0.56 | 5.19 | 660 |
| Li et al (Li et al., 2020) | 4.49 | -0.57 | 5.3 | 678 |
| Present Study | 4.02 | -0.58 | 5.01 | 636 |
III Results and discussion
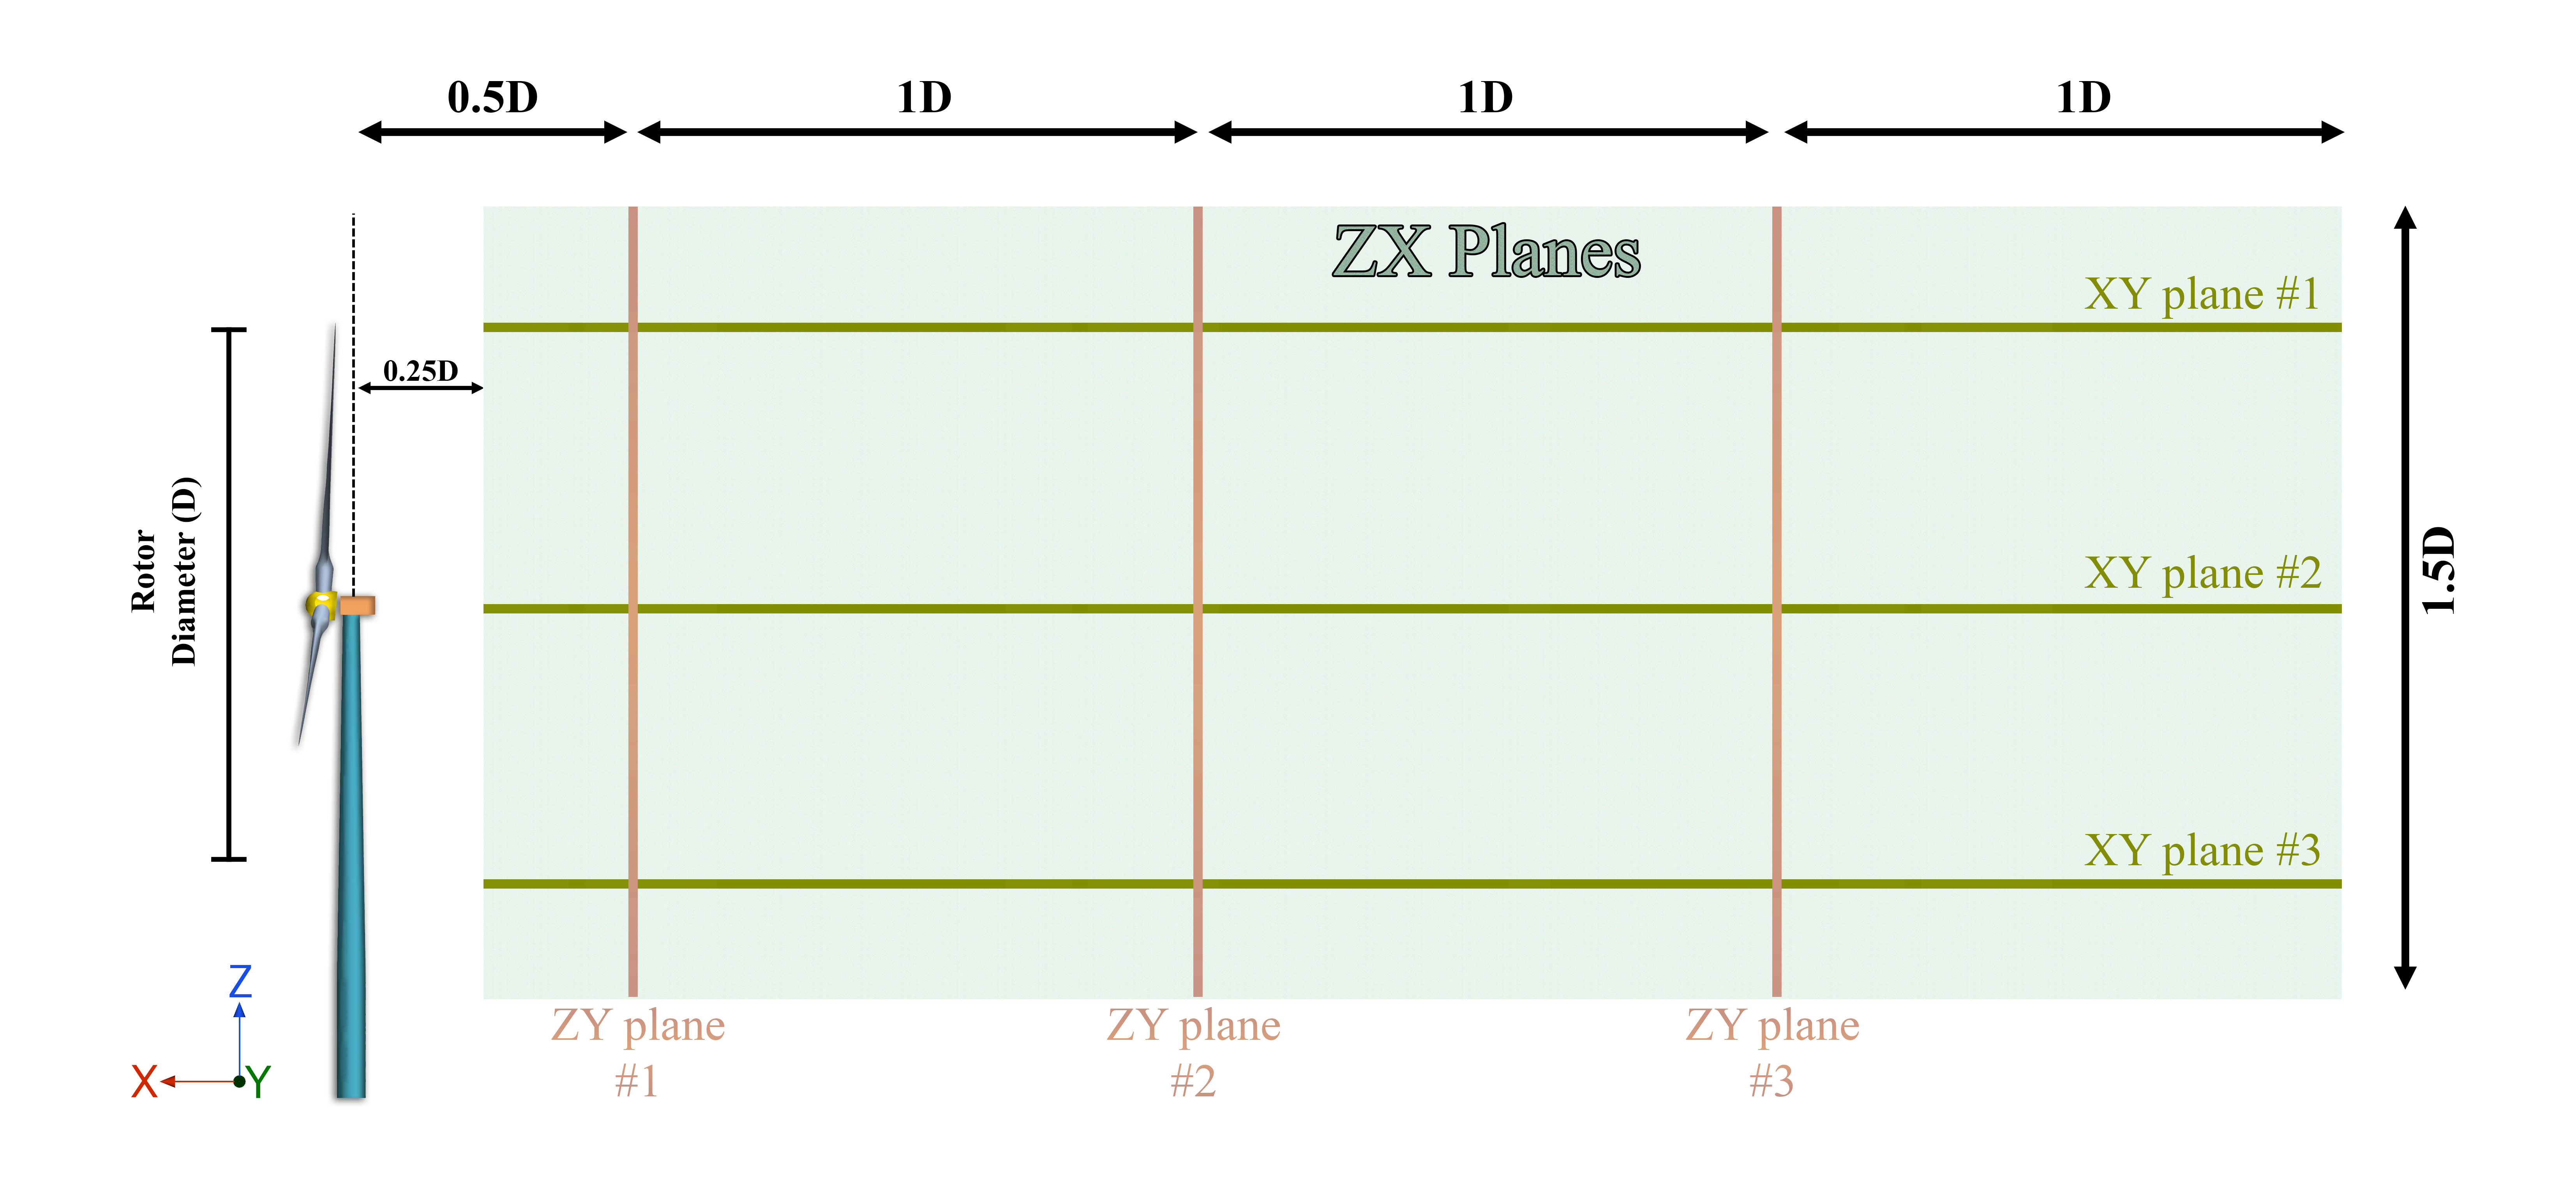
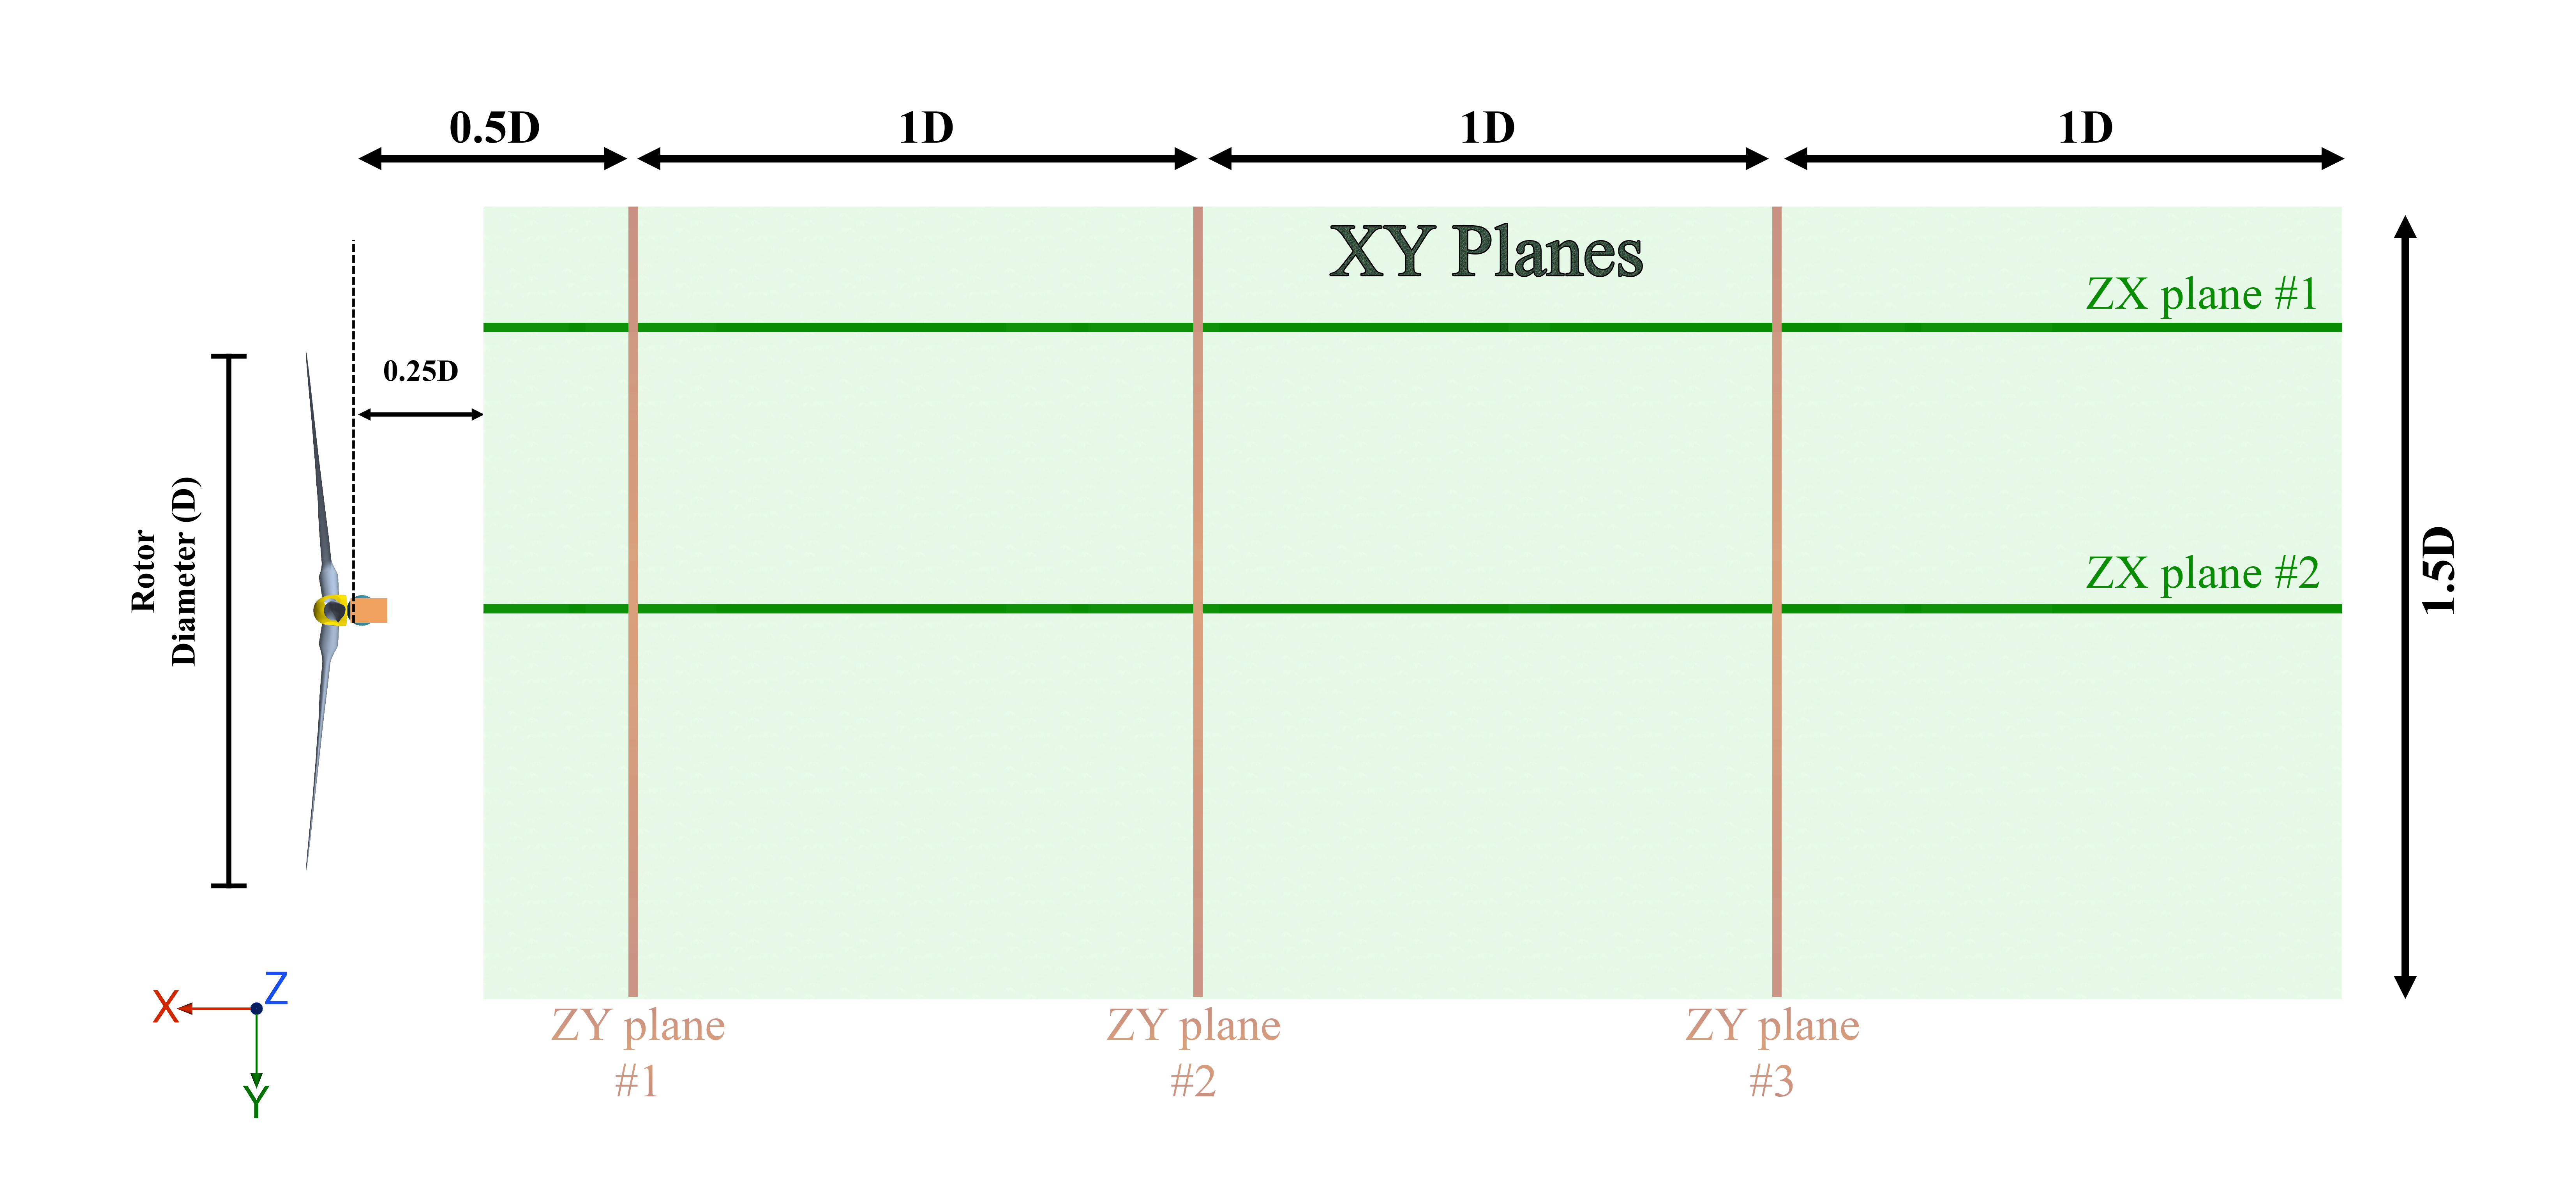
To analyse the wake region behind the turbine a couple of planes were created in the streamwise and spanwise directions. As illustrated in Fig. 10, multiple planes were strategically positioned for detailed wake analysis. Along the streamwise (XY) direction, three planes were constructed: one immediately behind the nacelle, another at the turbine tip’s highest z-coordinate (+D/2), and a third at the tip’s lowest z-coordinate (-D/2) to account for tower effects. Additionally, two planes were created along the crosswind (ZX) direction: one aligned with the nacelle and another at the farthest point in the Y direction (+D/2) at the tip intersection. This arrangement facilitated a comprehensive examination of the wake flow field in the streamwise direction. For evaluating wake characteristics in the spanwise (YZ) direction, three sets of planes were established, ranging from to . The size info of the mentioned planes is presented in Fig. 10.
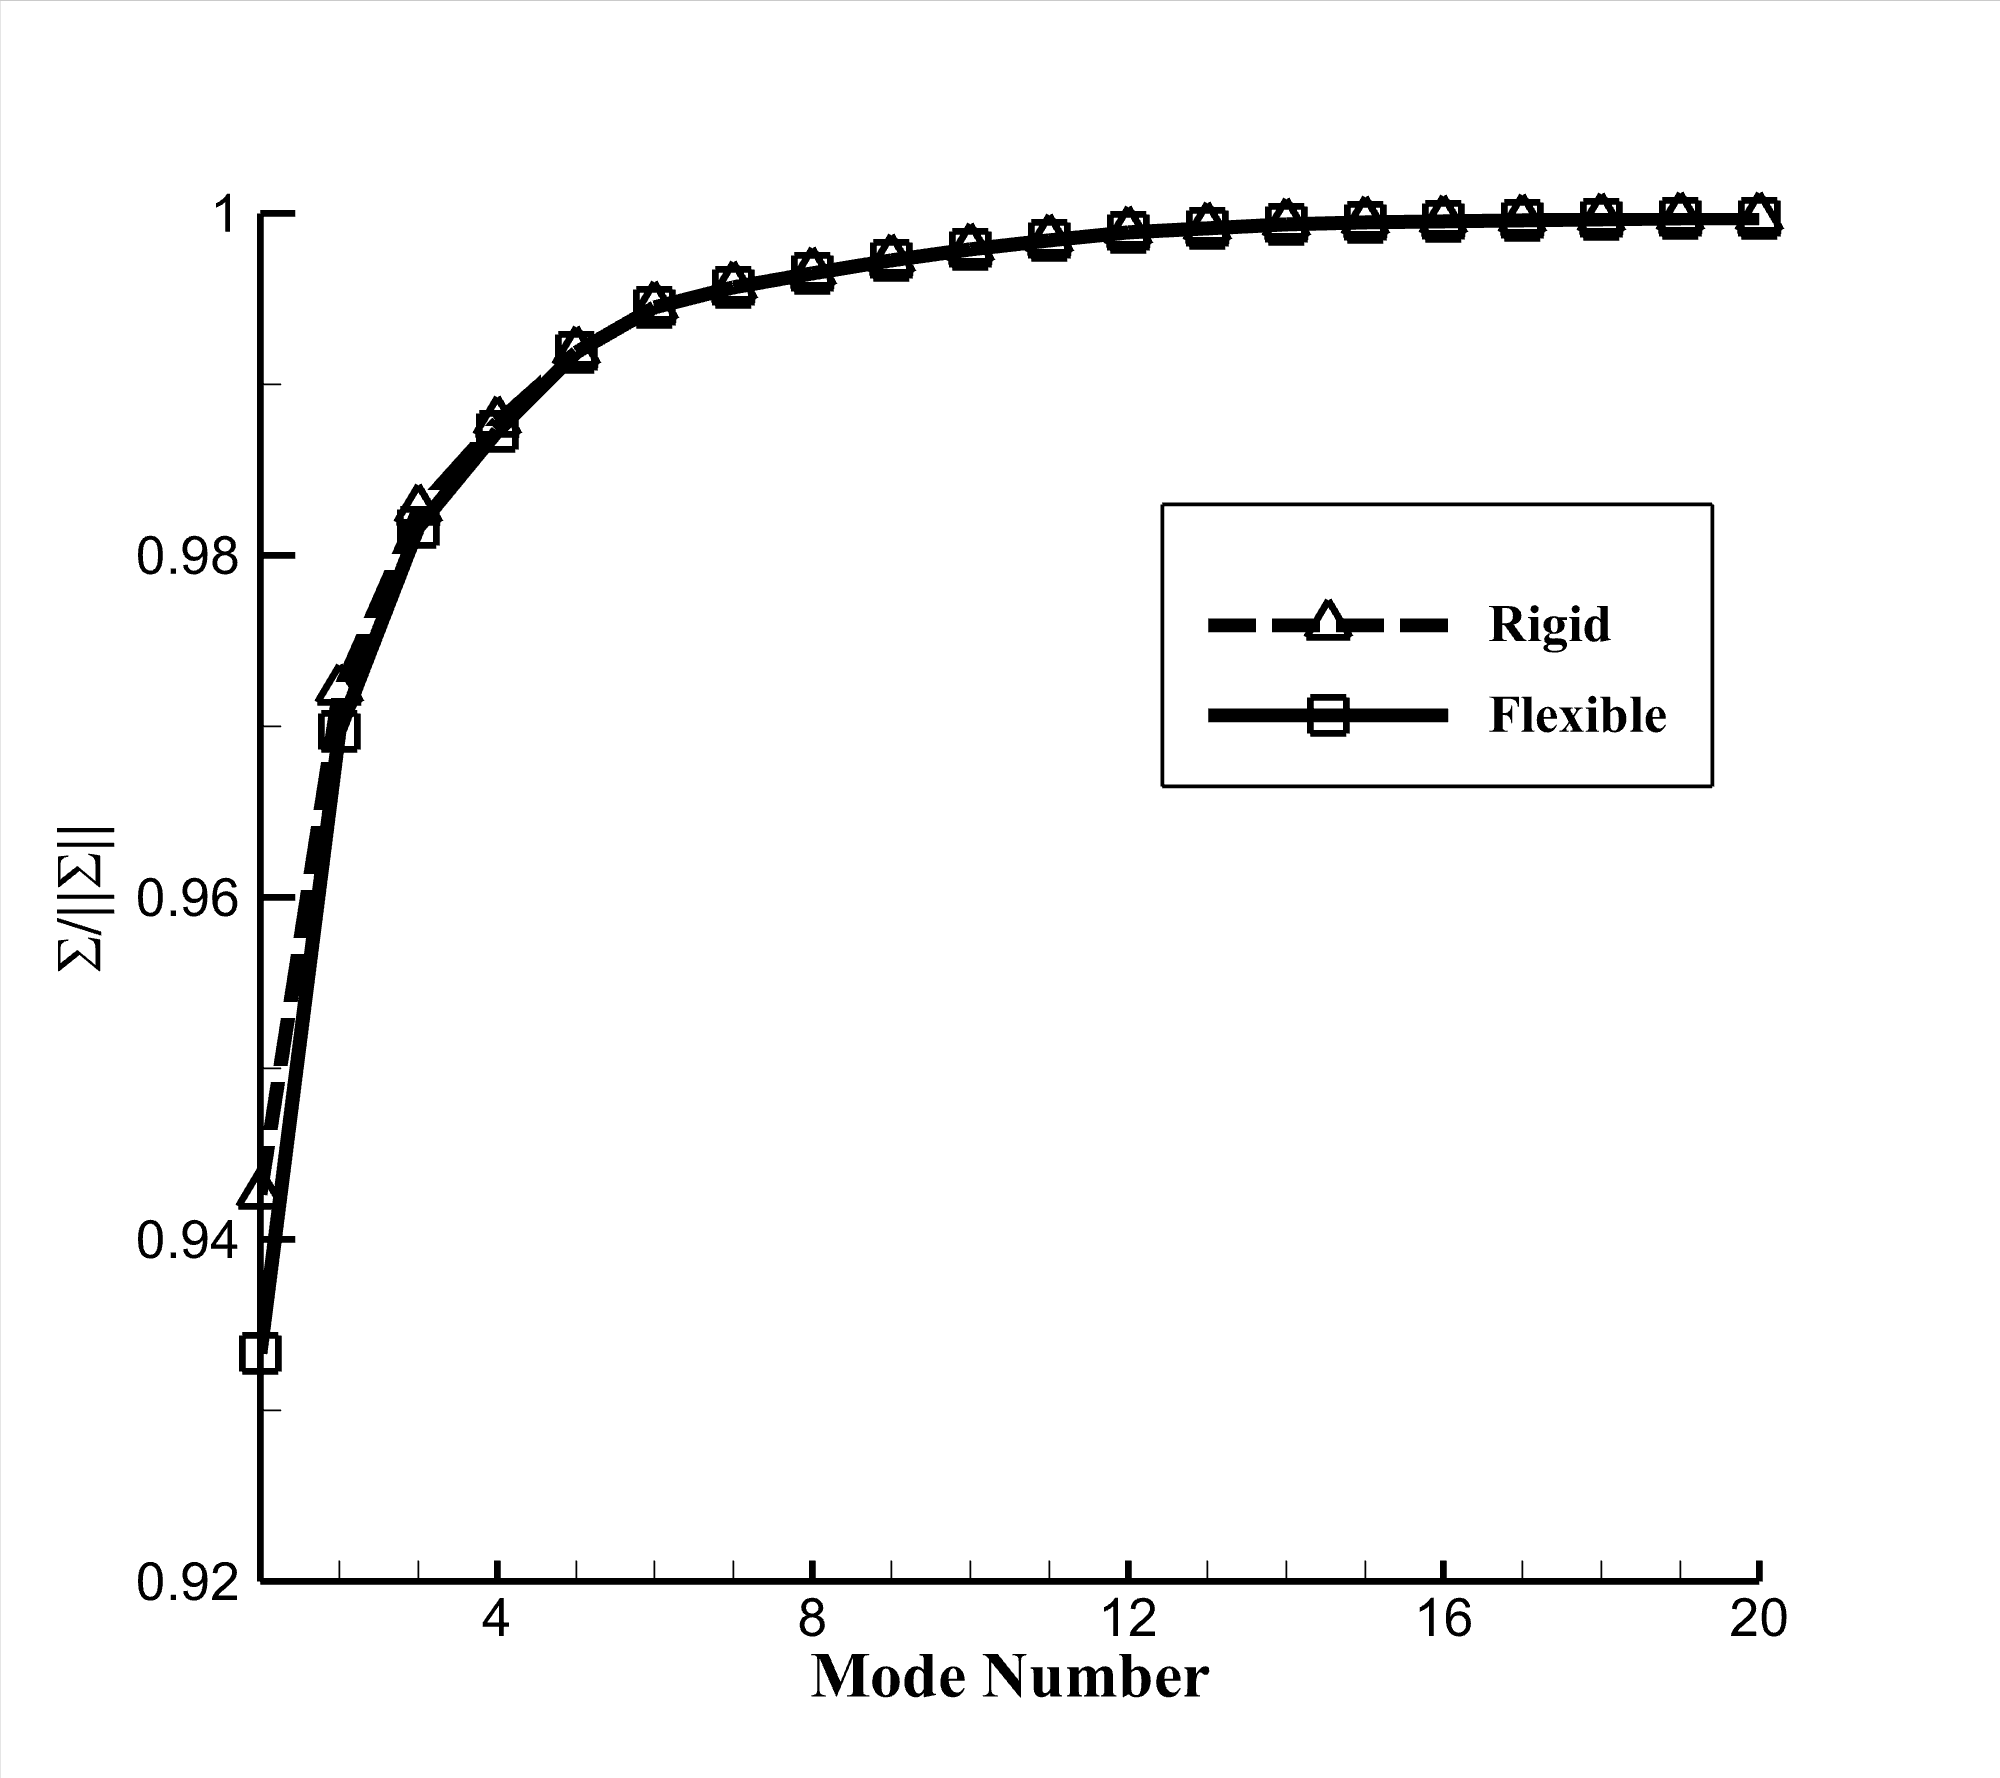
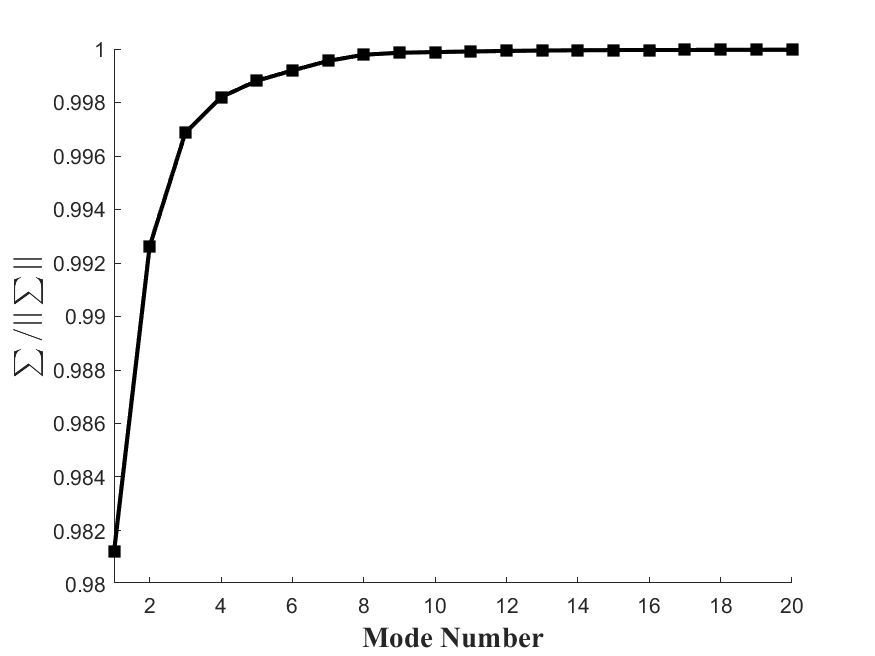
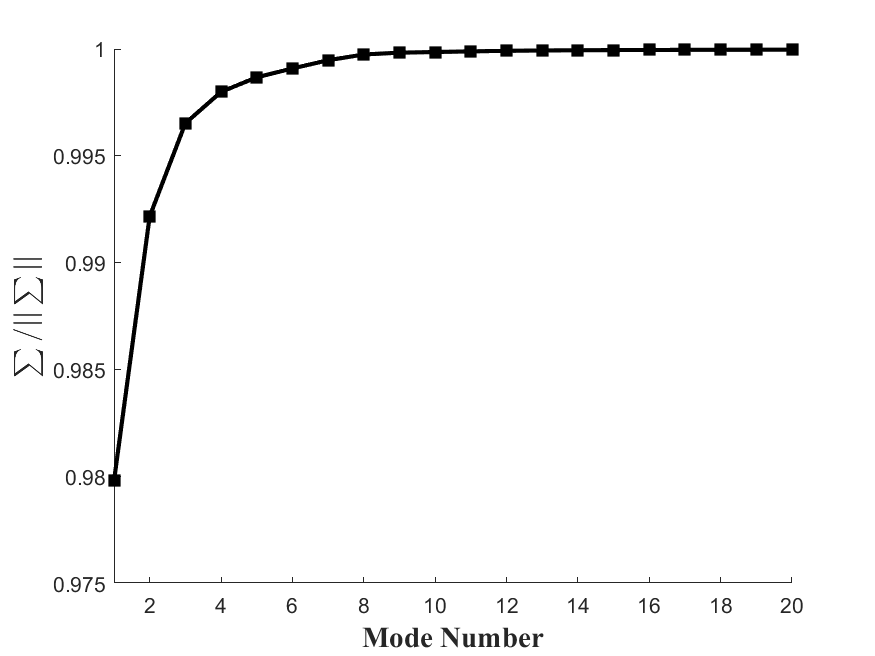
The modal accumulative energy of the velocity magnitude at the streamwise plane is shown in Fig. 11. Wake regions of rigid and flexible blades demonstrated a similar trend and close values, especially after the second mode. The highest difference was observed within the first mode which corresponds to less than 2%. Moreover, the value of the first mode of the flexible turbine was less than that of the rigid turbine due to the blade deflection (harmonic nature of flap-wise and torsional deflections) and corresponding flow alterations. After all, this result indicates the unnecessity of considering blade deformation for wake analysis behind large-scale wind turbines.
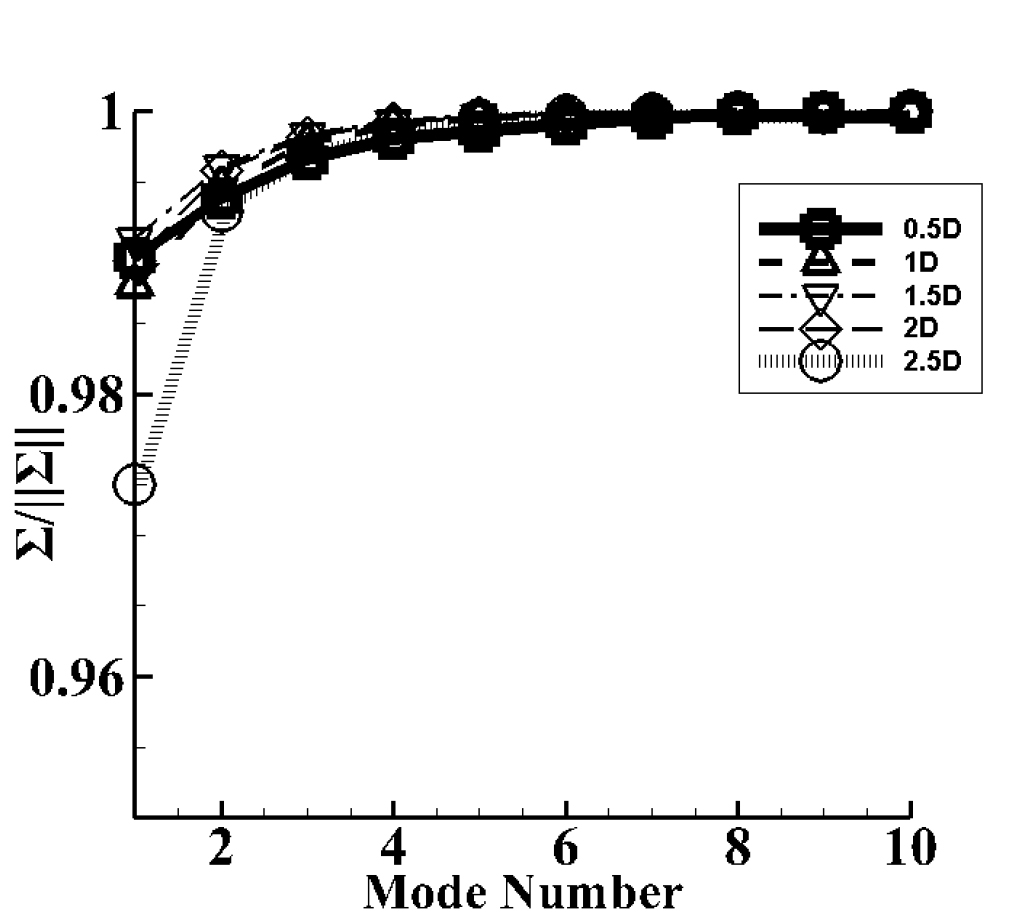
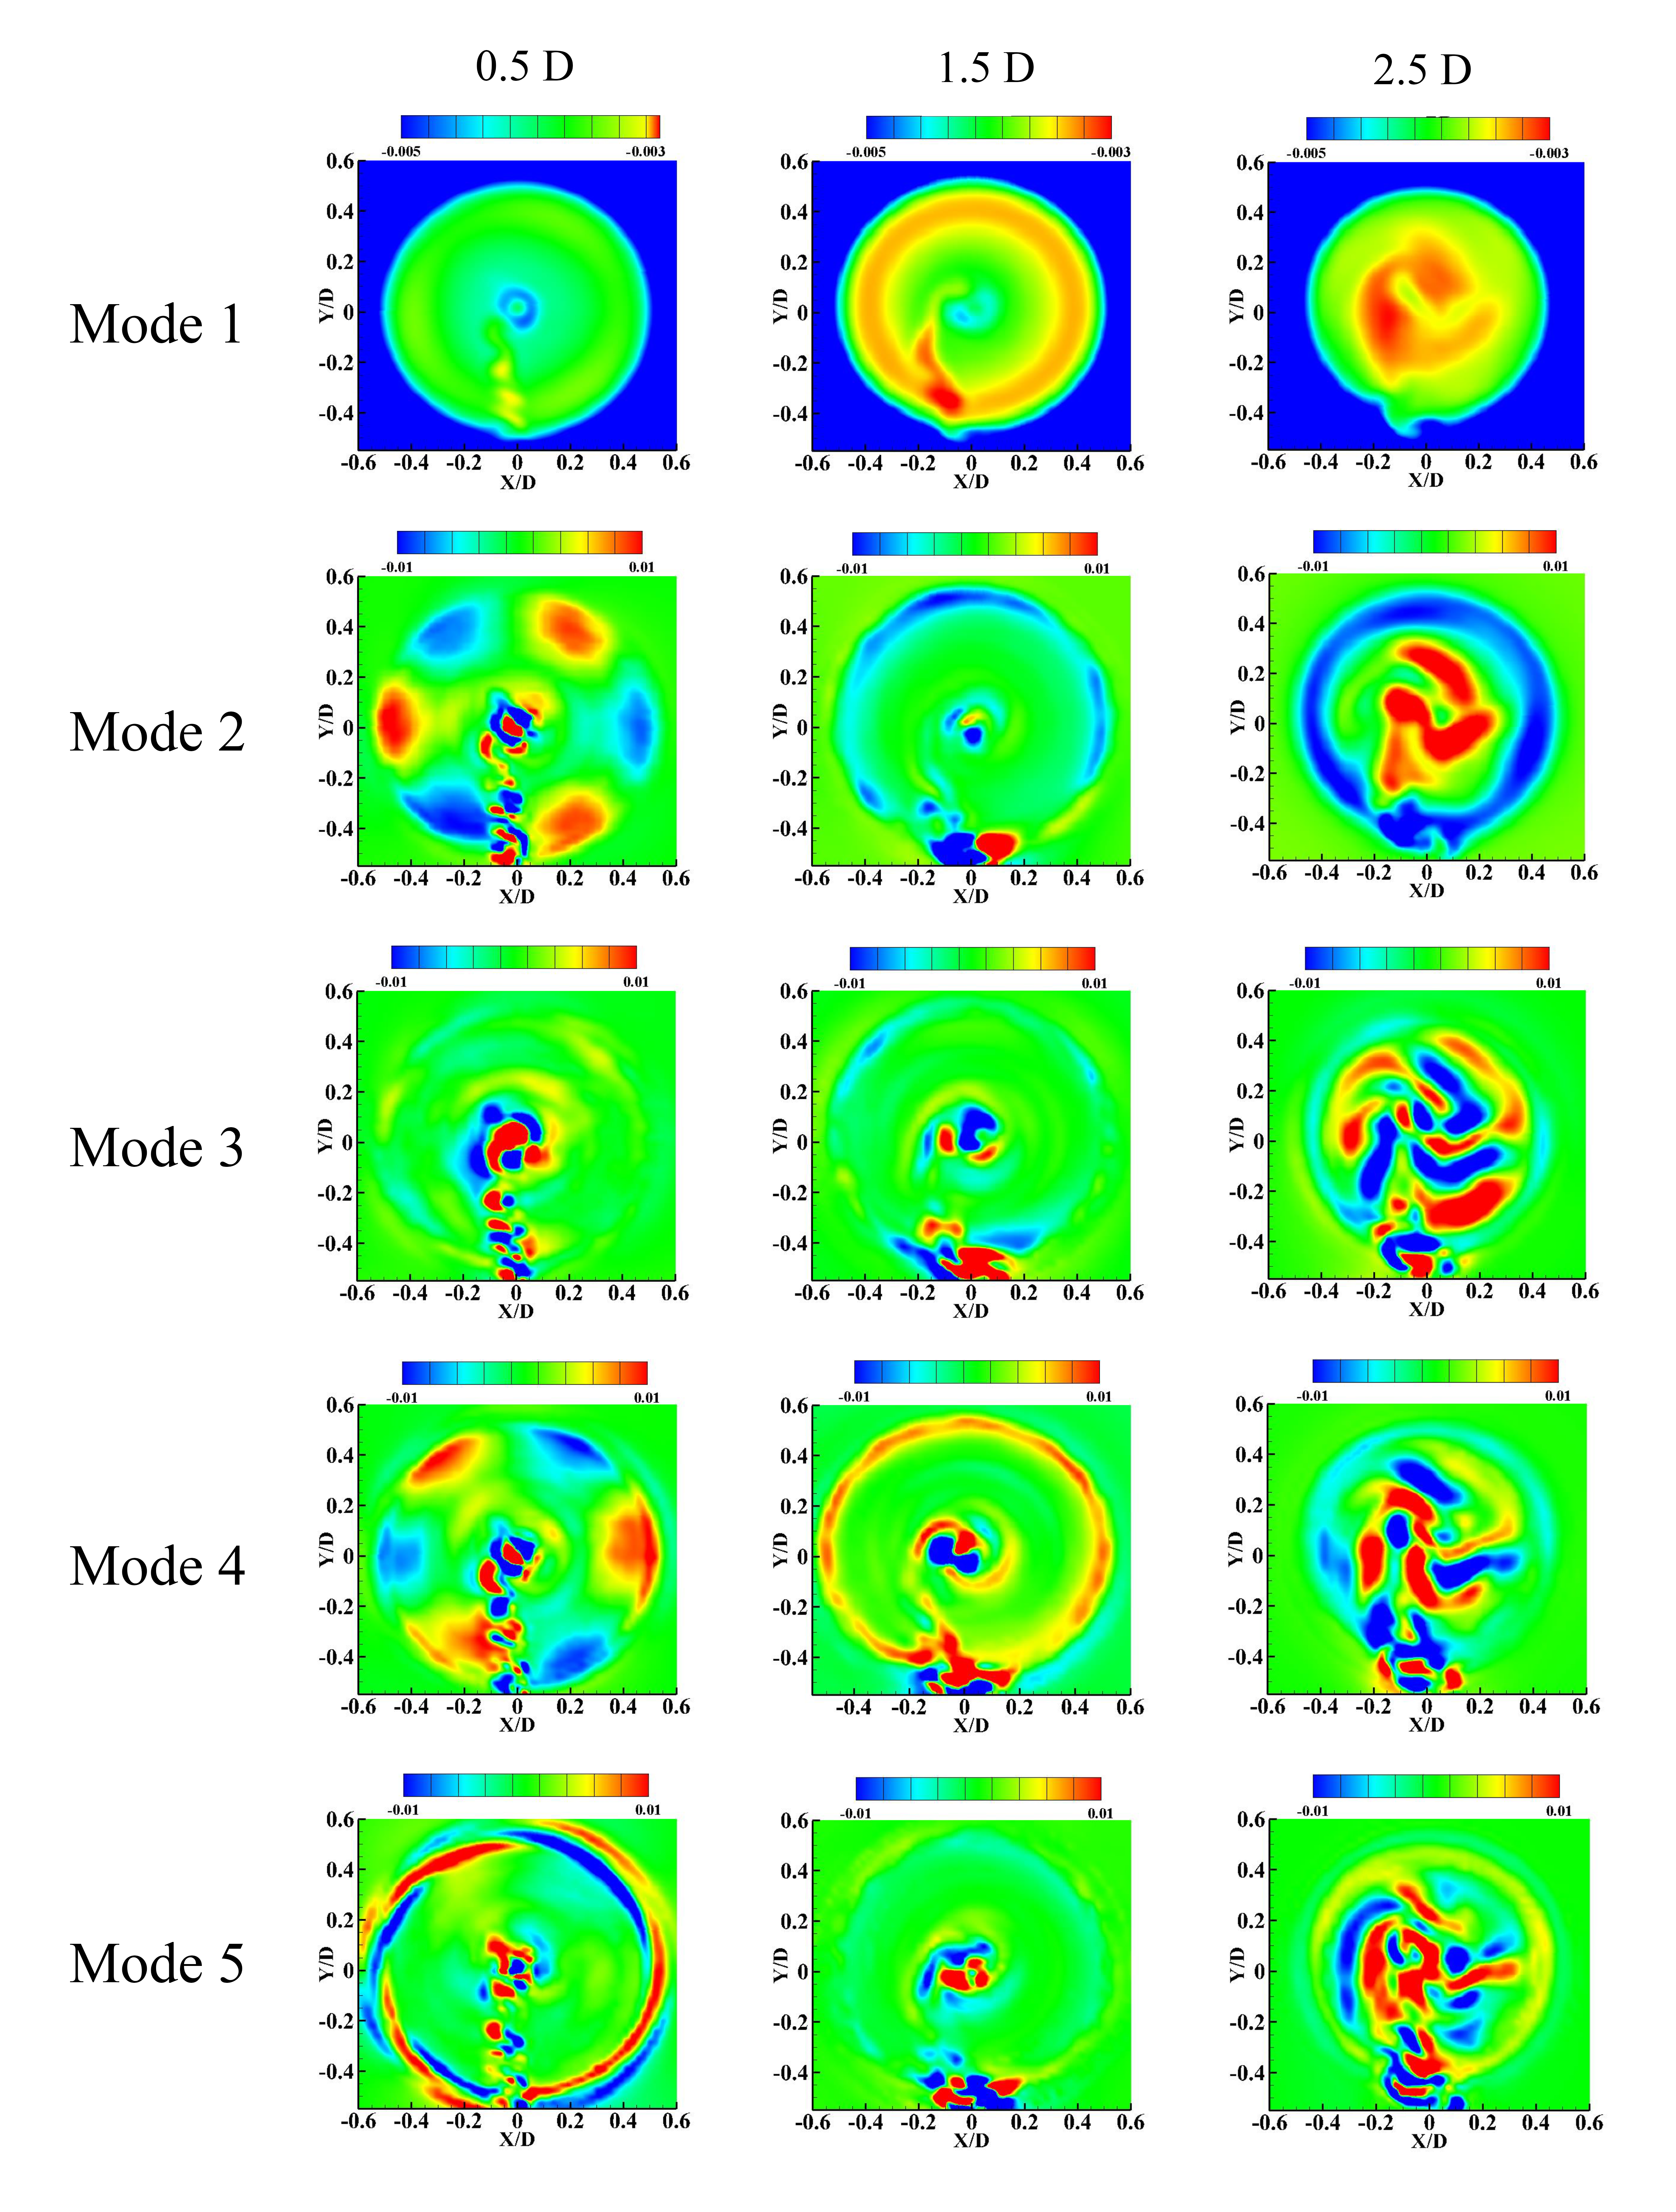
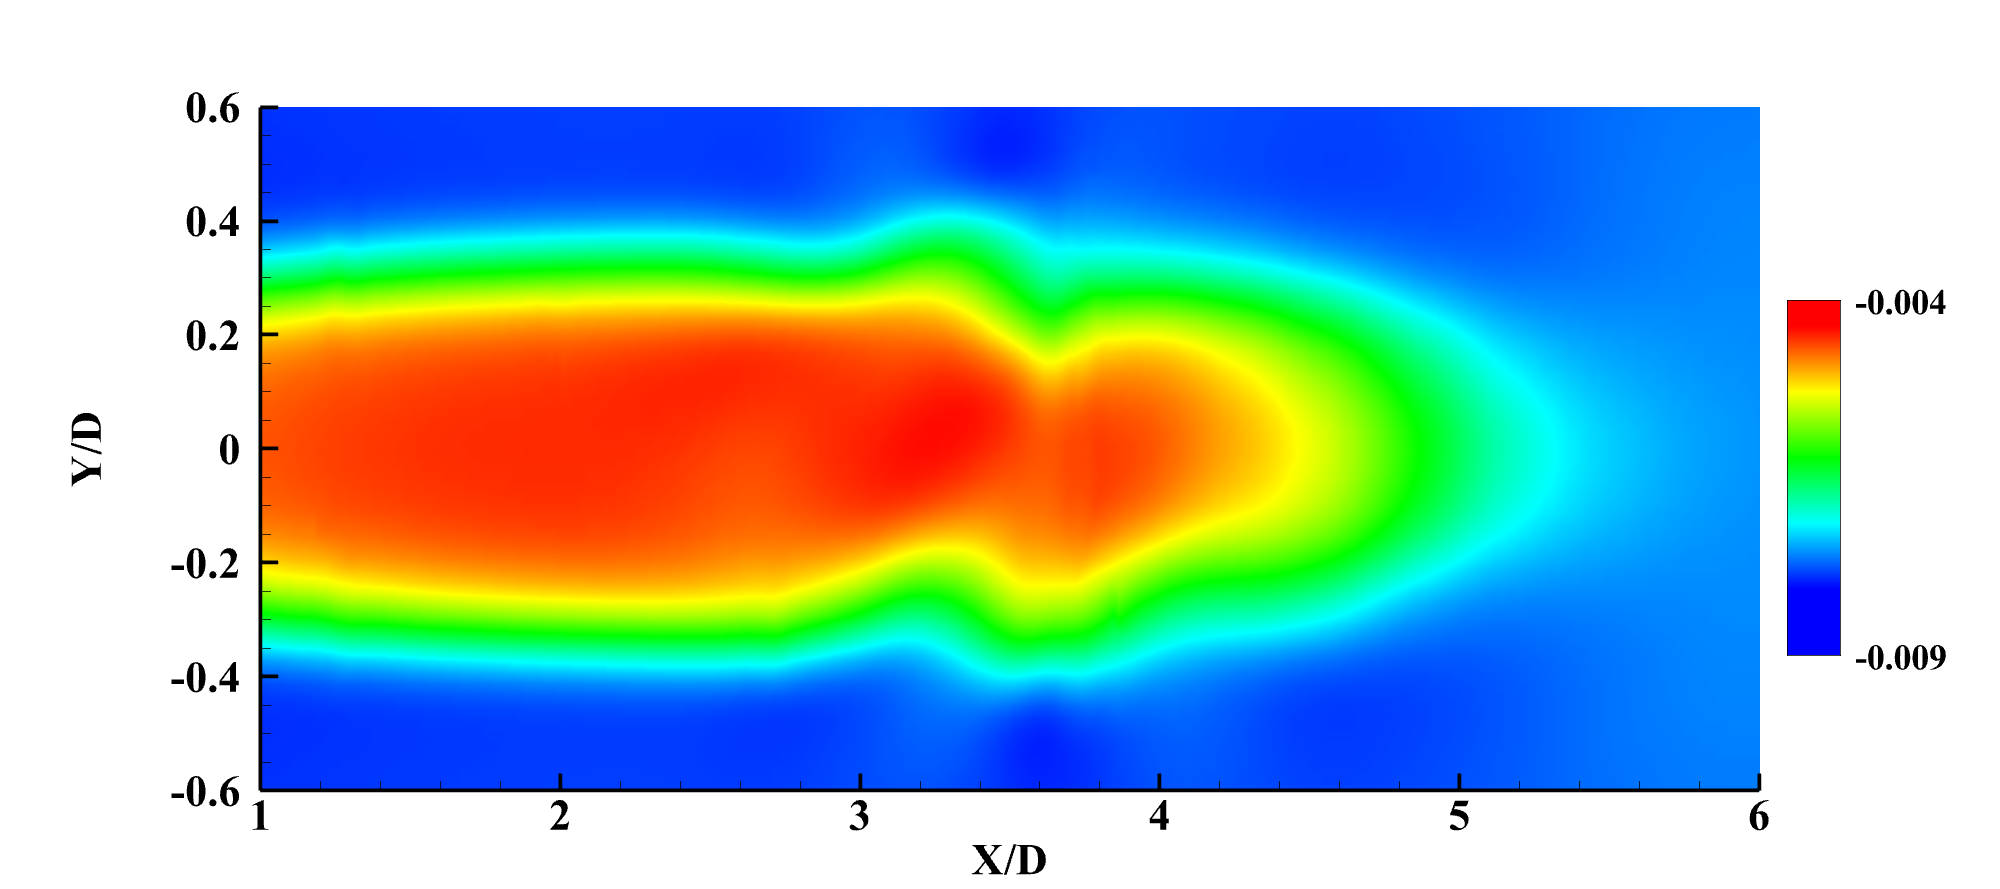
The modal cumulative energy at different spanwise planes from 0.5D to 2.5D away from the rotor has been presented in Fig. 12. It is evident that the farthest plane located 2.5D away from the rotor contains the lowest amount of cumulative energy in the first mode. As a result, it is expected to observe more flow structures at the furthest plane. In addition, the modal energy for the planes from 0.5D to 2D demonstrated a similar trend to each other. Therefore, the flow structures at the near plates could represent analogous vortical characteristics. In this regard, in order to have a deeper insight into the wake, the spatial modes of the streamwise component of velocity at planes located 0.5D, 1.5D and 2.5D behind the rotor have been presented in Fig. 15. The first modes as seen, mainly show the area affected by the presence of the rotor which was also found in the work of (De Cillis et al., 2021). Additionally, this area is subtly affected by the presence of the tower and nacelle. To illustrate, in the first mode at 0.5D presented in Fig. 15, the affected area by the energy extraction is distorted towards the lower part due to the wake shedding of the tower whose trace can be more clearly seen in the consecutive planes. For instance, in the first mode at 1.5D, the wake shed from the tower becomes more pronounced indicating that moving away from the rotor, the effect of energy extraction is outweighed by the wake shed. Furthermore, the first mode at 1.5D vividly shows the tip vortices emanating from the blades’ loading. The decay of this trend can be observed at farther planes at 2.5D. Moreover, the flow structures due to the wake shed from the tower tend to move towards the center and merge with that of the nacelle leading to an integral vortical structure 2.5D away from the rotor. In addition, the symmetrical shape of the first mode starts to fade away with the increase in the distance from the rotor proving that while the work extraction is the main characteristic of the planes near the rotor, the effects of wake shed and tip vortices rise into importance in the farther planes.
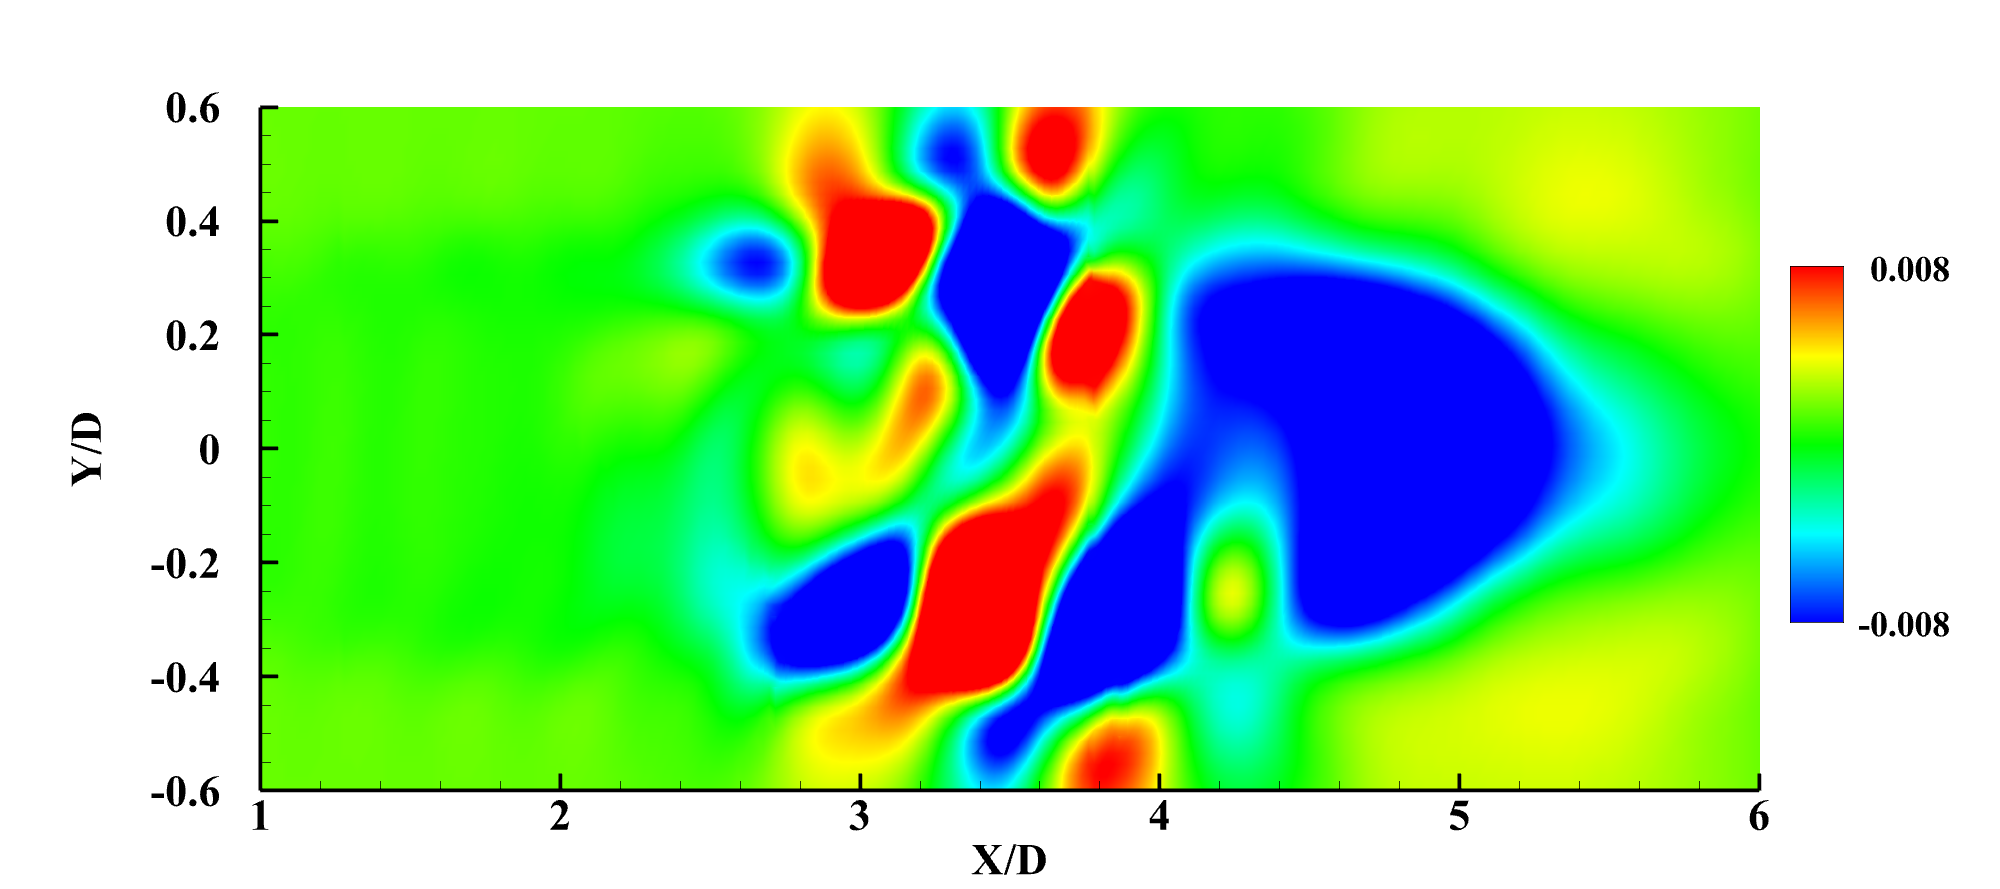
The second mode at 0.5D from the rotor illustrates the structures stemming from the tower wake and the tip vortices which are the most effective patterns in the wake of the wind turbine. This observation has also been reported in (Sheidani et al., 2023b; Iungo et al., 2015; Bastine et al., 2014; Andersen, Sørensen, and Mikkelsen, 2014). It should be noted that with the increase in the distance from the wind turbine, the decay of the structures at the plane in 0.5D is observed at the same mode number. To illustrate, the flow structures shedding behind the tower are observed at the same positions, however, at smaller dimensions which are also observed for the tip vortices. Moreover, as also shown for the first modes, the flow structures due to the flow interaction with the tower begin to move towards the central part forming an integral structure at 2.5D behind the rotor. However, it should be noted that the central integral structure at 2.5D at the first and the second modes decays into separate structures in the next modes. In addition, the structures emanating from the flow interaction with the tower prove to sustain themselves for a longer distance and through higher mode numbers. This observation insinuates that the tower wake along with those stemming from the blades plays a more important role in the far wake compared to the tip vortices. Also, it is concluded that the exclusion of the tower leads to missing a major part of the wake structures, especially at far wake positions which have also been reported in (Premaratne, Tian, and Hu, 2022; Wang et al., 2012).
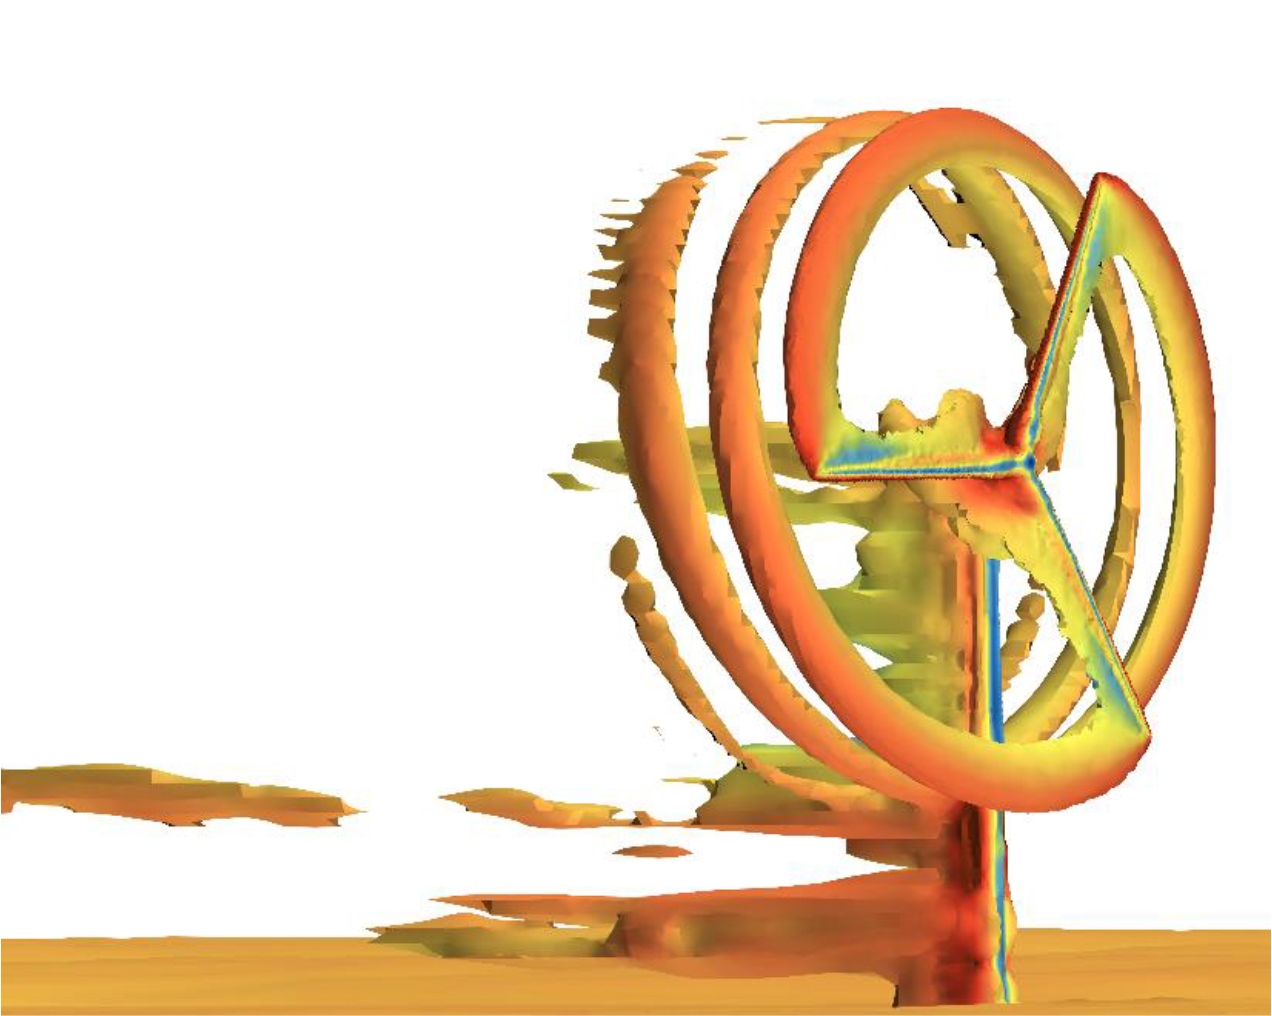
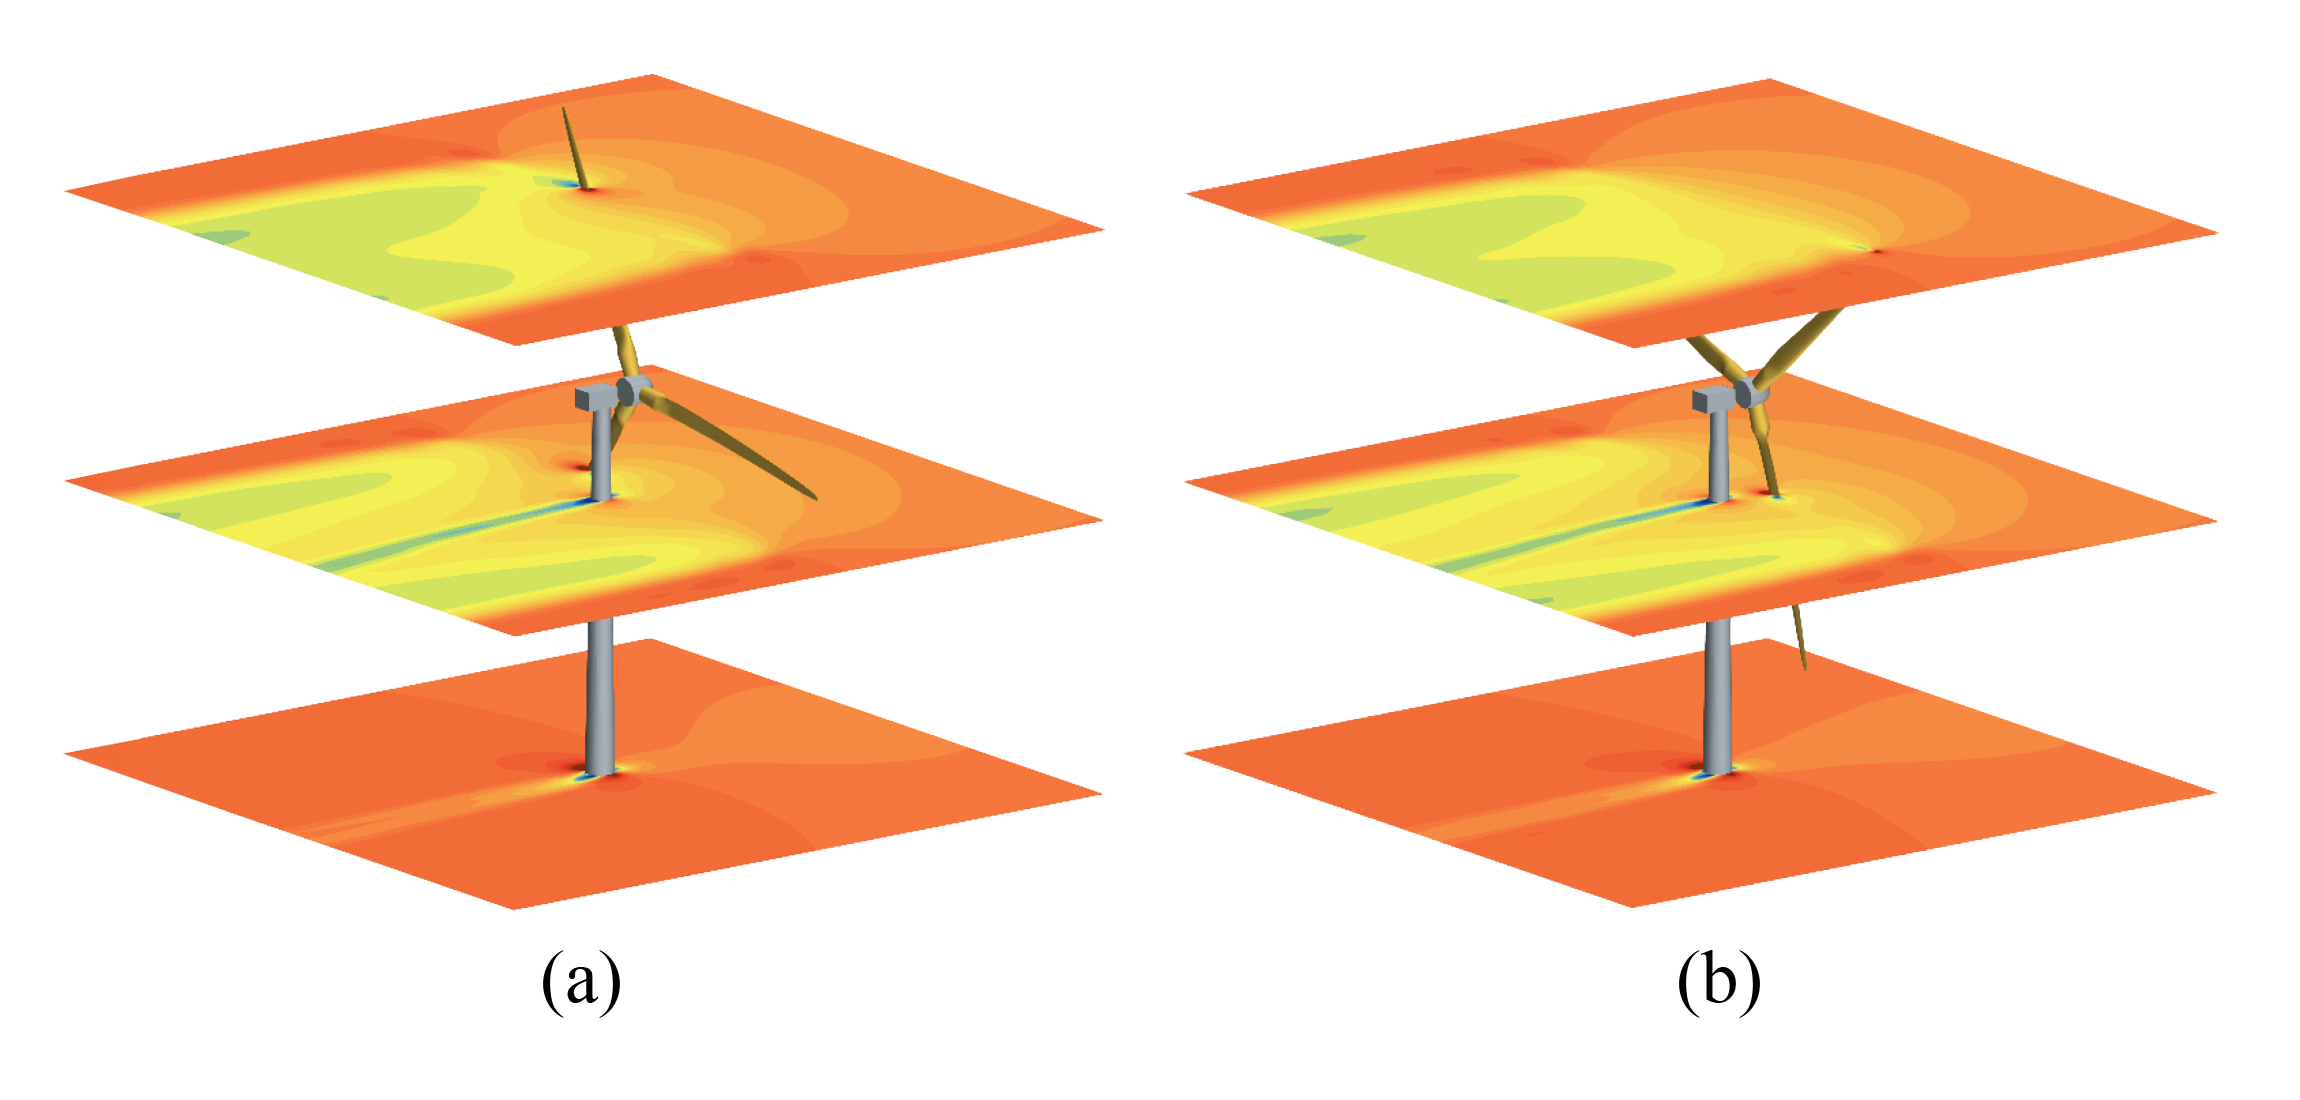
In order to investigate the effect of the tower on the downstream wake, the velocity magnitude contours at different sections have been presented in Fig. 14. As seen, the wake behind the tower leaves a significantly more sustainable trace compared to the wake of the blades. This is due to the fact that as also evident in the POD modes, the blades at the rated TSR undergo a suitable angle of attack leading to a less intense wake shed compared to the tower. As a result, it is found that the main elements affecting the wake of the wind turbine are the tower, tip vortex and to a lesser extent the blades especially, at the mid and tip sections. As for the comparison of the tower wake and the blade tip vortices which was also drawn in the spatial modes section, the vorticity field coloured by the velocity magnitude has been presented in Fig. 13. It is observed that the tip vortices sustain themselves for a longer distance compared to the blade wake, while as also previously explicated the tower causes the most significant effect on the wake region which could be traced for a much longer distance. In addition, the merging of the blade wake with that of the tower in the relatively farther planes behind the rotor could be observed which was explicitly discussed in the spatial mode section.
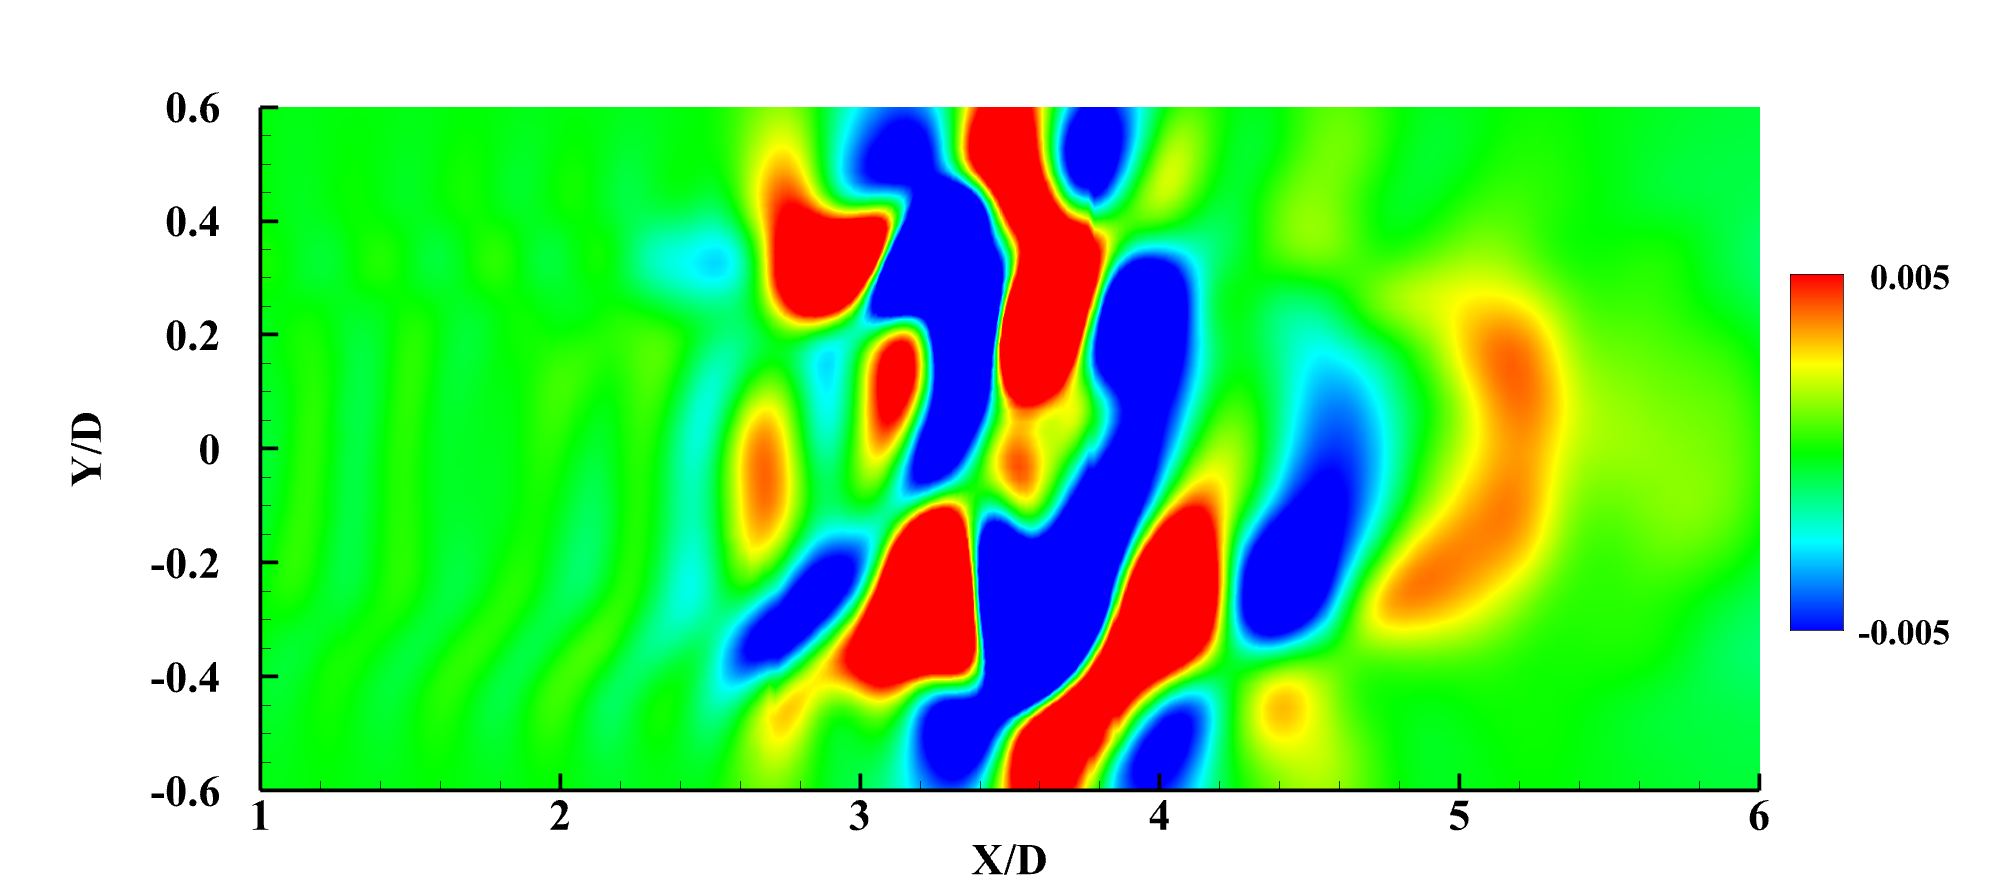
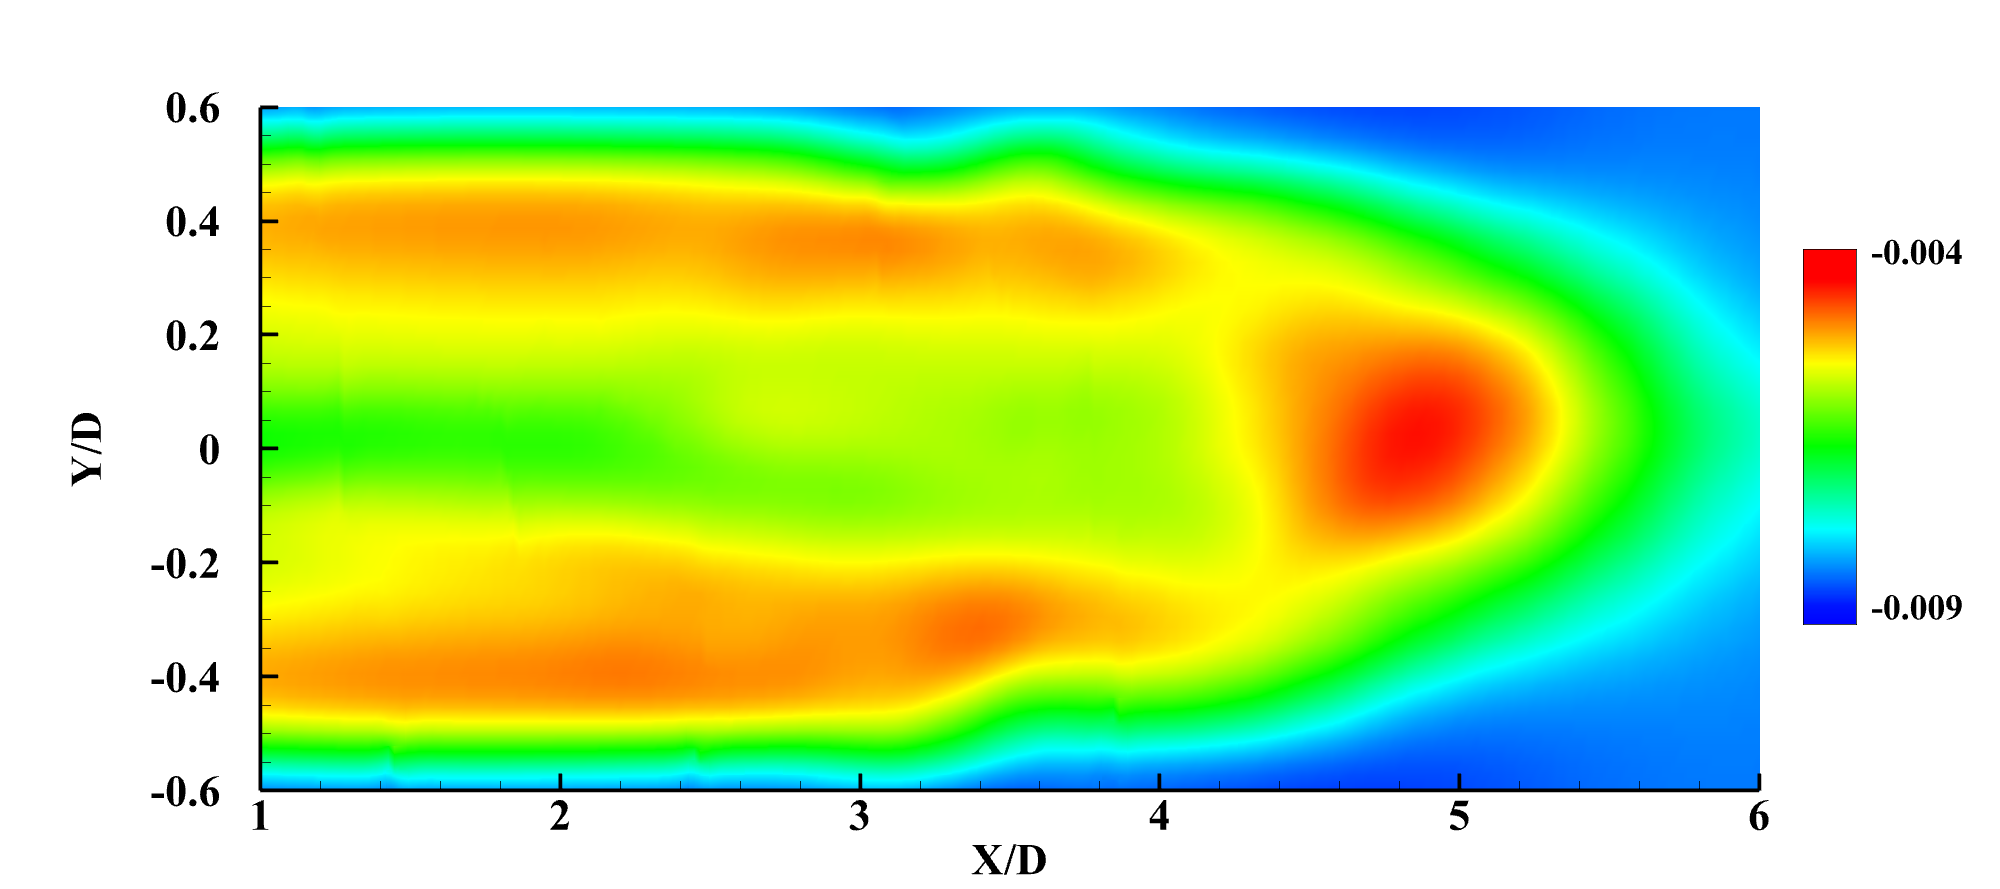
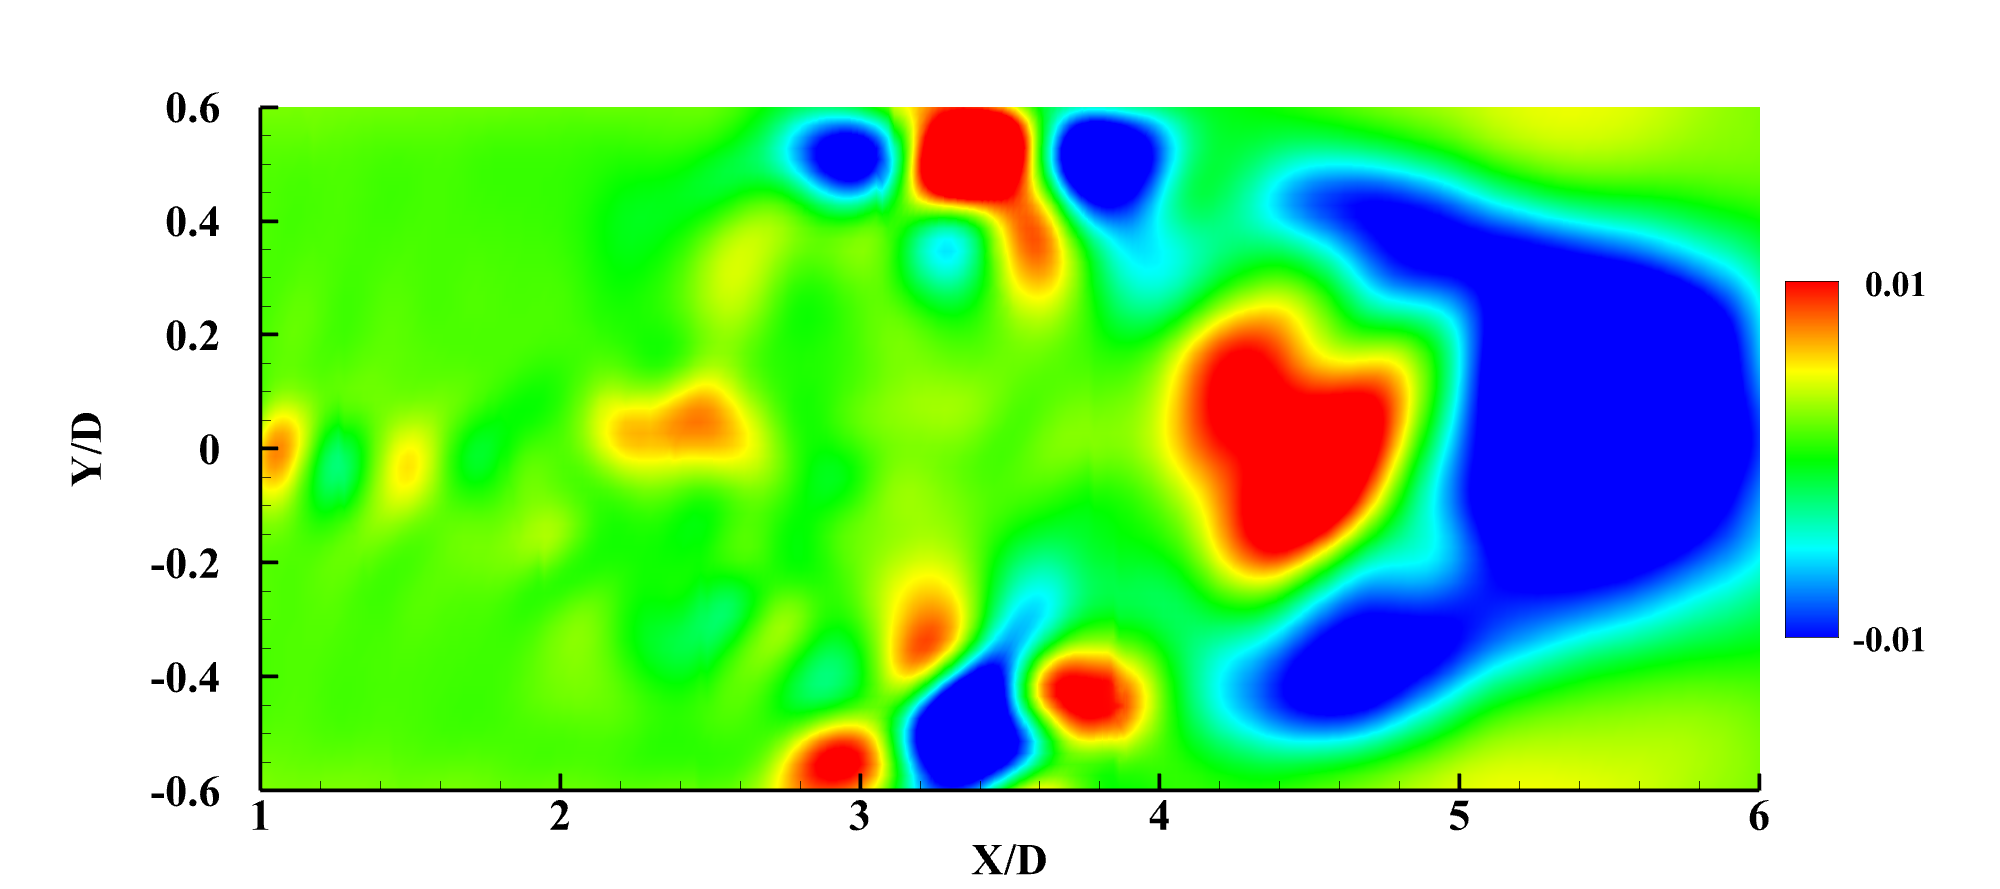
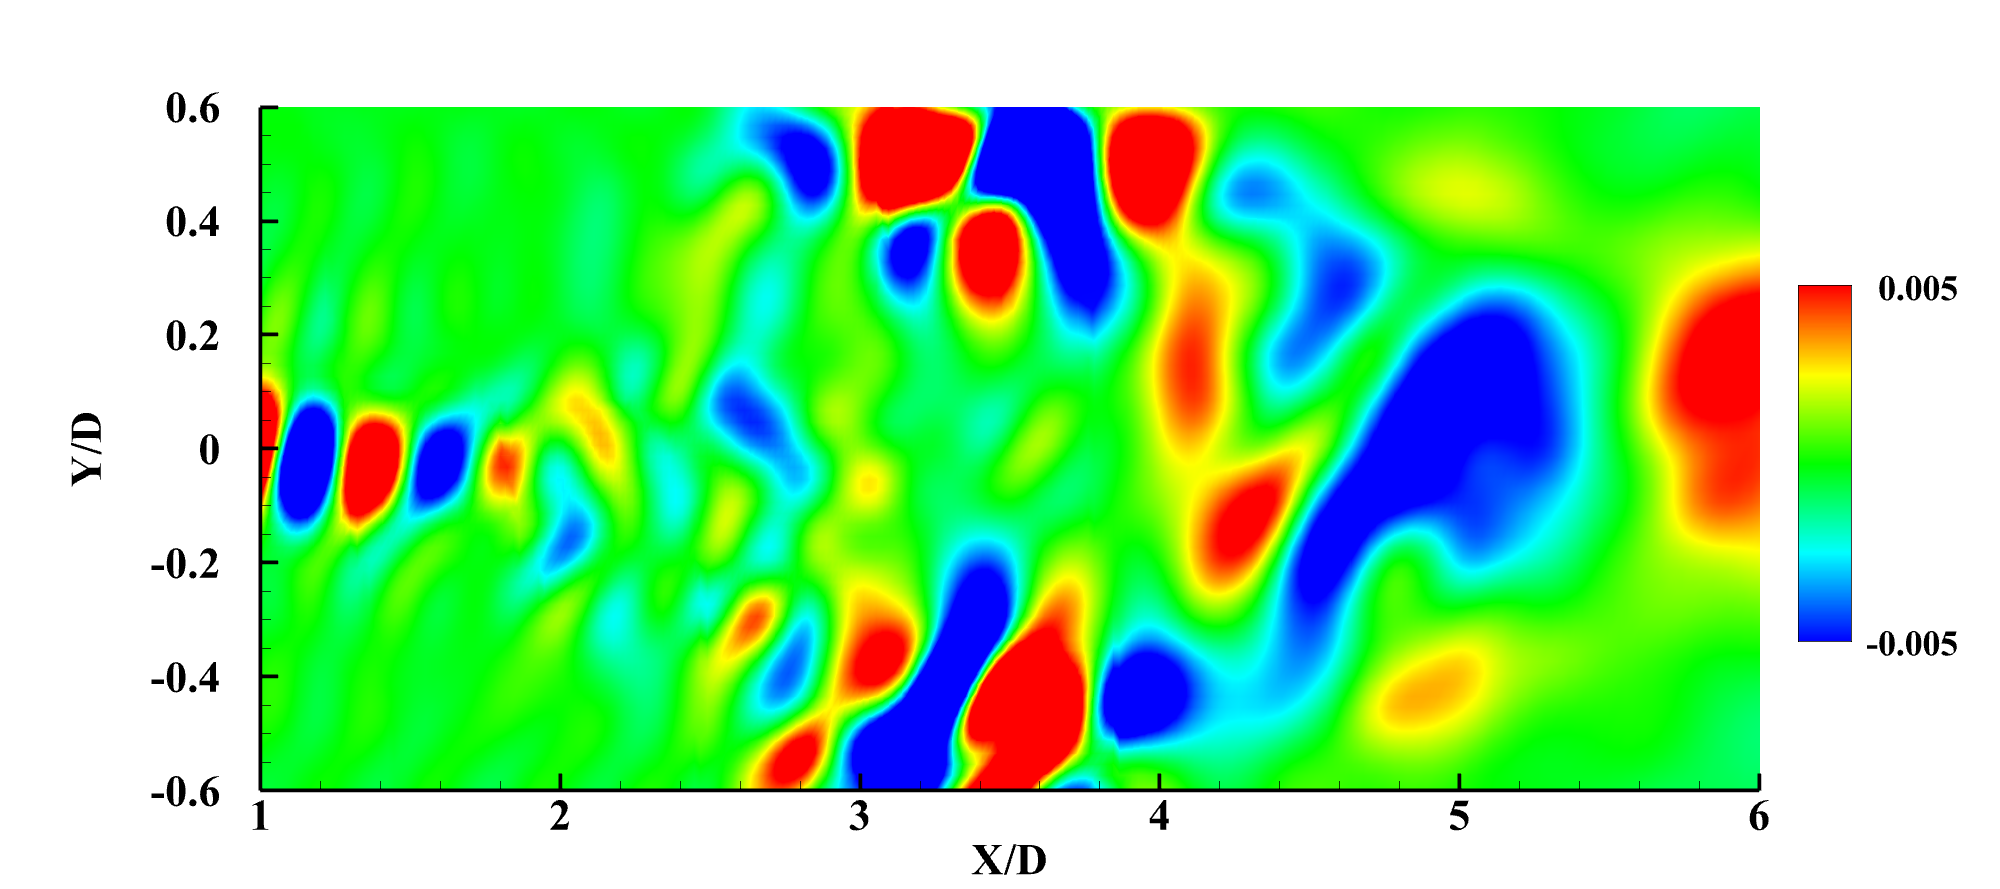
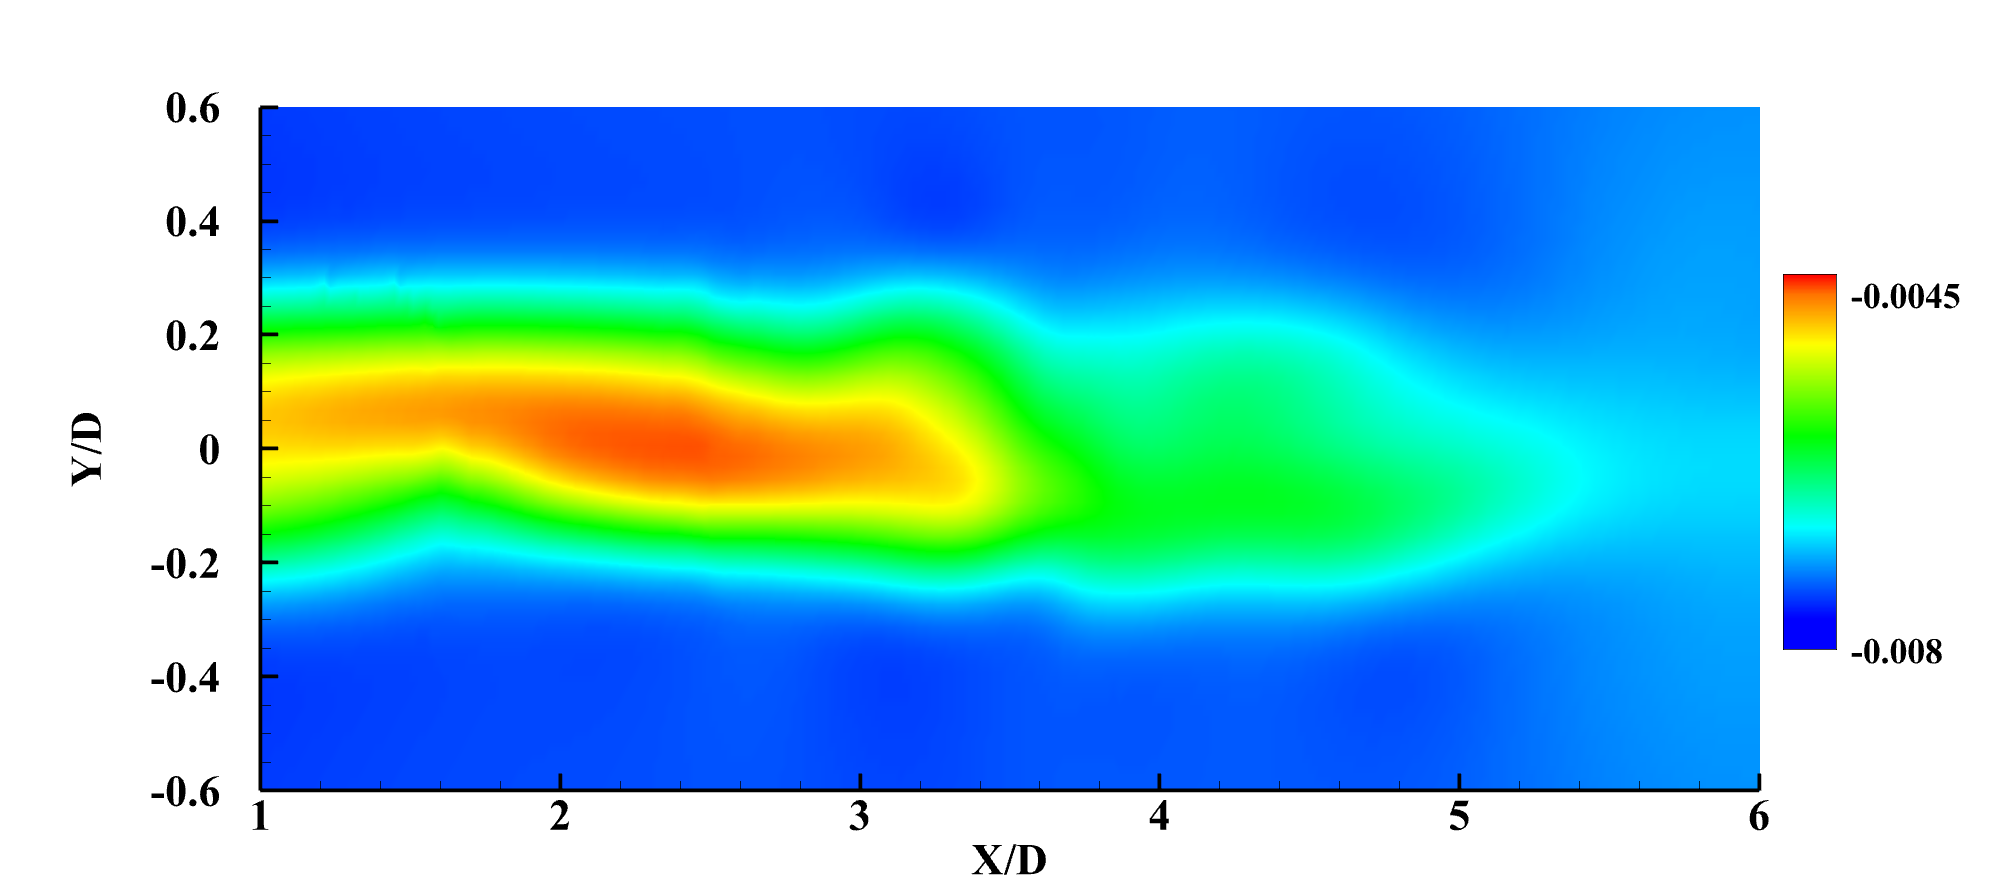
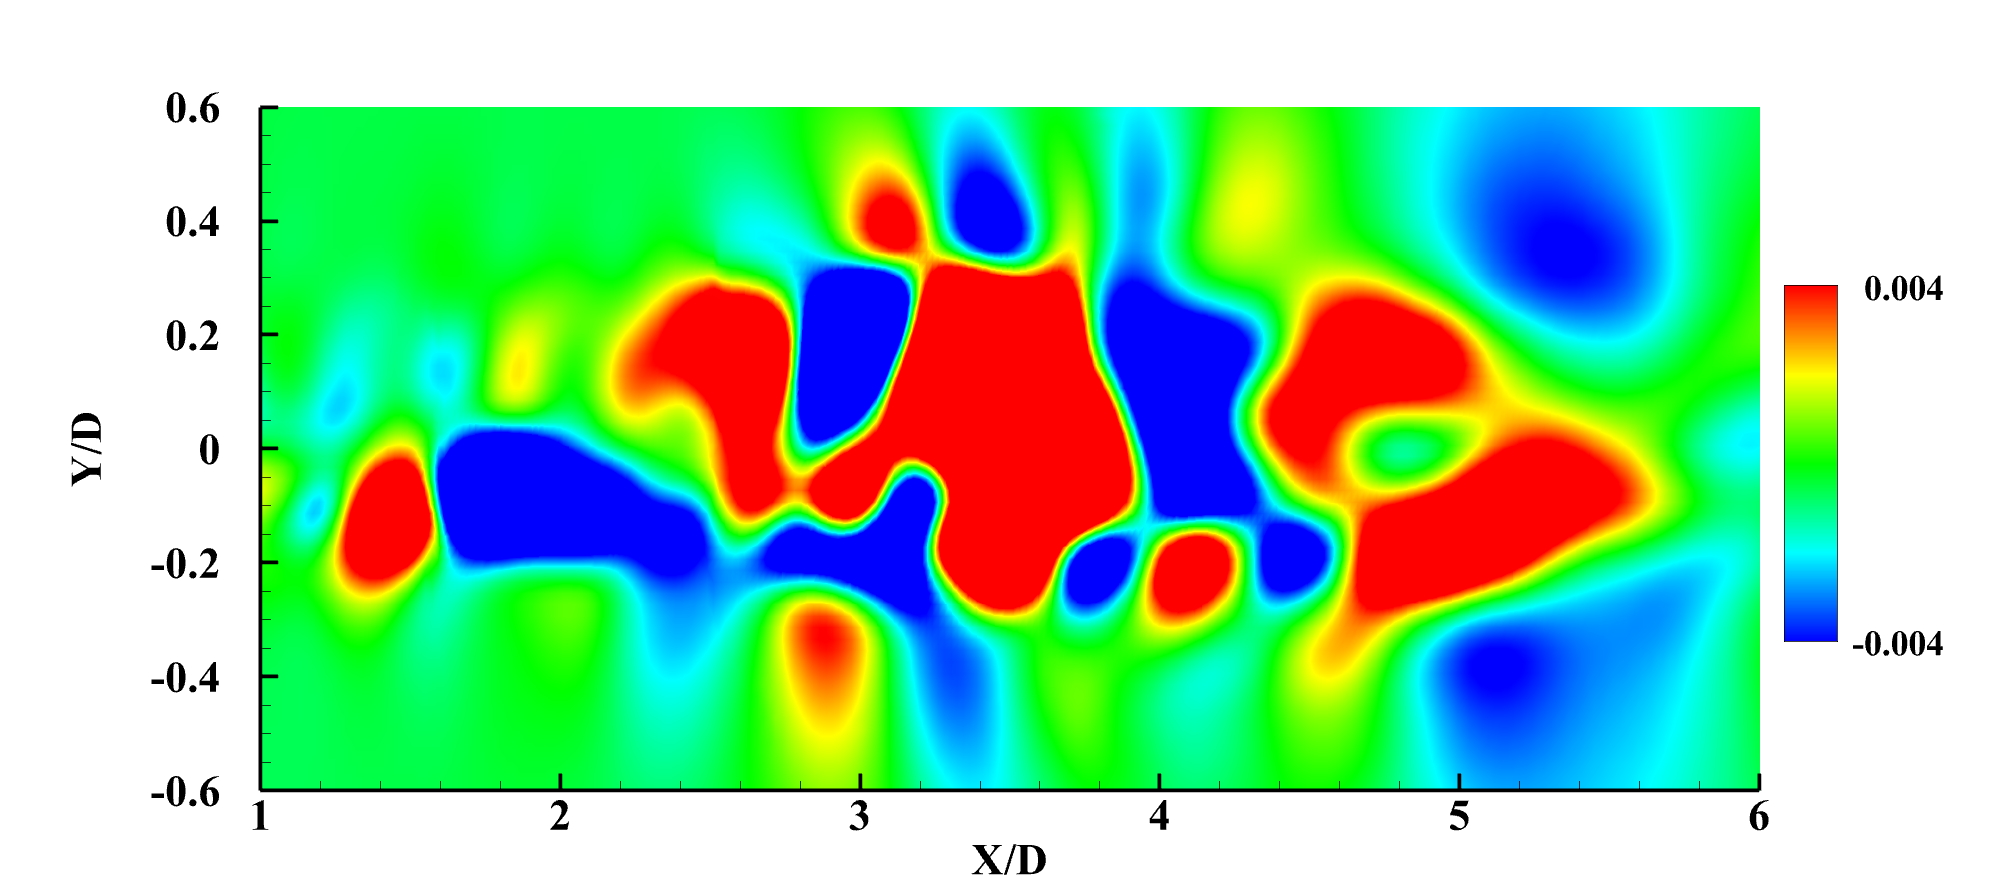
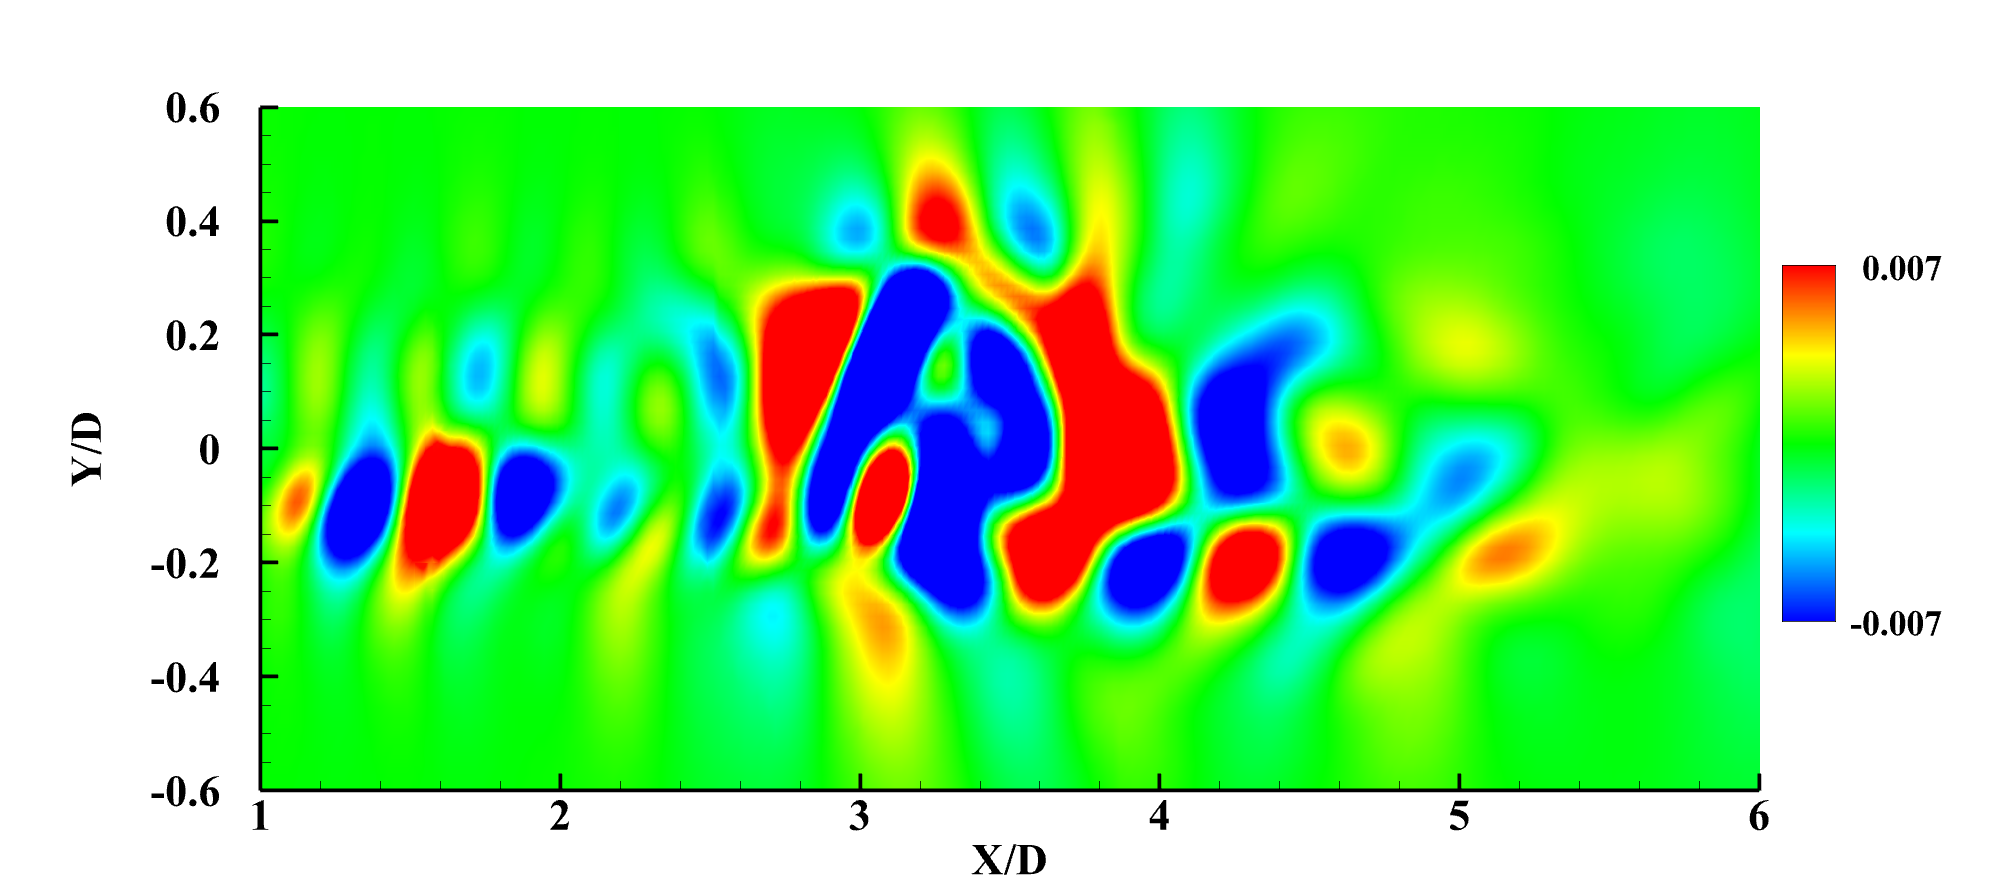
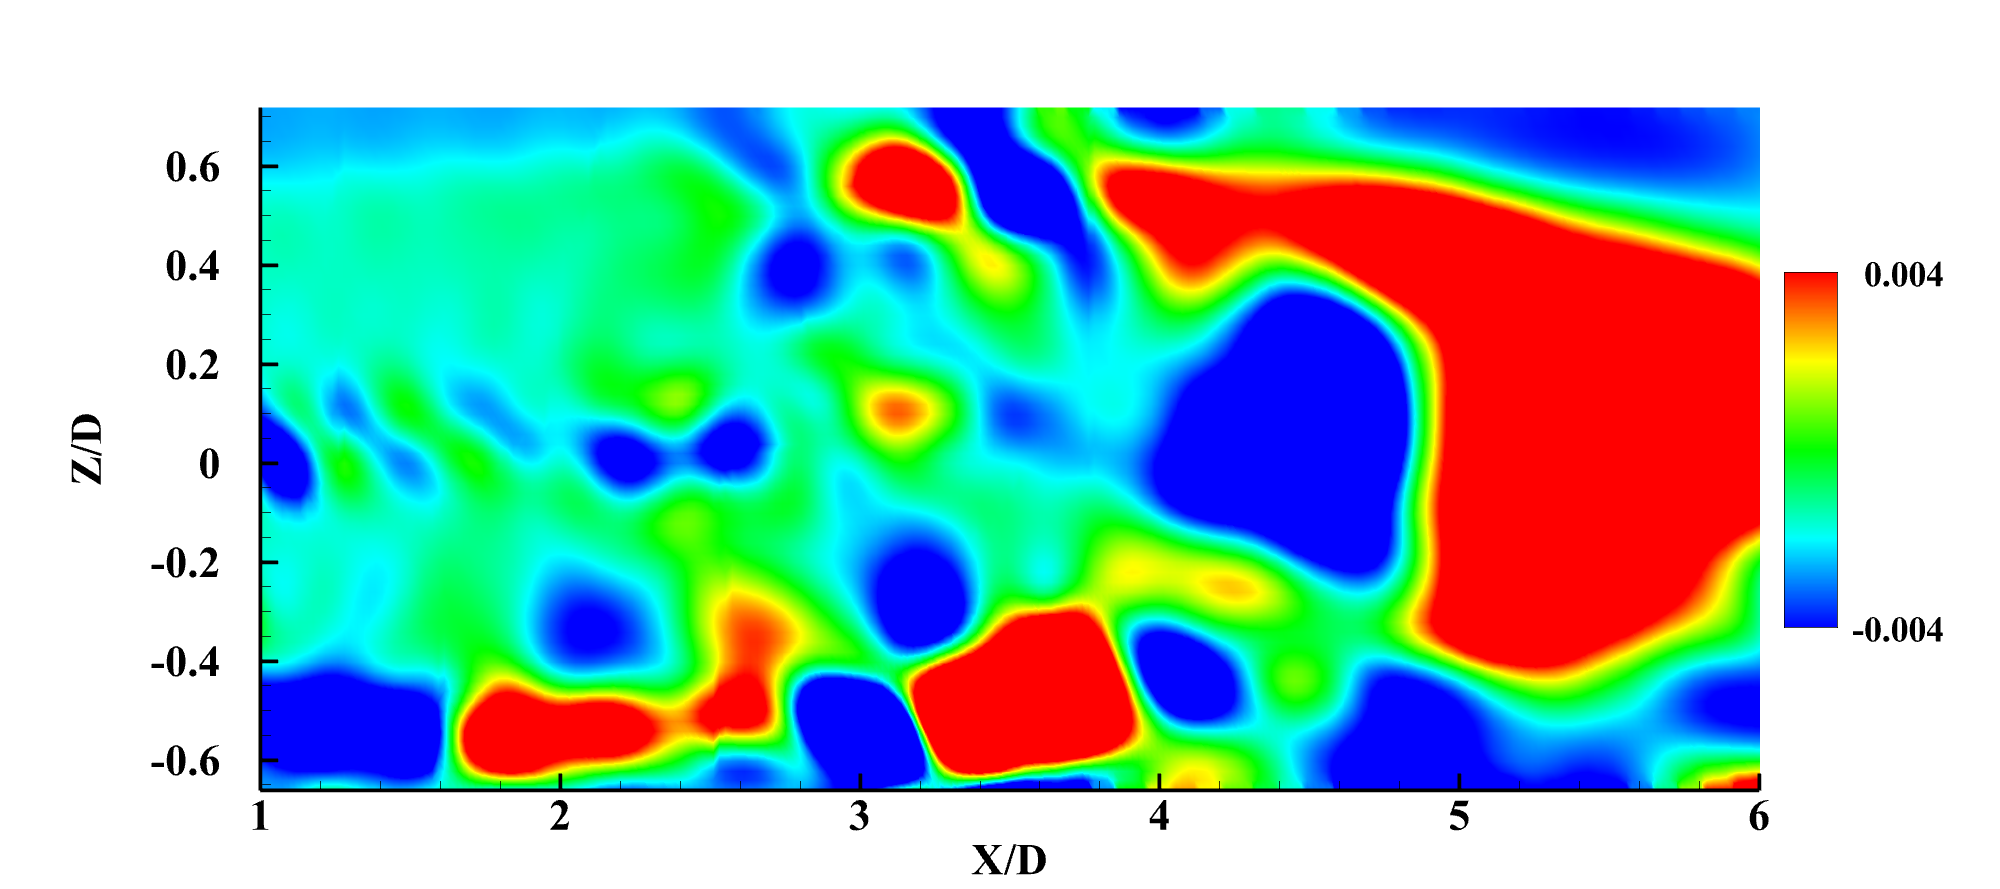
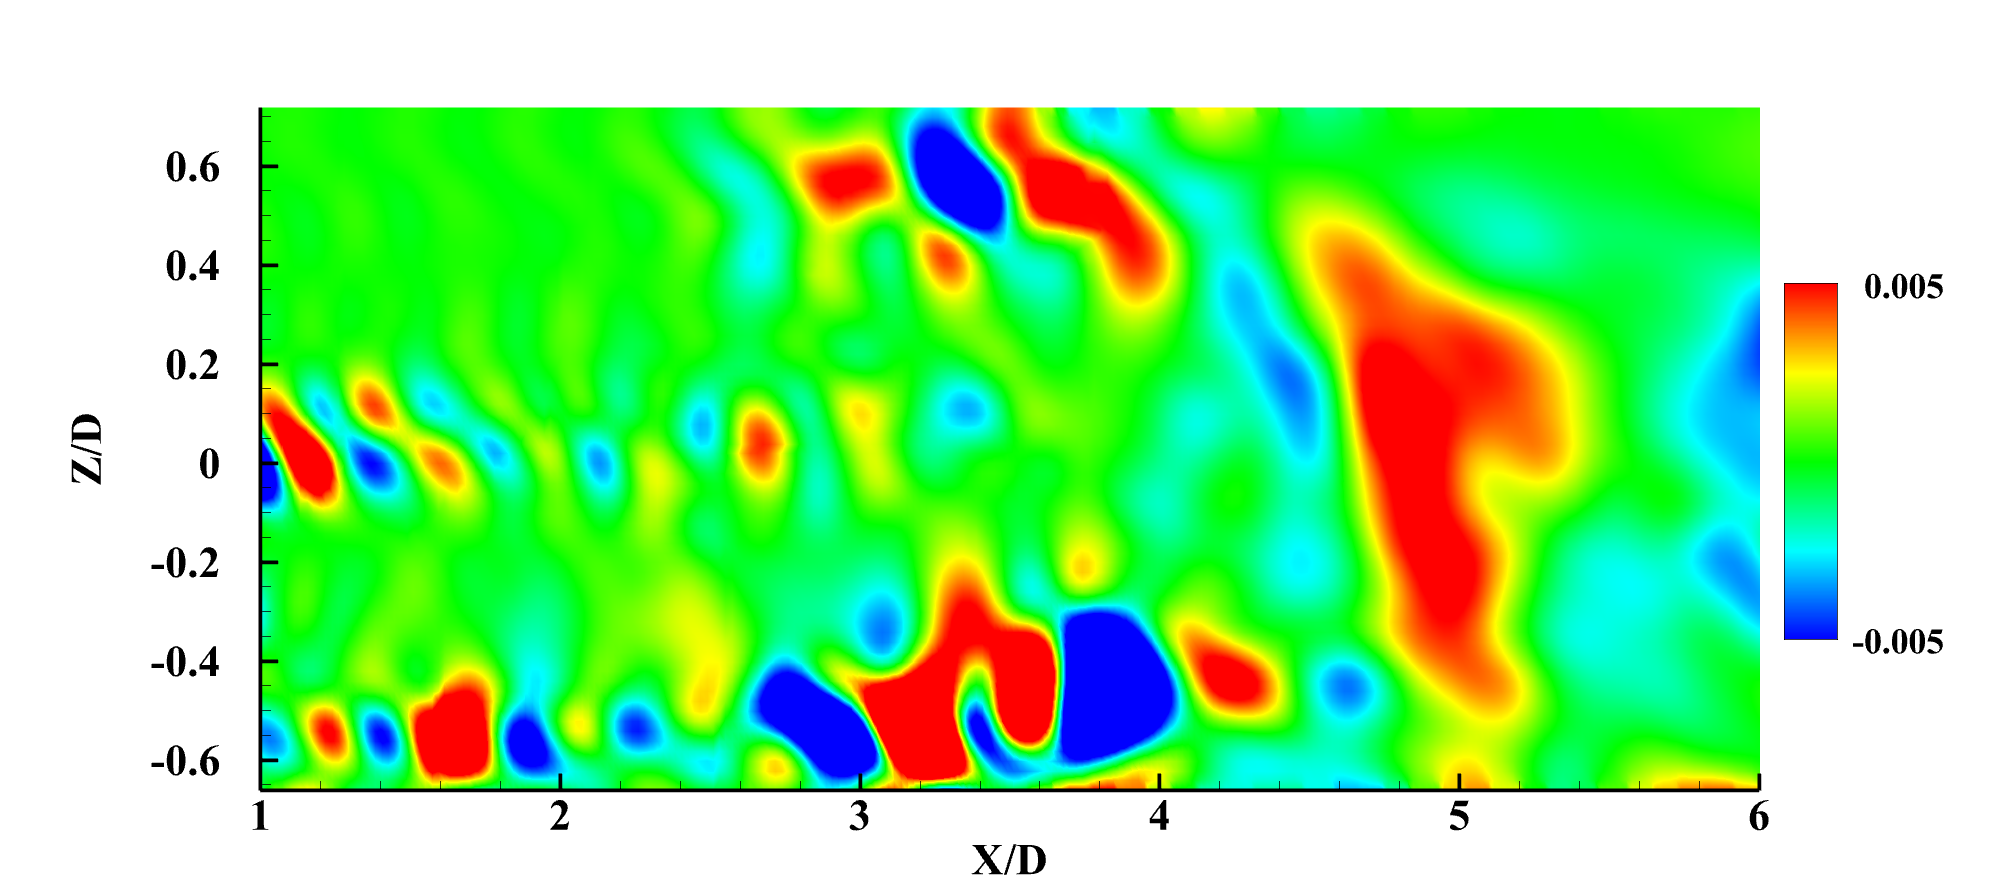
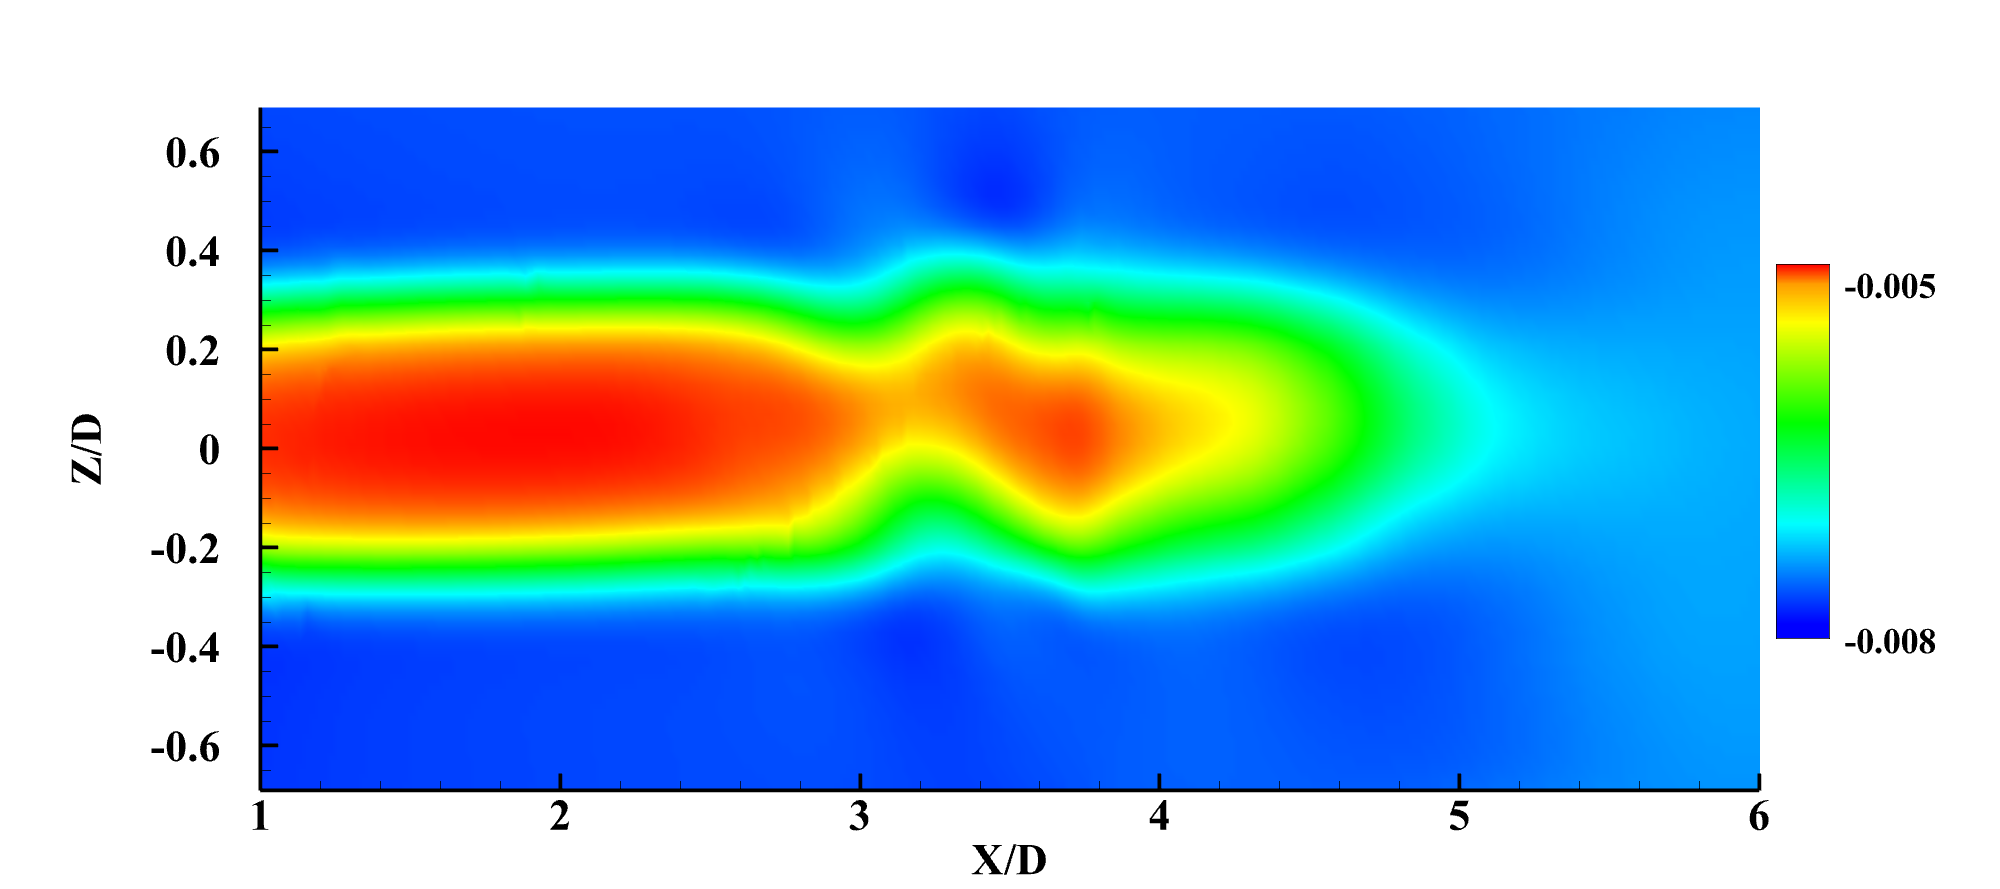
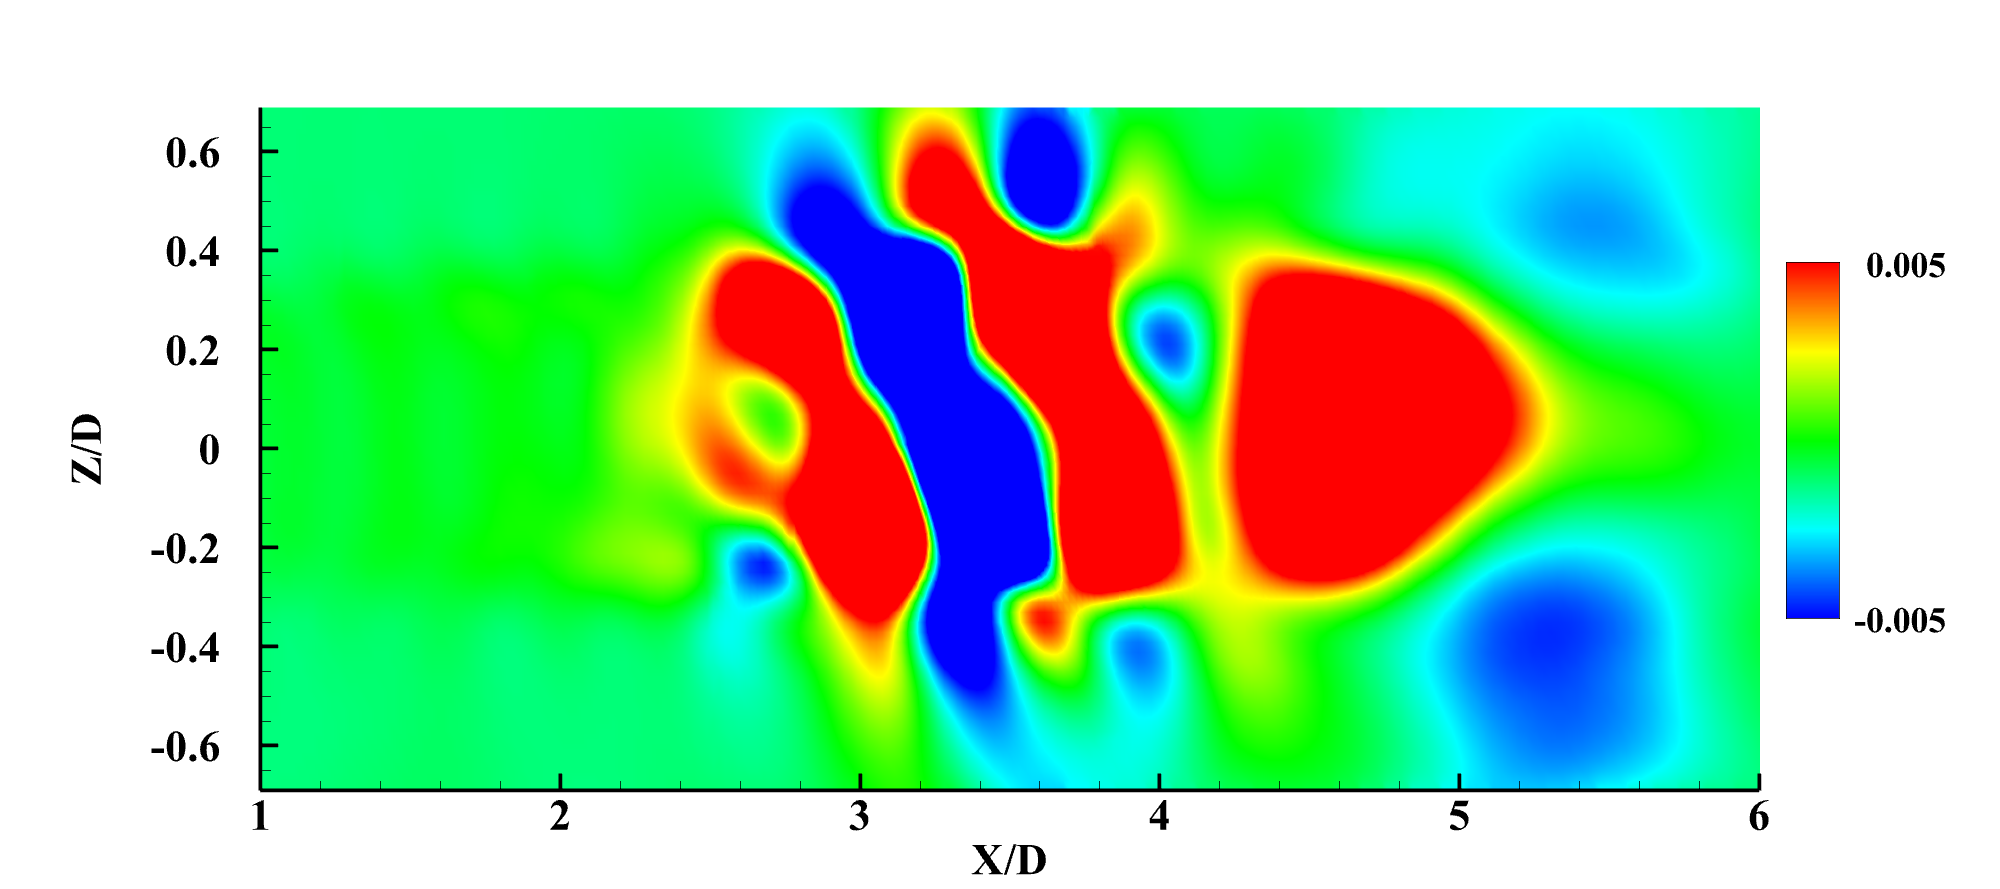
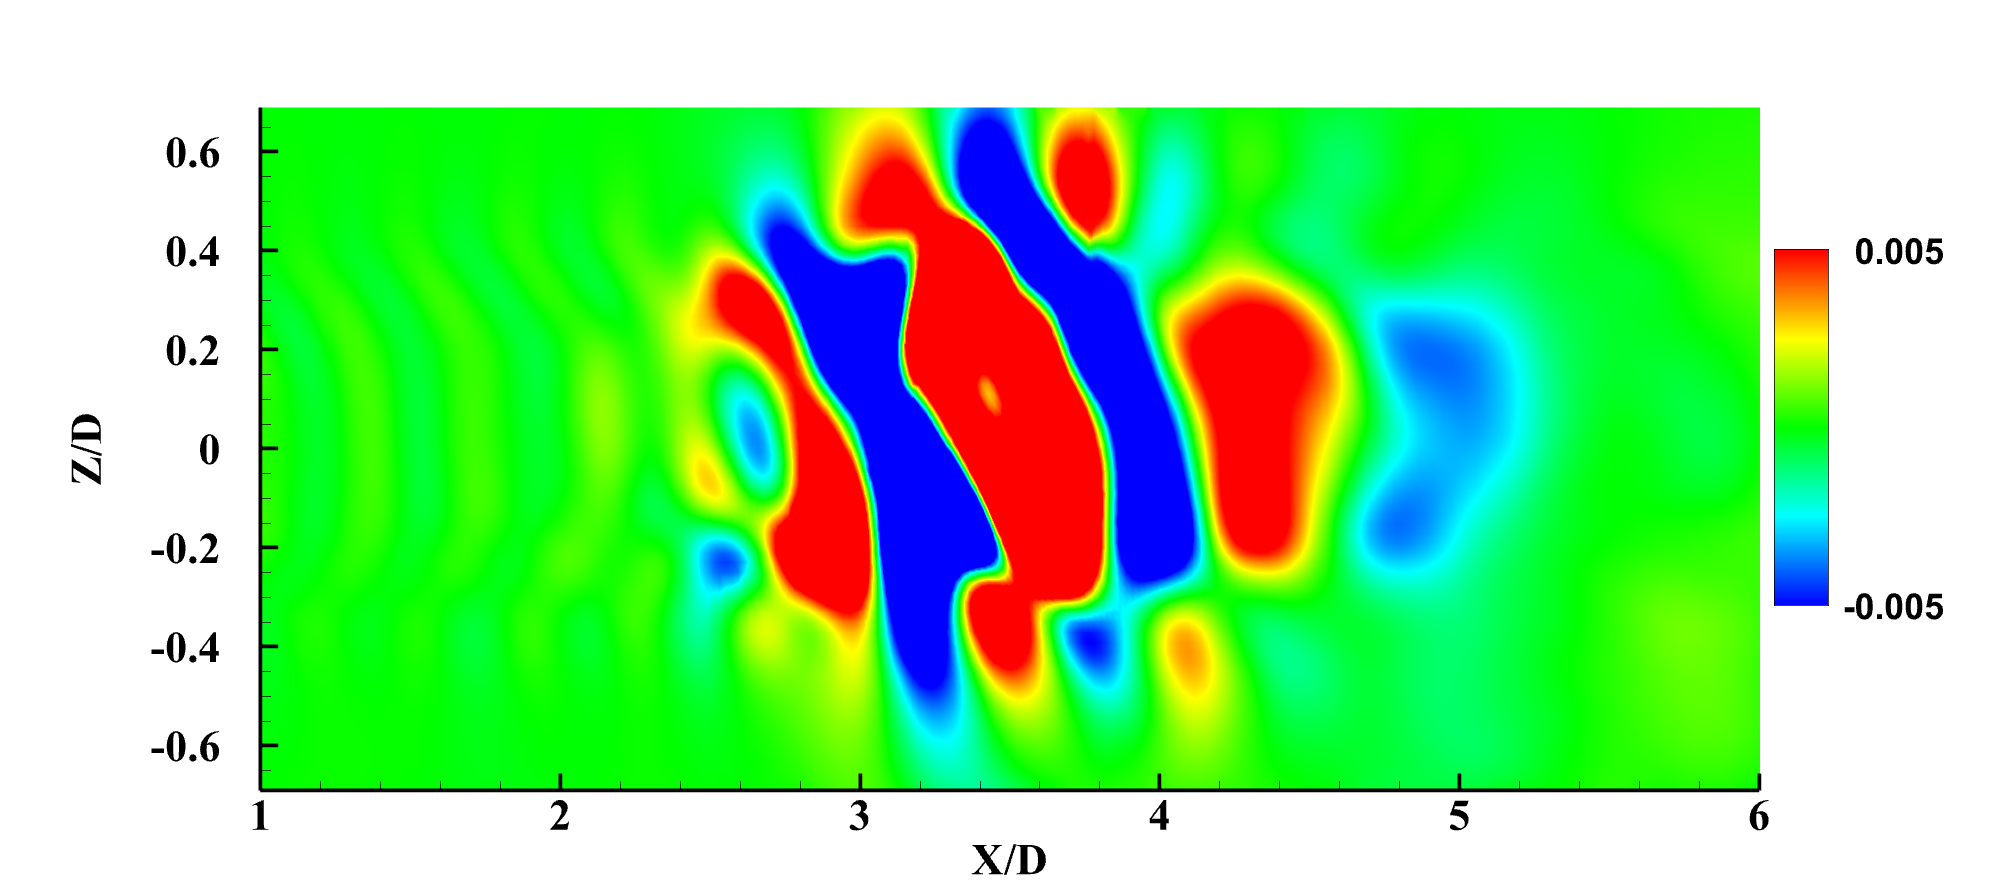
In order to gain a deeper understanding of the wake, the accumulative energy and the POD modes of the streamwise component of velocity in the cross-wind and streamwise planes both on the blade’s tip have been presented in Fig. 16. First of all, it is evident in the figure that the accumulative energy of both planes demonstrates quite similar trends and values proving that with three modes almost all the dominant flow structures could be extracted. In this regard, the wake behaviour has been deeply investigated on the streamwise (ZX) planes at the blade tip, nacelle and the tower depicted in Fig.17, Fig.18 and Fig.19, respectively.
As seen, the first mode in all the planes corresponds to the area affected by the presence of the body responsible for the energy extraction as also reported in Sheidani et al. (2023c). However, as shown in Fig.17(a), Fig.18(a) and Fig.19(a) that near the blade tip, the wake region is much more uniform compared to the other two planes located at a lower altitude for the first mode. This observation proves that despite the highest deflection which is experienced at the tip in flexible blades, the adversarial effect of the nacelle and tower is yet significantly more noticeable. In addition, the first mode for the plane at the blade tip and the tower bear a closer resemblance with respect to that of the nacelle. As a result, the nacelle is expected to leave more remarkable traces in the wake compared to other parts of the wind turbine. Also, the wake region on the blade tip plane appears to be far more uniform than the planes corresponding to cross sections of lower aerodynamic efficiency i.e. nacelle and tower are.
This finding could be better understood by moving on to the next modes. For instance, the trend in the second modes for all the cross sections in spanwise planes shown in Fig.17(b), Fig.18(b) and Fig.19(b) reveals that the dominant structures correspond to the entrainment stemming from the wake region collapse Sheidani et al. (2023d). However, considering the cross sections of lower aerodynamic efficiencies i.e. at the tower and nacelle, other structures emanating from the flow separation in congruous with sources of performance loss are observed. To illustrate, the second mode at the tower plane demonstrates typical structures in the wake of a cylinder (Noack et al., 2016) insinuating the importance of the tower on the wake and its modal behaviour. Furthermore, regarding the second mode on the nacelle plane, the structures related to the vortex shedding from the nacelle geometry are analogous to that of the tower plane, nonetheless, at a lower intensity. In this regard, the flow structures of the second mode at the blade tip plane are mainly concentrated around the wake region collapse indicating the higher performance of the tip section as the structures due to the flow separation being of the same modal energy of the expected dominant structure i.e. wake region collapse is not observed. Therefore, considering the effect of flexibility of the blades does not cause the hindrance against the power production by the blade to overweight that of the nacelle and tower.
Presented Fig.17(c), Fig.18(c) and Fig.19(c) demonstrate the third POD modes for the blade tip, nacelle and tower sections respectively. The decay of the structures observed previously in the second mode could be observed in all three planes. The third mode for the blade tip and the nacelle show similar symmetrical structures near the wake region borders which are more pronounced near the tip. These structures come into existence due to the velocity difference between the wake region and the area beyond it as explained in (Sheidani et al., 2023c, d). However, the third mode of the tower plane, as seen in Fig.19(c), shows the structures to be mostly concentrated near the central part of the wake region. Therefore, as expected, the section with the lowest efficiency cannot bring about a considerable velocity gradient between the wake and the far-field regions. It should be noted that, as for the nacelle and tower planes modes, the decay of the structures emanating from the nacelle is still observed, while the flow structures at the blade tip are more pronounced near the wake region collapse proving the higher efficiency of this section.
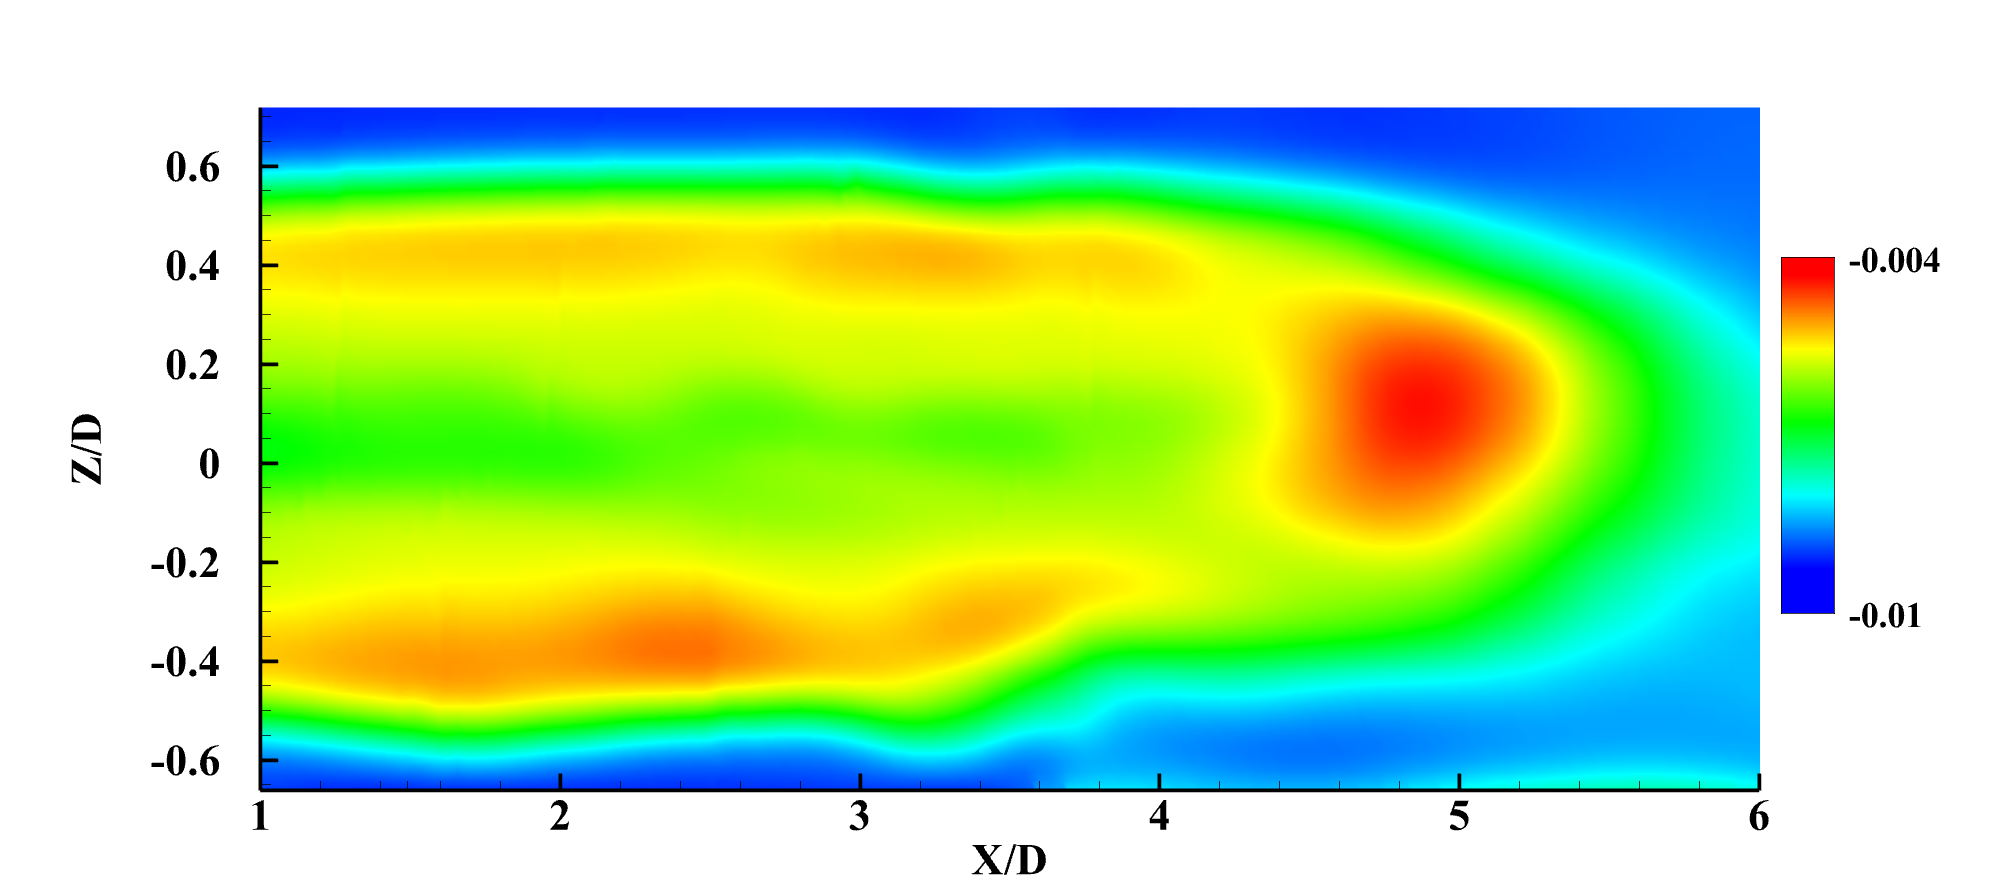
Fig.20 and Fig.21 display the spatial POD modes on the crosswind plane, illustrating the potential interactions and phenomena on the wake region. It is important to highlight that two distinct planes are used for evaluation; one intersecting with the nacelle, called the near plane, and the other positioned farther from the nacelle at , referred to as the far plane. This allows for separate assessments of their effects on the wake.
Beginning with the first mode on the near plane presented in Fig.20(a), it is evident that the modal behaviour is quite similar to that of the spanwise plane at the nacelle rather than the tower plane. However, the first POD mode at the far plane exhibits a greater resemblance with the tower plane. This proves that the effect of the nacelle on the wake could be regarded as even more influential than the tower. The significant discrepancies between the modal behaviour of the spanwise and the streamwise planes begin after the second mode shown in g.20(b) and Fig.21(b). To illustrate, the second mode of both near and far planes, despite the presence of similar structures especially, near the point of wake region collapse, the streamwise plane suggests more structures emanating mostly from the tower. Therefore, it is found that the effects of the tower on the wake region could be taken into consideration after the second mode in the near plane, specifically.
The third mode, while sustaining the main trend, shows the decay of the structure observed in the previous mode as expected Sheidani et al. (2023c). Nonetheless, the far and near planes reveal a fundamental difference regarding the behaviour of the third mode. As seen in Fig.21(c), the main structures on the far plane are mainly concentrated around four to five times the wind turbine diameter illustrating the effect of wake region collapse. On the other hand, the third mode on the near plane demonstrates other structures than those corresponding to the decay of the second mode near the wake region. First of all, the vortex shedding of the nacelle around the centre line is evident in Fig.20(c) which is obviously absent on the far plane due to its distant position from the nacelle.
Moreover, the symmetrical structures near the boundaries of the wake region are observed on the near which is yet another remarkable difference between the far and near plane’s third modes. It is observed in Fig.20(c) that the presence of the symmetrical structures is more pronounced on the lower part of the part of the wake region. This is attributed to the fact that the lower part is prone to the flow structures ensuing from the presence of the tower, while the upper part of the wake region is not exposed to a significant source of vortex shedding upstream. As a result, the symmetrical structures on the lower part are intensified resulting in an asymmetrical wake region shape on the near plane.
IV Conclusion
To analyse the wake behaviour behind a full-scale onshore HAWT a fully coupled two-way FSI simulation has been implemented. The proper orthogonal decomposition has been applied in this matter to extract spatial and temporal modes along with modal energy at the wake region. Results indicate a similar modal behaviour for the rigid and flexible turbines at the wake region which implies the negligible effect of the blade deformation on the wake characteristics. Also, the main source of this deviation is the harmonic nature of the blade deformation through each rotation cycle.
By observing the wake characteristics at streamwise planes behind the turbine, it was concluded that the value of accumulative energy of the first mode (convective mode) decreases as getting further from the turbine. As a consequence, more flow structures in terms of local vortices and fluctuating velocity fields exist at the furthest plane. The flow structures due to the wake shed from the tower tend to move towards the center and merge with that of the nacelle leading to an integral vortical structure 2.5D away from the rotor. In addition, the symmetrical shape of the first mode starts to fade away with the increase in the distance from the rotor proving that while the work extraction is the main characteristic of the planes near the rotor, the effects of wake shed and tip vortices rise into importance in the farther planes. Also, it is concluded that the exclusion of the tower leads to missing a major part of the wake structures, especially at far wake positions.
In summary, the main findings of the paper can be listed as follows:
-
•
A similar modal behaviour was observed for the rigid and flexible wind turbines indicating the negligible effect of the blades’ flexibility on the wake characteristics behind the HAWT,
-
•
Value of the first mode (convective mode) decreased as getting farther in the wake region,
-
•
The effect of tip vortices caused the elimination of the symmetrical behaviour of the first mode of velocity in locations more than 2D of the rotor,
-
•
The necessity of inclusion of the tower in the simulation especially in case of examination of the far wake region.
-
•
The flexibility of the blades does not still affect the wake as much as the tower and nacelle do.
-
•
The modes on the streamwise plane demonstrate different behaviours on the near and the far planes.
-
•
It was proven that up to the second the mode the near and far planes show a modal behavior analogous to that of the nacelle and tower on the spanwise plane respectively.
Nomenclature
| C | Damping Coefficient [] |
|---|---|
| d | Structural Displacement [] |
| d | Stiffness Coefficient [] |
| F | Force Vector [] |
| M | Mass Tensor [] |
| U | Velocity Vector [] |
| P | Pressure [] |
| S | Strain Rate Tensor [] |
| t | Time [] |
| v | Node Velocity of Interface [] |
| Density [] | |
| Dynamic Viscosity [] | |
| Normal Vector of Interface | |
| Traction Forces [] | |
| Left Eigenvector | |
| Right Eigenvector | |
| Eigenvectors | |
| Pre-cone Angle [] | |
| Azimuth Angle [] |
References
- Alkhabbaz et al. (2022) A. Alkhabbaz, H.-S. Yang, W. Tongphong, and Y.-H. Lee, “Impact of compact diffuser shroud on wind turbine aerodynamic performance: CFD and experimental investigations,” International Journal of Mechanical Sciences 216, 106978 (2022).
- Siddiqui et al. (2022) M. S. Siddiqui, M. H. Khalid, A. W. Badar, M. Saeed, and T. Asim, “Parametric analysis using CFD to study the impact of geometric and numerical modeling on the performance of a small scale horizontal axis wind turbine,” Energies 15, 505 (2022).
- Bajuri et al. (2022) M. N. A. Bajuri, D. H. Didane, M. I. Boukhari, and B. Manshoor, “Computational fluid dynamics (CFD) analysis of different sizes of savonius rotor wind turbine,” Journal of Advanced Research in Applied Mechanics 94, 7–12 (2022).
- Spyropoulos et al. (2022) N. Spyropoulos, G. Papadakis, J. M. Prospathopoulos, and V. A. Riziotis, “Assessment of a hybrid eulerian–lagrangian CFD solver for wind turbine applications and comparison with the new mexico experiment,” Fluids 7, 296 (2022).
- Majidi Nezhad et al. (2022) M. Majidi Nezhad, M. Neshat, G. Piras, and D. Astiaso Garcia, “Sites exploring prioritisation of offshore wind energy potential and mapping for wind farms installation: Iranian islands case studies,” Renewable and Sustainable Energy Reviews 168, 112791 (2022).
- Zhang et al. (2020) S. Zhang, J. Wei, X. Chen, and Y. Zhao, “China in global wind power development: Role, status and impact,” Renewable and Sustainable Energy Reviews 127, 109881 (2020).
- Moghaddam et al. (2011) N. B. Moghaddam, S. M. Mousavi, M. Nasiri, E. A. Moallemi, and H. Yousefdehi, “Wind energy status of iran: Evaluating iran’s technological capability in manufacturing wind turbines,” Renewable and Sustainable Energy Reviews 15, 4200–4211 (2011).
- Uchida et al. (2021) T. Uchida, T. Yoshida, M. Inui, and Y. Taniyama, “Doppler lidar investigations of wind turbine near-wakes and les modeling with new porous disc approach,” Energies 14, 2101 (2021).
- Bastankhah and Portagel (2019) M. Bastankhah and F. Portagel, “Wind farm power optimization via yaw angle control: A wind tunnel study,” Journal of Renewable and Sustainable Energy 11 (2019).
- Jaiswal et al. (2022) K. K. Jaiswal, C. R. Chowdhury, D. Yadav, R. Verma, S. Dutta, K. S. Jaiswal, SangmeshB, and K. S. K. Karuppasamy, “Renewable and sustainable clean energy development and impact on social, economic, and environmental health,” Energy Nexus 7, 100118 (2022).
- Regodeseves and Morros (2021) P. G. Regodeseves and C. S. Morros, “Numerical study on the aerodynamics of an experimental wind turbine: Influence of nacelle and tower on the blades and near-wake,” Energy Conversion and Management 237, 114110 (2021).
- Uchida and Gagnon (2022) T. Uchida and Y. Gagnon, “Effects of continuously changing inlet wind direction on near-to-far wake characteristics behind wind turbines over flat terrain,” Journal of Wind Engineering and Industrial Aerodynamics 220, 104869 (2022).
- Kabir and Ng (2019) I. F. S. A. Kabir and E. Ng, “Effect of different atmospheric boundary layers on the wake characteristics of NREL phase VI wind turbine,” Renewable energy 130, 1185–1197 (2019).
- Kabir et al. (2020) I. F. S. A. Kabir, F. Safiyullah, E. Ng, and v. W. Tam, “New analytical wake models based on artificial intelligence and rivalling the benchmark full-rotor CFD predictions under both uniform and abl inflows,” Energy 193, 116761 (2020).
- Purohit, Kabir, and Ng (2021) S. Purohit, I. F. S. A. Kabir, and E. Ng, “On the accuracy of urans and les-based CFD modeling approaches for rotor and wake aerodynamics of the (new) mexico wind turbine rotor phase-iii,” Energies 14, 5198 (2021).
- Zhang and Kim (2018) Y. Zhang and B. Kim, “A fully coupled computational fluid dynamics method for analysis of semi-submersible floating offshore wind turbines under wind-wave excitation conditions based on oc5 data,” Applied sciences 8, 2314 (2018).
- Liu et al. (2019) Y. Liu, Q. Xiao, A. Incecik, and C. Peyrard, “Aeroelastic analysis of a floating offshore wind turbine in platform-induced surge motion using a fully coupled CFD-mbd method,” Wind Energy 22, 1–20 (2019).
- Tarfaoui, Nachtane, and Boudounit (2020) M. Tarfaoui, M. Nachtane, and H. Boudounit, “Finite element analysis of composite offshore wind turbine blades under operating conditions,” Journal of Thermal Science and Engineering Applications 12 (2020).
- Liu et al. (2022) J. Liu, P. Liu, J. Leng, and C. Wang, “Finite element analysis of damage mechanisms of composite wind turbine blade by considering fluid/solid interaction. part i: full-scale structure,” Composite Structures , 116212 (2022).
- Hand, Kelly, and Cashman (2021) B. Hand, G. Kelly, and A. Cashman, “Structural analysis of an offshore vertical axis wind turbine composite blade experiencing an extreme wind load,” Marine Structures 75, 102858 (2021).
- Sathish (2021) T. Sathish, “Fluid flow analysis of composite material-based wind turbine blades using ansys,” International Journal of Ambient Energy 42, 1396–1399 (2021).
- Lumley (1967) J. L. Lumley, “The structure of inhomogeneous turbulent flows,” Atmospheric turbulence and radio wave propagation , 166–178 (1967).
- Sirovich (1987) L. Sirovich, “Turbulence and the dynamics of coherent structures. II. symmetries and transformations,” Quarterly of Applied Mathematics 45, 573–582 (1987).
- Sheidani et al. (2023a) A. Sheidani, S. Salavatidezfouli, G. Stabile, and G. Rozza, “Assessment of URANS and LES methods in predicting wake shed behind a vertical axis wind turbine,” Journal of Wind Engineering and Industrial Aerodynamics 232, 105285 (2023a).
- Lassila et al. (2014) T. Lassila, A. Manzoni, A. Quarteroni, and G. Rozza, “Model order reduction in fluid dynamics: challenges and perspectives,” Reduced Order Methods for modeling and computational reduction , 235–273 (2014).
- Verveld and Kier (2017) M. J. Verveld and T. M. Kier, “A reduced order model of corrected aerodynamic influence coefficients for aircraft loads analysis,” in 58th AIAA/ASCE/AHS/ASC Structures, Structural Dynamics, and Materials Conference (American Institute of Aeronautics and Astronautics, 2017).
- Štefan et al. (2017) D. Štefan, P. Rudolf, S. Muntean, and R. Susan-Resiga, “Proper orthogonal decomposition of self-induced instabilities in cecelerated swirling flows and their mitigation through axial water injection,” Journal of Fluids Engineering 139 (2017), 10.1115/1.4036244.
- Sinha, Chauhan, and Balasubramanian (2018) A. Sinha, R. Chauhan, and S. Balasubramanian, “Characterization of a superheated water jet released into water using proper orthogonal decomposition method,” Journal of Fluids Engineering 140 (2018), 10.1115/1.4039521.
- Wang, Ma, and Liu (2018) P. Wang, H. Ma, and Y. Liu, “Unsteady behaviors of steam flow in a control valve with t-junction discharge under the choked condition: Detached eddy simulation and proper orthogonal decomposition,” Journal of Fluids Engineering 140 (2018), 10.1115/1.4039254.
- Chouak, Dufresne, and Seers (2018) M. Chouak, L. Dufresne, and P. Seers, “Single orifice diesel injector flow characterization and the impact of needle lift using large eddy simulation and proper orthogonal decomposition,” Journal of Fluids Engineering 141 (2018), 10.1115/1.4041642.
- Benner et al. (2021) P. Benner, S. Grivet-Talocia, A. Quarteroni, G. Rozza, W. Schilders, and L. M. Silveira, System-and Data-Driven Methods and Algorithms (De Gruyter, 2021).
- Benner et al. (2020a) P. Benner, W. Schilders, S. Grivet-Talocia, A. Quarteroni, G. Rozza, and L. Miguel Silveira, Model Order Reduction: Volume 2: Snapshot-Based Methods and Algorithms (De Gruyter, 2020).
- Benner et al. (2020b) P. Benner, W. Schilders, S. Grivet-Talocia, A. Quarteroni, G. Rozza, and L. Miguel Silveira, Model order reduction: volume 3 applications (De Gruyter, 2020).
- Star et al. (2021) K. Star, G. Stabile, G. Rozza, and J. Degroote, “A POD-Galerkin reduced order model of a turbulent convective buoyant flow of sodium over a backward-facing step,” Applied Mathematical Modelling 89, 486 – 503 (2021), arXiv:2003.01114 [physics.flu-dyn] .
- Barra et al. (2021) P. Barra, W. de Carvalho, T. Menezes, R. Fernandes, and D. Coury, “A review on wind power smoothing using high-power energy storage systems,” Renewable and Sustainable Energy Reviews 137, 110455 (2021).
- Premaratne, Tian, and Hu (2022) P. Premaratne, W. Tian, and H. Hu, “A proper-orthogonal-decomposition (POD) study of the wake characteristics behind a wind turbine model,” Energies 15, 3596 (2022).
- Khosravi, Sarkar, and Hu (2016) M. Khosravi, P. Sarkar, and H. Hu, “An experimental investigation on the near wake characteristics of a darrious vertical-axis wind turbine,” in 34th Wind Energy Symposium (American Institute of Aeronautics and Astronautics, 2016).
- Fontanella et al. (2021) A. Fontanella, I. Bayati, R. Mikkelsen, M. Belloli, and A. Zasso, “UNAFLOW: a holistic wind tunnel experiment about the aerodynamic response of floating wind turbines under imposed surge motion,” Wind Energy Science 6, 1169–1190 (2021).
- Mancini et al. (2020) S. Mancini, K. Boorsma, M. Caboni, M. Cormier, T. Lutz, P. Schito, and A. Zasso, “Characterization of the unsteady aerodynamic response of a floating offshore wind turbine to surge motion,” Wind Energy Science 5, 1713–1730 (2020).
- Madsen et al. (2020) F. Madsen, T. Nielsen, T. Kim, H. Bredmose, A. Pegalajar-Jurado, R. Mikkelsen, A. Lomholt, M. Borg, M. Mirzaei, and P. Shin, “Experimental analysis of the scaled DTU10MW TLP floating wind turbine with different control strategies,” Renewable Energy 155, 330–346 (2020).
- Tran and Kim (2018) T. T. Tran and D.-H. Kim, “A CFD study of coupled aerodynamic-hydrodynamic loads on a semisubmersible floating offshore wind turbine,” Wind Energy 21, 70–85 (2018).
- Deng, Xiao, and Yang (2020) Z. Deng, Q. Xiao, and L. Yang, “Investigating structural behavior of wind turbine composite blade using fsi method,” in 7th PRIMaRE Conference (2020).
- Rafiee, Tahani, and Moradi (2016) R. Rafiee, M. Tahani, and M. Moradi, “Simulation of aeroelastic behavior in a composite wind turbine blade,” Journal of Wind Engineering and Industrial Aerodynamics 151, 60–69 (2016).
- Prowell, Elgamal, and Jonkman (2010) I. Prowell, A.-W. M. Elgamal, and J. M. Jonkman, FAST simulation of wind turbine seismic response (National Renewable Energy Laboratory Golden, CO, USA, 2010).
- Borouji and Nishino (2019) E. Borouji and T. Nishino, “Fluid structure interaction simulations of the NREL 5 MW wind turbine—part i: Aerodynamics and blockage effect,” Journal of Offshore Mechanics and Arctic Engineering 141 (2019).
- Yu et al. (2020) Z. Yu, Z. Hu, X. Zheng, Q. Ma, and H. Hao, “Aeroelastic performance analysis of wind turbine in the wake with a new elastic actuator line model,” Water 12, 1233 (2020).
- Tran and Kim (2016) T. T. Tran and D.-H. Kim, “A CFD study into the influence of unsteady aerodynamic interference on wind turbine surge motion,” Renewable Energy 90, 204–228 (2016).
- Mo et al. (2015) W. Mo, D. Li, X. Wang, and C. Zhong, “Aeroelastic coupling analysis of the flexible blade of a wind turbine,” Energy 89, 1001–1009 (2015).
- Rajan and Ponta (2018) A. Rajan and F. L. Ponta, “Aeroelastic analysis of the 3-dimensional interference patterns of wind-turbine rotors: The 3-d DRD-BEM model,” Renewable Energy Focus 26, 22–38 (2018).
- Sayed et al. (2019) M. Sayed, T. Lutz, E. Krämer, S. Shayegan, and R. Wüchner, “Aeroelastic analysis of 10 MW wind turbine using CFD–CSD explicit FSI-coupling approach,” Journal of Fluids and Structures 87, 354–377 (2019).
- Badshah, Badshah, and Kadir (2018) M. Badshah, S. Badshah, and K. Kadir, “Fluid structure interaction modelling of tidal turbine performance and structural loads in a velocity shear environment,” Energies 11, 1837 (2018).
- Sheidani et al. (2023b) A. Sheidani, S. Salavatidezfouli, G. Stabile, and G. Rozza, “Assessment of urans and les methods in predicting wake shed behind a vertical axis wind turbine,” Journal of Wind Engineering and Industrial Aerodynamics 232, 105285 (2023b).
- Dose et al. (2020) B. Dose, H. Rahimi, B. Stoevesandt, and J. Peinke, “Fluid-structure coupled investigations of the NREL 5 MW wind turbine for two downwind configurations,” Renewable Energy 146, 1113–1123 (2020).
- Dose et al. (2018) B. Dose, H. Rahimi, I. Herráez, B. Stoevesandt, and J. Peinke, “Fluid-structure coupled computations of the NREL 5 MW wind turbine by means of CFD,” Renewable energy 129, 591–605 (2018).
- Safari, Saffar-Avval, and Amani (2018) A. Safari, M. Saffar-Avval, and E. Amani, “Numerical investigation of turbulent forced convection flow of nano fluid in curved and helical pipe using four-equation model,” Powder Technology 328, 47–53 (2018).
- Muiruri, Motsamai, and Ndeda (2019) P. I. Muiruri, O. S. Motsamai, and R. Ndeda, “A comparative study of rans-based turbulence models for an upscale wind turbine blade,” SN Applied Sciences 1, 1–15 (2019).
- Pinto, Franzini, and Simos (2020) M. L. Pinto, G. R. Franzini, and A. N. Simos, “A CFD analysis of NREL’s 5MW wind turbine in full and model scales,” Journal of Ocean Engineering and Marine Energy 6, 211–220 (2020).
- Cai et al. (2022) Y. Cai, H. Zhao, X. Li, and Y. Liu, “Effects of yawed inflow and blade-tower interaction on the aerodynamic and wake characteristics of a horizontal-axis wind turbine,” Energy , 126246 (2022).
- Moussa (2020) M. O. Moussa, “Experimental and numerical performances analysis of a small three blades wind turbine,” Energy 203, 117807 (2020).
- Marzec, Buliński, and Krysiński (2021) Ł. Marzec, Z. Buliński, and T. Krysiński, “Fluid structure interaction analysis of the operating savonius wind turbine,” Renewable Energy 164, 272–284 (2021).
- Bao and Chen (2021) J. Bao and Z.-S. Chen, “Vortex-induced vibration characteristics of multi-mode and spanwise waveform about flexible pipe subject to shear flow,” International Journal of Naval Architecture and Ocean Engineering 13, 163–177 (2021).
- Idelsohn et al. (2009) S. R. Idelsohn, F. Del Pin, R. Rossi, and E. Oñate, “Fluid–structure interaction problems with strong added-mass effect,” International journal for numerical methods in engineering 80, 1261–1294 (2009).
- Kassiotis, Ibrahimbegovic, and Matthies (2010) C. Kassiotis, A. Ibrahimbegovic, and H. Matthies, “Partitioned solution to fluid–structure interaction problem in application to free-surface flows,” European Journal of Mechanics-B/Fluids 29, 510–521 (2010).
- Stabile, Matthies, and Borri (2018) G. Stabile, H. G. Matthies, and C. Borri, “A novel reduced order model for vortex induced vibrations of long flexible cylinders,” Ocean Engineering 156, 191–207 (2018), arXiv:1802.09241v1 .
- Fernández, Gerbeau, and Grandmont (2007) M. A. Fernández, J.-F. Gerbeau, and C. Grandmont, “A projection semi-implicit scheme for the coupling of an elastic structure with an incompressible fluid,” International Journal for Numerical Methods in Engineering 69, 794–821 (2007).
- van Brummelen (2009) E. H. van Brummelen, “Added mass effects of compressible and incompressible flows in fluid-structure interaction,” Journal of Applied Mechanics (2009).
- Nordenström (2022) S. Nordenström, Fluid-Structure Interaction Analysis of Carotid Artery Blood Flow. A Patient-Specific Investigation of the Impact of Arterial Wall Deformation on Hemodynamics., Master’s thesis, CHALMERS UNIVERSITY OF TECHNOLOGY (2022).
- Küttler and Wall (2008) U. Küttler and W. A. Wall, “Fixed-point fluid–structure interaction solvers with dynamic relaxation,” Computational mechanics 43, 61–72 (2008).
- Coulling et al. (2013) A. J. Coulling, A. J. Goupee, A. N. Robertson, J. M. Jonkman, and H. J. Dagher, “Validation of a fast semi-submersible floating wind turbine numerical model with deepcwind test data,” Journal of Renewable and Sustainable Energy 5, 023116 (2013).
- Jonkman et al. (2009) J. Jonkman, S. Butterfield, W. Musial, and G. Scott, “Definition of a 5-MW reference wind turbine for offshore system development,” Tech. Rep. (National Renewable Energy Lab.(NREL), Golden, CO (United States), 2009).
- Asareh and Volz (2013) M.-A. Asareh and J. S. Volz, “Evaluation of aerodynamic and seismic coupling for wind turbines using finite element approach,” in ASME International Mechanical Engineering Congress and Exposition, Vol. 56253 (American Society of Mechanical Engineers, 2013) p. V04BT04A041.
- Wang, Cao, and Okaze (2021) W. Wang, Y. Cao, and T. Okaze, “Comparison of hexahedral, tetrahedral and polyhedral cells for reproducing the wind field around an isolated building by les,” Building and Environment 195, 107717 (2021).
- Li et al. (2013) C. Li, S. Zhu, Y. lin Xu, and Y. Xiao, “2.5d large eddy simulation of vertical axis wind turbine in consideration of high angle of attack flow,” Renewable Energy 51, 317–330 (2013).
- Taira et al. (2017) K. Taira, S. L. Brunton, S. T. M. Dawson, C. W. Rowley, T. Colonius, B. J. McKeon, O. T. Schmidt, S. Gordeyev, V. Theofilis, and L. S. Ukeiley, “Modal analysis of fluid flows: An overview,” AIAA Journal 55, 4013–4041 (2017).
- Lengani et al. (2014) D. Lengani, D. Simoni, M. Ubaldi, and P. Zunino, “POD analysis of the unsteady behavior of a laminar separation bubble,” Experimental Thermal and Fluid Science 58, 70–79 (2014).
- Siddiqui et al. (2017) M. S. Siddiqui, A. Rasheed, T. Kvamsdal, and M. Tabib, “Quasi-static & dynamic numerical modeling of full scale NREL 5MW wind turbine,” Energy Procedia 137, 460–467 (2017).
- Lillahulhaq and Djanali (2019) Z. Lillahulhaq and v. S. Djanali, “Numerical study of savonius wind turbine with fluid-rotor interactions,” IPTEK Journal of Proceedings Series , 48–52 (2019).
- Sabale and Gopal (2019) A. K. Sabale and N. K. Gopal, “Nonlinear aeroelastic analysis of large wind turbines under turbulent wind conditions,” AIAA journal 57, 4416–4432 (2019).
- Yu and Kwon (2014) D. O. Yu and O. J. Kwon, “Predicting wind turbine blade loads and aeroelastic response using a coupled CFD–csd method,” Renewable Energy 70, 184–196 (2014).
- Ponta et al. (2016) F. L. Ponta, A. D. Otero, L. I. Lago, and A. Rajan, “Effects of rotor deformation in wind-turbine performance: The dynamic rotor deformation blade element momentum model (drd–bem),” Renewable Energy 92, 157–170 (2016).
- Li et al. (2020) Z. Li, B. Wen, X. Dong, Z. Peng, Y. Qu, and W. Zhang, “Aerodynamic and aeroelastic characteristics of flexible wind turbine blades under periodic unsteady inflows,” Journal of Wind Engineering and Industrial Aerodynamics 197, 104057 (2020).
- De Cillis et al. (2021) G. De Cillis, S. Cherubini, O. Semeraro, S. Leonardi, and P. De Palma, “POD-based analysis of a wind turbine wake under the influence of tower and nacelle,” Wind Energy 24, 609–633 (2021).
- Iungo et al. (2015) G. V. Iungo, C. Santoni-Ortiz, M. Abkar, F. Porté-Agel, M. A. Rotea, and S. Leonardi, “Data-driven reduced order model for prediction of wind turbine wakes,” in Journal of Physics: Conference Series, Vol. 625 (IOP Publishing, 2015) p. 012009.
- Bastine et al. (2014) D. Bastine, B. Witha, M. Wächter, and J. Peinke, “Pod analysis of a wind turbine wake in a turbulent atmospheric boundary layer,” in Journal of physics: conference series, Vol. 524 (IOP Publishing, 2014) p. 012153.
- Andersen, Sørensen, and Mikkelsen (2014) S. J. Andersen, J. N. Sørensen, and R. Mikkelsen, “Reduced order model of the inherent turbulence of wind turbine wakes inside an infinitely long row of turbines,” in Journal of Physics: Conference Series, Vol. 555 (IOP Publishing, 2014) p. 012005.
- Wang et al. (2012) Q. Wang, Z. Wang, J. Song, Y. Xu, and J. Xu, “Study on a new aerodynamic model of hawt based on panel method and reduced order model using proper orthogonal decomposition,” Renewable energy 48, 436–447 (2012).
- Sheidani et al. (2023c) A. Sheidani, S. Salavatidezfouli, G. Stabile, and G. Rozza, “Assessment of urans and les methods in predicting wake shed behind a vertical axis wind turbine,” Journal of Wind Engineering and Industrial Aerodynamics 232, 105285 (2023c).
- Sheidani et al. (2023d) A. Sheidani, S. Salavatidezfouli, G. Stabile, M. Barzegar Gerdroodbary, and G. Rozza, “Assessment of icing effects on the wake shed behind a vertical axis wind turbine,” Physics of Fluids 35 (2023d).
- Noack et al. (2016) B. R. Noack, W. Stankiewicz, M. Morzyński, and P. J. Schmid, “Recursive dynamic mode decomposition of transient and post-transient wake flows,” Journal of Fluid Mechanics 809, 843–872 (2016).