Multi–Point Method using Effective Demodulation and Decomposition Techniques allowing Identification of Disturbing Loads in Power Grids
Abstract
The paper presents an innovative approach to the identification of sources of voltage fluctuations in power networks, also considering the localization understood as the indication of supply points of disturbing loads. The presented approach considers disturbance sources that change their operating state with a frequency higher than the power frequency. Implementation of the proposed solution is also proposed in such a way that its implementation in the smart meter infrastructure allows for automatic localization of disturbance sources without additional expert knowledge. In the proposed approach, the modulation signal is estimated using a carrier signal estimator, which allows for the estimation of modulation signal with a frequency higher than the power frequency. The estimated modulating signal is decomposed into component signals associated with individual disturbing loads by decomposition by approximation using pulse waves. The decomposition process allows for the estimation of selected parameters associated with disturbing loads, on the basis of which the assessment of propagation of voltage fluctuations associated with the impact of individual disturbance sources is performed, which allows for the indication of their supply point. The proposed approach was verified in numerical simulation studies using MATLAB/SIMULINK and in experimental studies carried out in a real low–voltage power grid.
Index Terms:
decomposition, demodulation, disturbing loads, flicker, identification, localization, power quality, voltage fluctuation, voltage variation.Nomenclature
-
Estimated amplitudes of –th modulating signal component in period of discrimination (contribution of the –th disturbing load to the resultant voltage fluctuations).
- AM
-
Amplitude modulation.
- AP
-
Active probe.
- DAPW
-
Decomposition by approximation with pulse waves.
-
Accuracy metric determining the effectiveness of the correct indication of the supply point of the disturbance source.
-
Accuracy metric determining the effectiveness of the correct estimation of the frequency of changes in the operating state of the disturbance source.
- EEWT
-
Enhanced empirical wavelet transform.
-
Power frequency (50 or 60) - nominal voltage frequency (carrier frequency).
-
Estimated fundamental frequency of –th modulating signal component in period of discrimination.
-
Distance from power station.
-
Distance of –th supply point from power station.
-
Inductance of –th section of power line.
- LV
-
Low–voltage.
- M1
-
Method based on the assessment of voltage fluctuation propagation using non–parametric statistical assessment of voltage fluctuation indices without additional expert knowledge.
- M2
-
Method based on the evaluation of flicker propagation.
- M3
-
Method based on the decomposition using enhanced empirical wavelet transform.
- MV
-
Medium–voltage.
-
Number of voltage modulating signal components obtained using DAPW (number of significant disturbing loads).
-
Number of correctly identified frequencies of changes in the operating state of individual disturbing loads.
-
Number of correctly indicated supply points (localized) disturbing loads.
-
–th supply point of loads in the power grid.
-
Long–term flicker indicator.
-
Short–term flicker indicator.
-
Active power of individual sources of disturbance –th supply point of loads in the power grid.
- PA
-
Proposed Approach.
-
Resistance.
-
Resistance of –th section of power line.
- SSR
-
Solid state relay.
- THD
-
Total harmonic distortion.
- ()
-
Instantaneous values of voltage.
-
Estimated –th component signal associated with the influence of the –th disturbing load.
-
Instantaneous values of voltage at point .
-
Root–mean–square (rms) value of voltage.
-
Amplitude of voltage.
-
Reactance.
-
Impedance.
I Introduction
Power quality is an important topic related to modern power systems. In many countries, new legal documents (e.g. [1]) appear forcing power suppliers to ensure that the electrical energy they supply is of appropriate quality. Power quality is primarily a set of parameters determining the quality of supply voltage [2], e.g.: rms value of voltage , total harmonic ratio THD, contribution of individual harmonics, short–term and long–term flicker indicator. Parameters determining the power quality allow for the assessment of the severity of disturbances in the power quality in power networks. One of the most common disturbances in the power quality in power networks are voltage fluctuations [3], which can influence on the operation of electrical loads such as motors [4, 5, 6] or light sources [7, 8]. In the case of light sources, flicker can occur [8, 9, 10], which in bad conditions can induce epileptic or depressive states. The scale of the problem of voltage fluctuations increases with the development trend of modern power systems, which are focused on increasing the share of renewable energy sources in the manufacturing sector [11, 12, 13] and at increasing the number of power electronic loads [14, 15], e.g. working with renewable energy sources, or used in energy–saving solutions, or used in control systems. Most often, the problem of voltage fluctuations is solved when a consumer reports a complaint, and then actions are taken to identify disturbing loads in the power grid, which in turn are focused on minimizing the disruptions caused by these disturbing loads [16, 17, 18, 19, 20, 21].
Methods for identification of sources of voltage fluctuations can be divided into single–point methods [22, 23, 24, 25] and multi–point methods [26, 27, 28, 29, 30, 31]. Single–point methods have limited diagnostic capabilities because they only allow for identification of the side responsible for voltage fluctuations from the perspective of the measurement point. If a specific measurement point is not the supply point of the disturbing load, identification of disturbing load should be performed iteratively at subsequent points in the power grid. Nevertheless, in the case of many sources of voltage fluctuations, including power electronic loads that change their operating state at a frequency higher than the power frequency , single–point methods often cause incorrect conclusions about the side that is the source of disturbance [23, 32]. Multi–point methods have greater diagnostic capabilities, but require more measurements and require greater computational complexity. However, it is worth noting the numerous limitations of the multi–point methods currently available in the literature [27, 29, 32]. First of all, most of the multi–point methods available in the literature do not allow for the identification of disturbing loads that change their operating state at a frequency higher than the power frequency [26, 27, 28, 29, 30, 32]. In the case of multi–point methods based on machine learning methods [33, 34, 35] (including deep learning methods [36, 37]), effective operation requires appropriately prepared training data, which are difficult to obtain due to the constantly changing nature of the loads in the network. Even if the identification is limited to loads that change their operating state at a frequency lower than the power frequency , the multi–point methods currently available in the literature provide limited identification possibilities (e.g. some methods only provide the ability to indicate the supply point of disturbing loads [26, 27] or to estimate selected parameters associated with the impact of a certain group loads - e.g. frequency of changes in the status of individual sources of disturbance [38]). In recent years, the first proposal of a multi–point method based on an enhanced empirical wavelet transform was prepared [32], which is the first method allowing for preliminary selective identification resulting the indication of the power supply point of the source of disturbance and the estimation of selected parameters associated with individual sources of voltage fluctuations, including disturbing loads changing their operating state with frequency higher than the power frequency . However, due to the limitations of the enhanced empirical wavelet transform method, it was shown in [39] that the approach based on this algorithm under bad conditions also cause incorrect indication of the supply point of the disturbing load, or incorrect assessment of selected features of disturbing loads. Therefore, this article presents a modification of the method described in [32], which does not have the limitations indicated in [39], and therefore solves the problem of effective identification of sources of voltage fluctuations in power grids. Moreover, the proposed method implemented in the smart energy meter infrastructure creates the possibility of automatic identification, which does not require additional expert knowledge. The proposed approach allows both the indication of the power supply point of a disturbing load and the estimation of selected parameters associated with individual disturbing loads at individual points in the power grid. The selected parameters include the frequency of changes in the operating state of disturbance sources (a feature dependent only on the disturbing load) and the average amplitude of voltage fluctuations at individual points in the power grid caused by a specific source of disturbance (a feature dependent on the disturbing load and on the parameters of the supply circuit). The correctness of the proposed approach was verified for a large set considering many power grid topologies and the changing nature of disturbing loads (along with a different number of their simultaneous occurrences) obtained from numerical simulation studies and experimental studies.
II Proposed approach
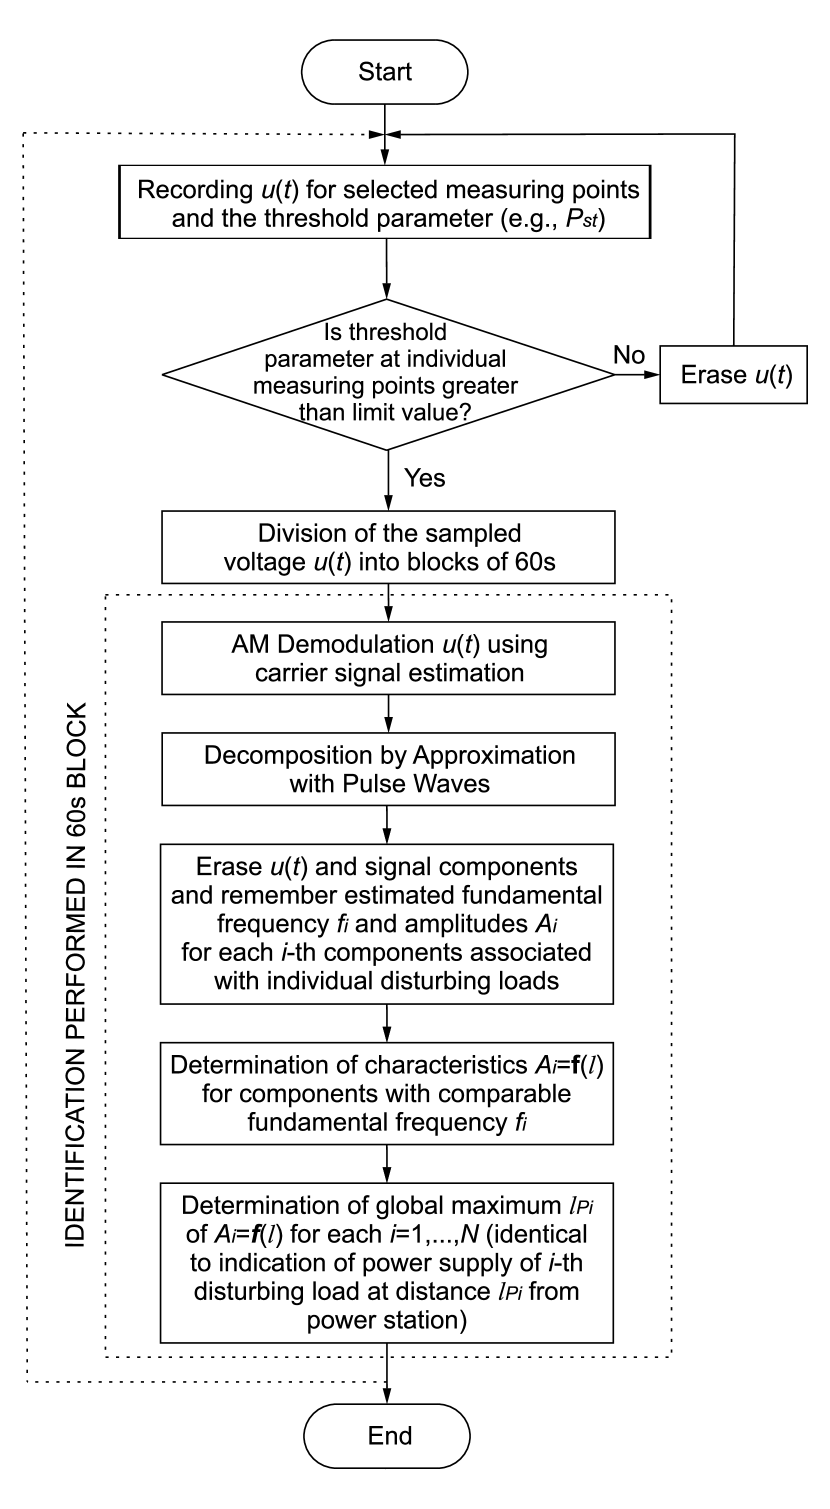
The proposed algorithm for identification of sources of voltage fluctuations is presented in Fig. 1. The idea of the proposed approach uses the assessment of the propagation of voltage fluctuations in the power grid [26, 27]. An example of the propagation of voltage fluctuations is shown in Fig. 2.

Assessment of the propagation of voltage fluctuations consists in assessment of the amplitude of voltage fluctuations for a specific source of voltage fluctuations. The amplitude of voltage fluctuations in the power grid increases to its maximum value at the supply point of disturbing load. If there is no propagation of voltage fluctuations on the medium–voltage MV side, then on the low–voltage LV side, the principle can be that the closer to the MV/LV supply point, the lower the amplitude of voltage fluctuations. For supply points further away from the MV/LV power supply point and the supply point of the disturbance source, it can be seen that the amplitude of voltage fluctuations is constant, or its slight attenuation is visible in the case of the capacitive nature of the line. In the case of the propagation of voltage fluctuations from the MV side, the assessment of the propagation of voltage fluctuations is analogous, except that it is assumed that the MV/LV power supply point is treated as an additional supply point for the disturbance source. Currently, in the literature, methods based on the assessment of the propagation of voltage fluctuations allow for the effective identification of the dominant source of disturbance and are limited to identification of sources of disturbance that change their operating state at a frequency lower than the power frequency . Therefore, in order to increase the diagnostic capabilities of the proposed approach, the assessment of the propagation of voltage fluctuations in this approach is performed for selected parameters already associated with the impact of individual (specific) sources of disturbances in the power grid. The selected parameters are the frequency of changes in the operating state of individual sources of disturbance (feature/parameter depending only on the source of disturbance) and the amplitude of voltage changes induced by individual sources of disturbance (feature/parameter depending on the source of disturbance and the properties of the supply circuit). The amplitude of voltage changes induced by individual sources of disturbance can also be treated as the contribution of a specific source of disturbance to the resulting voltage fluctuations. In order to estimate selected parameters associated with the impact of individual disturbing loads, in the first step the voltage signal from individual points of the network is demodulated using a demodulator with carrier signal estimation, which is described in detail in [40]. At this stage, a modulating signal is obtained that determines the resultant voltage fluctuations in the power grid. In the second step, the modulating signal is decomposed into component signals using decomposition by approximation with pulse waves (DAPW), which is described in detail in [41]. The proposed use of the developed decomposition method in the process of identification of disturbing loads allows for an effective average assessment of the contribution of individual disturbing loads to the resulting voltage fluctuations. In the method described in [41], the actual shapes of voltage fluctuations are considered, which allow for the decomposition method to work effectively without additional conditions that had to be applied in the proposal described in [32], where the enhanced empirical wavelet transform (EEWT) method is used for decomposition. The EEWT method, even with additional conditions imposed in bad conditions, cause incorrect identification of sources of voltage fluctuations (e.g. incorrect indication of the supply point of the source of disturbance, incorrect estimation of the frequency of changes in the operating state of the identified source of disturbance) [39].

Hence, the newly proposed approach based on demodulation - decomposition - propagation assessment, where DAPW is used for decomposition, solves the problem of effective identification of sources of voltage fluctuations in the power grid. The conceptual operation of the proposed approach is shown in Fig. 3. It is worth noting that the proposed approach proposes the task of identification of sources of disturbance when the limit value is exceeded by the selected threshold parameter. Such activation of the identification procedure supports the implementation of the approach in the currently implemented smart meter infrastructure, or in the measurement and recording infrastructure based on Internet of Things technologies. For the purposes of the publication, it is proposed to adopt the short–term flicker indicator as a threshold parameter, because currently this indicator is used to assess voltage fluctuations in power grids. It is proposed to adopt a value equal to 1.0 as the limit value at any point in the power grid, because it is the limit value in LV networks specified in normative documents.
III Research results and discussion
III-A Numerical simulation studies
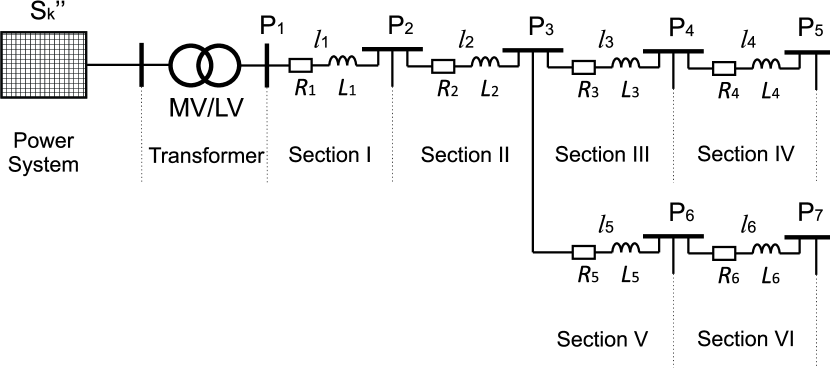
Numerical simulation studies were carried out using a three–phase power network model with a radial topology with a branch, the diagram of which is shown in Fig. 4. The power network model was implemented in the SIMULINK/MATLAB program. The research focused mainly on LV networks, because the voltage fluctuations most often occur in them. Currently, most of the LV networks in Poland are radial topologies with branches. As part of the numerical simulation studies, a test set was prepared, which consisted of 1000 cases in which the following were randomly adopted:
-
•
different values of the parameters of the adopted power network model, where , ;
-
•
a different number of disturbing loads (both single–phase and three–phase), where , with different parameters such as the frequency of changes in the operating state of disturbing loads and the active power of individual sources of disturbance ;
-
•
different supply points of individual disturbance sources.
Detailed values of individual parameters for the particular cases considered are included in a publicly available database [42]. Considering randomly adopted values of particular parameters in numerical simulation studies allows for an effective assessment of the usefulness of the proposed solution. As part of numerical simulation studies, for individual cases voltages were acquired from particular points of the power network with a sampling rate of 20, and then an identification procedure was carried out for the data obtained in this way, focused on two objectives:
-
•
the indication of the supply point of disturbing loads;
-
•
the estimation of the frequency of changes in the operating state of individual sources of disturbance (in practice, this process significantly supports the localization of sources of disturbance, even using methods other than the proposed one - e.g. single–point methods).
III-B Laboratory experimental studies
Laboratory experimental studies were carried out using a real power grid three–phase model specially prepared for the research purposes, which is shown in Fig. 5. The block diagram of the laboratory setup is shown in Fig. 6. The real power grid model is supplied directly from a 630 MV/LV transformer. The diagram of prepared real power grid model is analogous to the diagram presented in Fig. 4, for which the appropriate values presented in Table I are adopted.


| Section | R [m] | X [m] | Z [m] |
|---|---|---|---|
| MV/LV transformer | 3.8 | 10.8 | 11.4 |
| Section I | 150.0 | 31.4 | 153.3 |
| Section II | 150.0 | 31.4 | 153.3 |
| Section III | 100.0 | 69.1 | 121.6 |
| Section IV | 50.0 | 2.1 | 50.0 |
| Section V | 100.0 | 69.1 | 121.6 |
| Section VI | 50.0 | 2.1 | 50.0 |
As part of the laboratory experimental studies, 100 cases were considered, in which the following randomly adopted parameters were considered:
-
•
a different number of disturbing loads (both single–phase and three–phase), where , with different the frequencies of changes in the operating state of disturbing loads with the active power of individual sources of disturbance =2;
-
•
different supply points of individual disturbance sources.
Disturbing loads causing voltage fluctuations in the research were 2 convection systems controlled by solid state relay (SSR) based on MOSFET switches. Detailed values of individual parameters for the particular cases considered are included in a publicly available database [42]. As part of laboratory experimental studies, voltages were acquired for individual cases from particular points of the power network with a sampling rate of 20. The database [42] contains 100 sets of recorded voltages from individual points, which were used in the research. Then, for the data obtained in this way, the identification procedure was carried out focused on two objectives:
-
•
the indication of the supply point of disturbing loads;
-
•
the estimation of the frequency of changes in the operating state of individual sources of disturbance (in practice, this process significantly supports the localization of sources of disturbance, even using methods other than the proposed one - e.g. single–point methods).
III-C Research results
During the research, for data from numerical simulation studies and laboratory experimental studies, an identification procedure was performed using the proposed approach (PA) and selected other methods available in the literature:
- •
- •
-
•
method based on decomposition using enhanced empirical wavelet transform (M3) [32].
Two parameters are used to evaluate the performance of the identification of disturbing loads. The first parameter is the accuracy metric determining the effectiveness of correct indication of the supply point of the disturbance source. The parameter is given by:
| (1) |
where is the number of correctly identified supply points of disturbance sources, and is the actual number of considered disturbance sources in individual cases. The second parameter is the accuracy metric determining the effectiveness of the correct estimation of the frequency of changes in the operating state of individual sources of voltage fluctuations. The parameter is given by:
| (2) |
where is the number of correctly estimated frequencies of changes in the operating state of individual sources of disturbance with an accuracy of 10%, and is the actual number of considered sources of disturbance in individual cases.
Table II shows the determined parameters and for the proposed approach and other selected methods of the identification of disturbing loads for data from numerical simulation studies and laboratory experimental studies. By analyzing the obtained research results, the usefulness of the proposed approach can be clearly determined. Fig. 7 shows an example of the operation of the proposed approach on data obtained from experimental studies for the selected phase L1. In this selected case, three disturbing loads from different points on the line were supplied from the phase L1 of the tested power line.
| Method | [%] | [%] | ||
| simulations | experiments | simulations | experiments | |
| PA | 100.00 | 100.00 | 92.52 | 100.00 |
| M1 | 67.59 | 43.49 | 91.01 | 88.09 |
| M2 | 85.98 | 69.53 | 91.68 | 93.35 |
| M3 | 53.50 | 46.81 | 81.04 | 82.27 |

Analyzing the obtained research results, it can be noticed that, apart from the proposed method PA, there is a visible tendency that the identification process based on data obtained in the real power grid has lower effectiveness (more frequent incorrect indication of the supply point of disturbing loads and more frequent incorrect estimation of the frequency of changes in the operating state of the disturbing load) than identification process based on data from numerical simulation tests. This tendency is the result of the fact that in the real power grid, in addition to the disturbance caused by known specific sources of disturbance used in the laboratory, there were other disturbances (e.g. distortion of the supply voltage by higher harmonics or small voltage fluctuations related to the influence of other loads) propagated from the MV side of power network or from other circuits supplied from the same MV/LV switchboard. The proposed solution PA allows for effective localization of the disturbing loads in the power grid (correct indication of the supply points of the disturbing loads) and the proposed solution PA provides the most accurate estimation of the frequency of changes in the operating state of disturbing loads, which parameter significantly supports the process of localization of disturbance sources in the power grid. The effectiveness of identification of sources of disturbances by the proposed method PA is maintained both for numerical simulation studies and for experimental laboratory studies, and therefore the proposed approach PA is not sensitive to other occurring simultaneously low–frequency disturbances in the power grid. Minor errors in estimation of the frequency of changes in the operating state of disturbance sources by the proposed approach PA in numerical simulation studies are related to errors in the demodulation method used [40] (as a result of the statistical filter used in this demodulator, as described in [40]), due to which the demodulator can distort the estimated modulating signal in the frequency range close to the cut–off frequency of the statistical filter used in the demodulator. Nevertheless, it is acceptable because, firstly, the use of the indicated demodulator allows for considering loads that change their frequency with a frequency higher than the power frequency, and secondly, despite the errors caused by the demodulator used, the use of the proposed decomposition method [41] allows for an accurate indication supply points for individual sources of disturbance. The occurring distortion is proportional at individual points in the power grid, which in turn does not disturb the process of assessment of the propagation of component signals used in the process of localization (indication of supply points) of sources of disturbance. The lack of higher errors in estimation of the frequency of changes in the operating state of disturbance sources by the proposed method PA in laboratory experimental studies is the result of the smaller size of the verification set (smaller number of cases considered, which can disturb the identification process).
IV Conclusion
The article presents a proposed algorithm for the identification of sources of voltage fluctuations in the radial power network, which allows for the determination of selected parameters associated with the impact of individual disturbing loads, based on which it is possible to indicate the point of supply of individual disturbing loads. The selected parameters are the frequency of changes in the operating state of individual sources of disturbance and the amplitude of the voltage fluctuations caused by them, associated with the specific contribution of the source of disturbance in the resulting voltage fluctuations. The presented approach considers sources of disturbance that change their operating state with a frequency both lower and higher than the power frequency. Particularly innovative is the inclusion of disturbing loads that change their operating state at a frequency higher than the power frequency. Such disturbing loads are, for example, power electronic devices, the number of which in the power grid is increasing. The presented algorithm is an improvement of the procedure based on the enhanced empirical wavelet transform, which allows for the elimination of limitations resulting from the decomposition method used. The correctness of the proposed approach was verified in experimental and simulation studies. The research considers the branched radial topology common in LV networks. The research includes sections with different impedance and line character that can cause incorrect identification (including localization) of disturbance sources using currently used statistical methods. This problem does not affect the accuracy of the proposed approach, and therefore the identification process is most effectively performed by the proposed algorithm. The only minor errors associated with the proposed solution are related to the demodulation method used, in which bandwidth limitation can affect the accuracy of estimation of selected parameters associated with individual sources of disturbance due to bandwidth limitation by the statistical filter used in the indicated demodulator.
References
- [1] Act of July 28, 2023 amending the Energy Law and certain other acts, OJ 2023 item 1681. (2023). [Online]. Available: https://isap.sejm.gov.pl/
- [2] Voltage characteristics of electricity supplied by public electricity networks, Standard EN 50160:2010/A2:2019, 2019.
- [3] 6th CEER Benchmarking Report on all the Quality of Electricity and Gas Supply 2016. (2016). [Online]. Available: https://www.ceer.eu/
- [4] M. Ghaseminezhad, A. Doroudi, and A. J. S.H. Hosseinian, “Analysis of voltage fluctuation impact on induction motors by an innovative equivalent circuit considering the speed changes,” IET Gen., Transm. & Distrib., vol. 11, pp. 512–519(7), Jan. 2017.
- [5] P. Gnacinski, D. Hallmann, A. Muc, P. Klimczak, and M. Peplinski, “Induction motor supplied with voltage containing symmetrical subharmonics and interharmonics,” Energies, vol. 15, DOI 10.3390/en15207712, no. 20, p. art. no. 7712, 2022. [Online]. Available: https://www.mdpi.com/1996-1073/15/20/7712
- [6] P. Gnacinski, D. Hallmann, M. Peplinski, and P. Jankowski, “The effects of voltage subharmonics on cage induction machine,” International Journal of Electrical Power & Energy Systems, vol. 111, DOI https://doi.org/10.1016/j.ijepes.2019.04.009, pp. 125–131, 2019. [Online]. Available: https://www.sciencedirect.com/science/article/pii/S0142061518327170
- [7] D. L. Geiger II and S. M. Halpin, “Assessing voltage fluctuations and lamp flicker using rms voltages,” IEEE Trans. Power Del., vol. 32, DOI 10.1109/TPWRD.2017.2667231, no. 6, pp. 2481–2488, Dec. 2017.
- [8] P. Otomanski, G. Wiczynski, and B. Zajac, “Flicker vision of selected light sources,” Meas. Sci. Rev., vol. 17, no. 5, pp. 232 – 240, 2017.
- [9] H. Samet, S. Wang, V. Cuk, D. Yang, and S. Cobben, “Quantizing branches responsibility for voltage sags/swells and flicker events,” Electric Power Systems Research, vol. 225, DOI 10.1016/j.epsr.2023.109906, p. 109906, 2023.
- [10] J. Li, D. Hong, H. Lin, C. Liang, W. Yao, H. Zhong, and Y. Xu, “A generic flicker measurement method based on feature sequence reconstruction,” IEEE Transactions on Instrumentation and Measurement, vol. 72, DOI 10.1109/TIM.2023.3301906, pp. 1–9, 2023.
- [11] H. Karawia, M. Mahmoud, and M. Sami, “Flicker in distribution networks due to photovoltaic systems,” CIRED - Open Access Proc. J., vol. 2017, pp. 647–649, Oct. 2017.
- [12] A. H. Faranadia, A. M. Omar, and S. Z. Noor, “Voltage flicker assessment of 15.3kwp grid connected photovoltaic systems,” in 2017 IEEE 8th Control and System Graduate Research Colloquium (ICSGRC), DOI 10.1109/ICSGRC.2017.8070578, pp. 110–115, 2017.
- [13] X. Shi, T. Key, and A. Huque, “Can photovoltaic plants cause voltage flicker? - field measurement and screening,” in 2019 IEEE 46th Photovoltaic Specialists Conference (PVSC), DOI 10.1109/PVSC40753.2019.8980601, pp. 1549–1555, 2019.
- [14] A. Alizade and J. Noshahr, “Evaluating noise and dc offset due to inter-harmonics and supra-harmonics caused by back-to-back converter of (dfig) in ac distribution network,” CIRED - Open Access Proc. J., vol. 2017, pp. 629–632, Oct. 2017.
- [15] V. Kus, Z. Peroutka, and P. Drabek, “Non-characteristic harmonics and interharmonics of power electronic converters,” in CIRED 2005 - 18th Int. Conf. and Exh. on Electr. Distr., DOI 10.1049/cp:20051030, pp. 1–5, Jun. 2005.
- [16] J. He, X. Ruan, and L. Zhang, “Adaptive voltage control for bidirectional converter in flicker-free electrolytic capacitor-less ac-dc led driver,” IEEE Transactions on Industrial Electronics, vol. 64, DOI 10.1109/TIE.2016.2608767, no. 1, pp. 320–324, 2017.
- [17] L. Feola, R. Langella, I. Papic, and A. Testa, “Selective interharmonic compensation to improve statcom performance for light flicker mitigation,” IEEE Trans. Power Del., vol. 33, DOI 10.1109/TPWRD.2018.2810333, no. 5, pp. 2442–2451, 2018.
- [18] M. A. E. Alali, Y. B. Shtessel, J.-P. Barbot, and S. Di Gennaro, “Sensor effects in lcl-type grid-connected shunt active filters control using higher-order sliding mode control techniques,” Sensors, vol. 22, DOI 10.3390/s22197516, no. 19, p. art. no. 7516, 2022.
- [19] S. Liu, Y. Li, Y. Wu, L. Zhou, X. Zhao, R. Mai, and Z. He, “An output power fluctuation suppression method of dwpt systems based on dual-receiver coils and voltage doubler rectifier,” IEEE Transactions on Industrial Electronics, vol. 70, DOI 10.1109/TIE.2022.3217592, no. 10, pp. 10 167–10 179, 2023.
- [20] L. Han, J. Yin, L. Wu, L. Sun, and T. Wei, “Research on reactive power compensation control strategy of flexible on-load voltage regulator,” Energies, vol. 15, DOI 10.3390/en15176193, no. 17, p. art. no. 6193, 2022.
- [21] Y. Hu, X. Zhang, W. Mao, T. Zhao, F. Wang, and Z. Dai, “An optimized third harmonic injection method for reducing dc-link voltage fluctuation and alleviating power imbalance of three-phase cascaded h-bridge photovoltaic inverter,” IEEE Transactions on Industrial Electronics, vol. 67, DOI 10.1109/TIE.2019.2910038, no. 4, pp. 2488–2498, 2020.
- [22] Z. Hanzelka, “Single point methods for location of electromagnetic disturbances in power system,” Przeglad Elektrotechniczny, vol. 91, no. 6, pp. 1–5, 2015.
- [23] Z. Hanzelka, P. Slupski, K. Piatek, J. Warecki, and M. Zielinski, “Single point methods for location of distortion, unbalance, voltage fluctuation and dips sources in a power system,” in Power Quality, A. Zobaa, M. Canteli, and R. Bansal, Eds., ch. 9. Rijeka: IntechOpen, 2011. [Online]. Available: https://doi.org/10.5772/16410
- [24] P. G. V. Axelberg, M. H. J. Bollen, and I. Y. Gu, “Trace of flicker sources by using the quantity of flicker power,” IEEE Trans. Power Del., vol. 23, no. 1, pp. 465–471, 2008.
- [25] G. A. Senderovich and A. V. Diachenko, “A method for determining location of voltage fluctuations source in electric grid,” Electrical engineering and electromechanics, DOI 10.20998/2074-272X.2016.3.09, no. 3, pp. 58–61, 2016.
- [26] G. Wiczynski, “Voltage-fluctuation-based identification of noxious loads in power network,” IEEE Trans. Instrum. Meas., vol. 58, DOI 10.1109/TIM.2009.2016373, no. 8, pp. 2893–2898, Aug. 2009.
- [27] G. Wiczynski, “Determining location of voltage fluctuation source in radial power grid,” Electric Power Systems Research, vol. 180, DOI 10.1016/j.epsr.2019.106069, no. 106069, 2020.
- [28] N. Eghtedarpour, E. Farjah, and A. Khayatian, “Intelligent identification of flicker source in distribution systems,” IET Gener. Transm. Dis., vol. 4, no. 9, pp. 1016–1027, 2010.
- [29] A. Dejamkhooy, A. Dastfan, and A. Ahmadyfard, “Source detection and propagation of equal frequency voltage flicker in nonradial power system,” Turkish Journal of Electrical Engineering and Computer Sciences, vol. 24, pp. 1351–1370, 2016.
- [30] J. J. Inamdar and K. I. Annapoorani, “A review of methods employed to identify flicker producing sources,” TELKOMNIKA Telecommunication Computing Electronics and Control, vol. 16, pp. 465–480, 2018.
- [31] X. Wei, W. Li, H. Xu, X. Zheng, and F. Chen, “A flicker source location method based on wide-area information,” Journal of Physics: Conference Series, vol. 2399, DOI 10.1088/1742-6596/2399/1/012036, no. 1, p. 012036, Dec. 2022.
- [32] P. Kuwalek, “Selective identification and localization of voltage fluctuation sources in power grids,” Energies, vol. 14, DOI 10.3390/en14206585, no. 20, p. art.no. 6585, 2021. [Online]. Available: https://www.mdpi.com/1996-1073/14/20/6585
- [33] W. Tee, M. R. Yusoff, A. R. Abdullah, and M. F. Yaakub, “Voltage variation signals source identification and diagnosis method,” International Journal of Advanced Computer Science and Applications, vol. 10, DOI 10.14569/IJACSA.2019.0100420, no. 4, 2019.
- [34] Y. Zhang, G. He, and G. Li, “Automatic electrical system fault diagnosis using a fuzzy inference system and wavelet transform,” Processes, vol. 11, DOI 10.3390/pr11082231, no. 8, p. art. no. 2231, 2023.
- [35] E. Y. Sitki Akkaya and H. M. Akgun, “A new comparative approach based on features of subcomponents and machine learning algorithms to detect and classify power quality disturbances,” Electric Power Components and Systems, DOI 10.1080/15325008.2023.2260375, pp. 1–24, 2023.
- [36] D. Anggriawan, R. Mubarok, E. Prasetyono, E. Wahjono, M. Fitrianto, A. Firdaus, A. Budikarso, and A. Tjahjono, “Detection and identification of voltage variation events based on artificial neural network,” International Review of Automatic Control, vol. 13, DOI 10.15866/ireaco.v13i5.18141, no. 5, pp. 224–230, 2020.
- [37] H. Samet, M. Khosravi, T. Ghanbari, and M. Tajdinian, “A two-level neural network approach for flicker source location,” Computers and Electrical Engineering, vol. 92, DOI 10.1016/j.compeleceng.2021.107157, p. 107157, 2021.
- [38] P. Kuwalek, “Estimation of parameters associated with individual sources of voltage fluctuations,” IEEE Transactions on Power Delivery, vol. 36, DOI 10.1109/TPWRD.2020.2976707, no. 1, pp. 351–361, 2021.
- [39] P. Kuwalek, “Decomposition problem in process of selective identification and localization of voltage fluctuation sources in power grids,” in 2022 20th Int. Conf. on Harmonics and Quality of Power (ICHQP), pp. 1–6, 2022.
- [40] P. Kuwalek, “Am modulation signal estimation allowing further research on sources of voltage fluctuations,” IEEE Trans. on Industrial Electronics, vol. 67, no. 8, pp. 6937–6945, 2020.
- [41] P. Kuwalek, “Decomposition by approximation with pulse waves allowing further research on sources of voltage fluctuations,” IEEE Trans. on Industrial Electronics, DOI 10.1109/TIE.2023.3283698, p. Early Access, 2023.
- [42] P. Kuwalek, “Dataset used in the publication entitled “Multi–Point Method using Effective Demodulation and Decomposition Techniques allowing Identification of Disturbing Loads in Power Grids”,” 2023. [Online]. Available: https://doi.org/10.5281/zenodo.10094992
- [43] M. Silsupur and B. Turkay, “Flicker source detection methods based on IEC 61000-4-15 and signal processing techniques - a review,” Balkan Journal of Electrical and Computer Engineering, vol. 3, DOI 10.17694/bajece.83624, no. 2, pp. 93–97, 2015.
![[Uncaptioned image]](/html/2311.07129/assets/Figure/kuwalek_foto.jpg) |
P. Kuwałek received the B.Sc. degree in mathematics, M.Sc. Eng. in electrical engineering, and Ph.D. degrees in automation, electronic and electrical engineering from the Poznan University of Technology, Poznan, Poland, in 2018, 2018 and 2022, respectively. He is currently an Assistant Professor with the Division of Metrology, Electronics and Lighting Engineering at Poznan University of Technology. His current research interests include power quality evaluation and signal processing. |
![[Uncaptioned image]](/html/2311.07129/assets/Figure/wiczynski_foto.jpg) |
G. Wiczyńki received the M.Sc. and Ph.D. degrees in electrical engineering from the Poznan University of Technology, Poznan, Poland, in 1990 and 1998, respectively. He is currently with the Division of Metrology, Electronics and Lighting Engineering, Poznan University of Technology. His current research interests include electronics and optoelectronics in electrical and nonelectrical quantities measurements and power quality evaluation. |