:
\theoremsep
\jmlrvolumeLEAVE UNSET
\jmlryear2023
\jmlrsubmittedLEAVE UNSET
\jmlrpublishedLEAVE UNSET
\jmlrworkshopMachine Learning for Health (ML4H) 2023
Osteoporosis Prediction from Hand and Wrist X-rays using Image Segmentation and Self-Supervised Learning
Abstract
Osteoporosis is a widespread and chronic metabolic bone disease that often remains undiagnosed and untreated due to limited access to bone mineral density (BMD) tests like Dual-energy X-ray absorptiometry (DXA). In response to this challenge, current advancements are pivoting towards detecting osteoporosis by examining alternative indicators from peripheral bone areas, with the goal of increasing screening rates without added expenses or time. In this paper, we present a method to predict osteoporosis using hand and wrist X-ray images, which are both widely accessible and affordable, though their link to DXA-based data is not thoroughly explored. Initially, our method segments the ulnar, radius, and metacarpal bones using a foundational model for image segmentation. Then, we use a self-supervised learning approach to extract meaningful representations without the need for explicit labels, and move on to classify osteoporosis in a supervised manner. Our method is evaluated on a dataset with 192 individuals, cross-referencing their verified osteoporosis conditions against the standard DXA test. With a notable classification score (AUC=0.83), our model represents a pioneering effort in leveraging vision-based techniques for osteoporosis identification from the peripheral skeleton sites.
keywords:
Osteoporosis, hand and wrist X-rays, image segmentation, self-supervised learning, contrastive learning1 Introduction
Osteoporosis is a common bone ailment characterized by reduced bone mineral density (BMD) or bone mass loss, leading to bones becoming fracture-prone and structurally compromised. Given its prevalence and far-reaching impact, there is a pressing need for preemptive risk assessment, early diagnosis, and effective preventive actions. While computed tomography (CT) and magnetic resonance imaging (MRI) have demonstrated potential in BMD estimation and osteoporosis screening (Chou and LeBoff, 2017; Pickhardt et al., 2013; Gausden et al., 2017), their clinical use is limited due to concerns about radiation exposure and associated costs. At present, the dual energy X-ray absorptiometry (DXA) is recognized as a standard and reliable instrument for osteoporosis detection and BMD analysis. Nonetheless, DXA comes with its own set of challenges: the proficiency of the operator can influence the results, the patient’s posture during the test can skew accuracy, and in obese patients with significant fat mass, BMD might be overestimated (Watts, 2004; Messina et al., 2015).
As a solution, recent studies have highlighted the potential of X-rays, often performed during routine medical visits, as a valuable tool for collecting more comprehensive data. This approach can be particularly useful for osteoporosis detection (Yamamoto et al., 2020; Hsieh et al., 2021), leveraging the widespread availability of X-ray data from patients who have not been specifically screened for the condition. This method eliminates the need for expensive DXA equipment, making it a more cost-effective alternative. X-rays are also more patient-friendly due to their significantly lower radiation levels compared to DXA. Among the various techniques, the 2nd metacarpal cortical index (2MCI) from hand X-ray images has gained attention as a promising biomarker for osteoporosis screening (Schreiber et al., 2017; Patel et al., 2020). The metacarpal bone’s unique features, such as cortical thickness and the porosity of the cancellous bone tissue, are key in identifying osteoporosis. Nonetheless, this approach is not without its challenges, as it requires manual measurement of the metacarpal bone dimensions, a process that can be time-consuming.
fig:sam

Recent strides in deep learning techniques, showcasing diagnostic precision comparable to human experts in numerous medical fields (Huang et al., 2023), motivate us to tackle the osteoporosis detection challenge taking advantage of existing research. We do this by utilizing a deep learning approach on hand and wrist X-ray images, eliminating the necessity for manual 2MCI calculations. In this study, our first step is to curate the training data by isolating significant bones in the hand and wrist, especially the metacarpals, relevant for osteoporosis screening. We achieve this bone separation using a foundational image segmentation tool known as the Segment Anything Model (SAM) (Kirillov et al., 2023). Following that, we adopt a self-supervised learning (SSL) framework for the preliminary training of our models. This method allows the models to learn meaningful representations without relying on specific labeled datasets. Such an SSL strategy enhances the model’s generalization capabilities, even in scenarios of limited datasets, as is the case in our study with participants. Moreover, we expand upon the multi-crop augmentation strategy (Caron et al., 2020), tailored for hand X-ray images, to improve the efficiency of our self-supervised models.
In summary, our contributions encompass three key aspects:
-
•
We employ a deep learning approach leveraging peripheral radiographic images over traditional central DXA measurements for osteoporosis prediction, obviating the need for 2MCI metric. This novel strategy could pave the way for more convenient osteoporosis screenings.
-
•
We propose an SSL approach centered on segments of hand and wrist bones, enabling our models to distill critical features prior to the subsequent osteoporosis prediction phase. This method demonstrates enhanced outcomes when compared with the conventional supervised models.
-
•
Our study suggests that the proposed method achieves clinically valuable osteoporosis screening results even under the low data regime. We anticipate potential improvements by integrating more unlabeled radiographic data in future iterations.
tab:dataStat # samples Train Val Test Osteoporosis 372 46 48 Normal 935 116 119 Total 1307 162 167
2 Methods
In this section, we first introduce the way of generating segmentation masks for targeted bones (Sec. 2.1), multi-crop data augmentation methods (Sec. 2.2), present strategies for self-supervised learning on the segmented image inputs (Sec. 2.3), and then detail the experimental procedure (Sec. 2.4).
2.1 Segmentation Mask for Target Bones
Our initial assumption posits that raw X-ray images may not be the optimal input for our backbone residual neural networks. This is because these raw radiographs, averaging 2515(W) by 3588(H) in size, are typically too large for most conventional vision models. Merely resizing them might lead to a loss of critical features like bone texture and microarchitecture (Lespessailles et al., 2008; Zheng and Makrogiannis, 2016; Sebro and De la Garza-Ramos, 2022) which are essential for predicting osteoporosis. Furthermore, drawing from prior studies that highlight a notable correlation between 2MCI and BMD measurements (Schreiber et al., 2017; Patel et al., 2020), we extract smaller individual bones from the raw X-rays of hands and wrists.
To facilitate this, we employ SAM (Kirillov et al., 2023) as a foundation model for image segmentation to generate specific bone masks, as illustrated in Figure LABEL:fig:sama. SAM allows us to more precisely separate each target bone by setting positive point prompts within the desired region and adding negative point prompts outside that area. The resultant output masks are then used to produce targeted bone image segments using a simple Hadamard multiplication (Figure LABEL:fig:sama, right). In the end, SAM is applied to segment 192 X-ray images, yielding a total of 1636 images for model inputs, comprising the ulna, radius, and five metacarpals (more details in Table LABEL:tab:dataStat). It is worth mentioning that there were occasional deviations resulting in fewer than seven target image samples. This was due to irregular hand positioning or the presence of accessories or equipment on the patient’s hand.
2.2 Multi-Crop Data Augmentation
The bone segments derived in the previous step exhibit variations in rotational angles (Figure LABEL:fig:sama, right), primarily due to the inherent anatomical structure of the hand and wrist and the hand position. To ensure our model can robustly handle such variations, we apply multiple data augmentation techniques, including random rotations between -20 to 20 degrees and random horizontal/vertical flips. Additionally, we incorporate the multi-crop data augmentation method (Caron et al., 2020) to benefit from efficient pretext task training in Section 2.3. This method samples images of two distinct resolutions: randomly seletected two global views () and four local views ().
However, conventional multi-crop augmentation, often applied to standard image classification benchmarks or natural images, ensures each cropped segment remains feature-rich. In contrast, our specific bone segments frequently have vast areas of zero pixels, a result of the segmentation process. This characteristic persists even in original radiographs before applying SAM; for a visual reference, see Figure LABEL:fig:same. Consequently, some samples might entirely lack bone content.
To address this issue, we adapt the multi-crop augmentation technique. Our enhanced approach ensures that both global and local view outputs consistently possess a minimum threshold of non-zero pixels. We achieve this consistency using iterative rejection sampling until our criteria are satisfied. This guarantees the utility and relevance of each cropped image in subsequent phases (Figure LABEL:fig:samb). For ensuring meaningful content in the cropped segments, we establish a 10% non-zero pixel threshold, minimizing the risk of feature loss.
2.3 Self-Supervised Learning
In this study, we evaluate four prominent SSL methods: SimCLR (Chen et al., 2020), SupCon (Khosla et al., 2020), SwAV (Caron et al., 2020), and VICReg (Bardes et al., 2021) all fall under the umbrella of self-supervised learning, emphasizing the extraction of meaningful patterns from data without using explicit labels. A cornerstone for all these methods is the use of data augmentation strategies, ensuring that the neural networks learn robust and generalizable features. By designing tasks that force the models to recognize or distinguish between differently augmented views of the same data, these methods effectively train models to focus on inherent data structures. Moreover, all four techniques share the overarching goal of maximizing consistency between these augmented views in a shared embedding space, ensuring that semantically similar data points (or their augmented versions) are mapped closer together.
SimCLR (Chen et al., 2020) focuses on contrasting different augmented versions of the same instance against other instances, while SupCon (Khosla et al., 2020) enhances this paradigm by also bringing instances of the same class closer in the embedding space. SwAV (Caron et al., 2020) introduces a swapped prediction mechanism avoiding the need for negative pair comparisons, making it computationally more efficient. In contrast, VICReg (Bardes et al., 2021) stands out by imposing variance, invariance, and covariance regularization on the latent space, ensuring the captured features are diverse and not merely based on trivial patterns. Each method, thus, introduces its unique strategy to address the challenges of self-supervised learning in its way. The exploration of effective self-supervised learning methods in peripheral radiographic images remains nascent, making our experimental results useful for clinical tasks in other medical domains.
2.4 Experimental Details
Our experiments involve two distinct training stages. In the initial stage, known as the pretext task, we train the ResNet-50 encoder on augmented views that are generated automatically. This step enables the encoder to extract meaningful features from the images without needing labels provided by humans. Following this, in the downstream task, the pre-trained encoder undergoes fine-tuning on a dataset that is labeled specifically for our target task of classification. In this phase, the encoder serves as an efficient feature extractor, and we train only its final linear layer for accurate osteoporosis prediction. For the optimization process, we employ the LARC optimizer (You et al., 2017), along with a cosine annealing scheduler (Loshchilov and Hutter, 2016) to adjust the learning rates. The entire training process is executed with a batch size of 128.
For accurate target labels, we cross-reference our data with DXA scans. DXA operates by assessing the variation in the attenuation (absorption) of X-rays by the bones to determine the bone mineral density. BMD quantifies the concentration of calcium and other minerals in a specific bone segment. The obtained BMD value is instrumental in computing the -score, a metric that benchmarks a patient’s BMD against the average BMD of a healthy 30-year-old adult. A -score in the negative spectrum denotes a BMD that is below the average, while a positive -score signifies an above-average BMD. In our study, we utilize the -score as a criterion to annotate the X-ray images. An X-ray image is tagged as indicative of osteoporosis if the associated -score falls below ; otherwise, it is classified as normal.
tab:multicropresult AUC F1-score Accuracy SSL()/ Augmentation() multi-crop (2020) ext. multi-crop multi-crop (2020) ext. multi-crop multi-crop (2020) ext. multi-crop Supervised 0.524 0.011 0.527 0.004 +0.003 0.447 0.000 0.447 0.000 +0.000 28.74 0.00 28.74 0.00 +0.00 SimCLR (2020) 0.809 0.011 0.827 0.003 +0.016 0.500 0.014 0.655 0.034 +0.155 79.24 0.69 79.84 0.35 +0.60 SupCon (2020) 0.787 0.013 0.813 0.005 +0.026 0.562 0.040 0.611 0.025 +0.049 77.45 0.35 74.85 5.12 -2.60 SwAV (2020) 0.778 0.023 0.736 0.062 -0.041 0.400 0.096 0.567 0.058 +0.167 76.45 0.69 67.07 6.59 -9.38 VICReg (2021) 0.806 0.015 0.812 0.018 +0.006 0.522 0.084 0.634 0.031 +0.112 77.05 0.69 74.45 3.07 -2.60
3 Results
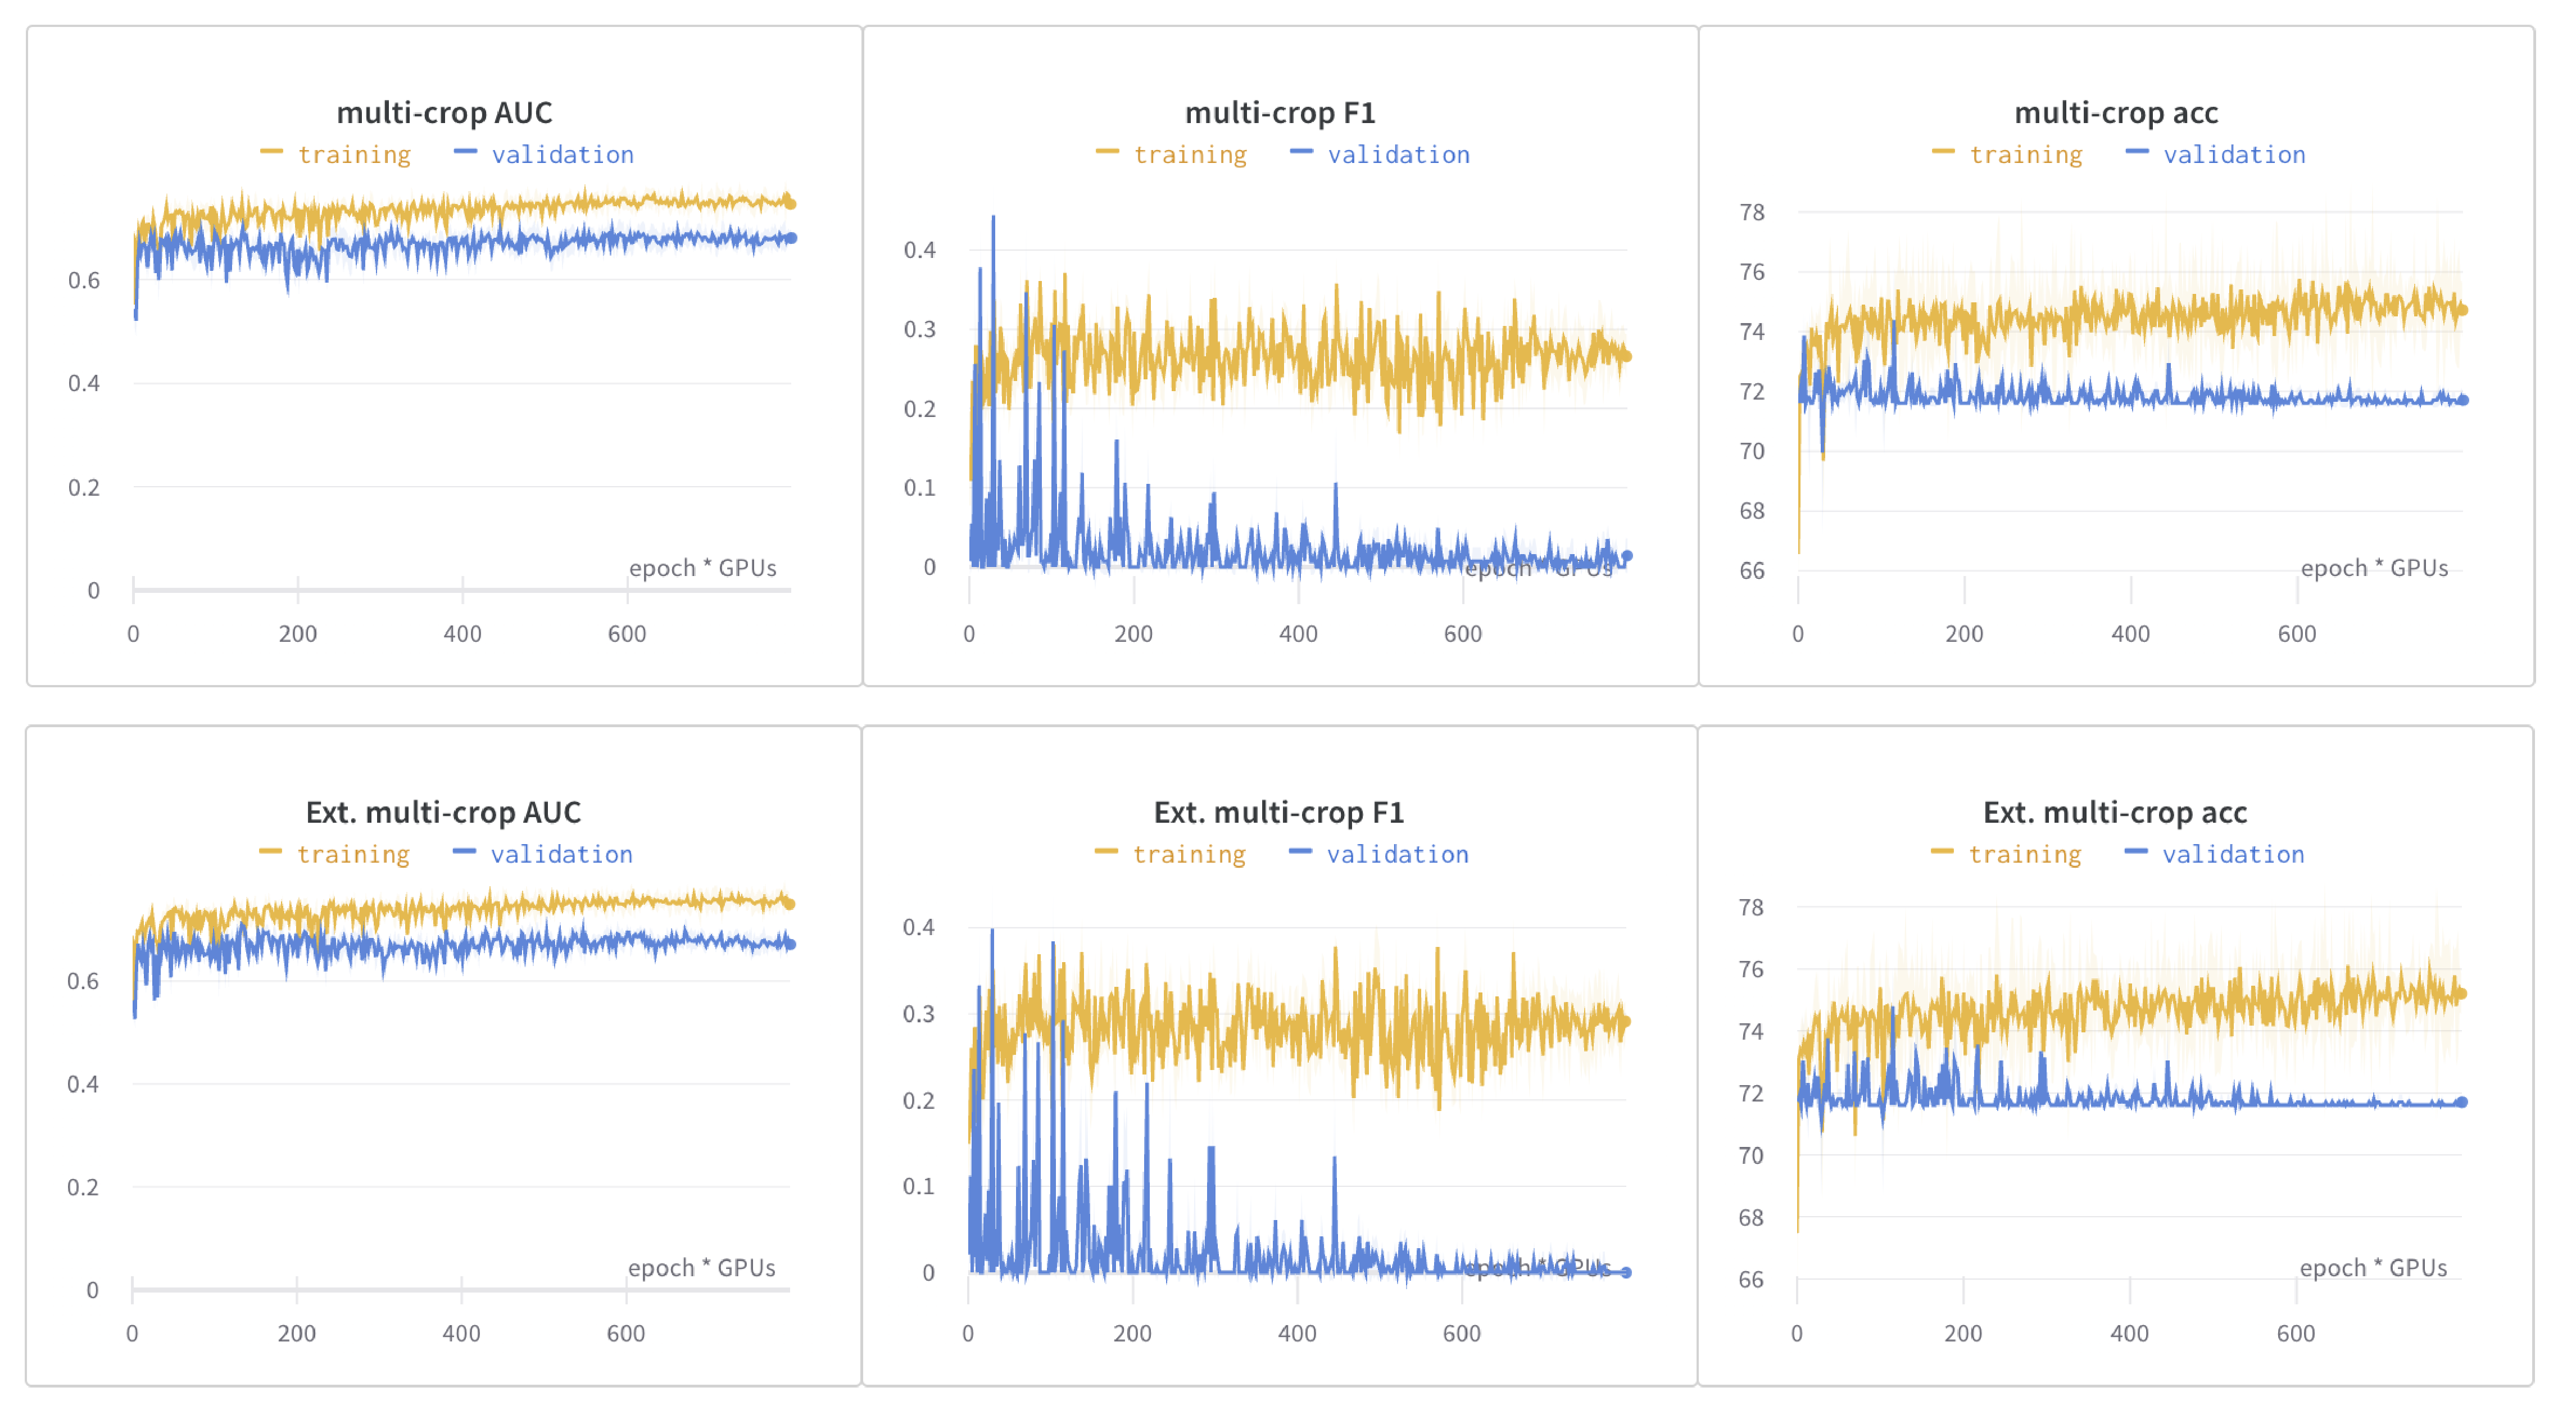
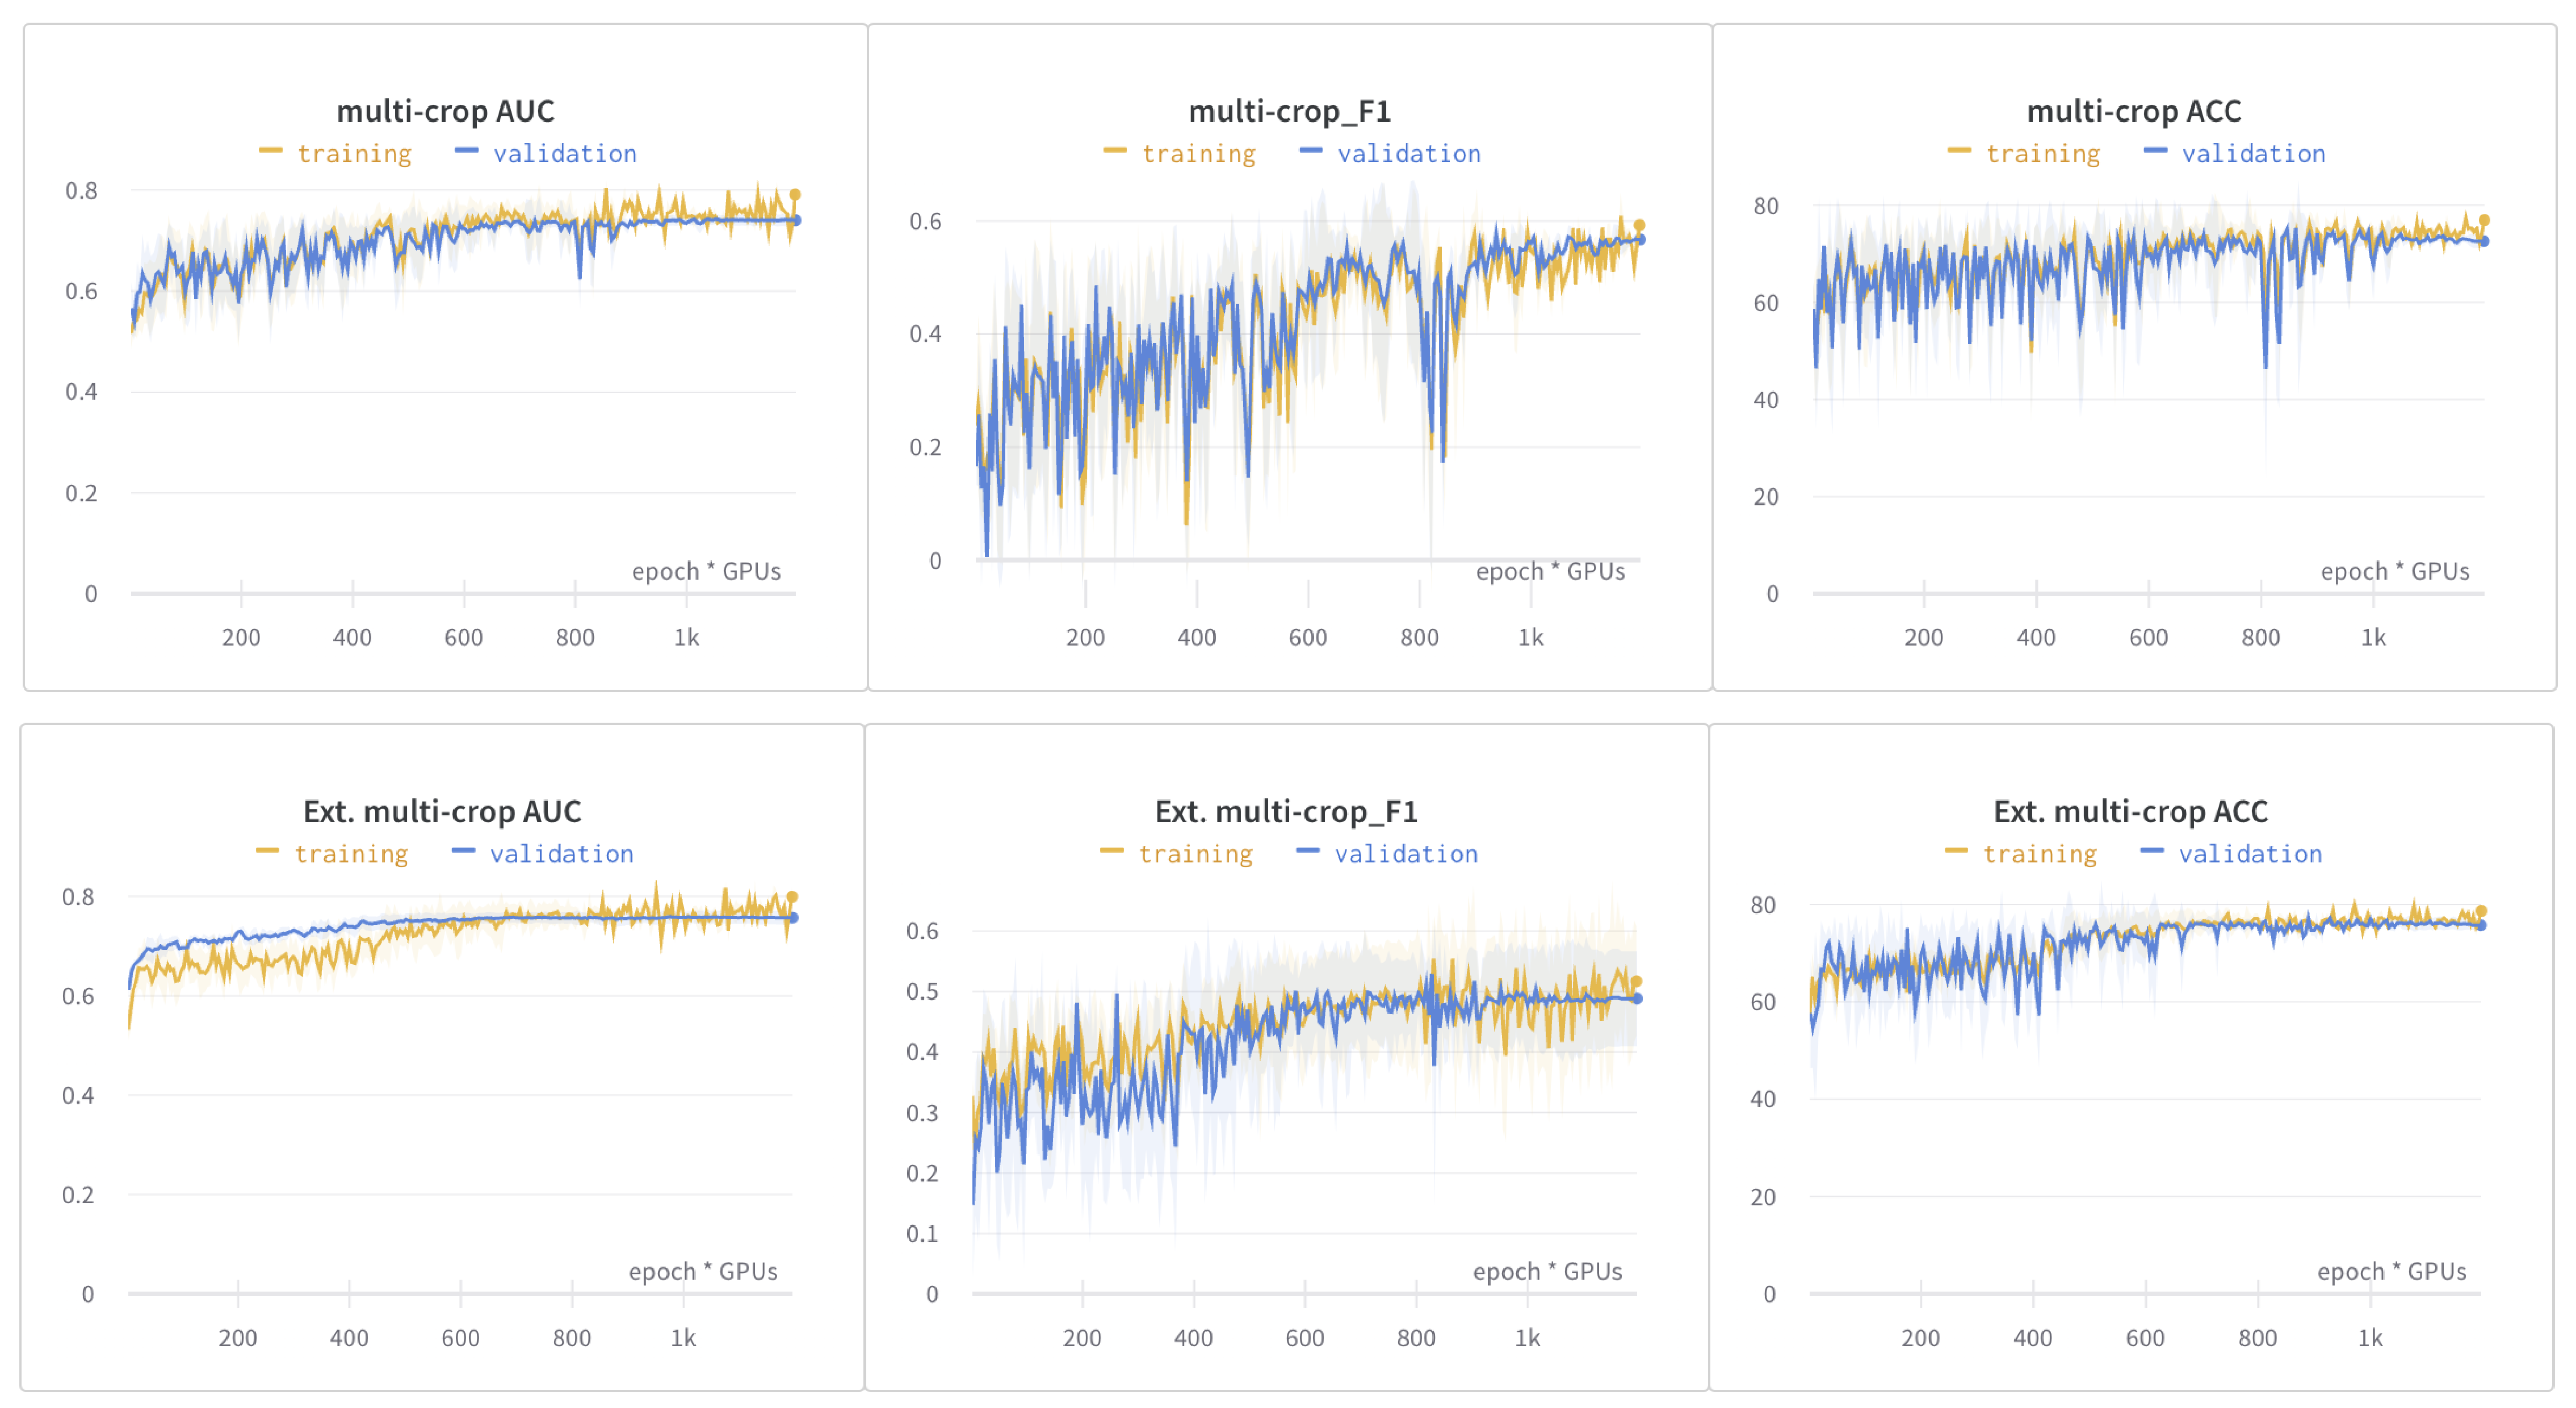
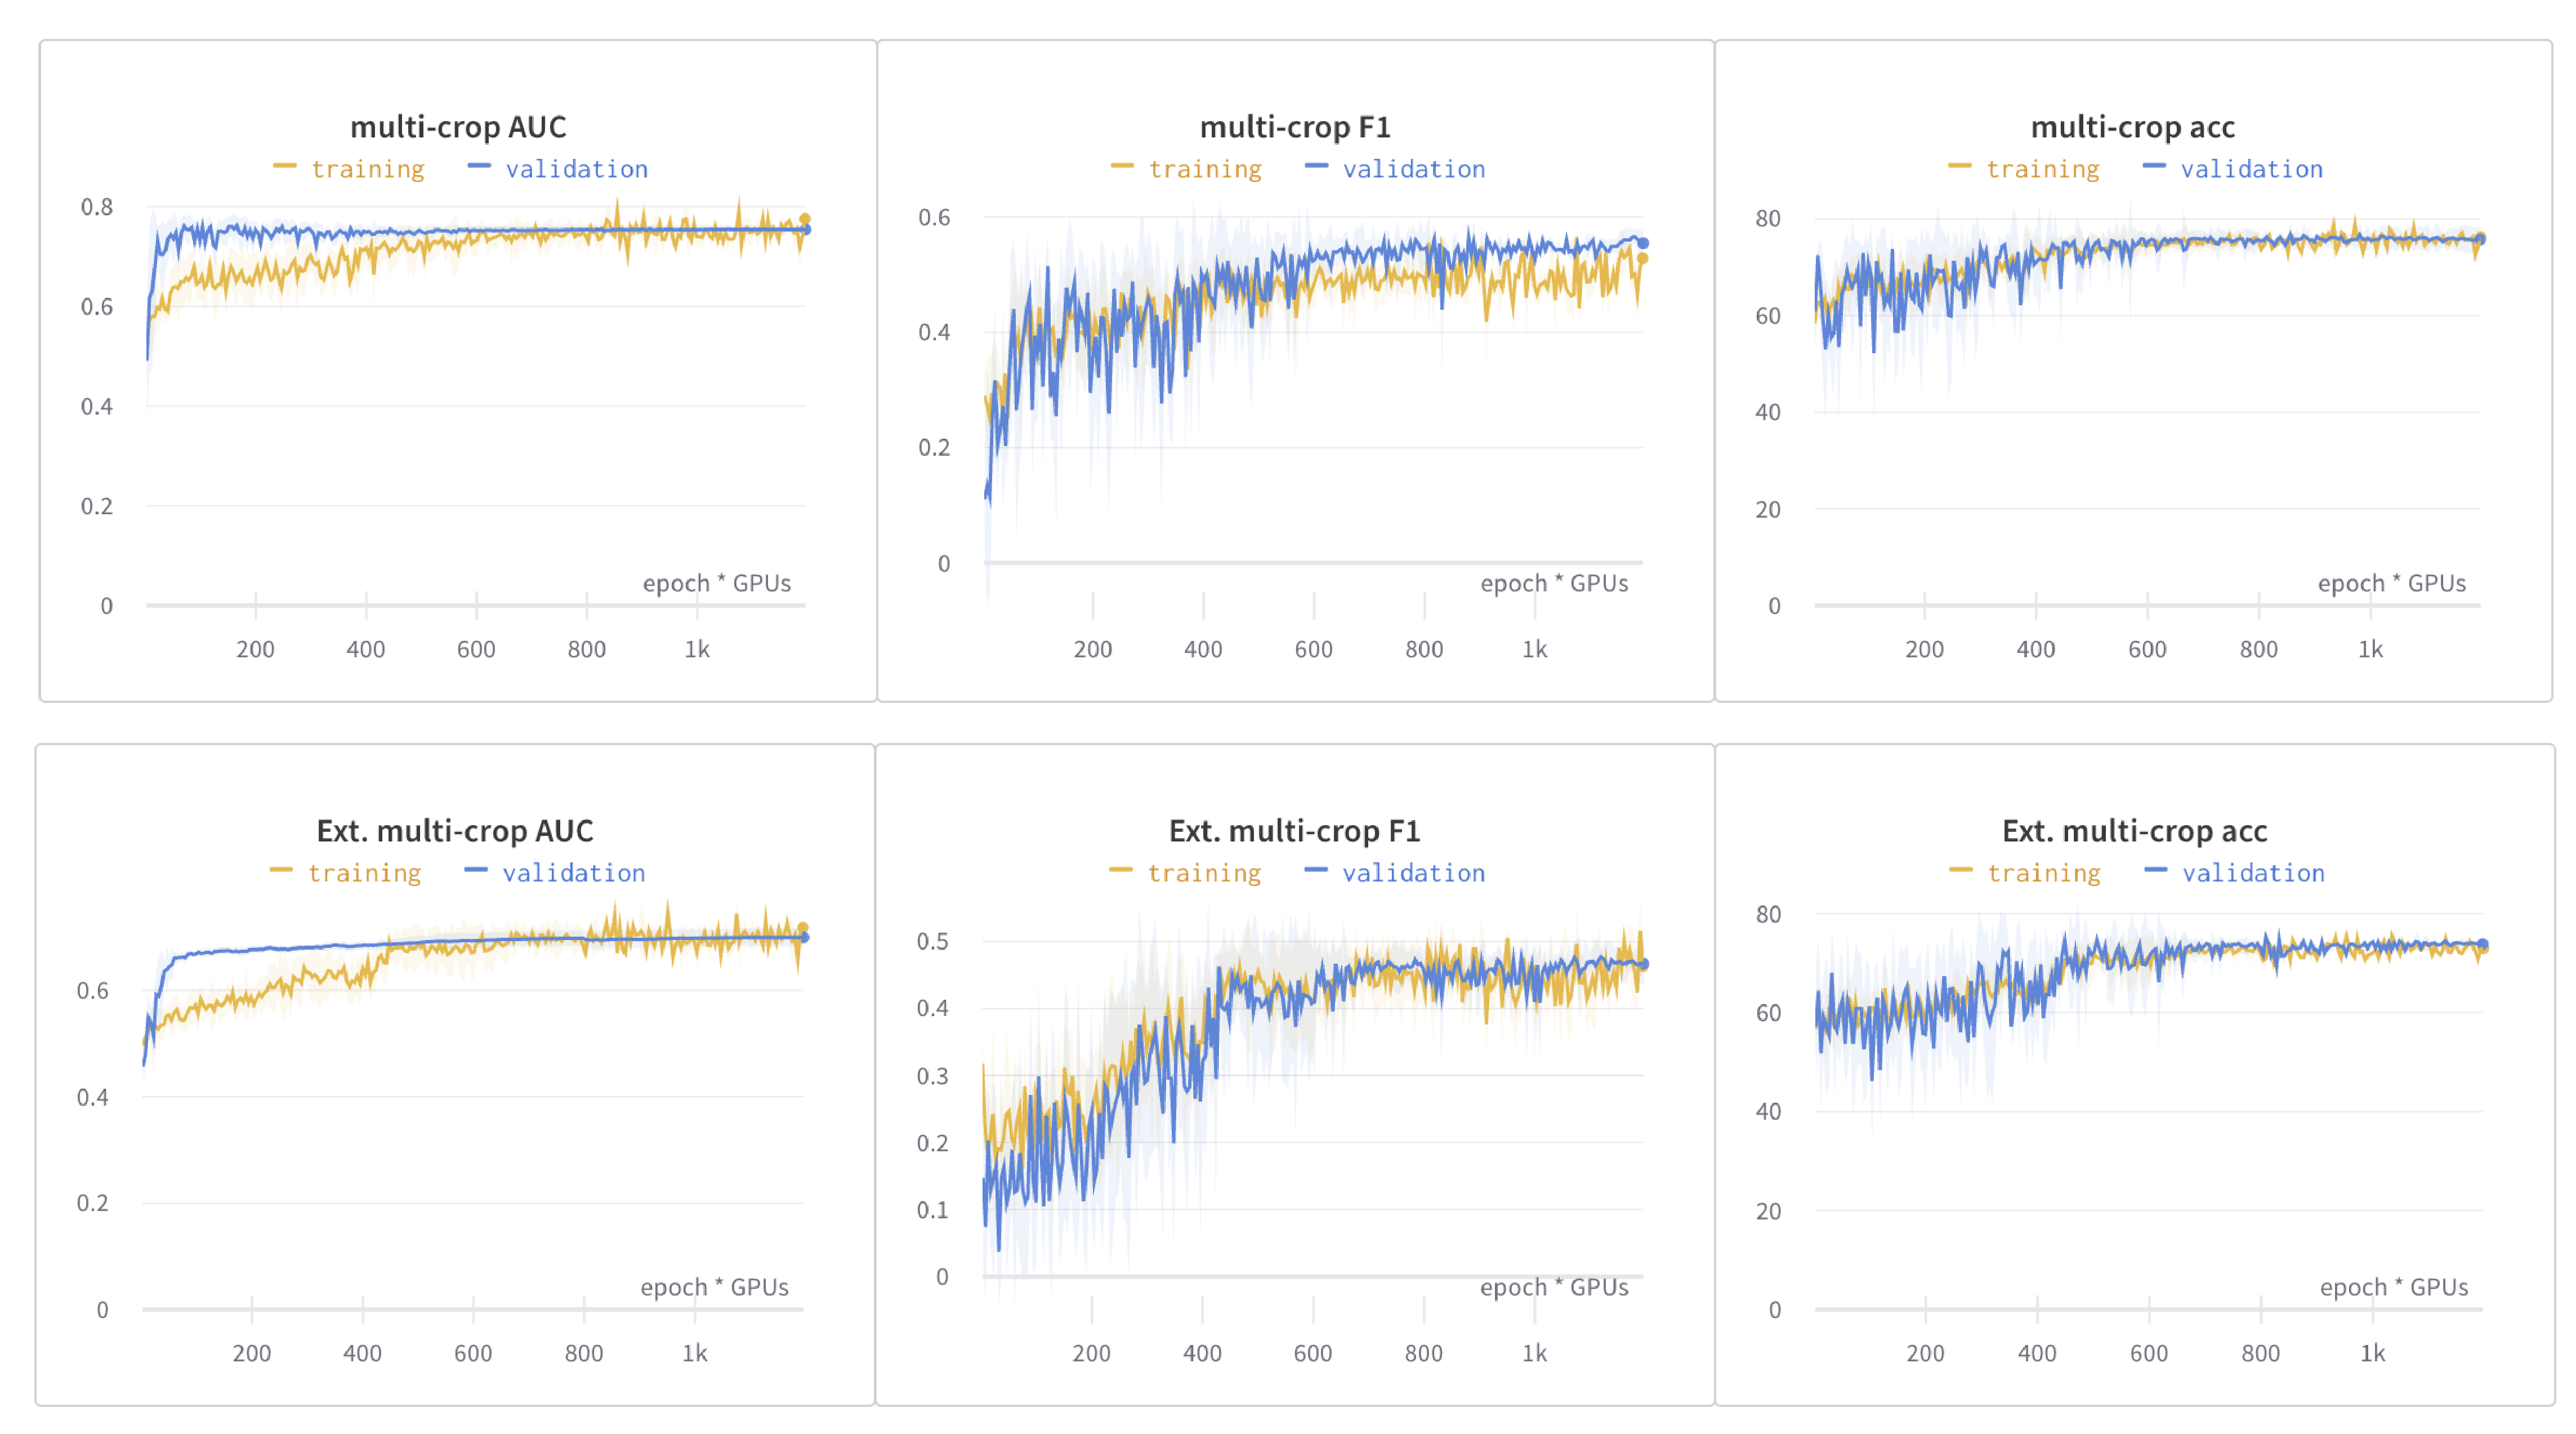
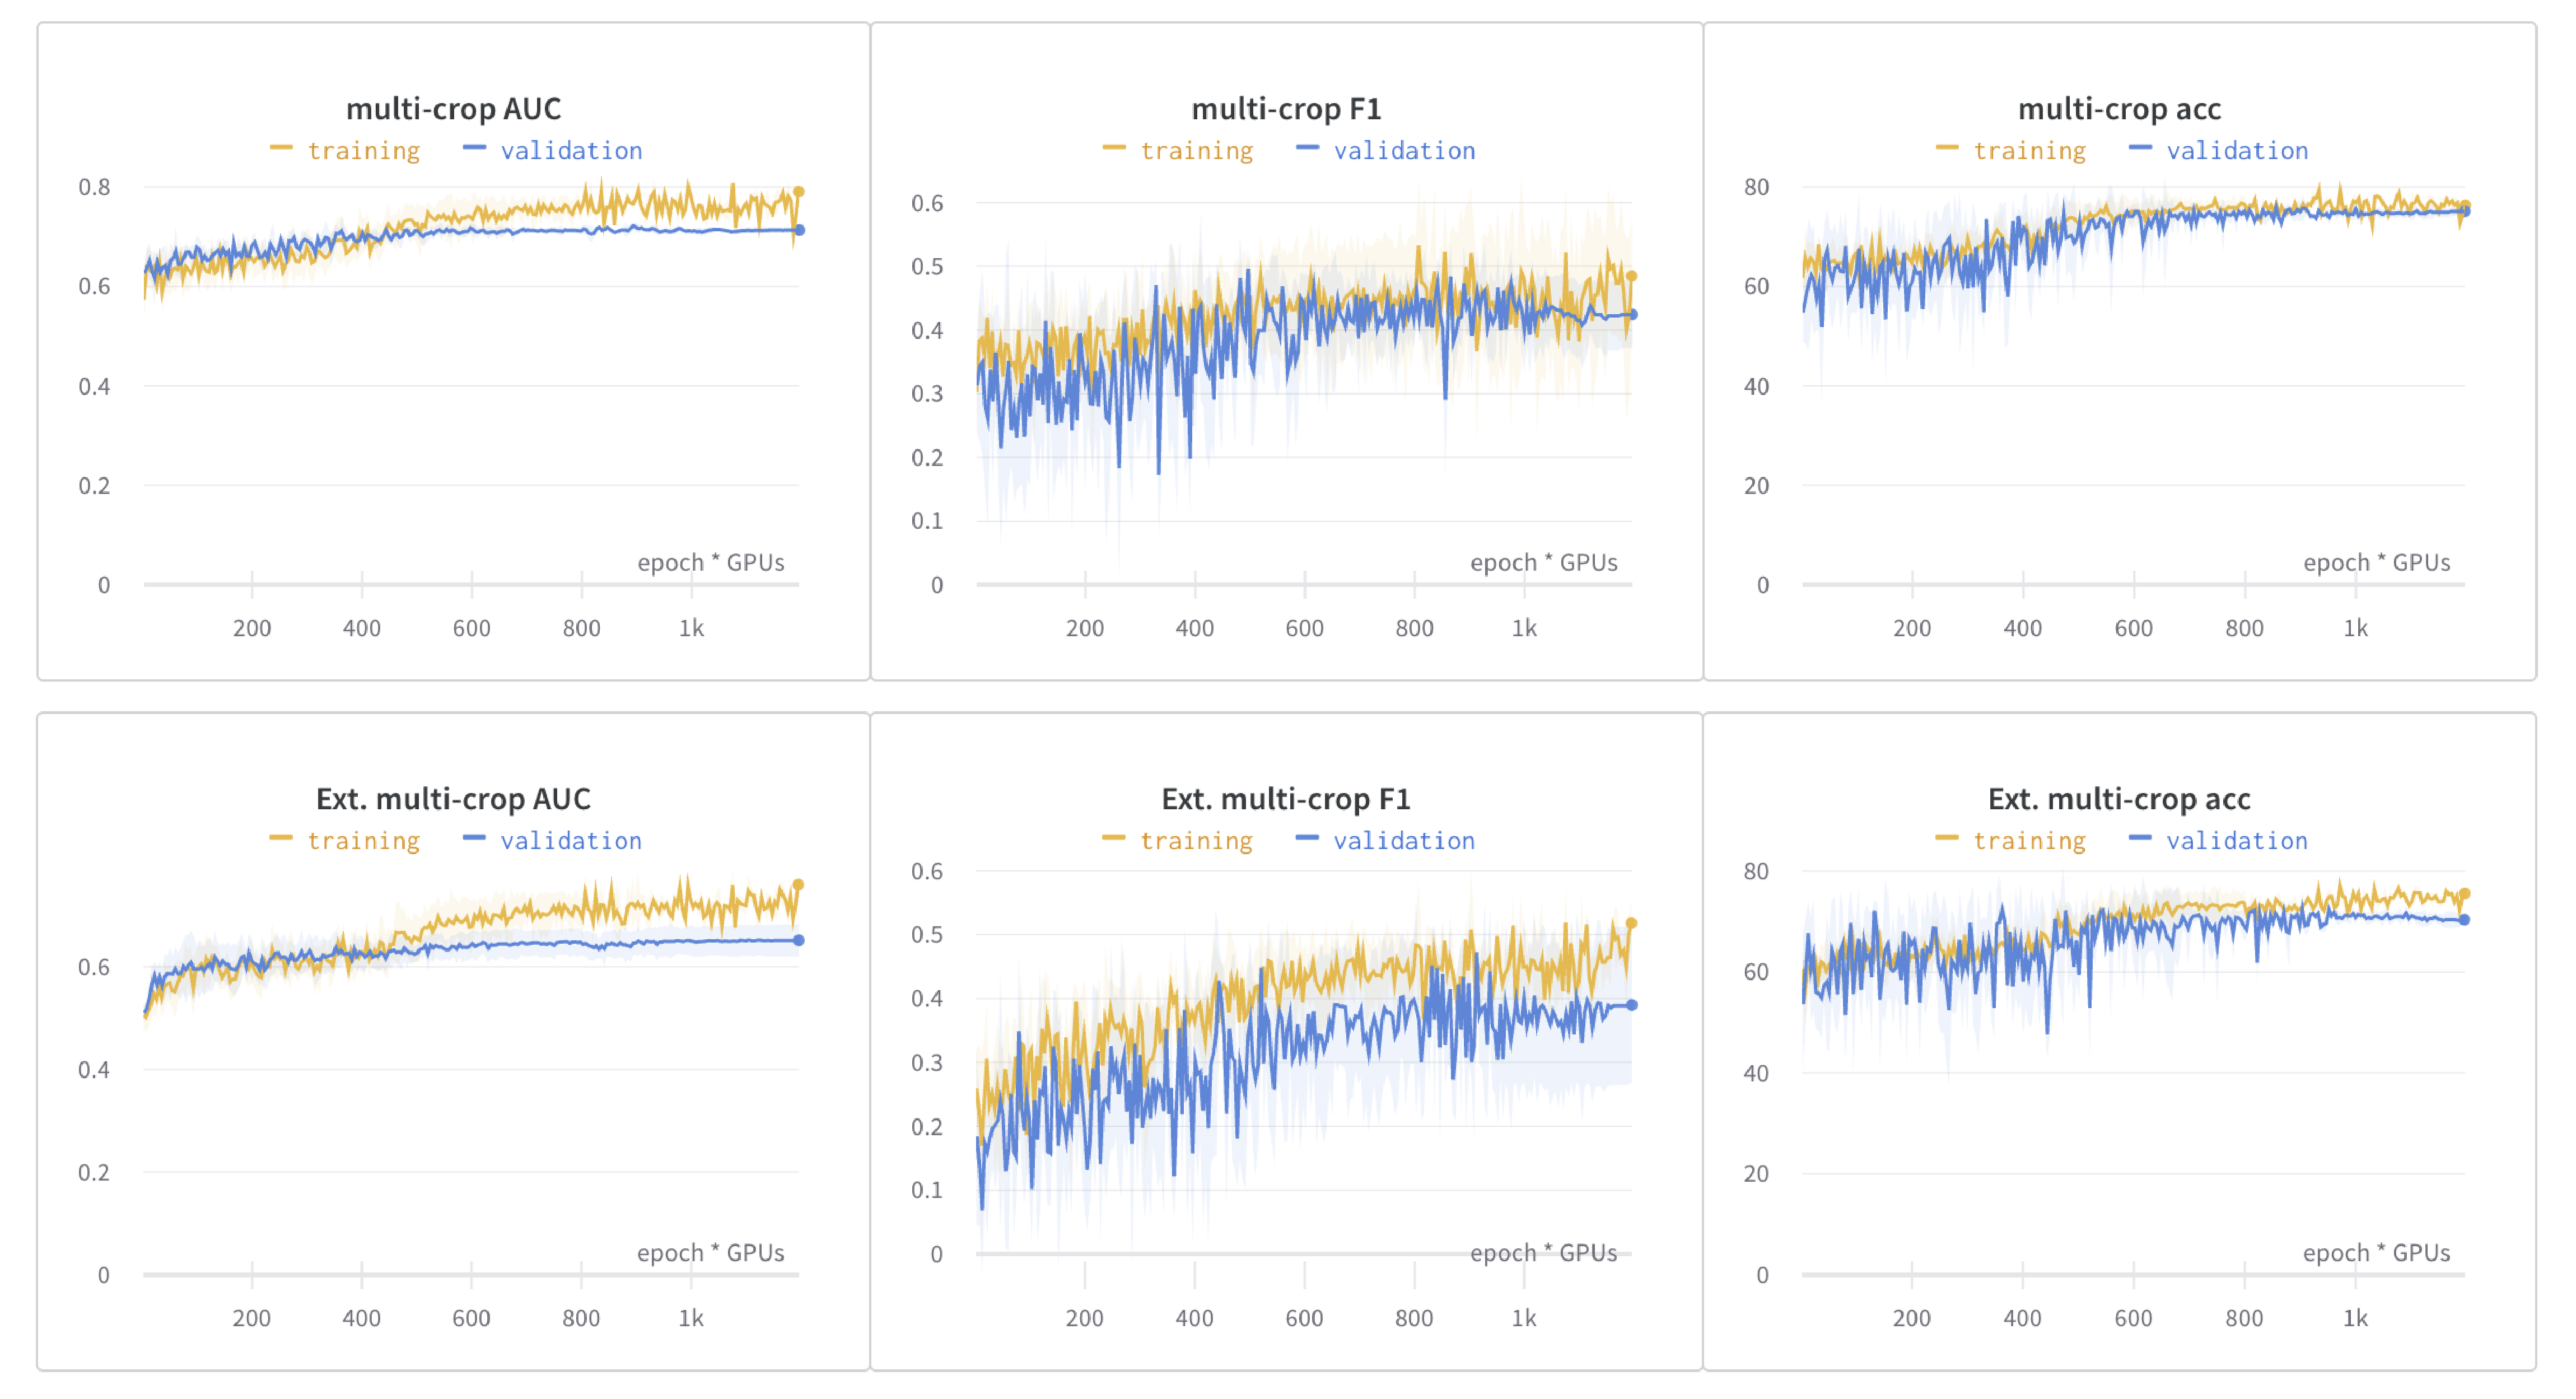
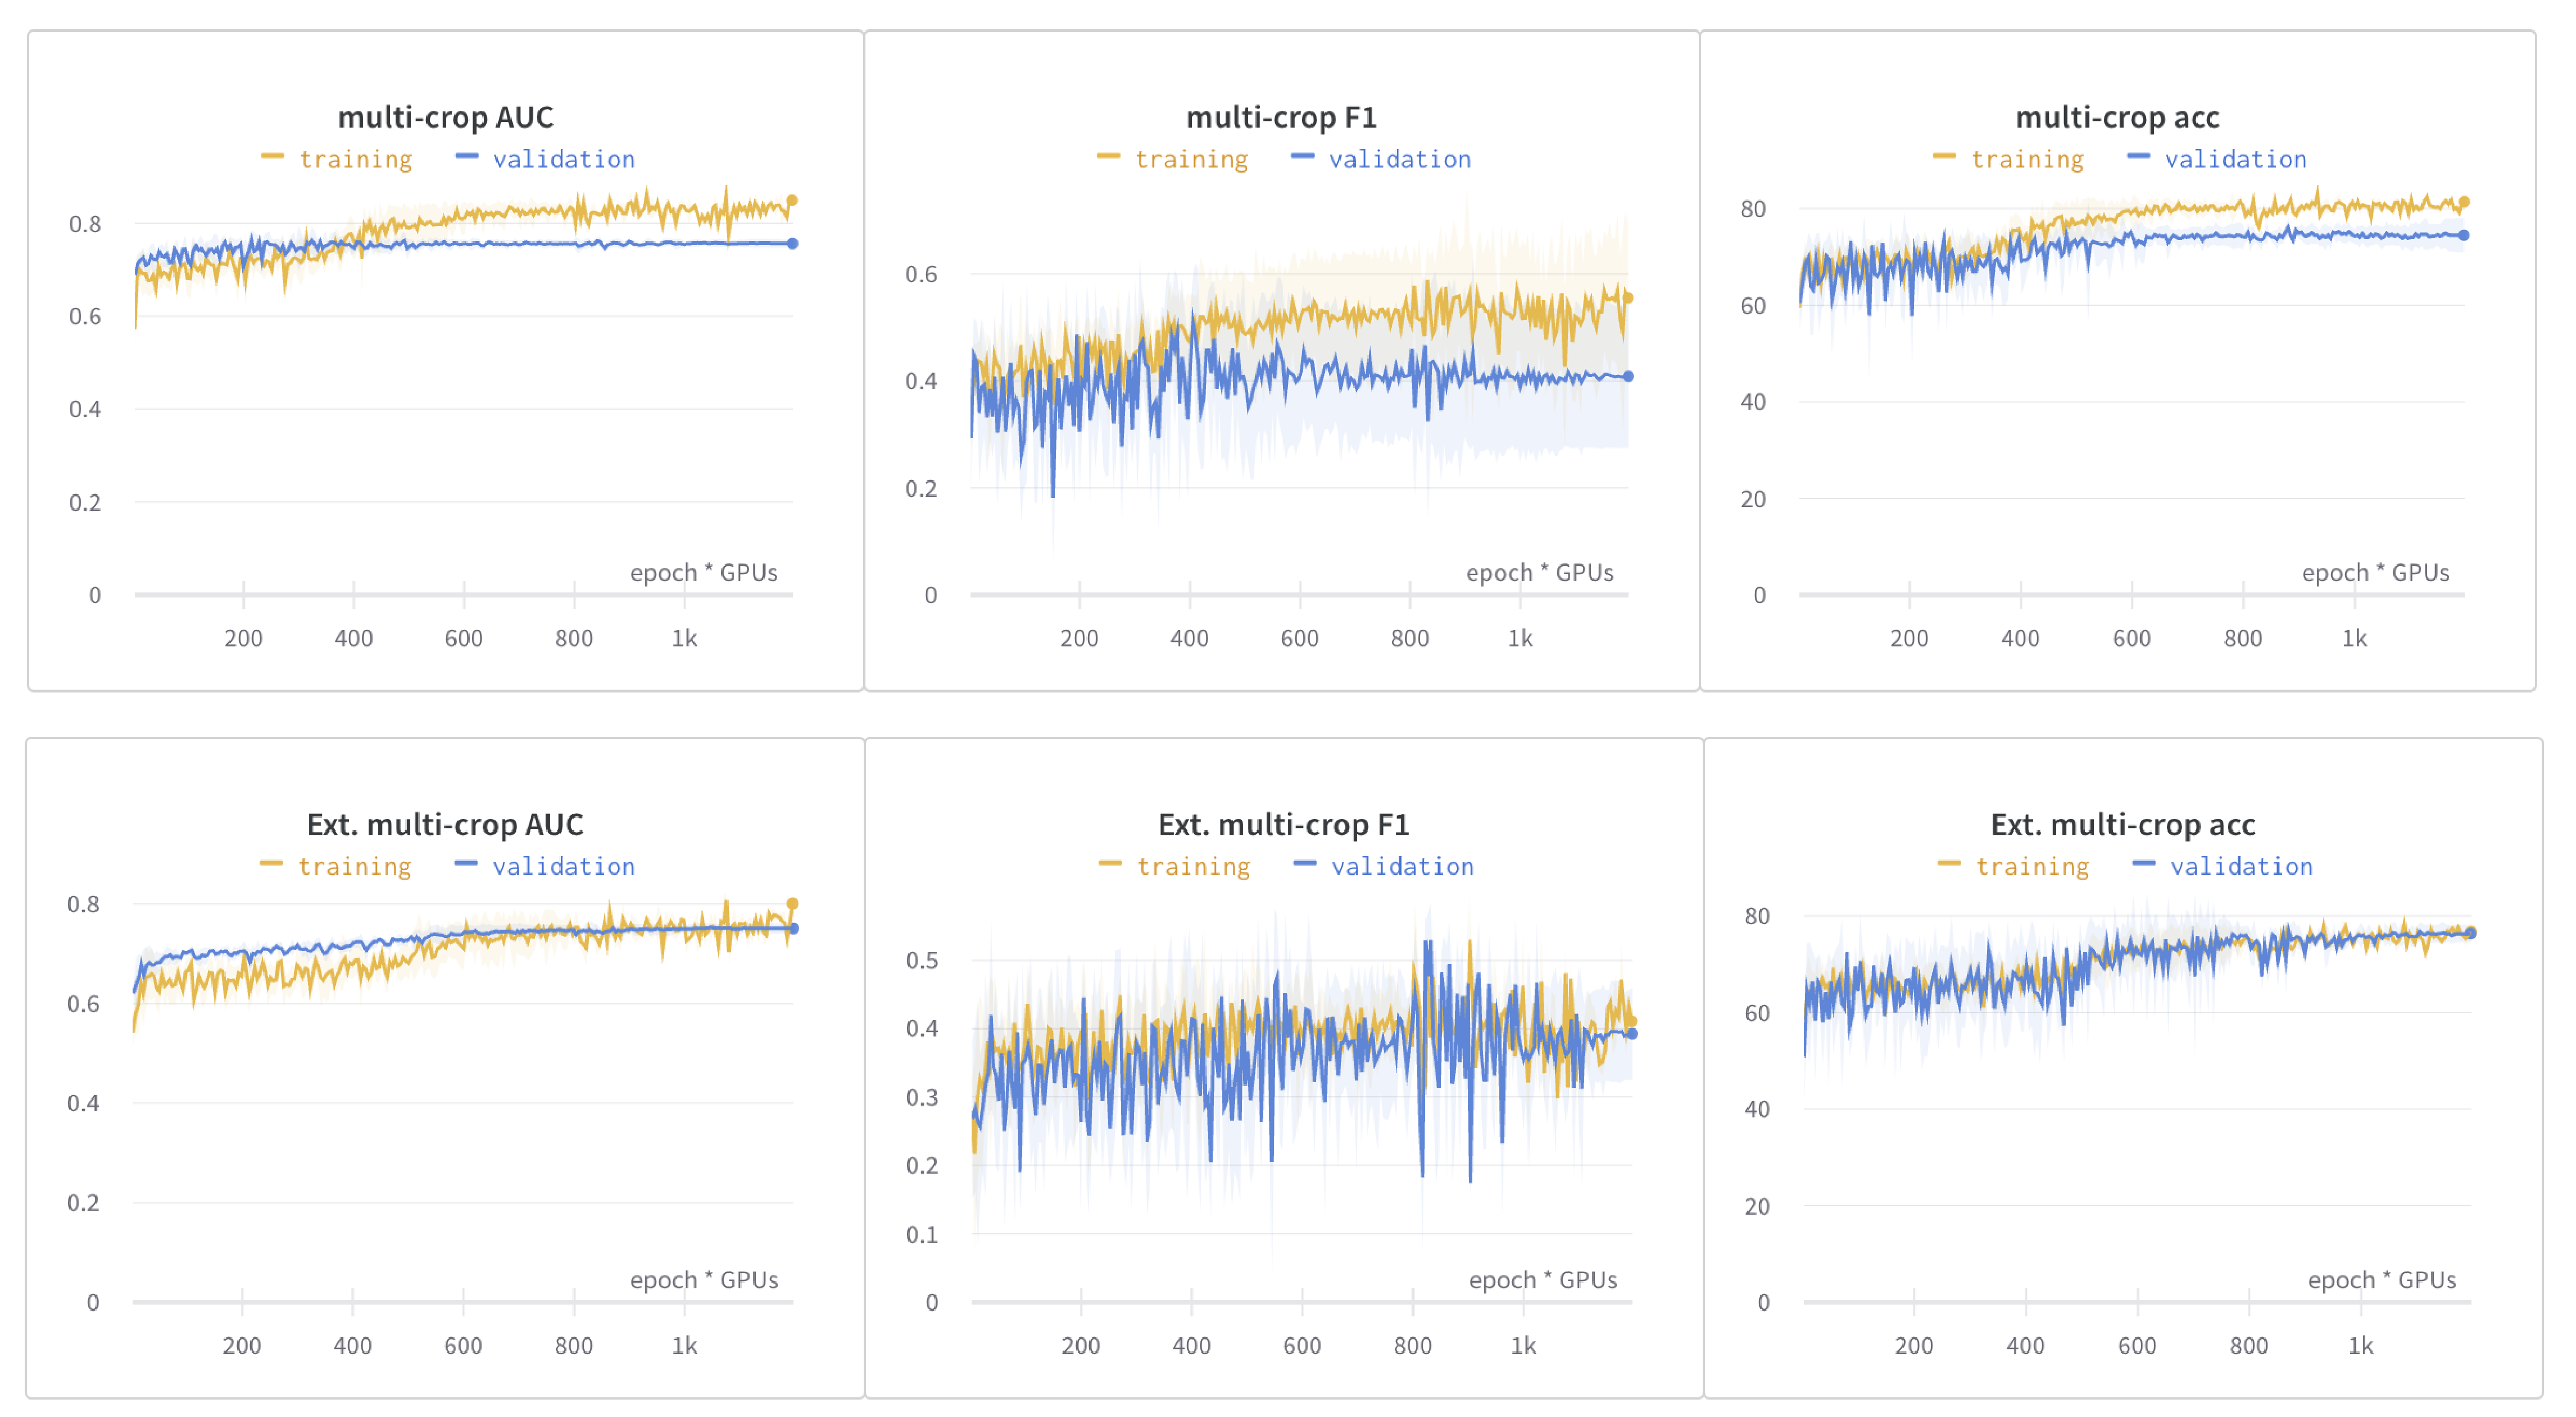
Table LABEL:tab:multicropresult displays the osteoporosis prediction results, measured through AUC, F1-score, and accuracy, for both supervised and self-supervised learning approaches. The first striking observation is the supervised model’s dismal accuracy at 28.74%. With its average accuracy closely mirroring the percentage of osteoporotic patients and a near-zero validation F1-score (Figure 2), there is an implication that the supervised model may consistently lean toward a single decision regardless of the radiographic images fed into it. This result highlights the supervised approach’s marked inability to learn meaningful representations for distinguishing osteoporosis from normal cases. We have thoroughly investigated this issue by employing various tactics, including tuning hyperparameters, applying regularization techniques, and experimenting with data augmentation methods. Despite these efforts, the problem remains unresolved. We attribute this challenge to the intricate interplay between the limited sample size and the complexity of the backbone network, which appears to adversely impact the model’s performance in a supervised context.
On the other hand, all SSL techniques demonstrate decent efficacy in discerning between positive and negative instances, albeit with potential for enhancement. Remarkably, of the four SSL methods, SimCLR in tandem with our refined multi-crop augmentation emerges superior to other baselines, despite not being the latest algorithm. Moreover, our tailored multi-crop technique, applied to radiographic images, yields promising outcomes, underscoring the significance of pinpointing the pertinent bone regions.
In essence, the SSL-centric osteoporosis classification model reports an AUC of 0.827, an F1-score of 0.655, and an accuracy rate of 79.84%. These metrics mark a pivotal leap in osteoporosis imaging classification, affirming the viability of using hand and wrist X-rays for preliminary osteoporosis detection.
4 Conclusion
In this study, we explored the potential of using a self-supervised learning technique with hand and wrist radiographic images to determine osteoporosis status. Utilizing the robust point prompt capabilities of SAM, we effectively produced segmented bone images and implemented our unique extended multi-crop image augmentation method to enhance the model’s predictive accuracy. While this approach is in its early stages, we are actively engaging with tens of thousands of unlabeled radiographs. We believe it holds promise for leading to more precise and user-friendly osteoporosis screenings, which we aim to further develop in the future.
This work was supported in part by the Institute of Information & communications Technology Planning & Evaluation (IITP) grant (No.2020-0-01373, Artificial Intelligence Graduate School Program (Hanyang University)) funded by the Ministry of Science and ICT (MSIT), and in part by the National Research Foundation of Korea (NRF) under Grant NRF-2020R1A2C2101353
References
- Bardes et al. (2021) Adrien Bardes, Jean Ponce, and Yann LeCun. Vicreg: Variance-invariance-covariance regularization for self-supervised learning. arXiv preprint arXiv:2105.04906, 2021.
- Caron et al. (2020) Mathilde Caron, Ishan Misra, Julien Mairal, Priya Goyal, Piotr Bojanowski, and Armand Joulin. Unsupervised learning of visual features by contrasting cluster assignments. Advances in neural information processing systems, 33:9912–9924, 2020.
- Chen et al. (2020) Ting Chen, Simon Kornblith, Mohammad Norouzi, and Geoffrey Hinton. A simple framework for contrastive learning of visual representations. In International conference on machine learning, pages 1597–1607. PMLR, 2020.
- Chou and LeBoff (2017) Sharon H Chou and Meryl S LeBoff. Vertebral imaging in the diagnosis of osteoporosis: a clinician’s perspective. Current osteoporosis reports, 15:509–520, 2017.
- Cuturi (2013) Marco Cuturi. Sinkhorn distances: Lightspeed computation of optimal transport. Advances in neural information processing systems, 26, 2013.
- Gausden et al. (2017) Elizabeth B Gausden, Benedict U Nwachukwu, Joseph J Schreiber, Dean G Lorich, and Joseph M Lane. Opportunistic use of ct imaging for osteoporosis screening and bone density assessment: a qualitative systematic review. Jbjs, 99(18):1580–1590, 2017.
- Hsieh et al. (2021) Chen-I Hsieh, Kang Zheng, Chihung Lin, Ling Mei, Le Lu, Weijian Li, Fang-Ping Chen, Yirui Wang, Xiaoyun Zhou, Fakai Wang, et al. Automated bone mineral density prediction and fracture risk assessment using plain radiographs via deep learning. Nature communications, 12(1):5472, 2021.
- Huang et al. (2023) Shih-Cheng Huang, Anuj Pareek, Malte Jensen, Matthew P Lungren, Serena Yeung, and Akshay S Chaudhari. Self-supervised learning for medical image classification: a systematic review and implementation guidelines. NPJ Digital Medicine, 6(1):74, 2023.
- Khosla et al. (2020) Prannay Khosla, Piotr Teterwak, Chen Wang, Aaron Sarna, Yonglong Tian, Phillip Isola, Aaron Maschinot, Ce Liu, and Dilip Krishnan. Supervised contrastive learning. Advances in neural information processing systems, 33:18661–18673, 2020.
- Kirillov et al. (2023) Alexander Kirillov, Eric Mintun, Nikhila Ravi, Hanzi Mao, Chloe Rolland, Laura Gustafson, Tete Xiao, Spencer Whitehead, Alexander C. Berg, Wan-Yen Lo, Piotr Dollár, and Ross Girshick. Segment anything. arXiv:2304.02643, 2023.
- Lespessailles et al. (2008) E. Lespessailles, C. Gadois, I. Kousignian, J. P. Neveu, P. Fardellone, S. Kolta, C. Roux, J. P. Do-Huu, and C. L. Benhamou. Clinical interest of bone texture analysis in osteoporosis: a case control multicenter study. Osteoporosis International, 19(7):1019–1028, 2008.
- Loshchilov and Hutter (2016) Ilya Loshchilov and Frank Hutter. Sgdr: Stochastic gradient descent with warm restarts. arXiv preprint arXiv:1608.03983, 2016.
- Messina et al. (2015) Carmelo Messina, Michele Bandirali, Luca Maria Sconfienza, Nathascja Katia D’Alonzo, Giovanni Di Leo, Giacomo Davide Edoardo Papini, Fabio Massimo Ulivieri, and Francesco Sardanelli. Prevalence and type of errors in dual-energy x-ray absorptiometry. European radiology, 25:1504–1511, 2015.
- Patel et al. (2020) Bhavika Patel, Adeel Aqil, Osman Riaz, Russ Jeffers, and David Dickson. The 2nd metacarpal cortical index as a simple screening tool for osteopenia. Journal of Bone Metabolism, 27(4):261, 2020.
- Pickhardt et al. (2013) Perry J Pickhardt, B Dustin Pooler, Travis Lauder, Alejandro Muñoz del Rio, Richard J Bruce, and Neil Binkley. Opportunistic screening for osteoporosis using abdominal computed tomography scans obtained for other indications. Annals of internal medicine, 158(8):588–595, 2013.
- Schreiber et al. (2017) Joseph J Schreiber, Robin N Kamal, and Jeffrey Yao. Simple assessment of global bone density and osteoporosis screening using standard radiographs of the hand. The Journal of Hand Surgery, 42(4):244–249, 2017.
- Sebro and De la Garza-Ramos (2022) Ronnie Sebro and Cynthia De la Garza-Ramos. Machine learning for opportunistic screening for osteoporosis from ct scans of the wrist and forearm. Diagnostics, 12(3):691, 2022.
- Watts (2004) Nelson B Watts. Fundamentals and pitfalls of bone densitometry using dual-energy x-ray absorptiometry (dxa). Osteoporosis international, 15:847–854, 2004.
- Yamamoto et al. (2020) Norio Yamamoto, Shintaro Sukegawa, Akira Kitamura, Ryosuke Goto, Tomoyuki Noda, Keisuke Nakano, Kiyofumi Takabatake, Hotaka Kawai, Hitoshi Nagatsuka, Keisuke Kawasaki, et al. Deep learning for osteoporosis classification using hip radiographs and patient clinical covariates. Biomolecules, 10(11):1534, 2020.
- You et al. (2017) Yang You, Igor Gitman, and Boris Ginsburg. Large batch training of convolutional networks. arXiv preprint arXiv:1708.03888, 2017.
- Zheng and Makrogiannis (2016) Keni Zheng and Sokratis Makrogiannis. Bone texture characterization for osteoporosis diagnosis using digital radiography. 2016 38th Annual International Conference of the IEEE Engineering in Medicine and Biology Society (EMBC), 2016.
Appendix A Multi-crop data augmentation strategy
The multi-crop data augmentation strategy, as proposed in Caron et al. (2020) involves utilizing two standard resolution global crops along with additional low-resolution crops that capture local regions of the image. The authors demonstrate that this augmentation strategy enhances the performance of various self-supervised learning models while maintaining memory efficiency. In all our pretext tasks, We employ the generalized loss term proposed in Caron et al. (2020) for both strategies as follows:
In SwAV case, we regard as , which is a code computed from the iterative Sinkhorn-Knopp algorithm (Cuturi, 2013). The formula represents a loss function used in our pretext tasks. Here’s a breakdown of its components:
-
•
are embeddings or feature representations of different views of the same data.
-
•
is the overall loss calculated based on these embeddings.
-
•
The outer summation iterates over two indices, typically representing pairs of global views.
-
•
The inner summation iterates over all the embeddings within each local view.
-
•
is an indicator function that equals 1 if is not equal to (i.e., it ensures that we only consider embeddings from different views for comparison).
-
•
represents a similarity measurement between the embeddings and .
