Data-driven Spatio-Temporal Scaling of Travel Times for AMoD Simulations
Abstract
With the widespread adoption of mobility-on-demand (MoD) services and the advancements in autonomous vehicle (AV) technology, the research interest into the AVs based MoD (AMoD) services has grown immensely. Often agent-based simulation frameworks are used to study the AMoD services using the trip data of current Taxi or MoD services. For reliable results of AMoD simulations, a realistic city network and travel times play a crucial part. However, many times the researchers do not have access to the actual network state corresponding to the trip data used for AMoD simulations reducing the reliability of results. Therefore, this paper introduces a spatio-temporal optimization strategy for scaling the link-level network travel times using the simulated trip data without additional data sources on the network state. The method is tested on the widely used New York City (NYC) Taxi data and shows that the travel times produced using the scaled network are very close to the recorded travel times in the original data. Additionally, the paper studies the performance differences of AMoD simulation when the scaled network is used. The results indicate that realistic travel times can significantly impact AMoD simulation outcomes.
I Introduction
The last decade saw the widespread emergence of Mobility-on-Demand (MoD) services. Using smartphone applications, the customers in these services can seamlessly request rides from origin to destination. With advancements in autonomous vehicle (AV) technology, the AVs based MoD (AMoD) services are also on the horizon.
Seeing the potential arrival of AMoD services, there has been a steady increase in research on the potential benefits of AVs in MoD services. A major advantage of AMoD services is the central control of the whole fleet which leaves the allocation of customers to vehicles entirely on the central fleet controller (FC). Many researchers have used agent-based simulations to evaluate the efficiency of different FCs. These simulation studies often use the customer trips data of the current MoD or Taxi services to study the scenario where the fleet consists of only AVs. They report a significant performance improvement by introducing AVs instead of human drivers [1, 2].
However, the agent-based simulation must be as realistic as possible for these outcomes to be reliable. In this regard, the accuracy of the network travel times plays a significant role. Since the actual state of the city network corresponding to the customer data used is usually unavailable, researchers use different techniques to replicate realistic travel times. To have a better overview of the literature, the following compares various AMoD studies from the perspective of travel time estimation. They can be mainly divided into three categories:
-
•
Fixed travel time: This assumes that the travel time does not change over time. This includes directly using the free-flow speeds from available maps data like OpenStreetMap (OSM) [3, 4] or multiplying the whole network by a common factor to replicate different hours of the day, such as peak and off-peak hours [5] or average travel speed [1, 6, 7].
-
•
Simulation-based methods: These studies directly use the microsimulators for AMoD simulation, such as Aimsun [8], or use their outputs as a traffic state estimation to be used in a simpler agent-based simulation [2, 9]. The microsimulation is first calibrated for realistic travel times using a third data source such as the data of loop detectors. Usually, the calibration data is not easily available and does not necessarily correspond to the time and day of the customer data simulated.
-
•
Data-driven methods: These studies utilize historical data to estimate time-dependent scaling factors without a microsimulator. They can be based on separate real data of past trips in the city [10] or using average scaling factors derived from the same customer trips as used for AMoD simulation [11]. Some studies also derive zone-specific factors derived from MFD estimated by loop detector data [12].
However, these three methods have their flaws: fixed travel time is not able to capture the temporal dynamics, simulation-based methods are computationally expensive, and researchers often do not have access to the data required for calibration, and data-driven approaches often do not consider the changing link-level travel times. Furthermore, since many studies do not aim to reproduce the travel times of the original trips, they can lead to a significant deviation from the trip travel times recorded in the historical customer data, which can ultimately impact the AMoD simulation results.
In contrast to the above, the current research suggests that a significantly more realistic simulation can be produced by spatio-temporal scaling of the network travel times using customer data. Using customer data is not a new idea: [13, 14] have used the customer data (OD and trip duration) to estimate the travel time over a period using heuristics by segmenting the whole path into roads between intersections. Unlike these methods, the paper first divides the historical data into fixed periods. Then it solves an optimization problem for each period such that most customers have the exact travel times between the origin and the destination as recorded in the data set. Thus, each customer trip serves as a sample of the network state at that specific time of the day. The aim is to produce a network state similar to when the data was recorded.
II Methodology
In literature, the performance of AMoD services is often evaluated in agent-based simulation. The customer requests are either generated using artificial data or using real trip data of existing alternatives to the AMoD services like taxi services or MoD services. The current paper assumes the latter as it is not possible to derive realistic network travel times using artificial trips.
This paper argues that the same data used for simulating the AMoD services can also be used to scale the link-level network travel times. This improves the realism of the entire simulation and makes the results more reliable. Typically, the data providers of real trips use various levels of spatio-temporal aggregation to make the data anonymous before its publication. The technique used in the paper assumes a moderate level of data anonymity where the data set at least provide the following information: 1) the exact coordinates of the trip origin and destination locations 2) the total trip time and 3) the total trip distance. However, the actual trip trajectory is removed from the data.
The fundamental concept here is that for reliable AMoD simulation results, the network travel times must be scaled such that any trip on the scaled network have a similar travel time as recorded in the original data. Here the network used for the AMoD simulation is assumed to be rather simpler: all lanes on the link between two nodes are assumed to have the same speed and the vehicles traverse the edges independent of the other vehicles on the link. However, the network is still assumed to consist of a directed graph, and thus, each link can have different speeds in opposite directions.
The following sections describe an often-used scaling approach used in literature for the AMoD simulation followed by the spatio-temporal scaling method presented in the current paper.
II-A Mean Factor Method (MFM)
The MFM scales the network travel times dynamically according to the historical trip data. However, it only considers the temporal aspect for this purpose. The historical trip data are divided into periods of using the trip start times. Then, for a single temporal group, the MFM scales all of the edges by a common scaling factor [11, 15]. It first calculates the sum of the travel times of all historical trips within a single period, represented by . Then the sum of the travel times for all trips is calculated using the free-flow speeds of the network, represented by . The travel times of all the edges of the network are then multiplied by the mean travel time factor:
| (1) |
MFM has the advantage that a single travel time matrix can be used for the entire simulation; the matrix is loaded at the beginning of the simulation and multiplied by the corresponding for the current simulation time. However, since it uses the sum of travel times for scaling, the operational regions with the highest number of trips can weigh significantly higher than those in other regions. Thus, it represents the actual travel times in high-demand areas much better than in lower-demand areas. Additionally, it fails to capture the speed variation based on spatial features.
II-B Spatio-Temporal Scaling Method
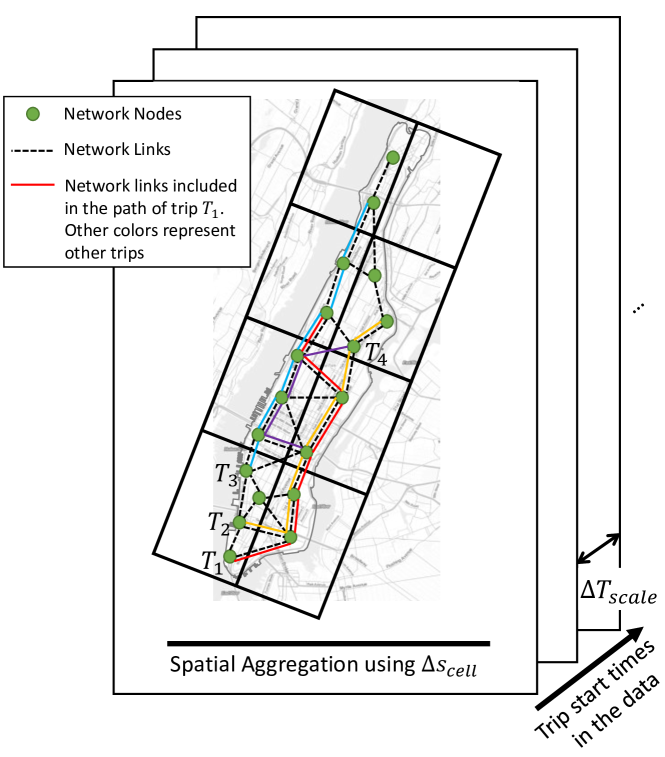
In contrast to the MFM method which only uses temporal information for the scaling of travel times, the spatio-temporal scaling method additionally uses spatial information for this purpose. This allows a more accurate link-specific scaling of the network by solving an optimization problem for each . It is fundamentally based on the concept that each historic trip provides a snapshot of the network state at that particular time of the day. If multiple trips are grouped together using temporal information, i.e., a period of , these trips can potentially provide multiple observations of the overlapping links on their paths from origin to destination. The paper develops two variants of the scaling method based on the objective function used for optimization.
The first method is referred to as the squared scaling method (SSM). It divides the whole operational area into regions using a regular grid of cell size . Let represent the edges of the network used for AMoD simulation, represent the free-flow travel time of an edge and represent the edges that are entirely within region . Some of the edges may be located in multiple regions, denoted by . For each of these edges , the set represents the regions the edge belongs to. Afterward, it calculates the shortest paths for each of the trips within the period . Let the set represent all the trips within the period , then the shortest path of a trip consists of a sequence of network edges, represented by . The main purpose of the method is to scale the free-flow travel time of each edge in for all such that the travel times comes as close as possible to the historical travel time for . If two or more trips in have the same origins and destinations, then the mean of the travel times of these trips is used.
Let represent the union of all edges in the shortest paths of , i.e., the union of for all . Then, as the first step, the method only scales the edges in by solving the following optimization problem.
| (2a) | |||||
| s.t. | (2b) | ||||
| (2c) | |||||
where is a vector of linear variables used for scaling each edge within and is the maximum allowed travel time on the edge. is calculated using the edge length () and a parameter for the minimum travel speed allowed on the edge (), i.e., .
After calculating the scaling factors for the edges in , the SSM scales the rest of the edges in . These additional edges are divided into two categories. First, the ones belonging to a single region (i.e., belonging to ) are scaled using the mean of the scaling factors already calculated in the first step for that region, i.e., they are scaled by the mean of all . Second, the edges that fall within multiple regions are scaled using the mean of the scaling factors for all edges within those zones, i.e., for an edge it is scaled by the mean of all . The main assumption is that the scaling factor should be on a similar scale in the immediate surrounding of the scaled edges . If any edge is still not scaled using these two approaches, then they are scaled using the mean of .
The second spatio-temporal scaling method uses the same approach as SSM; however, instead of using squared error for the objective function, it uses absolute error. Thus, the method is referred to as the absolute scaling method (ASM) and Eq. 2a is replaced with the following:
| (3) |
II-C AMoD Simulation Framework
The impact of the scaling methods is tested in an agent-based simulation framework FleetPy [16]. The framework consists of three main types of agents: customers, a fixed fleet of vehicles , and an AMoD operator. The AMoD operator is responsible for assigning vehicles to dynamically added customer requests. The same historic data used for scaling the network travel times are used for generating the AMoD customer requests. Each customer requests a ride from the origin location to the destination location at time . Let represent the travel distance from to . The AMoD operator tries to maximize the monetary profit for the whole simulation period, which consists of the base fare charged per served customer (), the variable fare charged per unit distance with a customer on board (), variable operational cost per unit distance per vehicle () and fixed daily vehicle cost per vehicle . Thus, the profit for the entire simulation period is given as:
| (4) |
where is the set of all customers served and is the number of evaluation days. is the total distance driven by vehicle .
The current paper uses the method of [11] for the assignment of vehicles to customers: the AMoD operator accumulates the requests into batches using the period followed by solving an optimization problem that maximizes Eq. 4 for the current batch. It also includes a hard constraint such that the customers must be picked up within a maximum waiting period of . Within the assignment problem, the en-route vehicles are considered from the time and location of their availability. Any customer that is not assigned to a vehicle is removed from the future customer batches. The paper does not consider re-optimization of the assignment problem; once a vehicle is assigned to a customer its path remains fixed. For simplicity, the paper does not consider pooling multiple requests into a single ride. The simulation framework additionally uses a repositioning approach where the excess vehicles are equally distributed among regions after a period of .
III Case Study
III-A Experimental Setup and Trips Data
The widely used open-source New York City (NYC) data is used to study the impact of scaling methods on the AMoD simulations. The NYC data from 6 to 7 June 2016 is used for this purpose. The NYC data from 2016 provides the exact coordinates of trip origins and destinations. The data also records the trip’s total travel time and distance using which the possible false trips are removed that have speeds less than 1 mph or more than 55 mph. Since most of the trips are within Manhattan, only the trips that start and end in Manhattan are considered.
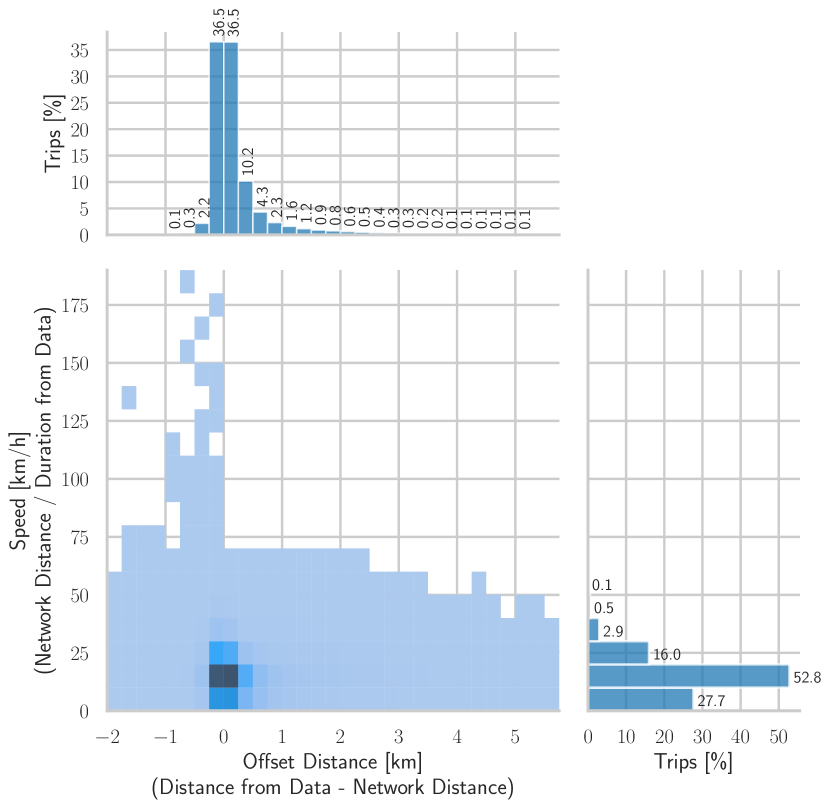
Next, since both SSM and ASM methods require trip trajectories for scaling, the paper suggests that the trajectories of the shortest-distance paths calculated using OSM network could be used for this purpose. As shown in Fig. 2, for 73% of the trips, the difference between the distance of the shortest-distance path from the OSM network and the recorded trip distance is less than 250 m; for 92.3% of the trips, it is less than 1 km. Furthermore, to check if the calculated trajectories also have a meaningful distance in comparison to the recorded travel times, the speed of the trips is calculated using OSM distances and recorded trip duration. The vast majority of the trips are within a reasonable speed range; a very small number of trips have speeds higher than 55 mph (88.5 km/h) for shortest-path trajectories which are also removed. These statistics indicate that the shortest-path routes are very close to the original routes taken by the trips.
For the AMoD simulation, the objective function variables are set as (0.5$/served customer, 0.5$/km, 0.25$/km, 25$/vehicle per day). , and are set to 30 seconds, 6 minutes and 30 minutes, respectively. For the scaling methods, of 30 minutes is used.
III-B Results
| Percentile (in minutes) | ||||||||
|
5% | 25% | 50% | 75% | 95% | Maximum | ||
| MFM | 0.23 | 1.22 | 2.74 | 5.26 | 11.99 | 71.14 | ||
| SSM | 0.04 | 0.49 | 1.23 | 2.47 | 5.86 | 59.66 | ||
| ASM | 0 | 0.03 | 0.76 | 2.16 | 6.45 | 69.66 | ||
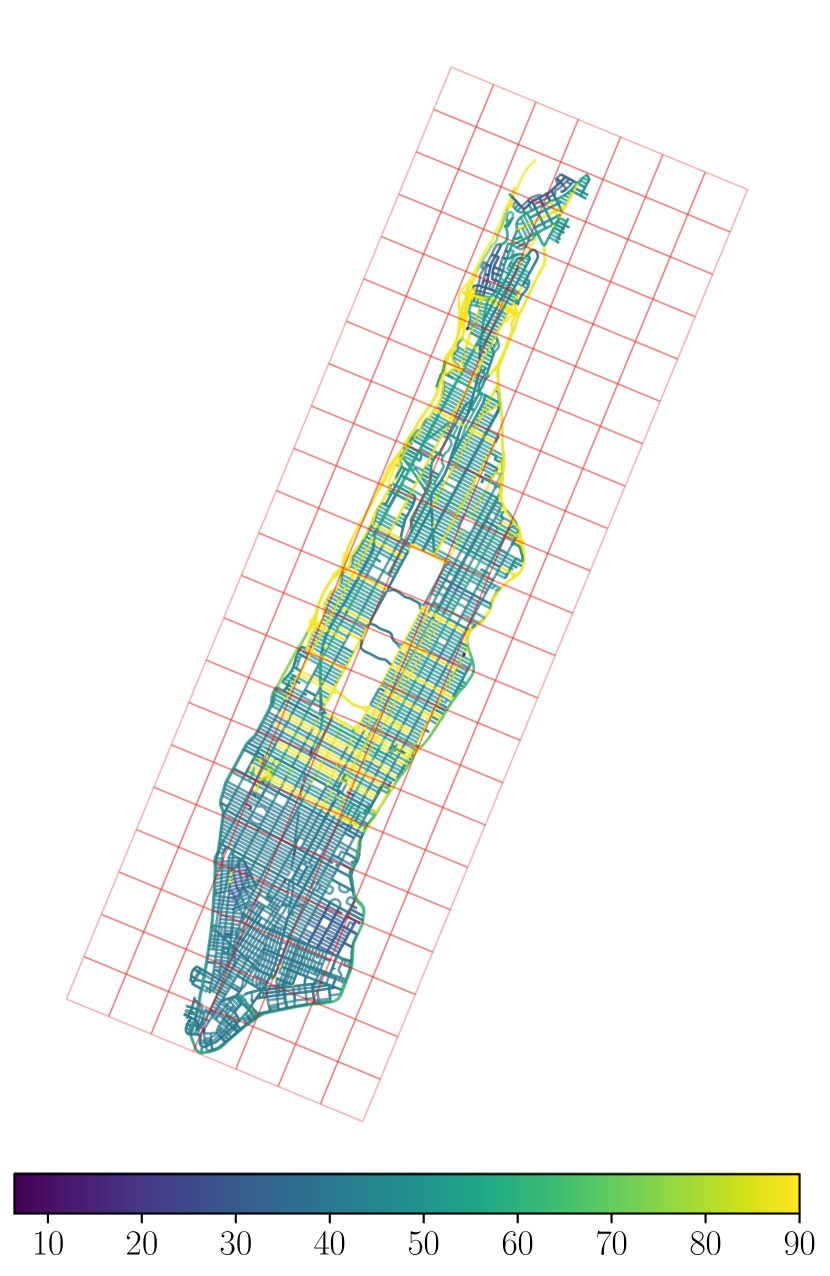
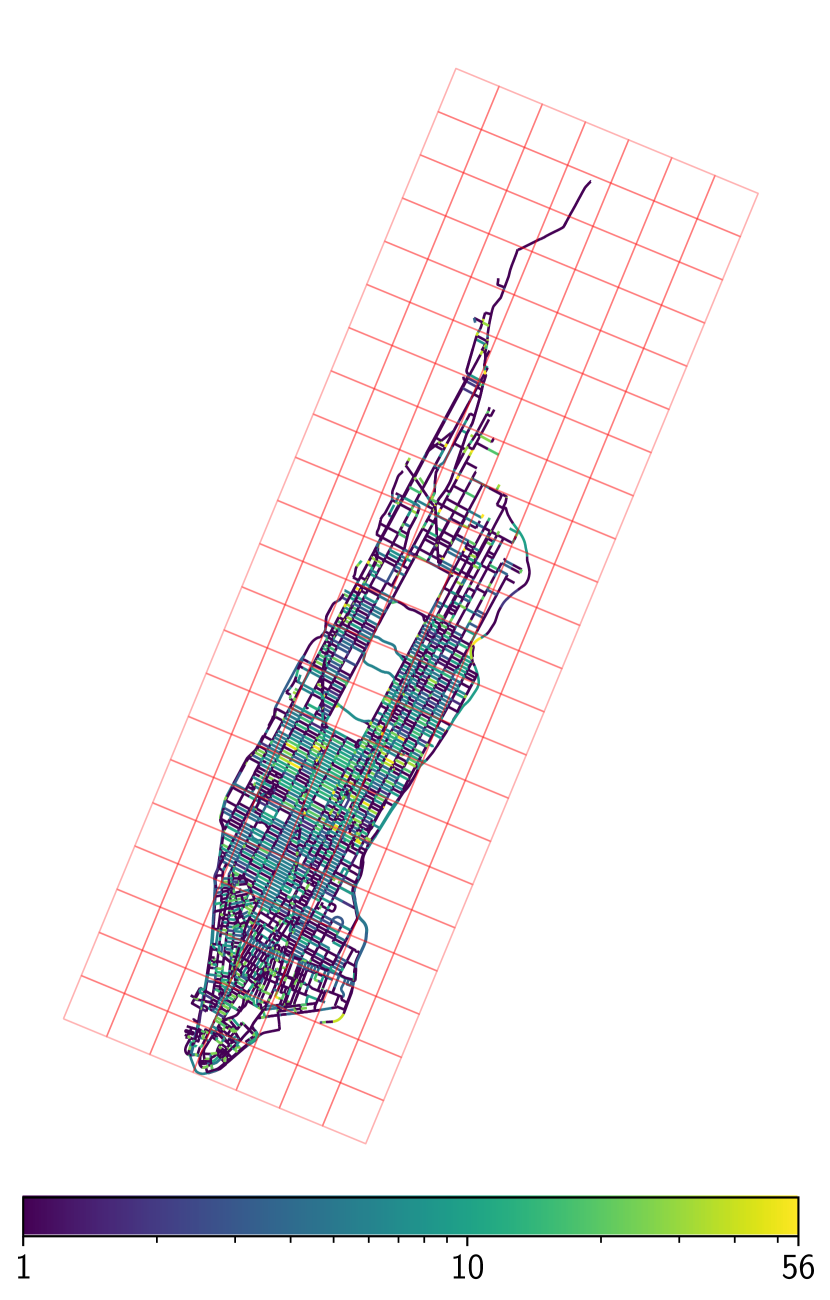
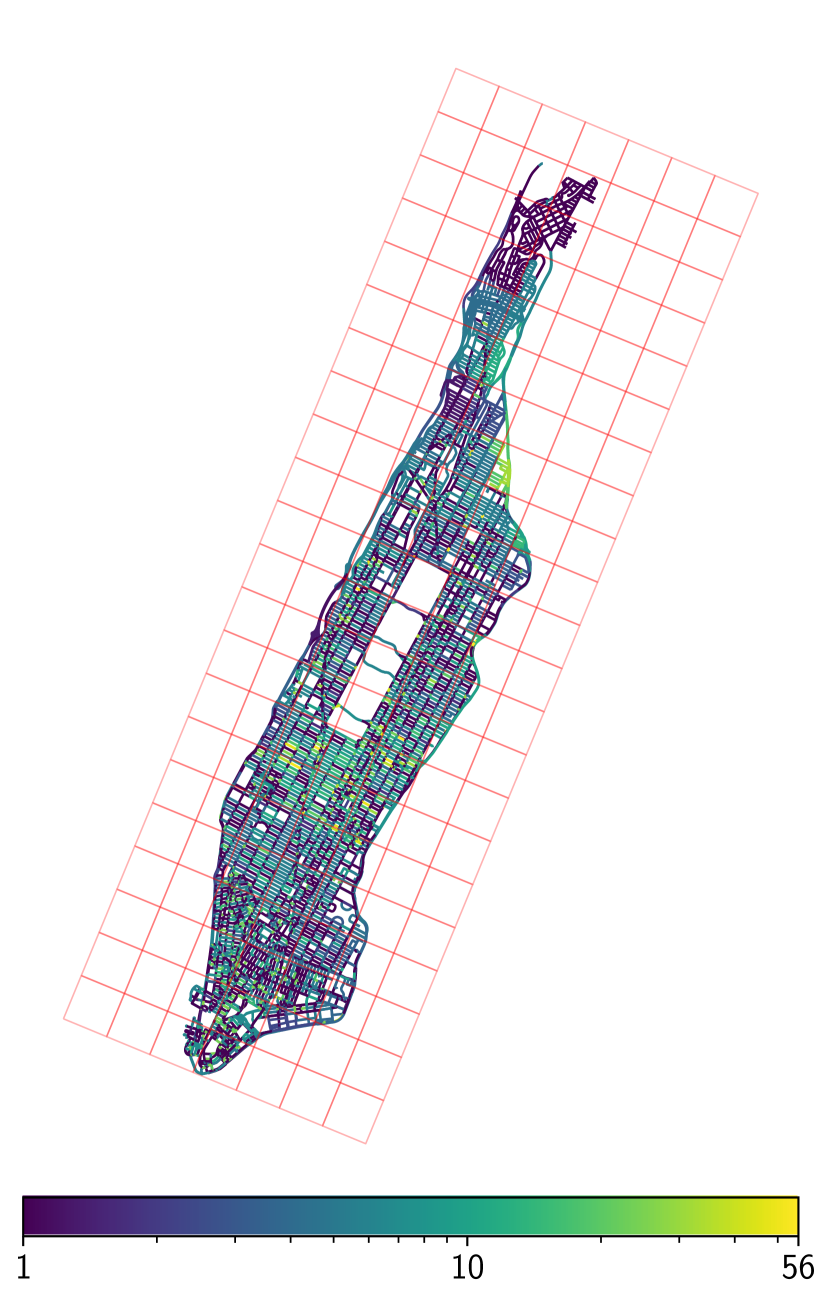
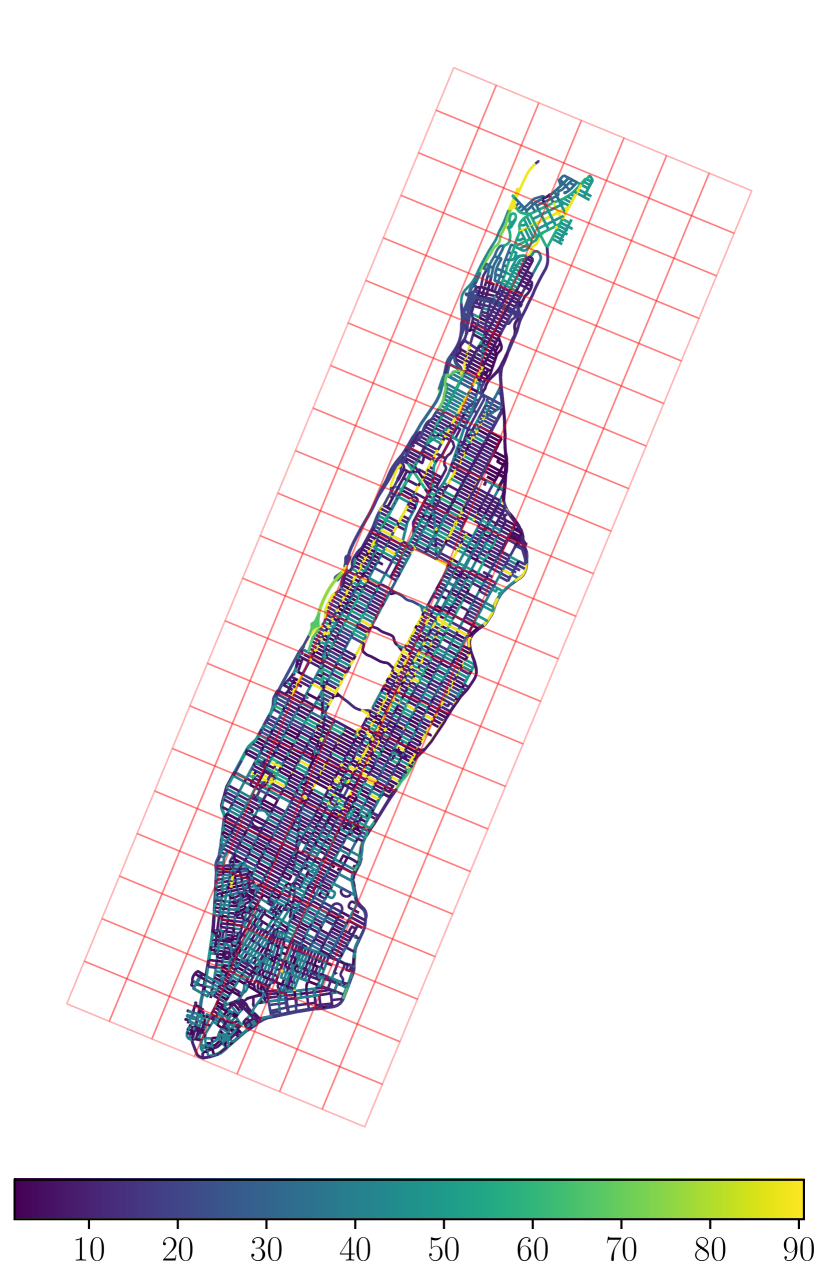
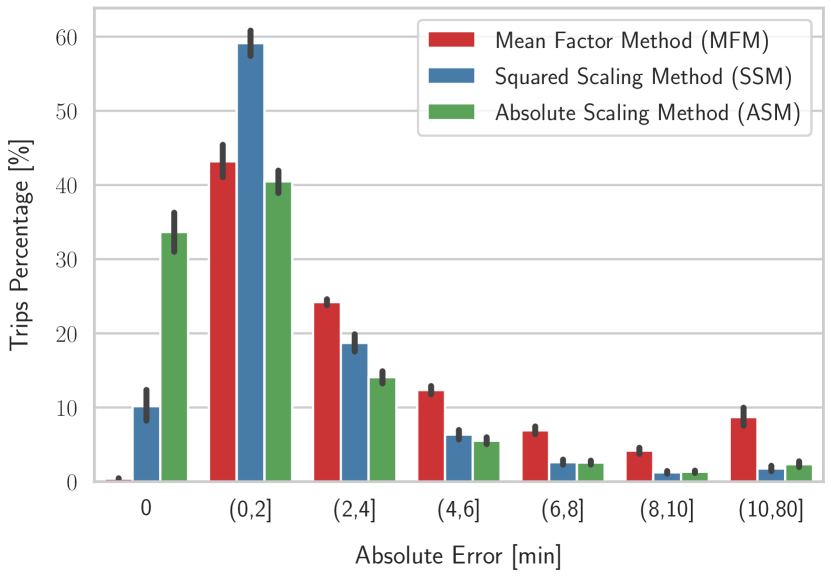
Fig. 3 shows the absolute error between the recorded travel times in the data and the travel times of the corresponding trips obtained using the scaled network. Table I shows the percentiles of the absolute error. First, MFM does not produce a significant proportion of trips with exact accuracy (an absolute error of less than 1 second). Contrarily, due to the link-based scaling, both SSM and ASM reproduced exact travel times for higher a proportion of trips. It also demonstrates a major difference between SSM and ASM: because the SSM uses the square of the scaling error as the objective function, it prioritizes the minimization of high-magnitude errors. Thus, SSM has a lower 95% percentile and maximum absolute error than ASM as shown in Table I. Similarly, it has a slightly lower number of trips than ASM with a higher range of absolute error between 10 and 80 minutes. In contrast, the ASM uses the absolute value of the scaling error as the objective function, and thus, it prioritizes the minimization of scaling error for a higher number of trips. Figure 3 also demonstrates this behavior; ASM has a much higher proportion of trips in lower ranges of absolute error. In fact, almost 33.7% of the trips have no scaling errors with ASM compared to 10.2% for SSM and only 0.42% for MFM. In terms of percentages, 50% of the trips using MFM method have an absolute error of less than 2.74 minutes while using the SSM and ASM methods it reduces to 1.23 minutes and 45.6 seconds, respectively. Thus, the spatio-temporal scaling would produce significantly more realistic travel times between corresponding origin and destination locations in AMoD simulations than MFM.
Fig. 4 illustrates an example of the ASM scaling for the rush hour (9 am to 9:30 am) of Monday morning. First, as shown in Fig. 4(c), the scaling factor varies for different regions and links in the network. Second, as shown in Fig. 4(b), the shortest-path routes do not necessarily include all of the network edges; rather, the areas with the highest number of origins or destinations (e.g., central Manhattan for the rush hour) provide the highest level of information for the scaling method. This is because the scaling is done in intervals of (30 minutes) and only the trips within are used for scaling, and thus, some regions may contain very few edges from while others may not have any edge from at all (refer to the cells in the north in Fig. 4(b)). Therefore, the scaling accuracy of a region also depends on the number of historical trips and shortest path edge samples available for a particular region. This is apparent by comparing the regions in Fig. 4(b) that have a small number of edge samples to the edges in Fig. 4(c) and the resulting scaled speed in Fig. 4(d). However, this also depends on the time of the day as the pattern of trip origins and destinations change from morning to evening and during night hours. Nevertheless, both ASM and SSM methods compensate for the absence of the data by assigning the average scaling factor of a cell to the links without a travel time sample. This assumes that the traffic situation within a small cell should be similar for all the links in that specific cell.
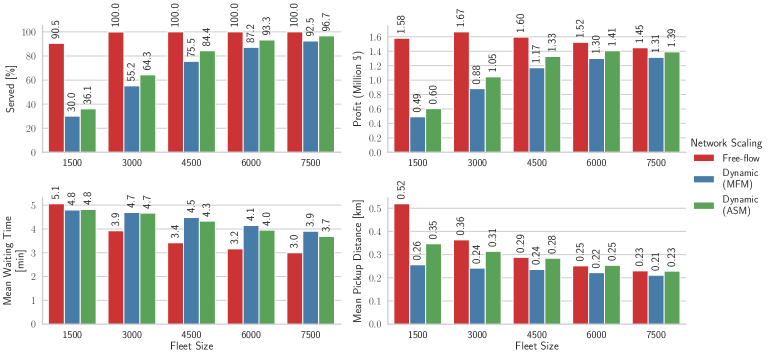
Finally, Fig. 5 compares the impact of scaling methods on the AMoD simulations. First, the free-flow speeds significantly overestimate the AMoD performance: even a small fleet of 1500 vehicles is able to serve almost 90.5% of the customers and generate a very high monetary profit of $1.58 million. Due to the high speed of the network, the AMoD vehicles are able to quickly serve the customers as well as pick up the customers from far-off distances with short waiting times, as shown in Fig. 5.
With free-flow speeds and larger fleet sizes, all of the customer requests can be served by the AMoD service; however, the additional maintenance cost reduces the overall profit. On the contrary, when more realistic travel times are used the AMoD simulation results significantly vary from the free-flow speed. In general, the AMoD performance is reduced when more realistic travel times are used. In comparison to the free-flow, a fleet of 1500 vehicles only serves 30% of the requests and produces a profit of only $0.49 million. Even a significantly high fleet of 7500 vehicles only serves 92.5% of the requests. However, the simulation results show that in contrast to the overestimation of free-flow, the MFM underestimates the AMoD performance; on average, with ASM scaling the AMoD simulation serves 6.88% more customers and shows a relative increase of 14% in profit compared to MFM scaling. The calculation of scaling factors in MFM implicitly gives a higher weightage to the areas of higher customer demand which most of the time also happens to be the areas with lower travel speeds. Since the whole network is then multiplied by the common factor, this leads to a relatively slower network with MFM method.
IV Conclusion and Limitations
This paper presented a spatio-temporal scaling method for the AMoD simulation. Many times the AMoD simulations use real trips data from Taxi or MoD services to study the impacts of various control strategies. The paper suggests that a more realistic and reliable AMoD simulation can be produced by spatio-temporal scaling of the travel times using the real trip data already used for generating customer requests. This makes sure that the travel times are as close as possible to the original trips. The approach was tested for an AMoD scenario in Manhattan using NYC Taxi data. The results show that the approach produces significantly high accuracy compared to other scaling methods commonly used for AMoD simulation.
The introduced methods are specifically formulated for the AMoD simulations. The work assumes a simplistic city network obtained from OSM without considering detailed aspects of a real network such as different lane speeds and traffic lights. These are only implicitly taken into account by reducing the errors against historic trip data. It was also assumed that the links with missing data can be scaled using the average speed in the area. However, this basic assumption may not necessarily be true for all networks. Additionally, Manhattan is a relatively small area with a significantly high number of trips. Other real data used for AMoD simulations may not have such a high number of trips available. Thus, the results may vary when the method is applied to other data sets.
In the future, a regularization factor can be introduced that smooths out the variation of link speeds within and across regions. Instead of using regular grids, a better clustering of trips can be focused. Additionally, the approach can be combined with other data sources for improved scaling of the network for missing links.
References
- [1] M. Hyland and H. S. Mahmassani, “Dynamic autonomous vehicle fleet operations: Optimization-based strategies to assign avs to immediate traveler demand requests,” Transportation Research Part C: Emerging Technologies, vol. 92, pp. 278–297, 2018.
- [2] F. Dandl, R. Engelhardt, M. Hyland, G. Tilg, K. Bogenberger, and H. S. Mahmassani, “Regulating mobility-on-demand services: Tri-level model and bayesian optimization solution approach,” Transportation Research Part C: Emerging Technologies, vol. 125, p. 103075, 2021.
- [3] A. A. Syed, B. Kaltenhaeuser, I. Gaponova, and K. Bogenberger, “Asynchronous Adaptive Large Neighborhood Search Algorithm for Dynamic Matching Problem in Ride Hailing Services,” in 2019 IEEE Intelligent Transportation Systems Conference (ITSC). Auckland, New Zealand: IEEE, Oct. 2019, pp. 3006–3012.
- [4] Y. Zhang, R. Engelhardt, A.-A. Syed, F. Dandl, C. Hardt, and K. Bogenberger, “Simulating Charging Processes of Mobility-On-Demand Services at Public Infrastructure: Can Operators Complement Each Other?” in 2022 IEEE 25th International Conference on Intelligent Transportation Systems (ITSC), Oct. 2022, pp. 2200–2205.
- [5] T. D. Chen, K. M. Kockelman, and J. P. Hanna, “Operations of a shared, autonomous, electric vehicle fleet: Implications of vehicle & charging infrastructure decisions,” Transportation Research Part A: Policy and Practice, vol. 94, pp. 243–254, 2016.
- [6] M. Hyland and H. S. Mahmassani, “Operational benefits and challenges of shared-ride automated mobility-on-demand services,” Transportation Research Part A: Policy and Practice, vol. 134, pp. 251–270, 2020.
- [7] J. Alonso-Mora, S. Samaranayake, A. Wallar, E. Frazzoli, and D. Rus, “On-demand high-capacity ride-sharing via dynamic trip-vehicle assignment,” Proceedings of the National Academy of Sciences, vol. 114, no. 3, pp. 462–467, Jan. 2017.
- [8] F. Dandl, B. Bracher, and K. Bogenberger, “Microsimulation of an autonomous taxi-system in munich,” in 2017 5th IEEE International Conference on Models and Technologies for Intelligent Transportation Systems (MT-ITS). IEEE, 2017, pp. 833–838.
- [9] R. Engelhardt, F. Dandl, A. Bilali, and K. Bogenberger, “Quantifying the Benefits of Autonomous On-Demand Ride-Pooling: A Simulation Study for Munich, Germany,” in 2019 IEEE Intelligent Transportation Systems Conference (ITSC). Auckland, New Zealand: IEEE, Oct. 2019, pp. 2992–2997.
- [10] B. Jäger, C. Brickwedde, and M. Lienkamp, “Multi-agent simulation of a demand-responsive transit system operated by autonomous vehicles,” Transportation Research Record, vol. 2672, no. 8, pp. 764–774, 2018.
- [11] A. A. Syed, F. Dandl, B. Kaltenhäuser, and K. Bogenberger, “Density Based Distribution Model for Repositioning Strategies of Ride Hailing Services,” Frontiers in Future Transportation, vol. 2, p. 681451, Jun. 2021.
- [12] Y. Zhang, F. Rempe, F. Dandl, G. Tilg, M. Kraus, and K. Bogenberger, “Network fundamental diagram based dynamic routing in a clustered network,” in Proceedings of the 8th International Conference on Models and Technologies for Intelligent Transportation Systems, 2023, manuscript submitted for publication.
- [13] P. Santi, G. Resta, M. Szell, S. Sobolevsky, S. H. Strogatz, and C. Ratti, “Quantifying the benefits of vehicle pooling with shareability networks,” Proceedings of the National Academy of Sciences, vol. 111, no. 37, pp. 13 290–13 294, 2014.
- [14] Z. Ghandeharioun and A. Kouvelas, “Real-time ridesharing operations for on-demand capacitated systems considering dynamic travel time information,” Transportation Research Part C: Emerging Technologies, vol. 151, p. 104115, 2023.
- [15] F. Dandl, G. Tilg, M. Rostami-Shahrbabaki, and K. Bogenberger, “Network fundamental diagram based routing of vehicle fleets in dynamic traffic simulations,” in 2020 IEEE 23rd International Conference on Intelligent Transportation Systems (ITSC). IEEE, 2020, pp. 1–8.
- [16] R. Engelhardt, F. Dandl, A. A. Syed, Y. Zhang, F. Fehn, F. Wolf, and K. Bogenberger, “FleetPy: A Modular Open-Source Simulation Tool for Mobility On-Demand Services,” Jul. 2022.