Thermoelectric transport properties of electron doped pyrite FeS2
Abstract
Pyrite FeS2 has been investigated for a wide range of applications, including thermoelectrics due to previous observation of large thermopower at room-temperature. However, the values of thermopower reported in the literature is extremely sensitive to the nature of sample—whether they are natural or lab grown, bulk crystals or thin films—and an ambiguity in the magnitude and sign of thermopower of pure FeS2 exists. Variation in the magnitude of room-temperature thermopower has also been observed in Co-doped samples. Therefore, it is of interest to clarify the intrinsic thermopower of this system that could be measured in more pure samples. In this paper, we investigate the thermoelectric properties of Co-doped FeS2 using first principles calculations. We apply three different doping schemes to understand the effect of electron doping in FeS2, namely explicit Co-substitution, jellium doping and electron addition within rigid band approximation (RBA) picture. The calculated thermopower is less than V/K for all values of Co doping that we studied, suggesting that this system may not be useful in thermoelectric applications. Interestingly, we find that RBA substantially overestimates the magnitude of calculated thermopower compared to the explicit Co-substitution and jellium doping schemes. The overestimation occurs because the changes in the electronic structure due to doping-induced structural modification and charge screening is not taken into account by the rigid shift of the Fermi level within RBA. RBA is frequently used in first principles investigations of the thermopower of doped semiconductors, and Co-substituted FeS2 illustrates a case where it fails.
I Introduction
Pyrite FeS2 is a semiconductor with an indirect band gap of 0.95 eV [1, 2]. It is composed of earth-abundant elements that are nontoxic. Hence, it has been studied as an energy material for various applications, including photovoltaics [3, 4, 5], battery cathodes [6] and thermoelectrics [7, 8, 9]. Thermoelectricity is an important property that affects the efficiency of these functionalities, and the thermoelectric properties of natural and synthetic bulk FeS2 crystals, as well as thin films, have been experimentally investigated extensively [10, 8, 11, 12, 9, 13].
Studies made in the first half of the twentieth century reported a wide range of values and different signs for the Seebeck () coefficient at room temperature, with ranging from to 524 V/K [10]. Experimental work performed since then find similar divergence in the reported values of , likely due to difficulty in controlling impurities and vacancies in this material that give it a finite carrier concentration. Measurements on natural n-type FeS2 by Kato \xperiodafteret alreport of V/K at room temperature [8], while Karguppikar and Vedeshwar find absolute ranging between 120–430 and 430–660 V/K for natural n- and p-type samples, respectively [11]. Experiments on lab-grown single crystals by Willeke \xperiodafteret alfind up to V/K for high-mobility samples that are n-type as determined from Hall measurements [14]. However, contradictory results are observed for their low-mobility sample, where the Seebeck coefficient is negative with a value of V/K while the measured Hall coefficient exhibits a positive value. Harada grew polycrystalline FeS2 samples and observed room-temperature of 50 V/K and a positive Hall coefficient [12]. Uhlig \xperiodafteret aland Rehman \xperiodafteret alalso find their lab-grown polycrystalline sample to be p-type with room-temperature of 128 and 88 V/K, respectively [9, 15]. Experiments on thin films all report positive in the range 60–75 V/K but both negative and positive sign of the Hall coefficient [16, 17, 18, 19]. A recent study by Xi \xperiodafteret alon FeS2 single crystals and thin films seems to resolve the above discrepancies by thermopower and Hall effect measurements [20]. They report that highest mobility crystals and thin films are always n-type, whereas a crossover to p-type behavior occurs as mobility decreases.
Doped FeS2 has also been investigated to see if it exhibits improved transport properties, and Co doping has garnered interest as it lies next to Fe in the periodic table [21, 22]. Thomas \xperiodafteret alobserved room-temperature of V/K in their Co-annealed polycrystalline samples [23], whereas Uhlig \xperiodafteret almeasured V/K in nanograins with Co concentration of 5% [9]. Díaz-Chao \xperiodafteret algrew FeS2 thin films with inhomogeneous Co concentration of 8–39% that exhibited up to V/K [24], while Clamagirand \xperiodafteret al’s thin films with 16% Co concentration showed room-temperature of V/K [13].
The wide range of values for reported for self- and Co-doped FeS2 raises two questions: i) what are the actual values of for various doping levels?, and ii) can be optimized by Co doping? Density functional theory calculations can be useful in answering them because in a large part depends on the details of the electronic structure of the material. Gudelli \xperiodafteret aland Harran \xperiodafteret alhave calculated using semi-classical Boltzmann transport theory and found optimized in excess of V/K [25, 26]. However, these studies took account of doping by a rigid shift of the Fermi level, and the effects of elemental substitution and additional charge screening was not explicitly considered. In a recent work on Co1-xFexS2, we showed that explicit substitution of Co by Fe changes both the broadening of the bands and their relative splitting in a way that is not described by the rigid band approximation [27]. Therefore, a more detailed study of the role of chemical doping on the thermoelectric properties of this system is warranted.
In this paper, we investigate how three different doping schemes, namely explicit Co substitution, jellium doping and electron addition within the RBA picture, affect the thermoelectric properties of pyrite FeS2. We find that the three doping schemes give similar trends for as a function of temperature, but the magnitude of within the RBA is substantially larger than when explicit Co or jellium doping is considered. To rationalize this behavior, we analyzed the electronic structure and found that the Fermi level is at a steeper region of the density of states in the RBA but gets situated around a broader area upon Co substitution or jellium doping. The calculated room-temperature for doping level equivalent to 25% Co is , , and V/K within the RBA, Co substitution and jellium doping, respectively. We find that the magnitude of remains below V/K for all values of doping that we considered. Since good thermoelectrics generally have in excess of 200 V/K, our results suggest that doped FeS2 is unlikely to exhibit good thermoelectric performance.
II Computational Details
First principles calculations were performed under the framework of density functional theory [28, 29] using the Vienna Simulation package [30, 31, 32]. The exchange-correlation interaction was approximated by the local density approximation (LDA), and the projector augmented wave (PAW) [33] method was used. A converged energy cut-off of at least 420 eV and a -centered -point mesh of at least were taken for the self-consistent cycles. The energy convergence criterion for these self-consistency cycles was set to eV. A -point of mesh of at least was used for the density of states (DOS) calculations. The valence electronic configurations of the pseudopotentials were (Co), (Fe) and (S).
The RBA scheme was implemented by performing a shift of the Fermi energy in the electronic structure of FeS2 to incorporate additional electrons/unit cell corresponding to the equivalent Co doping values. In the jellium doping scheme, we explicitly added electrons as background charge in the unit cell of FeS2 and performed electronic structure calculations. For the explicit Co substitution case, successive replacement of Fe atoms by Co atoms were carried out.
The transport properties were calculated by solving the linearized Boltzmann transport equation (BTE) under the constant relaxation time approximation (CRTA) using the BoltzTraP2 code [34] with an interpolation factor of at least 60. Within the linearized Boltzmann transport theory, the transport tensors are formulated as
| (1) | ||||
| (2) | ||||
| (3) |
where is the unit cell volume, is the electron charge, is the Fermi-Dirac distribution function, is the chemical potential, and is the band energy. The energy projected conductivity tensors are given by
| (4) |
and similarly for . Here, is the scattering time, and is the group velocity of the band at the wave vector . The Seebeck and Hall coefficients are then expressed as
| (5) | ||||
| (6) |
The factor () in Eq. 2 depends on the electronic structure of the system and captures the details of the particle-hole symmetry. The temperature dependence of the above transport properties comes from the derivative of the Fermi function . The scattering time gets cancelled within CRTA for . In the calculation of , we used s.
III Structural Details

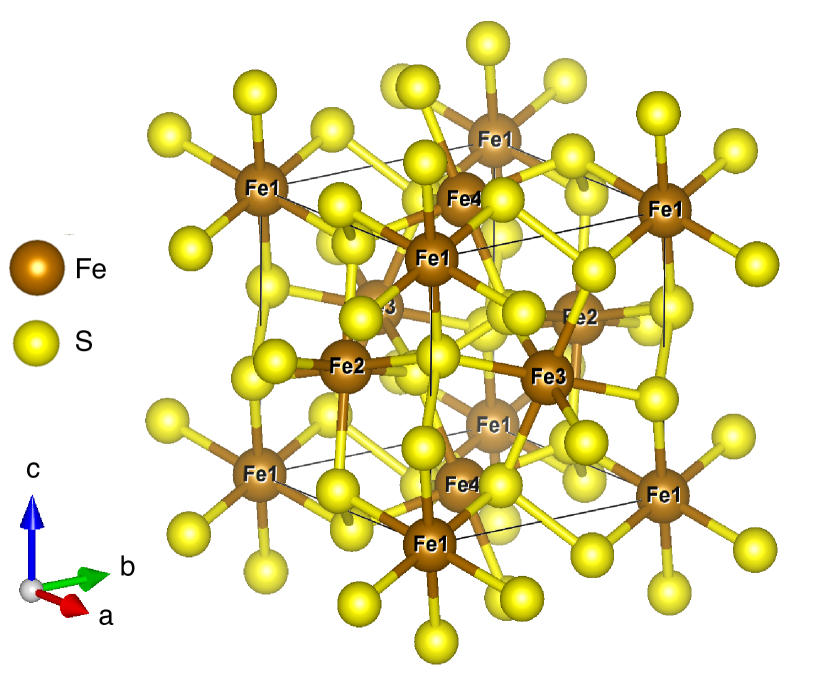
The pyrite form of FeS2, belonging to the space group , has four Fe atoms at (0,0,0) and eight S atoms at , including their respective symmetry equivalent positions within the unit cell. The Fe atoms are coordinated with six S atoms, forming a corner-shared octahedra, whereas each S atom forms a S-S dimer shared by three octahedra. The unit cell of this phase of FeS2 is shown in Fig. 1. All the bond distances in this structure are controlled by the sole internal parameter of the system .
We obtain Fe0.75Co0.25S2 by substituting a Co atom at the site labelled Fe1 in Fig. 1 and Fe0.5Co0.5S2 by additional substitution of a Co atom at the site Fe2. For the mixed Co/Fe compounds, experimental observation suggests that the lattice constants follow the Vegard’s law [35, 36], which we utilize in our study. The internal parameter controlling the different bond distances is found to be for FeS2 after relaxations that minimize the atomic forces. Due to symmetry reduction resulting from Co-substitution in the mixed compounds, there are multiple Co/Fe-S and S-S bond distances. Hence, they cannot be parameterized by a single value. We have relaxed the atomic positions for the mixed compounds and the different bond distances thus obtained are reported in our recent study [27]. Within the different doping schemes, we have used the lattice parameter of FeS2 () for the RBA case. For jellium doped compounds, the lattice parameter of their electronically equivalent FexCo1-xS2 counterparts from Vegard’s law were used, but the internal atomic positions were relaxed.
IV Results and Discussions
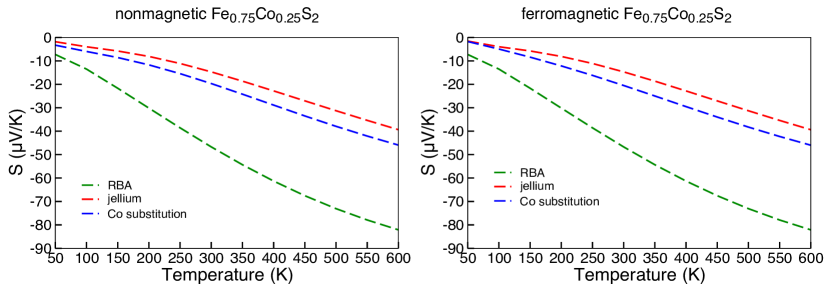
We first consider the case where 25% of Fe are replaced by Co, which is the smallest doping level that can be simultaneously studied using RBA, jellium doping, and explicit Co substitution in a unit cell that contains four formula units. The temperature-dependent obtained using these three schemes are shown in the left column of Fig. 2 for the nonmagnetic case. Our calculations reveal a similar behavior in for all three doping schemes. Its sign remains negative while the magnitude increases with temperature. This indicates that electrons are the majority charge carriers and shows that bipolar conduction plays a minor role even at high temperature. However, we find that the thermopower within RBA is considerably higher than both the jellium doped and Co-substituted cases throughout the investigated temperature range despite having the same electron count. The calculated room-temperature values for are , , V/K, respectively, for the RBA, jellium doped, and Co-substituted cases in the nonmagnetic phase. The corresponding calculated room temperature Hall numbers, which can be different from the chemical carrier concentration due to the nonparabolicity of the bands, are given in Table. 1.
| Doping scheme | (10-10 m3/C) | (10-10 m3/C) |
|---|---|---|
| nonmagnetic | ferromagnetic | |
| RBA | ||
| jellium | ||
| Co substitution |
Experiments show that FexCo1-xS2 is ferromagnetic for [37, 38], and calculations that take into account this magnetic ordering should be considered for comparison against the experimental data below . The right panel of Fig. 2 shows the calculated of Fe0.75Co0.25S2 in the ferromagnetic phase for the three doping schemes, and the results are similar to the one obtained for the nonmagnetic cases. The room-temperature within RBA remains V/K, while those obtained using jellium doping and explicit Co substitution are and V/K, respectively. The room-temperature value for the jellium doped case is similar in both the states, whereas observed for ferromagnetic Co-substituted case is a bit larger than that obtained for the nonmagnetic case.

To understand why RBA overestimates compared to the more realistic jellium doping and explicit Co substitution schemes, we investigated the electronic structure near the Fermi level for the composition equivalent to Fe0.75Co0.25S2 using the three schemes. The resulting electronic density of states (DOS) and band structures are shown in the left and right columns of Fig. 3, respectively. In the case of RBA, the Fermi level is situated at a steep position in the DOS. The corresponding band structure shows that this is the result of a flat part of a band crossing the Fermi level near the point. This band broadens and the flat part shifts above the Fermi level in the jellium-doped case. In the case of Co substitution, the narrow band shifts above the Fermi level because another dispersive conduction band at dips below the Fermi level. Hence, the DOS at the Fermi level is situated in a less steep part in both the jellium doping and explicit Co substitution schemes. Since , the steeper DOS near the Fermi level in the RBA case leads to a larger compared to the jellium doping and explicit Co substitution cases.
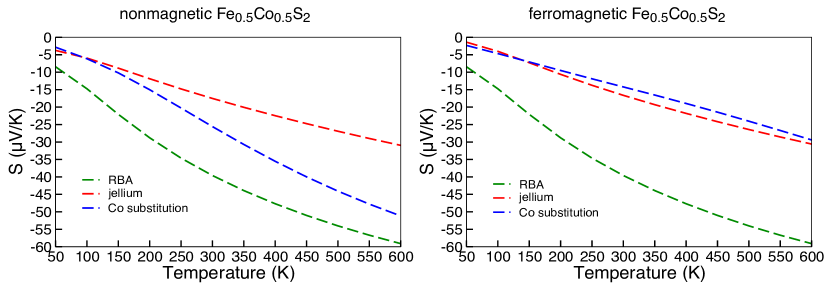
The left and right panels of Fig. 4 show the calculated for doping level equivalent to Fe0.5Co0.5S2 using the three schemes for the nonmagnetic and ferromagnetic phases, respectively. Again, at room temperature is relatively small, with values of , , V/K, respectively, for the RBA, jellium doping, and Co substitution schemes in the nonmagnetic phase. Compared to the respective value obtained for Fe0.75Co0.25S2, decreases for RBA, as one would expect from moving away from the band edge. However, the value for the explicit Co substitution case increases noticeably, while that for the jellium doping shows only a modest increase.
We investigated the DOS and band structure near the Fermi level of Fe0.50Co0.50S2 within the RBA, jellium doping and Co substitution schemes in the nonmagnetic phase, which are shown in the left and right columns of Fig. 5, respectively, to understand the differences in the electronic structure that result in different values of within these three doping schemes. The Fermi energy is located at a steep region of the DOS within RBA and leads to a larger compared to jellium doping and Co substitution schemes. The Fermi energy gets shifted to the broader shoulder of the peak in the jellium doped case, whereas it is located inside a valley in the explicit Co substitution case. By looking at the structure of the DOS near the Fermi level, it is surprising that the in explicit Co-substituted case is larger than the jellium doped case. The respective band structures in the right column of Fig. 5 shows the presence of flat bands crossing the Fermi level around and along - in the explicit Co-substituted case, and this may be the cause of the larger compared to the values obtained for the jellium doped case at room and higher temperatures. In the ferromagnetic case (not shown), the Fermi level is still situated in a steep region in the RBA case, but it is located in a relatively broader region in the jellium doped and explicit Co-substituted cases. This again results in a larger value of for the RBA case compared to the latter two schemes. Interestingly, the presence of ferromagnetism reduces the unevenness in the DOS near the Fermi level of the explicit Co-substituted case, which reduces the compared to the respective value calculated for the nonmagnetic case.
| Composition | S (V/K) | S (V/K) |
|---|---|---|
| RBA | jellium | |
| Fe0.99Co0.01S2 | ||
| Fe0.95Co0.05S2 | ||
| Fe0.90Co0.10S2 | ||
| Fe0.85Co0.15S2 | ||
| Fe0.75Co0.25S2 | ||
| Fe0.50Co0.50S2 |
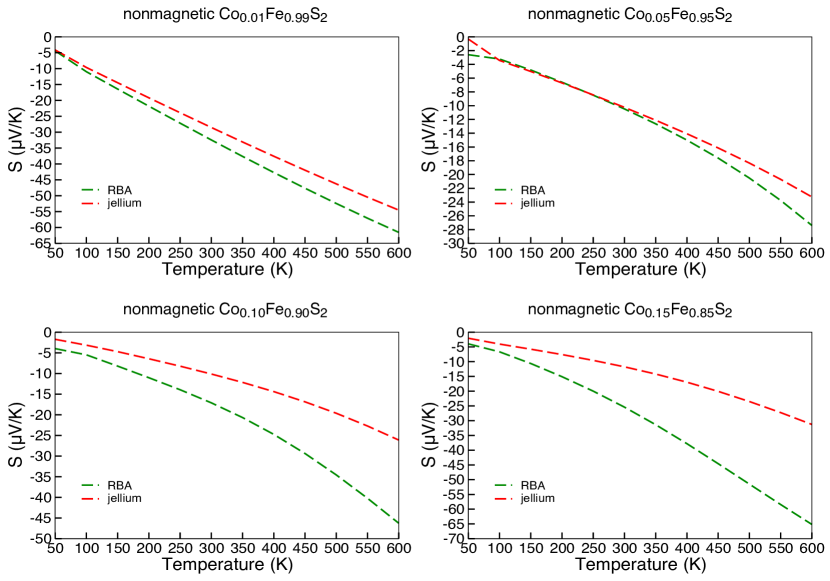
Finally, we calculated the thermopower at lower electron concentrations of 1, 5, 10 and 15% using the RBA and jellium doping schemes in the nonmagnetic phase, which is shown in Fig. 6. For these doping values, the explicit Co substitution scheme is not feasible using the four-formula unit conventional unit cell that we have used. Interestingly, both the RBA and jellium doping yield similar calculated values for near room temperature at a doping level of 5%. However, calculations at larger doping levels of 10 and 15% again show the tendency of RBA to overestimate discussed above. The room temperature values for these doping levels are reported in Table. 2, and they show that the calculated is negative and the room-temperature value remains below 50 V/K even for the lowest doping value.
V Conclusions
We have investigated the thermoelectric properties of electron doped FeS2 using three different schemes, namely the RBA, jellium doping and explicit Co substitution. This was motivated by the wide range of values experimentally reported for the Seebeck coefficient at room temperature for this system. We studied doping levels up to 50% Co substitution of Fe and considered both the nonmagnetic and ferromagnetic phases. The sign of is negative and its magnitude is relatively small ( 50 V/K) for all the doping schemes and levels that we considered. The RBA overestimates compared to the jellium doping and explicit Co substitution schemes, which we rationalized by observing that the DOS near the Fermi level is steeper within the RBA. Neither of the three doping schemes exactly described the real samples that are studied in the experiments. However, they should reasonably approximate the various ways the electronic structure changes due to electron doping. In particular, jellium doping takes into account the changes in carrier concentration in a homogeneous way, while explicit Co substitution considers the role of inhomogeneity. The fact that the calculated is relatively low irrespective of the concentration level and doping scheme considered suggests that electron doped FeS2 may not be a good thermoelectric material.
Acknowledgements.
We express our gratitude to Sylvie Hébert for useful discussions. This work was supported by Agence Nationale de la Recherche under grant ANR-21-CE50-0033 and GENCI-TGCC under grant A0130913028.References
- Schlegel and Wachter [1976] A. Schlegel and P. Wachter, Optical properties, phonons and electronic structure of iron pyrite FeS2, Journal of Physics C: Solid State Physics 9, 3363 (1976).
- Ennaoui et al. [1985] A. Ennaoui, S. Fiechter, H. Goslowsky, and H. Tributsch, Photoactive synthetic polycrystalline pyrite FeS2, Journal of The Electrochemical Society 132, 1579 (1985).
- Ennaoui et al. [1993] A. Ennaoui, S. Fiechter, C. Pettenkofer, N. Alonso-Vante, K. Büker, M. Bronold, C. Höpfner, and H. Tributsch, Iron disulfide for solar energy conversion, Sol. Energy Mater. Sol. Cells 29, 289 (1993).
- Tomm et al. [1995] Y. Tomm, R. Schieck, K. Ellmer, and S. Fiechter, Growth mechanism and electronic properties of doped pyrite FeS2 crystals, J. Crystal Growth 146, 271 (1995), vapour Growth and Epitaxy 1994.
- Eyert et al. [1998] V. Eyert, K.-H. Höck, S. Fiechter, and H. Tributsch, Electronic structure of FeS2: The crucial role of electron-lattice interaction, Phys. Rev. B 57, 6350 (1998).
- Strauss et al. [2000] E. Strauss, D. Golodnitsky, and E. Peled, Study of phase changes during 500 full cycles of Li/composite polymer electrolyte/FeS2 battery, Electrochim. Acta 45, 1519 (2000).
- Banerjee et al. [1990] H. Banerjee, N. Godhaunkar, and U. Pal, Upgradation and studies on semiconducting properties of pyrite (FeS2) for device applications, Materials Letters 10, 99 (1990).
- Kato et al. [1997] K. Kato, Y. Okamoto, J. Morimoto, and T. Miyakawa, The thermoelectric properties of FeS2, J. Mater. Sci. Lett. 16, 914 (1997).
- Uhlig et al. [2014] C. Uhlig, E. Guenes, A. S. Schulze, M. T. Elm, P. J. Klar, and S. Schlecht, Nanoscale FeS2 (pyrite) as a sustainable thermoelectric material, J. Electron. Mater. 43, 2362 (2014).
- Telkes [1950] M. Telkes, Thermoelectric power and electrical resistivity of minerals, American Mineralogist 35, 536 (1950).
- Karguppikar and Vedeshwar [1988] A. M. Karguppikar and A. G. Vedeshwar, Electrical and optical properties of natural iron pyrite FeS2, Phys. Stat. Sol. (a) 109, 549 (1988).
- Harada [1998] T. Harada, Transport properties of iron dichalcogenides FeX2 (X = S, Se and Te), J. Phys. Soc. Japan 67, 1352 (1998).
- Clamagirand et al. [2016] J. Clamagirand, J. Ares, E. Flores, P. Diaz-Chao, F. Leardini, I. Ferrer, and C. Sánchez, Influence of temperature on thermoelectric properties of FexCo1-xS2 thin films: A semiconductor to semimetal conversion, Thin Solid Films 600, 19 (2016).
- Willeke et al. [1992] G. Willeke, O. Blenk, C. Kloc, and E. Bucher, Preparation and electrical transport properties of pyrite FeS2 single crystals, J. Alloys Compd. 178, 181 (1992).
- Rehman et al. [2020] U. Rehman, J. Jacob, K. Mahmood, A. Ali, A. Ashfaq, M. Basit, N. Amin, S. Ikram, S. Hussain, H. Noor, A. ul Ahmad, and N. ur Rehman, Improving the thermoelectric performance of hydrothermally synthesized FeS2 nanoparticles by post sulfurization, Ceramics International 46, 20496 (2020).
- Thomas et al. [1998] B. Thomas, T. Cibik, C. Höpfner, K. Diesner, G. Ehlers, S. Fiechter, and K. Ellmer, Formation of secondary iron-sulphur phases during the growth of polycrystalline iron pyrite FeS2 thin films by MOCVD, Journal of Materials Science: Materials in Electronics 9, 61 (1998).
- Ares et al. [1998] J. R. Ares, M. León, N. M. Arozamena, J. Sánchez-Páramo, P. Celis, I. J. Ferrer, and C. Sánchez, Evolution of the seebeck coefficient during the formation and crystallization of pyrite thin films, Journal of Physics: Condensed Matter 10, 4281 (1998).
- Reijnen et al. [2000] L. Reijnen, B. Meester, A. Goossens, and J. Schoonman, In situ mass spectrometric study of pyrite (FeS2) thin film deposition with metallorganic chemical vapor deposition, Journal of The Electrochemical Society 147, 1803 (2000).
- Ares et al. [2003] J. Ares, I. Ferrer, and C. Sánchez, Majority carriers in pyrite thin films: an analysis based on seebeck and hall coefficient measurements, Thin Solid Films 431-432, 511 (2003).
- Zhang et al. [2017] X. Zhang, M. Li, J. Walter, L. O’Brien, M. A. Manno, B. Voigt, F. Mork, S. V. Baryshev, J. Kakalios, E. S. Aydil, and C. Leighton, Potential resolution to the doping puzzle in iron pyrite: Carrier type determination by hall effect and thermopower, Phys. Rev. Mater. 1, 015402 (2017).
- Lehner et al. [2006] S. Lehner, K. Savage, and J. Ayers, Vapor growth and characterization of pyrite FeS2 doped with Co, Ni, and As: Variations in semiconducting properties, J. Cryst. Growth 286, 306 (2006).
- Guo et al. [2010] S. Guo, D. P. Young, R. T. Macaluso, D. A. Browne, N. L. Henderson, J. Y. Chan, L. L. Henry, and J. F. DiTusa, Charge transport in cobalt-doped iron pyrite, Phys. Rev. B 81, 144424 (2010).
- Thomas et al. [1999] B. Thomas, K. Ellmer, W. Bohne, J. Röhrich, M. Kunst, and H. Tributsch, Photoeffects in cobalt doped pyrite FeS2 films, Solid State Commun. 111, 235 (1999).
- Díaz-Chao et al. [2008] P. Díaz-Chao, I. Ferrer, and C. Sánchez, Co distribution through n-type pyrite thin films, Thin Solid Films 516, 7116 (2008).
- Gudelli et al. [2013] V. K. Gudelli, V. Kanchana, S. Appalakondaiah, G. Vaitheeswaran, and M. C. Valsakumar, Phase stability and thermoelectric properties of the mineral FeS2: An ab initio study, J. Phys. Chem. C. 117, 21120 (2013).
- Harran et al. [2017] I. Harran, Y. Li, H. Wang, Y. Chen, and Y. Ni, Iron disulfide compound: a promising thermoelectric material, Materials Research Express 4, 105907 (2017).
- Mukherjee and Subedi [2023] A. Mukherjee and A. Subedi, Minority-spin conducting states in Fe substituted pyrite CoS2, J. Phys.: Condens. Matter 36, 025501 (2023).
- Hohenberg and Kohn [1964] P. Hohenberg and W. Kohn, Inhomogeneous electron gas, Phys. Rev. 136, B864 (1964).
- Kohn and Sham [1965] W. Kohn and L. J. Sham, Self-consistent equations including exchange and correlation effects, Phys. Rev. 140, A1133 (1965).
- Kresse and Hafner [1993] G. Kresse and J. Hafner, Ab initio molecular dynamics for liquid metals, Phys. Rev. B 47, 558 (1993).
- Kresse and Furthmüller [1996] G. Kresse and J. Furthmüller, Efficiency of ab-initio total energy calculations for metals and semiconductors using a plane-wave basis set, Comput. Mat. Sci. 6, 15 (1996).
- Kresse and Furthmüller [1996] G. Kresse and J. Furthmüller, Efficient iterative schemes for ab initio total-energy calculations using a plane-wave basis set, Phys. Rev. B 54, 11169 (1996).
- Kresse and Joubert [1999] G. Kresse and D. Joubert, From ultrasoft pseudopotentials to the projector augmented-wave method, Phys. Rev. B 59, 1758 (1999).
- Madsen et al. [2018] G. K. Madsen, J. Carrete, and M. J. Verstraete, BoltzTraP2, a program for interpolating band structures and calculating semi-classical transport coefficients, Comput. Phys. Commun. 231, 140 (2018).
- Wang et al. [2005] L. Wang, K. Umemoto, R. M. Wentzcovitch, T. Y. Chen, C. L. Chien, J. G. Checkelsky, J. C. Eckert, E. D. Dahlberg, and C. Leighton, Co1-xFexS2: A tunable source of highly spin-polarized electrons, Phys. Rev. Lett. 94, 056602 (2005).
- Cheng et al. [2003] S. F. Cheng, G. T. Woods, K. Bussmann, I. I. Mazin, R. J. Soulen, E. E. Carpenter, B. N. Das, and P. Lubitz, Growth and magnetic properties of single crystal Fe1-xCoxS2 (), J. Appl. Phys 93, 6847 (2003).
- Jarrett et al. [1968] H. S. Jarrett, W. H. Cloud, R. J. Bouchard, S. R. Butler, C. G. Frederick, and J. L. Gillson, Evidence for itinerant -electron ferromagnetism, Phys. Rev. Lett. 21, 617 (1968).
- Guo et al. [2008] S. Guo, D. P. Young, R. T. Macaluso, D. A. Browne, N. L. Henderson, J. Y. Chan, L. L. Henry, and J. F. DiTusa, Discovery of the griffiths phase in the itinerant magnetic semiconductor Fe1-xCoxS2, Phys. Rev. Lett. 100, 017209 (2008).