[a]Salvatore Orlando
Modeling the Evolution from Massive Stars to Supernovae and Supernova Remnants
Abstract
The study of core-collapse supernova remnants (SNRs) presents a fascinating puzzle, with intricate morphologies and a non-uniform distribution of stellar debris. Particularly, young remnants (aged less than 5000 years) hold immense value as they can offer crucial insights into the inner processes of the supernova (SN) engine, revealing details about nucleosynthetic yields and large-scale asymmetries arising from the early stages of the explosion. Furthermore, these remnants also bear characteristics that may reflect the nature of their progenitor stars and the interactions between the remnants and the surrounding circumstellar medium (CSM), shaped by the progenitor’s mass-loss history. Hence, investigating the connection between young SNRs, parent SNe, and progenitor massive stars can be of paramount importance to delve into the physics of SN engines, and to investigate the final stages of massive star evolution and the elusive mechanisms governing their mass loss. In this contribution, I review recent advances in modeling the path from massive stars to SNe and SNRs achieved by our team. The focus is on investigating the links between the observed physical and chemical properties of SNRs and their progenitor stars and SN explosions. The unraveling of this connection offers us the opportunity to probe the physics of core-collapse SN explosions and the final stages of evolution of massive stars.
1 Introduction
Core-collapse (CC) supernovae (SNe), the final fate of massive stars (with masses larger than 8 M⊙), play a crucial role in the dynamic and chemical evolution of galaxies. They drive the chemical enrichment of the diffuse interstellar gas and inject mass and energy into the galaxies, including kinetic/thermal energy, cosmic rays, and neutrinos. However, understanding the physical processes governing SNe is a challenging task, requiring demanding three-dimensional (3D) models to accurately follow the blast wave evolution. Moreover, SNe are rare in our galaxy, and there have been no observed events in the past four centuries. Consequently, our ability to study them is confined to extragalactic SNe, which remain spatially unresolved due to their substantial distance from us. Regrettably, obtaining crucial insights into the explosion processes and the nature of the progenitor systems from these observations presents significant challenges. This is unfortunate because the period immediately following a SN event, spanning tens to hundreds days, is when the rapidly expanding debris from the stellar explosion retains a full memory of the parent SN and progenitor star.
Nonetheless, the fingerprints of the explosion mechanisms and progenitor systems may still be found in the outcome of SN explosions, the supernova remnants (SNRs), hundreds to thousands of years after the explosion (e.g., [36]). These remnants appear as extended sources emitting both thermal and nonthermal radiation across different spectral bands, and they are also sources of cosmic rays. By employing spatially resolved spectroscopy, astronomers have been able to investigate the structure of nearby SNRs and the distribution of chemical elements within them. This reveals a complexity in their morphology that cannot be observed in unresolved extragalactic sources [23].
The vast and high complexity observed in the remnants of CC-SNe is believed to originate in part from pristine structures of the parent SN explosion. These structures likely result from the development of hydrodynamic/magnetohydrodynamic (HD/MHD) instabilities during the launch of the anisotropic blast wave [49, 51, 50, 14]. A compelling example illustrating this phenomenon is the SNR Cassiopeia A (Cas A). The observed morphology and expansion rate of Cas A suggest that the remnant is still expanding through the nearly spherically symmetric wind from its progenitor star. Consequently, the prominent large-scale anisotropies observed in its morphology are likely a result of processes associated with the SN explosion [32, 36, 50]. In essence, these asymmetries in SNRs provide a unique opportunity to delve into the physics of SN engines by gaining insight into the processes that occur during the explosive event.
Moreover, the morphology of the remnants can yield crucial insights into the structure of the stellar progenitor at the moment of collapse, a stage that might have undergone significant alterations due to complex and poorly-understood phenomena occurring during the terminal phases of stellar evolution [41, 6, 53]. Recent research has revealed that the geometric and physical properties of post-explosion anisotropies are intricately linked to the density structure of the progenitor star at collapse (e.g., [51]). Since these post-explosion anisotropies are expected to shape the structure of the ejected material and ultimately influence the remnant’s morphology, the latter may harbor valuable information to unlock the nature of the progenitor stars.
Lastly, certain SNR asymmetries arise from the dynamic interaction between the remnant and an inhomogeneous circumstellar medium (CSM) or interstellar medium (ISM). Notably, very young SNRs like the remnant of SN 1987A showcase this phenomenon, where the highly inhomogeneous CSM gives rise to the striking ring-like structure observed across various wavelengths (e.g., [24]). Similarly, in more evolved SNRs like the Cygnus Loop, clear indentations in the remnant outline attest to the effect of the SNR’s interaction with isolated dense interstellar clouds (e.g., [40]). In young SNRs, the surrounding environment is the CSM sculpted by the winds of the progenitor stars. Thus, analyzing these asymmetries offers valuable insights into the mass loss history of the progenitor stars and sheds light on the late phases of their evolution.
In light of the above considerations, it becomes evident that observations of SNRs can be very rich sources of information about the parent SNe and the progenitor massive stars. By deciphering the intricate features of these remnants, we can significantly enhance our understanding of the complex evolutionary processes that culminate in CC-SNe, thus unraveling the journey of massive stars toward their ultimate fate. This knowledge is particularly importance as it unravels the complexities inherent in stellar life cycles and sheds light on the profound impact SNe can have on the ISM and the dynamics and energetics of the Galaxy.
In the subsequent sections, I will review recent advances achieved by our team in studying the “progenitor-supernova-remnant connection”. This consists in exploring how the physical, chemical, and morphological properties observed in SNRs reflect the physics of SN engines and the nature of the progenitor stellar systems.
2 Modeling the path from massive stars to supernovae and supernova remnants
Combining the complementary information extracted from multi-band/multi-messenger observations of candidate progenitor stars, extragalactic SNe, and nearby SNRs can be essential to study the processes associated to SNe and the latest stages of stellar evolution. However, linking the asymmetries of the SNR bulk ejecta with the information extracted from the analysis of SNe and with the inferred information of the progenitor stars is a daunting task. This requires a multi-scale, multi-physics, and multi-dimensional (multi-D) approach that encompasses various essential aspects: accounting for vastly different temporal and spatial scales involved throughout the diverse phases of evolution; describing the structure and chemical stratification of the progenitor star at the time of collapse; understanding the complexities of explosive nucleosynthetic processes; exploring the effects of inherently 3D post-explosion anisotropies; investigating the interaction of SNe and SNRs with the (magnetized) inhomogeneous CSM or ISM; incorporating the back-reaction of accelerated cosmic rays on the shock dynamics; synthesizing emission across different spectral bands to effectively compare model results with observations.
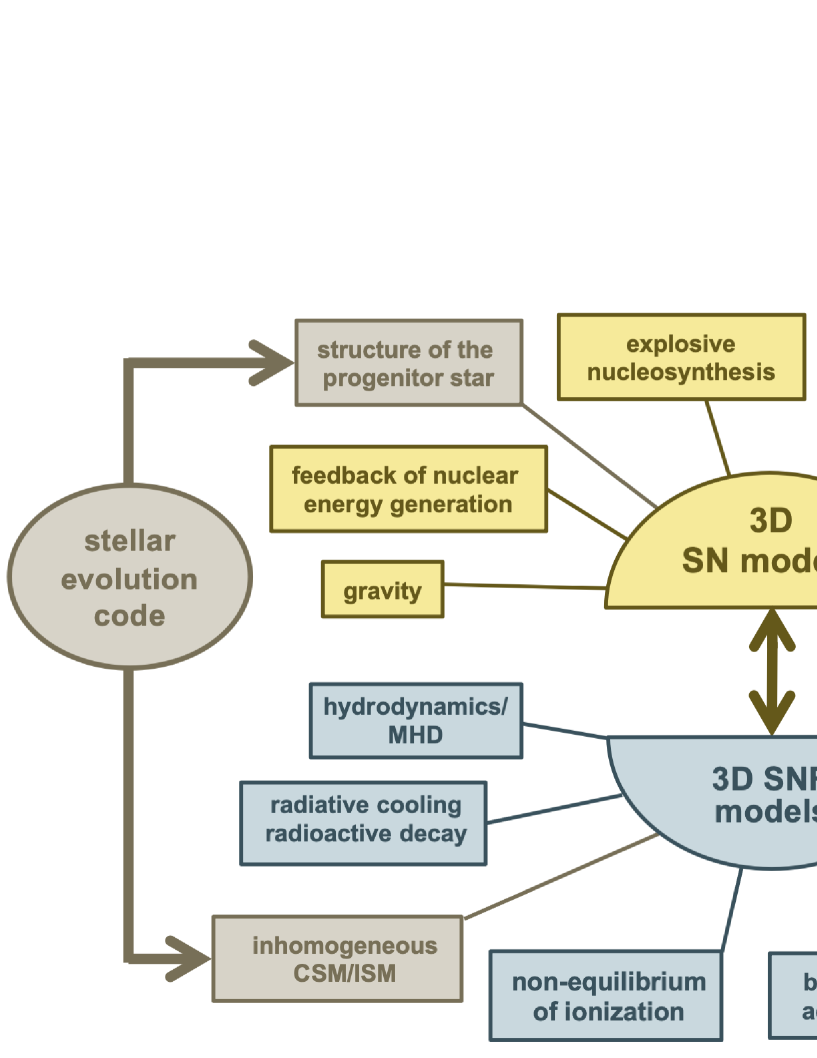
The approach we have adopted is multi-disciplinary, encompassing two main aspects: a) the development and use of comprehensive models that describe the evolution of massive stars, the dynamics of SN explosions, and the expansion of SNRs; b) the accurate analysis of multi-band observations of progenitor systems and SNRs, followed by a detailed comparison of the observational data with the results obtained from our models. In our modeling efforts, we devised a comprehensive descriptive framework resulting through the coupling of state-of-the-art models of stellar evolution, core-collapse SN and SNR (see Fig. 1).
In general, we considered stellar models that describe the evolution of massive stars from the pre-main-sequence phase up to the pre-SN stage. Throughout our investigations, we have examined diverse progenitor types, including red supergiants [52, 43], stripped-envelope supergiants [50] (namely red supergiants that have lost their hydrogen envelope thousands of years before collapse), blue supergiants [25, 39], supergiants resulting from the merging of two massive stars [45], and luminous blue variables [18]. These models describe the star’s configuration at the time of core collapse, providing the initial conditions for our SN models in the form of radial profiles of quantities such as density, pressure, velocity (including the rotational velocity of the star), and various chemical species distributions.
The 3D SN models (such as those presented in [50] and [26]) describe the intricate phases subsequent to the core-collapse of the progenitor star. These models include all the necessary components to elucidate the processes occurring during these phases (such as radioactive decay, explosive nucleosynthesis, gravity, and the feedback from nuclear energy generation) as well as stochastic processes (such as convective overturn due to neutrino heating and the activity of the standing accretion shock instability - SASI) that arise and influence the post-explosion asymmetry in the distribution of ejected materials. The SN models provide the initial conditions for our SNR simulations a few hours (typically 1 day) after the core-collapse and soon after the breakout of the SN blast at the surface of the star.
Our 3D SNR models include all the necessary ingredients to describe the expansion of the remnant within a non-uniform environment (CSM or ISM). To be more specific, our models incorporate: a magnetized surrounding medium; the energy release stemming from radioactive decay of isotopes (such as the radioactive decay chain 56Ni Co Fe [36]); deviations from ionization equilibrium and electron-proton temperature equilibration [31]; the back-reaction of accelerated cosmic rays [27]; radiative losses from optically thin plasma; and magnetic-field-oriented thermal conduction [28]. Providing an accurate and realistic description of the ambient environment through which the remnant expands is a pivotal aspect of our methodology. To achieve this, our studies focus on specific SNRs that provide observational constraints for the structure and density distribution of the surrounding medium (e.g., SN 1987A, Cas A, IC 443). Alternatively, we capitalize on the outputs from stellar evolution models, which, in addition to detailing the progenitor’s structure at collapse, offer insights into its mass-loss history. From these data, we are able to formulate a coherent description of the CSM through dedicated 3D MHD simulations.
An essential step in our methodology is the synthesis of observables, including both thermal and non-thermal emissions across diverse spectral ranges, as well as the spatial arrangement and chemical makeup of ejected materials. In this way we can compare model outcomes (including synthetic spectra, light curves, and emission maps) against specific observations, thereby establishing a two-way exchange of insights. Firstly, we can constrain the models and fine-tune their accuracy with observations, and secondly, we can interpret with the models the distinctive signatures of various phenomena evident in the observations.
It is worth noting that our approach has facilitated the link of modeling attempts that were previously carried out independently, each focusing on specific aspects. Prior efforts were often constrained to singular aspects, such as the stellar evolution, the early phase of the SN up to a few days, or the interaction of SNRs with the inhomogeneous CSM or ISM, starting from idealized parametrized initial conditions (at an age of the remnant of hundreds of yeras). Through the integration of these diverse modeling components into a unified framework, our objective is to achieve a holistic and coherent comprehension of the entire trajectory, spanning from the evolution of the progenitor star to the subsequent phases of SNR development.
3 Imprints of progenitor stars and supernovae on the remnant structure
In the following sections, I will provide a summary of the principal outcomes obtained so far as a result of the approach outlined in Sect. 2. Notably, it has enabled us to: 1) identify the asymmetries of the remnants inherited from the SN explosion, thereby furnishing crucial insights into the mechanisms underpinning SN explosions [32, 26, 44, 36]; 2) identify the fingerprints of the progenitor stellar systems [33, 26], shedding light on the final stages of stellar evolution; 3) probe the structure and geometry of the surrounding CSM or ISM around the SNRs [31, 30, 20, 35, 47, 46, 37], providing insight on the mass loss-history of the progenitor stars in the final phases of their evolution.
3.1 Signatures inherited from the asymmetric SN explosions
A remnant that offers the possibility to study the effects of the SN explosion on the final remnant structure and morphology is Cas A. This is the remnant of a stripped envelope SN exploded years ago. Observations reveal that this particular remnant exhibits a notably intricate structure, marked by substantial large-scale asymmetries and a heterogeneous chemical distribution of ejecta, which collectively shape its distinctive morphology. On the other hand, observations also suggest that the morphology and expansion rate of this remnant are both consistent with its expansion through the (almost) spherically symmetric wind of the progenitor star [17]. These lines of evidence suggest that the bulk of asymmetries in Cas A was inherited from the SN explosion rather than from interaction of the remnant with an inhomogeneous CSM.
Therefore, Cas A presents an exceptional opportunity to bridge the structure of a mature SNR with age of a few hundreds years to the underlying processes that govern the explosion of a core-collapse SN and that give rise to an asymmetric ejecta structure shortly after the collapse. Moreover, Cas A stands as one of the most extensively examined SNRs in our Galaxy. Its three-dimensional structure has been meticulously reconstructed with exceptional precision, thanks to the analysis of multi-wavelength observations [3, 21, 22, 13]. The remnant exhibits three extensive regions rich in iron, surrounded by ejecta abundant in oxygen, silicon, and sulfur. Additionally, the remnant’s structure features two jet-like formations (or more precisely sprays of ejecta knot rather than narrow jets [5]) that are rich in silicon. All of these prominent large-scale features are believed to originate from the pristine structures generated during the SN explosion.
In our initial effort to explore potential origins of the large-scale asymmetries in Cas A, we described its evolution from the SN event to its current age of years. We adopted SN models that describe an initial spherically symmetric explosion, to which parameterized post-explosion anisotropies were introduced by us shortly after the shock breakout at the stellar surface [32]. Our exploration of the parameter space included a range of variables related to these initial anisotropies; this included their density and velocity contrasts relative to the surrounding ejecta, their size, and their position within the remnant. The aim was to identify a specific set of parameters capable of reproducing the masses of shocked silicon, sulfur, and iron, as inferred from the analysis of X-ray observations. Additionally, we explored how the post-explosion anisotropies determine the overall structure and morphology of Cas A. In this way, we were able to establish a connection between the main asymmetries and geometric characteristics observed in the bulk ejecta of Cas A and the physical attributes of anisotropies that emerged shortly after the SN explosion.
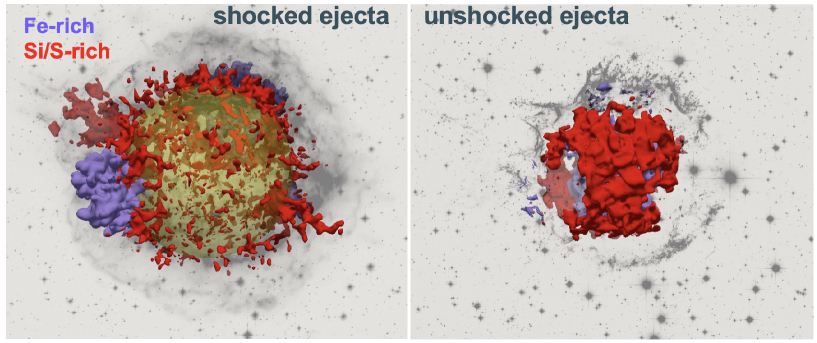
Figure 2 shows the results for our favorite model. The figure describes the distributions of shocked (on the left) and unshocked (on the right) Si, S and Fe at the age of Cas A derived with our model. The figure also shows actual images of Cas A obtained in the optical (Hubble) and X-ray (Chandra) bands to facilitate the comparison between the modeled distributions of ejecta and the observed morphology of the remnant. The model was able to capture the basic properties of the remnant and most of the large-scale asymmetries that characterize its ejecta distribution: the three extended Fe-rich regions and the two Si-rich jet-like structures. In this way, we were able to constrain the average physical characteristics (in particular the energy and masses) of post-explosion anisotropies that are able to reproduce the observed distributions of Si, S, and Fe observed in Cas A.
The pioneering results obtained with our model can serve as a valuable reference for exploring self-consistent SN models. Unlike the SN models discussed above, these self-consistent models incorporate post-explosion anisotropies that naturally arise due to stochastic processes, such as convective overturn due to neutrino heating and the SASI activities, occurring soon after the core-collapse. State-of-the-art models of this nature are those developed by the SN group at Max Planck Institute for Astrophysics in Garching. This group has undertaken an extensive simulation campaign, producing a series of 3D simulations describing neutrino-driven SN explosions, and searched for a model that has the potential to reproduce the fundamental characteristics of Cas A [50]. Remarkably, one of their models produces an ejecta distribution characterized by three distinct Ni-rich fingers that could correspond to the extended Fe-rich regions observed in Cas A. Interestingly, this model considers, as initial conditions for the SN explosion, a progenitor star with an initial mass of that has lost most of its H-envelope down to a rest of at the time of collapse [50]. This aligns with the evidence from observations of light echoes, which indicated that Cas A is the remnant of a type IIb SN (e.g., [15, 38]). These types of SN simulations cease shortly after the shock breakout at the stellar surface, covering only one day of evolution.
As a follow-up to the above study, we have extended the most promising SN simulation conducted by the Garching group. This extension aims to comprehensively describe the subsequent evolution of the SNR over a span of thousands of years [36]. Notably, this simulation represents the first and currently the only one that comprehensively describes the entire 3D evolution of a neutrino-driven SN explosion, spanning from the core-collapse phase to the SNR’s mature age of 2000 years (see Fig. 3). We found that immediately after the shock breakout, both the blast wave and the ejecta freely expand through the spherically symmetric wind of the progenitor star. During the initial year of evolution, the locally deposited energy from the radioactive decay chain 56Ni Co Fe results in inflation of the initially Ni-rich ejecta. This phenomenon is commonly referred to as the "Ni-bubble effect" (see also [7]). Subsequently, the Fe-rich plumes expand and start the interaction with the reverse shock approximately 30 years after the SN event. This is the time when the Fe-rich regions, observed in Cas A, begin to form as a result of this interaction.
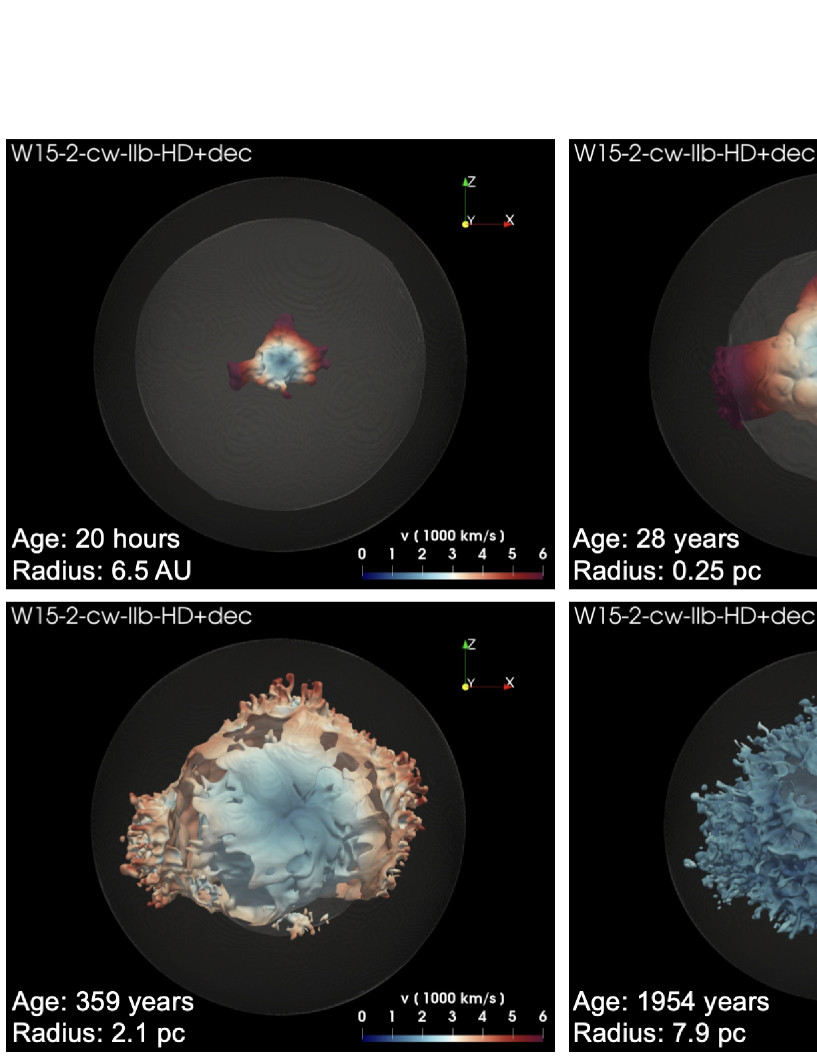
In the subsequent stages of evolution, the expansion of the ejecta continues. HD instabilities manifest at the contact discontinuity, giving rise to the formation of ring and crown structures within the shocked Fe-rich regions when the SNR is approximately 350 years old. These smaller-scale features bear a qualitative resemblance to those observed in Cas A [21]. As for the unshocked ejecta, the simulation reveals that voids and cavities constitute their structural characteristics, mirroring what is observed in Cas A [22]. In our model, these cavities result from the efficient Ni-bubble effect during the first year of evolution. Furthermore, the simulation illustrates that the three Fe-rich plumes inherited from the SN define a plane where the ejecta, rich in Ti and Fe, expand preferentially. This configuration gives rise to a "thick-disk" geometry for the ejecta, which is tilted at an angle of approximately -30 degrees relative to the plane of the sky. This geometry (and orientation) bears a striking resemblance to the one observed in Cas A [3, 21]. In the subsequent phases of the evolution, the model describes the continued expansion of the remnant until it reaches an age of 2000 years. This comprehensive approach allowed us to make predictions about the future evolution of Cas A and compare the model results with those of other observed SNRs. For example, we compared our findings with the Galactic core-collapse SNR G292.0+1.8, an older counterpart to Cas A with an estimated age of approximately 2000 years [19].
We note that our neutrino-driven SNR model does not account for the Si-rich jets that are observable in Cas A. We proposed that these jets might originate from a post-explosion phenomenon not included in our simulations. For example, the presence of an accretion disk composed of fallback matter around the newly formed neutron star could potentially give rise to the jets through a mechanism similar to that responsible for the formation of jets in pulsars [36].
Nonetheless, our simulations have effectively demonstrated that a neutrino-driven SN explosion provides a natural explanation for the majority of the observed asymmetries and features within Cas A. Specifically, the observed structure of the ejecta arises from the interaction between the reverse shock and the initial large-scale asymmetries that emerged due to stochastic processes during the SN. These processes, such as convective overturn and SASI activities, initiated within the first few seconds of the SN explosion. In essence, our findings establish that even at an age of hundreds of years, SNRs still retain traces of the events that occurred immediately following the core-collapse. As a result, they carry valuable information about the physics of the SN engine.
3.2 The imprint of the progenitor star
SNRs are also expected to potentially preserve traces of their progenitor star’s structure. However, discerning the progenitor’s influence on the final remnant structure is a complex task due to the necessity of untangling the effects of the progenitor from those arising from the SN explosion and the interaction of the remnant with the CSM. Among historical SNRs, that of SN 1987A presents the most promising prospects for identifying the progenitor’s imprint on the SNR structure. This is primarily because the evolution of the SN and the subsequent transition to the SNR phase have been continuously monitored across various wavelengths. Moreover, observations of the progenitor star were collected prior to its collapse, providing us with comprehensive details regarding its properties, including its luminosity and photospheric temperature (i.e., its position in the Hertzsprung–Russell diagram). These factors collectively establish SN 1987A as the prime target for investigating the intricate connection between the progenitor star, the SN, and the resulting SNR.
Like many SNRs, SNR 1987A exhibits multiple asymmetries within its morphology. The most prominent ones, such as the ring-like structure visible across all wavelengths, are primarily attributed to the interaction of the remnant with a complex and dense CSM (see Sect. 3.3). Our current focus centers on the anisotropies characterizing the structure of the unshocked ejecta, specifically the stellar debris that has not yet interacted with the reverse shock and that, therefore, is not affected by the interaction with the CSM. As a result, this portion of the ejecta has the potential to retain both the characteristics of the progenitor star’s structure and the hallmarks of the SN explosion.
Observations made 1-2 years after the SN event have unveiled iron lines displaying a redshifted centroid at approximately km s-1, with wings extending beyond km s-1 [11]. These findings suggest the presence of metal-rich ejecta forming clumps rapidly receding from the observer. Around 20 years later, NuSTAR observations corroborated this discovery by detecting lines resulting from the decay of 44Ti, once again revealing a redshifted Doppler velocity of approximately km s-1 [2]. This reaffirms the presence of metal-rich ejecta moving away from the observer at velocities in the hundreds of km s-1 range. Finally, recent ALMA observations has allowed researchers to delve into the innermost structure of the unshocked ejecta. These observations facilitated the reconstruction of the 3D distribution of molecules such as carbon monoxide (CO) and silicon monoxide (SiO) [1]. Intriguingly, they demonstrated that these molecules are arranged in a torus-like distribution tilted at an angle of about with respect to the dense inner equatorial ring that characterize the CSM [42].
All of the above lines of evidence collectively and robustly indicate that the explosion giving rise to SN 1987A was profoundly asymmetric in nature. Given that the development of post-explosion asymmetries (due to stochastic processes following the collapse) can reflect the internal structure of the stellar interior where they originate [51], a natural question is: could insights into the structure of the progenitor star at the time of its collapse, and consequently into its nature, be obtained from the analysis of these asymmetries?
To answer the above question, we coupled together stellar evolution models, 3D core-collapse SN models, and 3D SNR models [33, 26]. The stellar models describe the evolution of the progenitor star and its structure at the time of collapse. We explored three scenarios: a blue supergiant that evolved as a solitary star [25], a blue supergiant formed through the slow-merger of two massive stars [45], and a red supergiant [52]. Of particular interest was the slow-merger scenario, as it proved capable of reproducing a majority of the observational constraints linked to the progenitor star of SN 1987A (Sanduleak ). This model successfully replicated the star’s transition from red to blue, its lifespan of approximately 20,000 years, its total mass at the time of collapse (around ), and its position in the Hertzsprung-Russell diagram (with values of and ) at the time of collapse. To further explore the sensitivity of a remnant to the progenitor’s structure, we also considered a red supergiant model, which exhibited a substantially different stellar structure compared to the other two models.
The progenitor models served as the basis for establishing the initial conditions in our 3D SN simulations. For our purposes, we characterized the initial asymmetry of the SN by assuming a bipolar explosion. This asymmetry was regulated by two key parameters: the ratio of energy deposition along the polar axis in comparison to the equatorial plane at the boundary of the collapsing core, and the ratio between the energy deposition at the two polar regions. Then, we explored the parameter space searching for an optimal set of SN parameters and the orientation of the bipolar explosion with respect to the line of sight that is able to reproduce the observations of SN 1987A as closest as possible. Specifically, this exploration aimed to closely replicate the profiles of Fe lines observed approximately 1-2 years following the SN event. Our SN models covered the initial 20 hours of evolution, and their results provided the initial conditions for the subsequent SNR simulations.
In the final phase of our modeling, we conducted 3D SNR simulations, describing the interaction of the SN blast wave with the non-uniform CSM. This CSM consists of an extensive H II region, creating a torus-like dense environment in close proximity to the explosion’s center, and a dense equatorial ring immersed within the H II region. As with the SN models, we systematically explored the parameter space of the SNR models. Our objective was to identify an optimal set of parameters that would faithfully replicate the X-ray emissions observed from SNR 1987A.
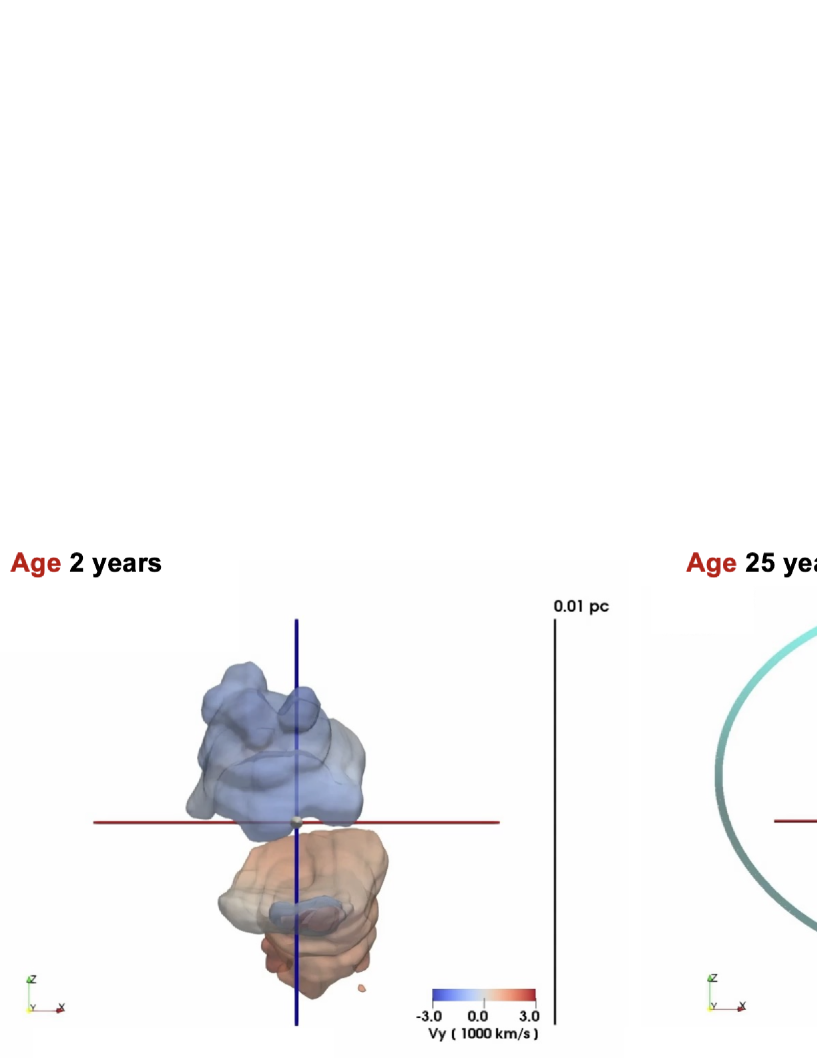
Using our models, we generated observables of the SNR that include emission maps, spectra, light curves, and spatial distributions of ejecta and molecules. We then compared these model-derived results with actual observations collected throughout the entire evolution, spanning from the SN phase to the present age of the fully-developed SNR. Our analysis revealed that the model that most accurately replicates the majority of observables corresponds to the slow-merger scenario as the progenitor stellar system. Figure 4 displays selected outcomes from our best-fit model. Notably, this model predicts the presence of two Fe-rich clumps moving in opposite directions: a heavier one moving southward, away from the observer, and the other heading northward, toward the observer (see left panel of Fig. 4). These clumps lead to Fe line profiles at the age of 1-2 years that strikingly resemble the observed profiles. Specifically, the lines are redshifted, with a peak velocity of approximately 300 km s-1, and exhibit broadening, with wings extending to velocities exceeding 3000 km s-1. Additionally, our model enabled us to constrain the energy of the explosion, estimated to be around erg, and the orientation of the bipolar explosion relative to the line of sight.
At the age of 25 years, our analysis revealed that the innermost structure of the ejecta still exhibits the presence of two clumps, both rich in Ti and Fe (see center panel of Fig. 4). We generated synthetic lines from the decay of 44Ti and compared them with observations collected by NuSTAR at the same age. Once again, we determined that the model providing the closest match to the observed lines (reproducing its redshift and broadening) corresponds to the scenario in which the progenitor star resulted from a merger. The redshift observed in the Fe and Ti lines primarily stems from the inherent asymmetry in the energy deposition, as assumed in the bipolar SN model, at the two polar regions. Interestingly, our model also reproduces many of the properties of the two Fe-rich clumps recently revealed by JWST observations [16].
Finally, we generated spatial distributions of CO and SiO molecules at the age of 25-27 years, as illustrated in the right panel of Fig. 4. Then, we compared these outcomes with distributions derived from ALMA observations. We found that the observed distributions align quite closely with models assuming a blue supergiant as the progenitor star. Notably, the model based on a red supergiant progenitor fails to replicate these distributions. This implies that the structure of the ejecta exhibits sensitivity to the progenitor star’s structure at the time of collapse, keeping memory of the characteristics of the progenitor even decades after the SN explosion. Indeed both the other two models (assuming a blue supergiant progenitor) successfully reproduced the toroidal distribution of the molecules. It’s noteworthy that these models predict a size and orientation in the space for the torus-like distributions of CO and SiO that remarkably align with those observed. Consequently, we concluded that this particular feature serves not only as a signature of the progenitor star but also as an indicator of the bipolar explosion and its orientation in space.
3.3 Effects of the circumstellar medium on the remnant morphology
As previously discussed, the most notable features of SNR 1987A are a direct consequence of its interaction with a highly inhomogeneous CSM. Detailed observations across various wavelengths, including radio, infrared, optical, and X-ray bands, show a remnant distinguished by a prominent ring-like structure. This distinctive morphology arises from the collision between the SN blast and an H II region, as well as a dense equatorial ring, around the center of explosion [42]. Constraining the density distribution of the CSM is important to gain insights into the mass loss history of the progenitor star during the concluding stages of its evolution.
We used our model, which describes the evolution from SN 1987A to its remnant (as outlined in Sect. 3.2), to constrain the geometry and density distribution of the surrounding CSM. Additionally, we assessed the contributions of various plasma components to both the thermal and non-thermal emissions originating from the remnant [31, 30, 33]. This achievement was made possible through a meticulous comparison of the model’s outcomes with radio and X-ray light curves and emission maps [30, 33], as well as X-ray spectra [20], all derived from actual observations spanning approximately 30 years of evolution.
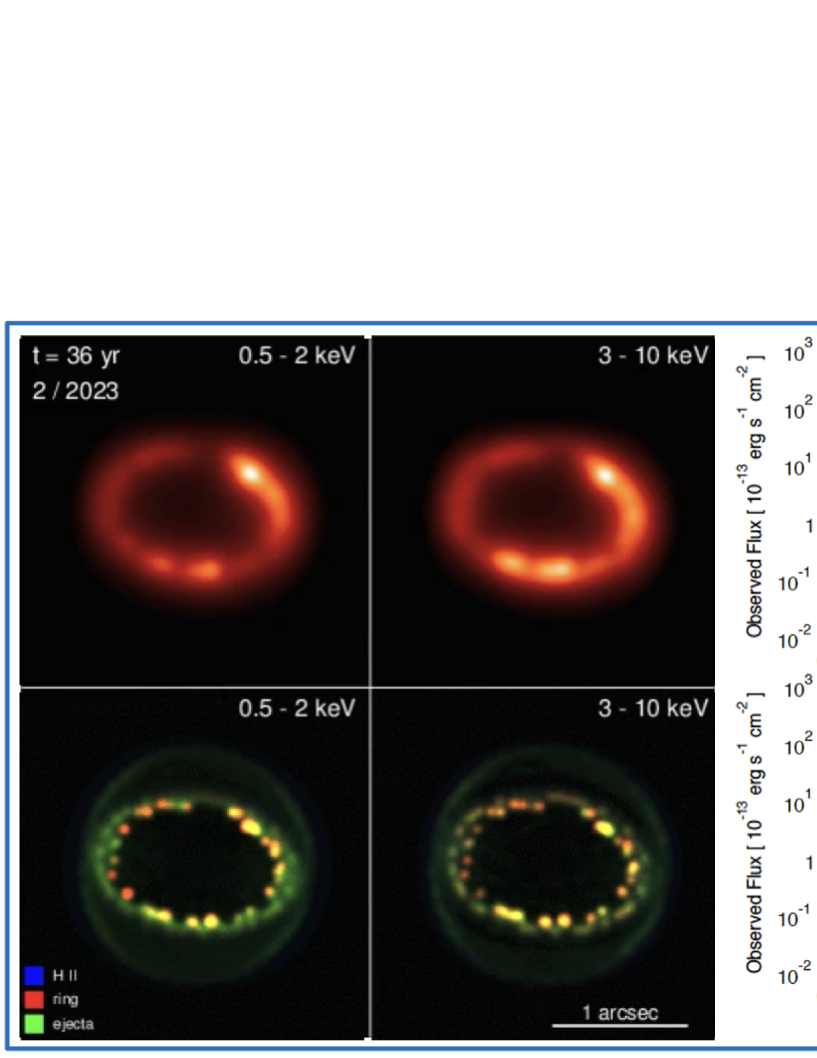
As an illustrative example, Fig. 5 displays the X-ray emission synthesized by our best-fit model of SN 1987A and the comparison with observational data [33]. We found that the same model, which reproduces the asymmetries in the distribution of ejecta inherited from the SN explosion (see Sect. 3.2), also successfully reproduces the asymmetries induced by the interaction of the remnant with the inhomogeneous CSM, leading to the observed X-ray morphology (emission maps on the left panels of the figure) and the light curves in both the soft and hard X-ray bands (displayed in the panels on the right of the figure). We also found that the same model is able to replicate remarkably well high- and low-resolution X-ray spectra collected for SN 1987A in different stages of evolution [20] as well as radio maps and light curve [30].
According to our model, the interaction between the remnant and the CSM started approximately three years after the SN event. During this phase, the shocked material from the H II region and the outer shocked ejecta caused a rapid increase in X-ray emission, as evident in the light curves. Simultaneously, it led to the distinctive ring-like morphology observed in the remnant. This phase persisted for roughly 14 years. Subsequently, the soft light curve exhibited a further steepening when the blast wave encountered the dense equatorial ring. In this second phase of evolution, the X-ray emission was predominantly driven by the shocked material from the ring. According to our model, this phase concluded around 34 years after the SN explosion when the soft X-ray light curve significantly flattened and, then, slightly decreased. In the subsequent phase of evolution, the X-ray emission began to be predominantly driven by the shocked ejecta.
In the case of SNR 1987A, the influence of the CSM on the structure and appearance of the remnant is clearly evident. Consequently, it is not surprising that the comparison between our models and observations has enabled us to constrain the CSM’s geometry and density distribution, as well as offer predictions on the future evolution of the remnant. In the next case, I illustrate how our approach can be very useful, even when there is no apparent evidence of an interaction between the remnant and an inhomogeneous CSM in the data.
In Sect.3.1, it is mentioned that observations suggest that SNR Cas A is expanding through the spherically symmetric wind of its progenitor star. However, some asymmetries of its reverse shock cannot be explained if the CSM around the remnant is spherically symmetric. These include the inward-moving reverse shock observed in the western hemisphere [48], the offset between the geometric centers of the reverse and forward shocks [8], and the evidence that nonthermal emission from the reverse shock is brighter in the western region compared to the eastern region [12]. In fact, models of Cas A that assume a spherically symmetric CSM, in which the remnant expands, fail to replicate these asymmetries [36].
Motivated by the discrepancies evidenced between models and observations, we explored the possibility that Cas A encountered an inhomogeneous CSM during its expansion. More precisely, we postulated that the remnant interacted with an asymmetric circumstellar shell in the past. We then explored the parameter space of this shell, searching for a configuration that could account for the observed asymmetries in the reverse shock of Cas A [35].
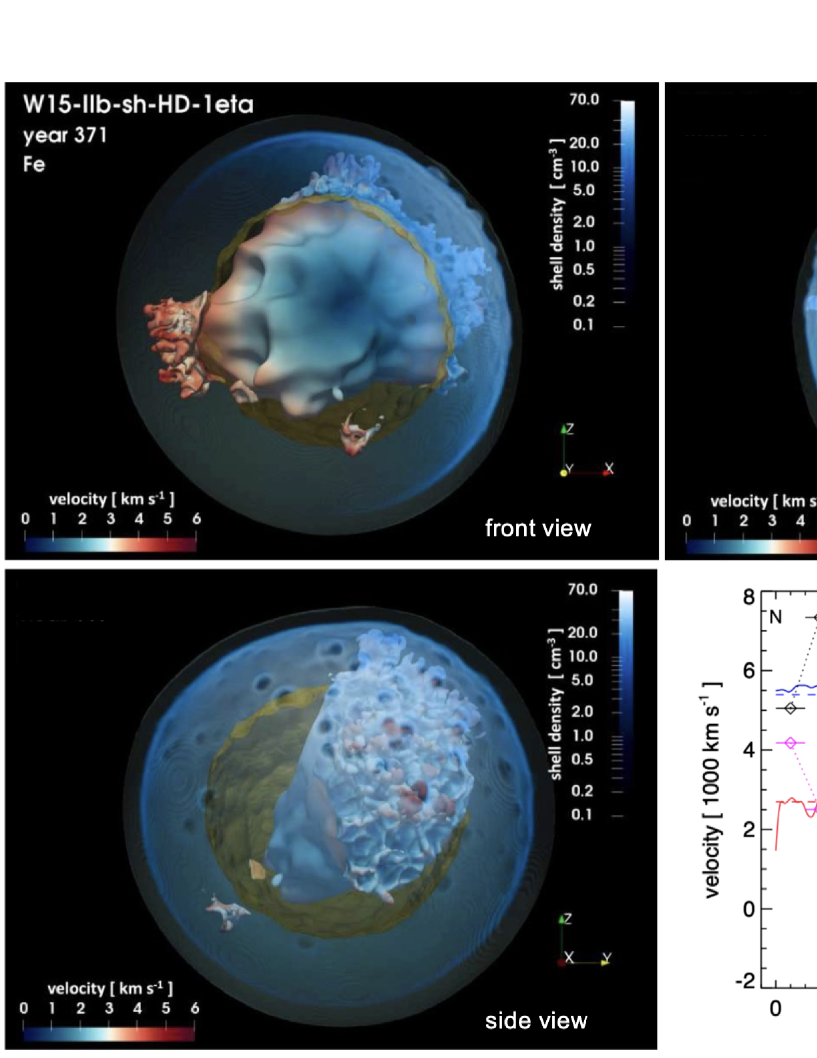
We have found that the interaction between the remnant and a circumstellar shell can generate asymmetries resembling those observed in the reverse shock. Figure 6 illustrates the results of our favourite model in which the asymmetric shell had its densest portion located on the nearside to the northwest. According to this model, the shell was relatively thin, with a thickness of approximately pc, and its radius extended to about pc from the center of the explosion. According to the model, at the current age of Cas A, the reverse shock exhibits several notable asymmetries which resamble those of Cas A: it moves inward in the observer’s frame within the northwest region while moving outward in most other regions; the geometric center of the reverse shock is offset to the northwest by approximately pc from the geometric center of the forward shock; and the reverse shock in the northwest region displays enhanced nonthermal emission because the ejecta enter the reverse shock there with a higher relative velocity (ranging between and km s-1) compared to other regions (below km s-1).
We concluded that the large-scale asymmetries observed in Cas A’s reverse shock can be attributed to the interaction between the remnant and an asymmetric, dense circumstellar shell that occurred between approximately and years after the SN event. This shell was likely the result of a massive eruption (with an estimated mass on the order of ) from the progenitor star, which took place between and years before its core collapse.
4 Summary and Conclusions
In this brief review, I have presented an approach that we have developed to follow the path from massive stars to SNe and SNRs in a coherent way. This approach enables us to explore the connection between progenitor stars, SNe, and SNRs. Indeed there is a broad consensus in the literature that the morphologies and properties of SNRs reflect various factors, including: asymmetries inherited from the parent SN explosion; the structure of the progenitor stars at collapse; the interaction of the remnants with the inhomogeneous ambient environment (CSM or ISM). Therefore, deciphering multi-wavelength observations of SNRs can be of paramount importance for extracting valuable information about: the complex phases in SN evolution following core-collapse, shedding light on the processes governing the SN engine; the internal structure of the progenitor stars, providing insights into their nature; the structure of the CSM, offering clues about the mass-loss history of the progenitor stellar systems. This underscores why the study of the progenitor-SN-SNR connection has breakthrough potential to open new exploring windows on the physics of massive stars, SNe, and SNRs.
Our approach is based on the development of 3D HD/MHD models that describe the evolution from the core-collapse SN to the fully developed SNR. This approach incorporates information regarding the structure of the progenitor star and the CSM, derived from stellar evolution models and observational analyses. In this review, I have highlighted a few illustrative applications of this methodology, with a specific focus on the cases of Cas A and SN 1987A. These applications demonstrate how we can extract valuable insights from the observations of these SNRs, providing us with information about the physics of the SN engine, the nature of the progenitor star, and the characteristics of the CSM.
Furthermore, our approach can also be highly effective in investigating the "after-life" of massive stars, particularly concerning the formation of compact objects situated at the centers of SNRs. While this aspect was not the focus of the present review, it is worth mentioning the case of SN 1987A. Indeed, in this case, the comparison of our SN 1987A model with observations evidenced the presence of an excess in the hard X-ray band at energies above 10 keV [9]. Our subsequent analysis allowed us to identify this excess with a non-thermal source compatible with the presence of a pulsar wind nebula surrounded by the dense and cold ejecta material at the heart of the remnant [9, 10, 4].
We have determined that the approach outlined here can be very useful and effective in investigating the progenitor-SN-SNR connection. However, it’s important to note that deciphering the observations may critically depend on the models. Consequently, these models should establish a self-consistent link between progenitor stars, SNe, and SNRs, necessitating a multi-physics, multi-scale, and multi-dimensional approach. Furthermore, these models should be firmly based on solid observational data, accounting for the dynamics, energetics, and spectral properties of SNe and SNRs. As a result, the synthesis of observables from the models, including spectra, emission maps, light curves, and more, becomes of paramount importance in order to rigorously constrain the models.
These models can also serve as powerful tools for the analysis and interpretation of data. This is of particular significance in the current era and in the near future, given the wealth of high-quality data that will be gathered. The observational datasets obtained with state-of-the-art instruments like JWST and XRISM, as well as the forthcoming contributions from facilities such as SKA, CTA, LEM, and Athena, will unquestionably require advanced tools for their analysis and interpretation. In this context, the models we have discussed here can play a crucial role as indispensable tools, positioned to bridge the gap between observational data and meaningful interpretation.
Acknowledgments
I thank the referee, Hiroyuki Uchida, for the useful feedback that allowed me to improve the paper. Many colleagues have contributed to the findings reported here; in particular, I am grateful to F. Bocchino, A. Dohi, E. Greco, H.-T. Janka, M. Miceli, S. Nagataki, M. Ono, O. Petruk, A. Tutone, S. Ustamujic, A. Wongwathanarat for their fundamental contributions to the success of the project. I acknowledge partial financial contribution from the PRIN INAF 2019 grant “From massive stars to supernovae and supernova remnants: driving mass, energy and cosmic rays in our Galaxy”. The navigable 3D graphics have been developed in the framework of the project 3DMAP-VR (3-Dimensional Modeling of Astrophysical Phenomena in Virtual Reality; [34, 29]) at INAF-Osservatorio Astronomico di Palermo.
References
- Abellán et al. [2017] Abellán, F. J., Indebetouw, R., Marcaide, J. M., et al. 2017, ApJ, 842, L24
- Boggs et al. [2015] Boggs, S. E., Harrison, F. A., Miyasaka, H., et al. 2015, Science, 348, 670
- DeLaney et al. [2010] DeLaney, T., Rudnick, L., Stage, M. D., et al. 2010, ApJ, 725, 2038
- Dohi et al. [2023] Dohi, A., Greco, E., Nagataki, S., et al. 2023, ApJ, 949, 97
- Fesen et al. [2006] Fesen, R. A., Hammell, M. C., Morse, J., et al. 2006, ApJ, 645, 283
- Fields & Couch [2021] Fields, C. E. & Couch, S. M. 2021, ApJ, 921, 28
- Gabler et al. [2021] Gabler, M., Wongwathanarat, A., & Janka, H.-T. 2021, MNRAS, 502, 3264
- Gotthelf et al. [2001] Gotthelf, E. V., Koralesky, B., Rudnick, L., et al. 2001, ApJ, 552, L39
- Greco et al. [2021] Greco, E., Miceli, M., Orlando, S., et al. 2021, ApJ, 908, L45
- Greco et al. [2022] Greco, E., Miceli, M., Orlando, S., et al. 2022, ApJ, 931, 132
- Haas et al. [1990] Haas, M. R., Colgan, S. W. J., Erickson, E. F., et al. 1990, ApJ, 360, 257
- Helder & Vink [2008] Helder, E. A. & Vink, J. 2008, ApJ, 686, 1094
- Holland-Ashford et al. [2020] Holland-Ashford, T., Lopez, L. A., & Auchettl, K. 2020, ApJ, 889, 144
- Janka [2017] Janka, H.-T. 2017, “Neutrino-Driven Explosions” chapter in Handbook of Supernovae (edited by Athem W. Alsabti and Paul Murdin, ISBN 978-3-319-21845-8. Springer International Publishing, Switzerland), p. 1095
- Krause et al. [2008] Krause, O., Birkmann, S. M., Usuda, T., et al. 2008, Science, 320, 1195
- Larsson et al. [2023] Larsson, J., Fransson, C., Sargent, B., et al. 2023, ApJ, 949, L27
- Lee et al. [2014] Lee, J.-J., Park, S., Hughes, J. P., & Slane, P. O. 2014, ApJ, 789, 7
- Limongi & Chieffi [2018] Limongi, M. & Chieffi, A. 2018, ApJS, 237, 13
- Long et al. [2022] Long, X., Patnaude, D. J., Plucinsky, P. P., & Gaetz, T. J. 2022, ApJ, 932, 117
- Miceli et al. [2019] Miceli, M., Orlando, S., Burrows, D. N., et al. 2019, Nature Astronomy, 3, 236
- Milisavljevic & Fesen [2013] Milisavljevic, D. & Fesen, R. A. 2013, ApJ, 772, 134
- Milisavljevic & Fesen [2015] Milisavljevic, D. & Fesen, R. A. 2015, Science, 347, 526
- Milisavljevic & Fesen [2017] Milisavljevic, D. & Fesen, R. A. 2017, “The Supernova - Supernova Remnant Connection” chapter in Handbook of Supernovae (edited by Athem W. Alsabti and Paul Murdin, ISBN 978-3-319-21845-8. Springer International Publishing, Switzerland), p. 2211
- Morris & Podsiadlowski [2007] Morris, T. & Podsiadlowski, P. 2007, Science, 315, 1103
- Nomoto & Hashimoto [1988] Nomoto, K. & Hashimoto, M. 1988, Phys. Rep., 163, 13
- Ono et al. [2020] Ono, M., Nagataki, S., Ferrand, G., et al. 2020, ApJ, 888, 111
- Orlando et al. [2012] Orlando, S., Bocchino, F., Miceli, M., Petruk, O., & Pumo, M. L. 2012, ApJ, 749, 156
- Orlando et al. [2008] Orlando, S., Bocchino, F., Reale, F., Peres, G., & Pagano, P. 2008, ApJ, 678, 274
- Orlando et al. [2023] Orlando, S., Miceli, M., Lo Cicero, U., & Ustamujic, S. 2023, in Memorie della Societa Astronomica Italiana, Vol. 94, 13
- Orlando et al. [2019a] Orlando, S., Miceli, M., Petruk, O., et al. 2019a, A&A, 622, A73
- Orlando et al. [2015] Orlando, S., Miceli, M., Pumo, M. L., & Bocchino, F. 2015, ApJ, 810, 168
- Orlando et al. [2016] Orlando, S., Miceli, M., Pumo, M. L., & Bocchino, F. 2016, ApJ, 822, 22
- Orlando et al. [2020] Orlando, S., Ono, M., Nagataki, S., et al. 2020, A&A, 636, A22
- Orlando et al. [2019b] Orlando, S., Pillitteri, I., Bocchino, F., Daricello, L., & Leonardi, L. 2019b, Research Notes of the American Astronomical Society, 3, 176
- Orlando et al. [2022] Orlando, S., Wongwathanarat, A., Janka, H. T., et al. 2022, A&A, 666, A2
- Orlando et al. [2021] Orlando, S., Wongwathanarat, A., Janka, H. T., et al. 2021, A&A, 645, A66
- Petruk et al. [2023] Petruk, O., Beshley, V., Orlando, S., et al. 2023, MNRAS, 518, 6377
- Rest et al. [2011] Rest, A., Foley, R. J., Sinnott, B., et al. 2011, ApJ, 732, 3
- Shigeyama & Nomoto [1990] Shigeyama, T. & Nomoto, K. 1990, ApJ, 360, 242
- Slane et al. [2015] Slane, P., Bykov, A., Ellison, D. C., Dubner, G., & Castro, D. 2015, Space Science Reviews, 188, 187
- Smith & Arnett [2014] Smith, N. & Arnett, W. D. 2014, ApJ, 785, 82
- Sugerman et al. [2005] Sugerman, B. E. K., Crotts, A. P. S., Kunkel, W. E., Heathcote, S. R., & Lawrence, S. S. 2005, Astrophys. J. Suppl. Ser., 159, 60
- Sukhbold et al. [2016] Sukhbold, T., Ertl, T., Woosley, S. E., Brown, J. M., & Janka, H.-T. 2016, ApJ, 821, 38
- Tutone et al. [2020] Tutone, A., Orlando, S., Miceli, M., et al. 2020, A&A, 642, A67
- Urushibata et al. [2018] Urushibata, T., Takahashi, K., Umeda, H., & Yoshida, T. 2018, MNRAS, 473, L101
- Ustamujic et al. [2021a] Ustamujic, S., Orlando, S., Greco, E., et al. 2021a, A&A, 649, A14
- Ustamujic et al. [2021b] Ustamujic, S., Orlando, S., Miceli, M., et al. 2021b, A&A, 654, A167
- Vink et al. [2022] Vink, J., Patnaude, D. J., & Castro, D. 2022, ApJ, 929, 57
- Wongwathanarat et al. [2013] Wongwathanarat, A., Janka, H. T., & Müller, E. 2013, A&A, 552, A126
- Wongwathanarat et al. [2017] Wongwathanarat, A., Janka, H.-T., Müller, E., Pllumbi, E., & Wanajo, S. 2017, ApJ, 842, 13
- Wongwathanarat et al. [2015] Wongwathanarat, A., Müller, E., & Janka, H.-T. 2015, A&A, 577, A48
- Woosley et al. [2002] Woosley, S. E., Heger, A., & Weaver, T. A. 2002, Reviews of Modern Physics, 74, 1015
- Yoshida et al. [2021] Yoshida, T., Takiwaki, T., Kotake, K., et al. 2021, ApJ, 908, 44
DISCUSSION
JOHN BALLY: How do you explain the two outer-rings in SN 1987A? These are the rings displaced above and below the plane of the inner, X-ray ring.
SALVATORE ORLANDO: The origin of the outer rings in SN 1987A was well explained by Thomas Morris and Philipp Podsiadlowski in 2007 (Morris & Podsiadlowski 2007, Science 315, pp. 1103). These authors found that the mass ejection resulting from the merger between two massive stars (an event that occurred approximately 20,000 years before the supernova explosion) can accurately replicate the characteristics of the triple-ring nebula encircling the supernova. In our simulations of SN 1987A, we have also incorporated the presence of the outer rings in the description of the CSM. However, our findings revealed that the X-ray emission stemming from the shocked outer rings is orders of magnitude lower than that originating from the inner ring. This difference explains why their X-ray emission has not been detected yet.