\ul
Measuring the Prevalence of WiFi Bottlenecks in Home Access Networks
Abstract
As broadband Internet speeds continue to increase, the home wireless (“WiFi”) network may more frequently become a performance bottleneck. Past research, now nearly a decade old, initially documented this phenomenon through indirect inference techniques, noting the prevalence of WiFi bottlenecks but never directly measuring them. In the intervening years, access network (and WiFi) speeds have increased, warranting a re-appraisal of this important question, particularly with renewed private and federal investment in access network infrastructure. This paper studies this question, developing a new system and measurement technique to perform direct measurements of WiFi and access network performance, ultimately collecting and analyzing a first-of-its-kind dataset of more than 13,000 joint measurements of WiFi and access network throughputs, in a real-world deployment spanning more than 50 homes, for nearly two years. Using this dataset, we re-examine the question of whether, when, and to what extent a user’s home wireless network may be a performance bottleneck, particularly relative to their access connection. We do so by directly and continuously measuring the user’s Internet performance along two separate components of the Internet path—from a wireless client inside the home network to the wired point of access (e.g., the cable modem), and from the wired point of access to the user’s ISP. Confirming and revising results from more than a decade ago, we find that a user’s home wireless network is often the throughput bottleneck. In particular, for users with access links that exceed 800 Mbps, the user’s home wireless network was the performance bottleneck 100% of the time.
1 Introduction
Home Internet users invest significant resources and expense improving the state of their wired Internet access connections, which in the United States, now routinely exceed 1 Gbps for many service plans. As wireline broadband access Internet speeds continue to increase, however, home Internet users are increasingly faced with a new performance bottleneck: their home wireless network. The prospect of the home wireless network as an end-to-end performance bottleneck is, in fact, not new: nearly a decade ago, researchers noted that WiFi networks in homes routinely introduced throughput bottlenecks on home networks when the fixed-line ISP throughput exceeded 35 Mbps. Wireless technologies have improved substantially over the last decade, naturally, yet fixed-line Internet throughput also has continued to increase, warranting a re-appraisal of this fundamental question.
The stakes for understanding home Internet performance bottlenecks has perhaps never been higher, as federal funding is poised to invest in Internet infrastructure across the United States. Understanding this question is critically important, especially as increasing attention turns to understanding and mapping Internet speed across the United States and globally. In many cases, Internet speed measurements are conducted with crowdsourced Internet measurement tools (e.g., Ookla’s SpeedTest, Measurement Labs’s NDT), and previous work has observed that client-based speed tests can often be the bottleneck in the end-to-end performance.
Indeed, Internet infrastructure does not stop at the “wall jack”, and the user experience often depends as much on infrastructure inside the home as it does on infrastructure to the home. It does little practical good for an Internet service provider to deliver fast speeds over a wired connection to a single point in the home if the wireless connectivity that users rely on in the rest of the home is poor. Indeed, this concern is not a hypothetical but a very real problem for many Internet users. In April 2021, a Pew Research Center Survey that “roughly half of [U.S.] broadband users report[ed] that they often (12%) or sometimes (37%) experienced problems with the speed, reliability or quality of their high-speed Internet connections at home” and that “29% of broadband users did something to improve the speed, reliability or quality of their [home Internet] since the beginning of the pandemic”. Many people experience problems with their home Internet performance and want to improve it.
Nearly a decade ago, researchers showed that in legacy 802.11 networks, home wireless connectivity was the performance bottleneck in many homes, particularly as access speeds from ISPs exceeded 35 Mbps [14]. Since then, wireless technologies have improved substantially, and ISPs have continued to increase access speeds. In this paper, we revisit the question of whether home wireless connectivity is a performance bottleneck in the modern era. We find that home wireless connectivity is still a performance bottleneck in many homes, particularly for users whose ISP access speeds exceed 100 Mbps; for those whose speeds exceed 800 Mbps, the wireless network is the bottleneck 100% of the time.
This paper makes the following contributions:
-
•
We develop the first method to jointly and continuously measure the performance of the wired and wireless networks in a home network, using a combination of (1) a router-based speedtest performing measurements over the wide-area from the user’s wired network access point; (2) a browser-based plug-in that performs continual throughput measurements from a user’s wireless device inside the home to a speedtest server running inside the home network at the router.
-
•
We affirm and amend the presence of wireless performance bottlenecks in the home network, finding that the prevalence of WiFi bottlenecks increases significantly for homes with access speeds exceeding 100 Mbps, and that homes whose ISP speed tiers exceed 800 Mbps, the home WiFi network was the bottleneck in nearly 100% of the measurements we performed.
-
•
We publicly release our measurement toolkit—router-based speedtest, browser-based home network speedtest, data, and associated analysis—to encourage the continued reassessment of these results, in a broader range of settings, and over time as ISP access networks and WiFi technologies continue to evolve.
2 Background and Related Work
In this section, we provide background on WiFi measurements in access networks, as well as previous work that has performed measurements of WiFi in different capacities and contexts.
2.1 Background
Wireless Internet access via the 802.11 protocol (“WiFi”) has become increasingly prevalent in recent years. As of 2021, 93% of households in the United States had an Internet connection, and the vast majority of these households rely on WiFi for connectivity within the home [8]. The number of devices connected to the Internet has also increased dramatically. As of 2020, the average U.S. household has 25 Internet-connected devices, more than double the number of connected devices in 2019 [2], likely in large part due to the proliferation of Internet of Things (IoT) devices in homes. As wireless Internet connectivity in homes becomes increasingly prevalent, it has become increasingly important to understand whether, and to what extent, home wireless Internet connectivity affects the performance that users ultimately experience in their homes.
A common mode of connectivity in a home network is to first connect to a WiFi router in an Internet user’s home, which then connects the user through a wired network to the rest of the Internet. A household’s WiFi connection typically has different performance characteristics than the corresponding wired connection. WiFi connection performance is determined by factors independent of your access connection, while the access connection performance is primarily determined by the specific service contract you purchase from a service provider (ISP). WiFi bottlenecks occur when the speed of your WiFi connection is worse than the speed of the access connection.
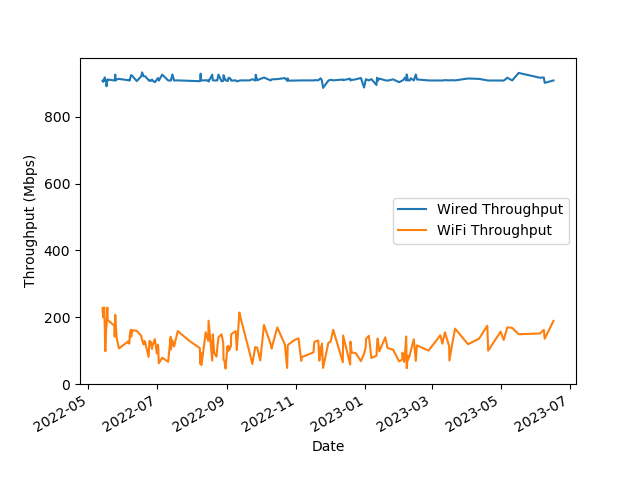
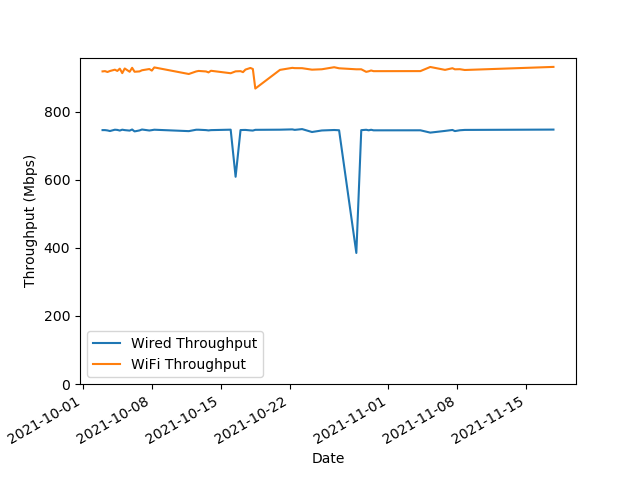
Figure 1 shows WiFi and access speeds from for two households in a large city in the United States. Figure 1(a) has WiFi speeds below wired access speeds. WiFi is a bottleneck 100 percent of the time for this household. Conversely, in Figure 1(b), WiFi speed exceeds access speed. Note that the household with WiFi bottlenecks is paying for Internet service with high access speeds (about 900 Mbps) whereas the household with no bottlenecks is paying for slightly lower access speeds (some of the households in our study have slower access speeds than this example). As the results from our paper show, the prevalence of WiFi bottlenecks is highly correlated with the access speed that a household purchases.
WiFi bottlenecks can significantly affect a user’s online experience. For example, the access ISP connection might support high speeds, but if the corresponding WiFi connection is poor, a user will ultimately experience the network speeds corresponding to the slower WiFi connection. WiFi bottlenecks also have important implications for policies aiming to improve Internet performance in a community. For example, significant attention (and funding) is currently being devoted to improving Internet infrastructure. Yet, ultimately, if performance bottlenecks are in home network infrastructure—and in particular the home wireless network—then investments must also be directed towards assessing and improving the WiFi equipment that households use to access the Internet.
2.2 Related Work
Various previous work has attempted to characterize wireless network performance in specific settings, including home networks. Early seminal work from Sundaresan et al. [14] characterized the performance of 802.11b networks in a home setting, and found that when access link speeds exceeded approximately 30 Mbps, the home wireless network became the bottleneck link. This study’s measurement techniques were indirect: the technique used inferred the presence of bottlenecks based on inter-packet arrivals downstream of the wireless access point. In contrast, this work measures wireless network performance directly. Additionally, this previous work was conducted nearly a decade ago; this work thus constitutes a re-appraisal of this past work.
Previous work from Shi et al. [10] and Chung et al. [1] have also collected client-side wireless network measurements. However, these studies do compare wireless measurements to wired measurements, as ours does. Instead, Chung et al. present the relationship between application traffic and its origin device. Shi et al. strictly collect channel scans, presenting the value of smartphone channel scans. Sui et al. [12] also design and deploy a framework for collecting WiFi measurements. However, their framework measures and characterizes WiFi latency, while ours studies WiFi throughput.
More recently, Feamster and Livingood highlighted the challenges with performing client-based speed tests [3], and presented evidence that in many cases, home wireless access links are the bottleneck in end-to-end Internet speed tests. This work, however, was a survey of the shortcomings of client-based speed tests, of which wireless bottlenecks are one example. This work focuses specifically on the prevalence of wireless bottlenecks in home networks.
Many other studies have studied the prevalance of wireless performance in other contexts, although they have not explicitly focused on the extent to which poor WiFi performance introduces a bottleneck along and end-to-end path. Yang et al. developed a machine learning-based approach for predicting performance degradation in WiFi networks, showcasing the potential of predictive analytics in managing network performance [16]. In 2016, Sui et al. investigated the impact of interference on WiFi performance, emphasizing the significance of interference detection and mitigation strategies [11]. Sui et al. also developed mechanisms for characterising and improving WiFi latency in large-scale operational networks [13]. Other work has explored WiFi performance in high-density environments [6], while other work has explored the implications of security mechanisms on WiFi performance, shedding light on how encryption protocols can contribute to bottlenecks [5]. In the context of the Internet of Things (IoT), Sheth et al. investigated how device heterogeneity contributed to bottlenecks in WiFi networks [9]. Other work has explored the effects of Quality of Service (QoS) mechanisms on WiFi bottleneck identification [15]. Recent work from Grazia explored the impact of emerging technologies, such as Wi-Fi 6, on TCP bottlenecks [4].
3 Method
Measurements: Netrics
We used the public, open-source Netrics platform [7] to conduct periodic downstream throughput measurements for both the access ISP connection and for the internal WiFi connectivity. Netrics is a widely accepted measurement platform, now in use across the United States for many studies of access Internet performance, that has been underway for nearly two years. It currently provides many open-source network measurement tests, including a variety of continuous throughput and latency tests. A common way of performing Netrics measurements is by distributing a single-board computer (typically, a Raspberry Pi) to study participants at vantage points of interest. The participants connect the Pis directly to routers or modems in their home networks, and the Pis measure and archive these performance metrics. The Netrics software distribution can schedule any network measurement and is commonly deployed to run three different periodic throughput tests: Measurement Labs’s NDT7, Ookla’s Speedtest, and iperf3 to a nearby server. The measurement suite also runs a variety of other measurements (e.g., DNS lookup latency, packet loss rates) that we do not analyze.
Contemporaneous measurements of WiFi and ISP.
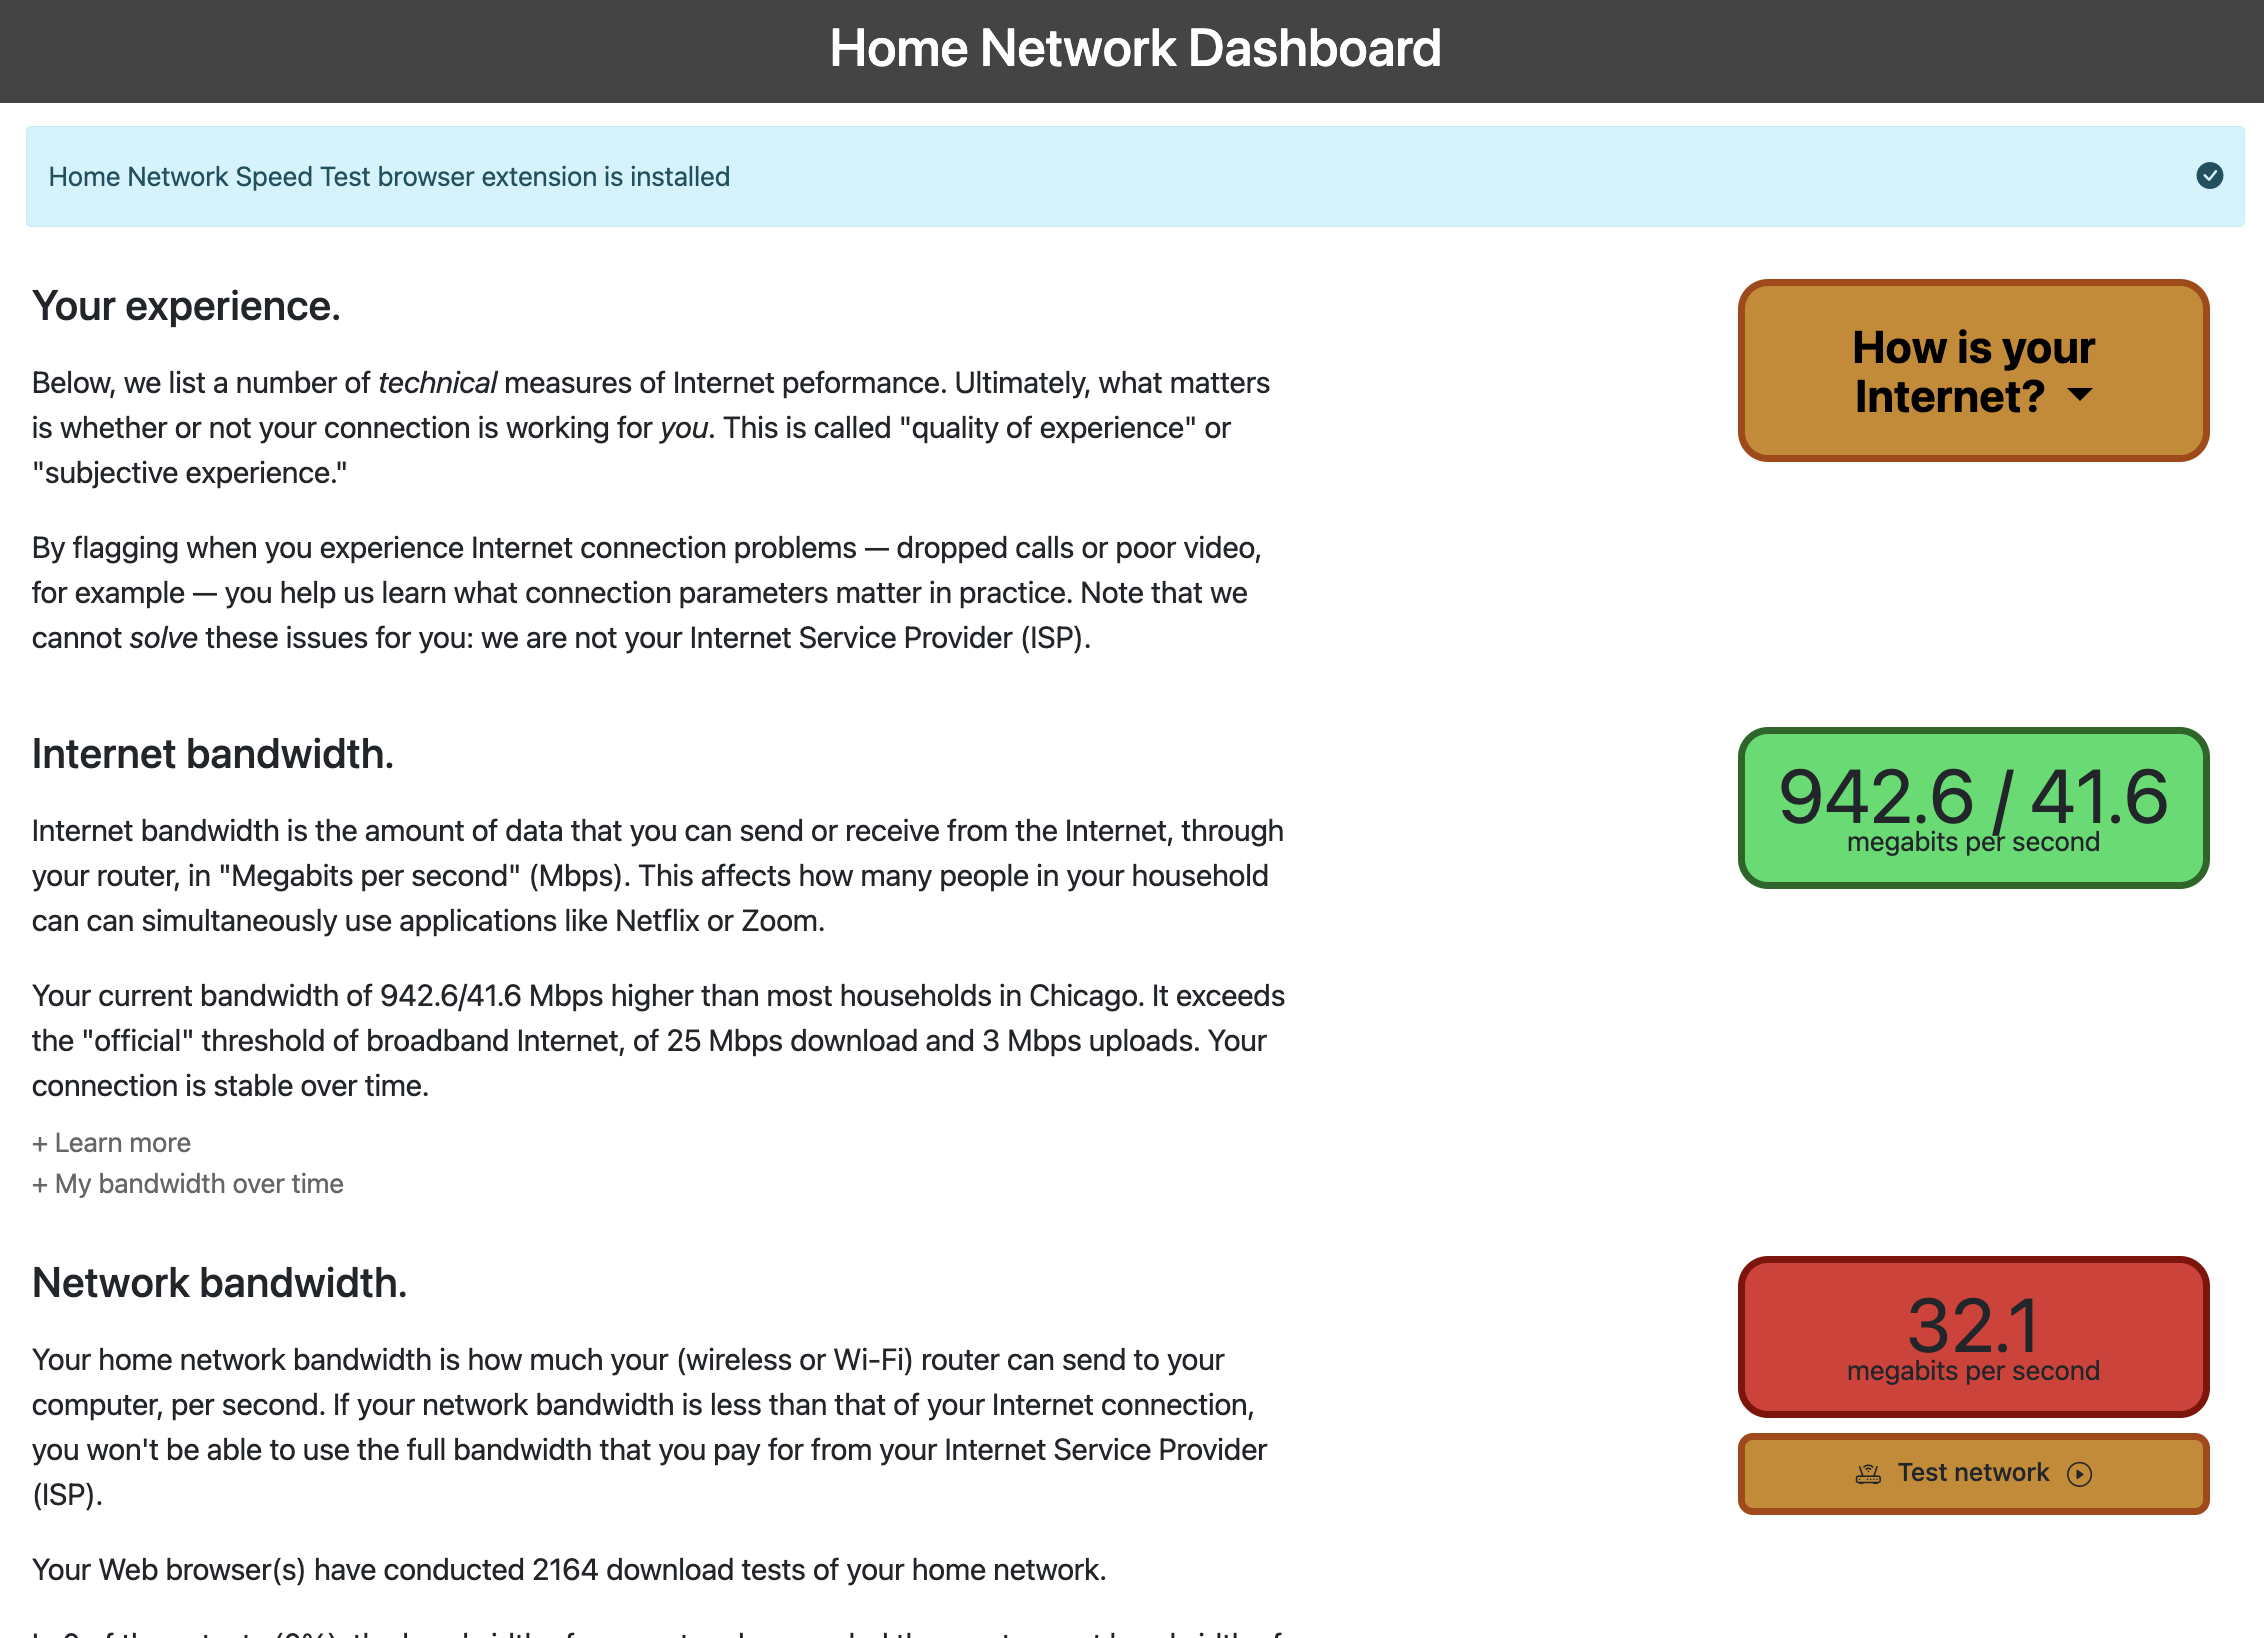
Directly comparing the throughput of the (typically wired) access ISP network to that of the WiFi network from the same household is extremely challenging. It requires deploying infrastructure in the home at the router both to conduct throughput measurements of the access ISP and to host a server for conducting wireless throughput measurements; it requires deploying software on one or more client devices within the home network to measure the home WiFi; and, finally, it requires collecting contemporaneous measurements of both the access ISP throughput and the home wireless network. To perform the throughput measurements from the home wireless network, we hosted a speed test server on a Raspberry Pi, intended to be deployed at or near the home router. A user could then direct his or her browser to the server at https://netrics.local/, which would trigger the browser to run a Javascript-based NDT7 throughput test to the server running on the Raspberry Pi. To enable continuous measurements, we also implemented a public, open-source Chrome browser plugin that would run periodic NDT7 tests from the user’s browser to the server running on the Raspberry Pi, even if the user didn’t explicitly initiate a test. We designed these throughput tests to run every few hours, but the actual frequency of the tests depended on whether someone was using device on which the browser plugin was installed. Figure 2 shows an example of the public, open-source Netrics dashboard, which displays the results of the contemporaneous measurements of the access ISP and the home WiFi network. This particular example shows a case where the measured ISP access throughput (shown in green) is far greater than the measured WiFi throughput (shown in red), indicating that WiFi is the bottleneck.
Participant recruitment.
We installed Netrics on a fleet of Raspberry Pis and recruited participants through community-based organizations and social media channels. Participants were offered a monetary incentive of $100 to install a device to an access point for one month, an additional $25 to continue hosting the device for another six months, and no incentives after that (akin to a “RIPE Atlas model” of ongoing deployment). We have been collecting data from the deployment since June 2021 among our research team, and since October 2021 across a broader set of study participants across one of the largest cities in the United States.
| Period | September 18, 2021 - June 30, 2023 |
|---|---|
| Households | 52 |
| Vantage Points | 65 |
| - ¡ 50 | 3 |
| - 50-100 | 15 |
| - 100-200 | 3 |
| - 200-400 | 10 |
| - 400-800 | 21 |
| - ¿ 800 Mbps | 13 |
| Measurements | 13,581 |
Data collection.
Table 1 summarizes the measurements for the study. The measurements collected for this study were collected from September 18, 2021 through June 30, 2023. To measure download throughputs of both the access link (the access speed) and the wireless network (the WiFi speed), we use Measurement Lab’s Network Diagnostic Tool (NDT7) tool. We performed access throughput measurements for each household approximately once per hour. WiFi speed measurements did not follow a fixed schedule, due to the fact that the WiFi measurements were taken from a user’s browser on a wireless device in the home and thus depended on the user actively using the device where the browser plug-in was installed. To ensure that the measurements compared were taken at around the same time, we re-sampled the data for each household. We used a 6-hour time window and aggregated using the median access and WiFi speed within each window. We used a 6-hour time window because we found that this was the time period in which there was the most samples. This time window had a broad enough window to contain a large amount of data, yet small enough intervals to sufficiently splice the data.
Data analysis.
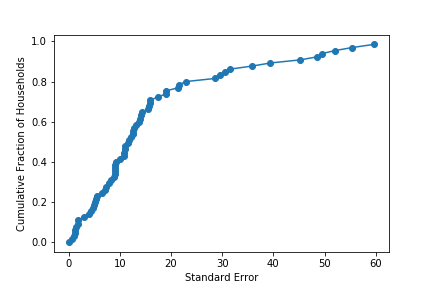
We restricted our sample of households to those that had a significant number of WiFi measurements during the analysis period, dropping households that did not have an enough WiFi measurements to allow us to draw strong conclusions about the performance of the wireless network and corresponding wired access network. After resampling the data for each household, we dropped households from the analysis that had less than 20 measurements with both WiFi speed and access speed. To determine this cutoff, we found the sample error for the difference between WiFi and Internet speed measurements per hosuehold. Figure 3 is the CDF of sample error that we created based on these findings, through which we found that the cutoff must be 20 measurements. After dropping households from the dataset, our sample had 52 households, with an average of 261 WiFi and access speed coincident wireless and wired measurements per household.
Some households experienced a significant change in access speeds during the period of analysis, likely due to a change in Internet service provider or service plan. This occurred for 13 households in our sample. Because these changes in access speeds may significantly affect our analysis (i.e., by changing the wired throughput bottleneck for a household), we split the data for these households and treat each as a separate observation point. This ensured that the access speed is constant during the analysis period. As a result, we add 13 observation points to our sample, bringing the total number of observation points to 65.
Limitations.
In our study, we lack insight into the types of devices that study participants use. Furthermore, we do not have complete visibility into the environment that the measurements are taken in. This does not affect our overall conclusions but bounds the types of conclusions that can be made. Our conclusions are still valid in a broader context–we identify that bottlenecks exist but do not know what they are directly attributed to. We are unable to draw conclusions about whether the bottleneck is generated by properties of the network or hardware. Additionally, our study primarily takes place in the Chicago area. However, we do not consider this to be a limitation that affects our conclusions because characteristics of WiFi are unlikely to vary by geography.
4 Results
To evaluate performance bottlenecks at the household level, we examine throughput test data from the Netrics devices across the deployment for the 21-month period of the study. After measuring the download throughputs of the WiFi and access connections, we compare the WiFi throughput of each household to its downstream access throughput over time, paying particular attention to the throughput of the WiFi network relative to corresponding ISP access network.
4.1 Prevalence of WiFi Bottlenecks
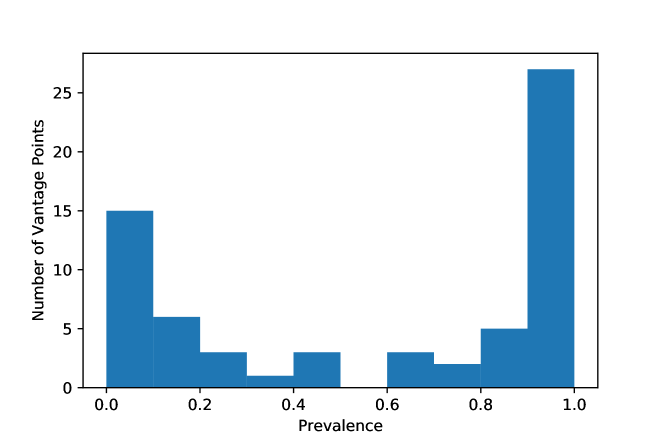
Figure 4 highlights the prevalence of WiFi bottlenecks across households in our study. To calculate the prevalence for each household, we compare the household’s access throughput to its WiFi speed over time and note extent to which the WiFi throughput is lower than the access throughput. For example, if a household has 100 measurements of WiFi and access throughputs and, in 20 of 100 measurements, WiFi throughput is below access speed, then the bottleneck prevalence for this household would be 0.2; 89% of households experienced at least one WiFi bottleneck. Across vantage points, the vast majority either experience no WiFi bottlenecks or a high percentage, as Figure 4 shows. Most vantage points do not have a prevalence between 10% and 80%, indicating in most cases, either WiFi is almost never a bottleneck, or it is almost always a bottleneck. As we will see, the circumstance depends on the household’s access speed tier.
Figure 5 shows the prevalence of WiFi bottlenecks across vantage points, according to the speed tier of the access network. Each point on each curve represents a vantage point; the x-axis represents the prevalence of WiFi bottlenecks at that vantage point, and the y-axis represents is the cumulative distribution of vantage points. As expected, vantage points with higher speed tiers see a greater prevalence of WiFi bottlenecks. For vantage points with access speed tiers of less than 100 Mbps, the prevalence of WiFi bottlenecks, tends to be less, with the median vantage point seeing a prevalence of less than 0.1. On the other hand, for vantage points whose speed tier exceeds 800 Mbps, the prevalence of WiFi bottlenecks is 1, indicating that all joint measurements in those households indicate the presence of a WiFi bottleneck.
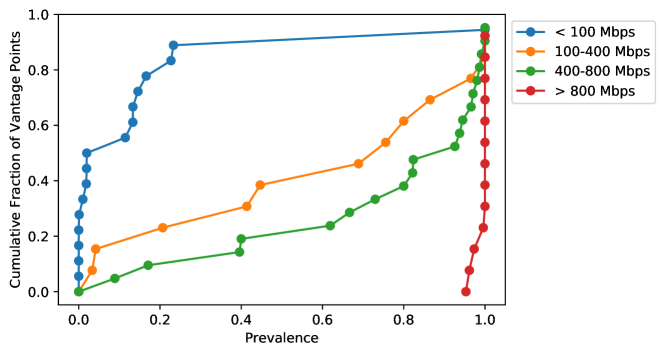
This variation of the prevalence of WiFi bottlenecks also correlates with the measured throughput of the access ISP. The median access ISP throughput among households that experience frequent bottlenecks is 700.52 Mbps; on the other hand, the median access ISP throughput is only 58.12 Mbps for households that rarely experience bottlenecks. We find that WiFi bottlenecks become increasingly prevalent as measured access throughputs increase.
4.2 Magnitude of WiFi Bottlenecks
To evaluate the magnitude of a WiFi bottleneck (i.e., how much slower the WiFi link is than the ISP access link), we compare the median WiFi throughput, access throughput, and the effective throughput of a household, which we define as the minimum of the median WiFi throughput and the median access ISP throughput.
If WiFi throughput is similar to or greater than access ISP throughput, then its value should consistently be greater than its corresponding access ISP throughput value. In this case, because the access throughput is the lower value, the median actual speed should approximately equal the median access speed for each speed tier. This occurs for the first three throughput tiers, shown with actual speed and access speed having very close values. However, the values begin to diverge for speed tiers that exceed 200 Mbps. As expected, access ISP throughputs increase as ISP speed tier increases. However, effective throughputs plateau, as the household’s WiFi network becomes the bottleneck at higher ISP throughputs (and speed tiers).
The extent of the difference between the actual throughput and the access speed for each tier indicates the magnitude of the WiFi bottlenecks. For example, we find that households with speed tiers in the 200–400 Mbps range experience a mean actual throughput of 155.69 Mbps, while the mean access throughput is 265.60 Mbps. This disparity shows that, while paying for access throughputs between 200 and 400 Mbps, the median household is typically experiencing actual speeds that are 109.91 Mbps lower. Interestingly, this gap increases with higher throughput tiers. For households in the 400–800 Mbps tier, the gap between access throughput and actual speed grows to 240 Mbps, and for households in the 800 Mbps plus tier to 602 Mbps. This result indicates that home wireless networks introduce bottlenecks that often result in households failing to completely utilize the access throughput that they have purchased from their ISP.
5 Discussion
The results we have presented in this paper are, by many accounts, unsurprising, as both decades-old research and continual anecdotes have suggested that WiFi is often the bottleneck in home networks. Nonetheless, such a study remains important, for several reasons.
First, the contribution of the measurement method and system itself, the first system to continuously and contemporaneously measure home WiFi throughput and access network throughput from the same vantage point over an extended period of time. We have already released these tools publicly, which are currently in use by state broadband offices across the United States, as well as many other community-based organizations as they try to understand the extent of performance bottlenecks in access networks.
Second, the implications of these findings—as well as those that will come from continued and future measurements of this phenomenon from our software—have important implications for investment in future broadband infrastructure. In the United States, for example, the Broadband Equity, Access, and Deployment (BEAD) program, has currently allocated more than $40 billion to states to upgrade their broadband infrastructure. An important key to spending these funds wisely involves knowing precisely where performance bottlenecks lie, and what types of upgrades will ultimately affect the lived experience of Internet users.
For state and local broadband offices, policies to improve online experience in a community must reckon with the prevalence of WiFi bottlenecks and their effect on lived Internet performance. Although investments in the last-mile and middle-mile infrastructure are important, they will not significantly improve a community’s online experience if they are not also supplemented with policies to improve the equipment that people use to access the Internet within their homes, such as their WiFi equipment. Community organizations, and state and municipal broadband offices should play close attention to improving WiFi networks in communities.
Our results also have important implications for consumer protection. If a user’s home WiFi network is a bottleneck along the end-to-end path, then upgrading to a higher service plan may not necessarily improve a home user’s Internet experience. Our results demonstrate that WiFi is a persistent bottleneck in homes whose access ISP throughput exceeds 200 Mbps. Consumers in these categories may thus be better served by first improving their home WiFi networks before upgrading their service plans.
6 Conclusion
This paper presents a first-of-its kind study of direct, coincident measurements of access throughput and WiFi throughput in the same home broadband access network. It is also, to our knowledge, the first such study in nearly a decade, hence constituting a much-needed reappraisal of the extent to which WiFi is a bottleneck in home broadband access networks.
One should not expect to be surprised by our results. The results of this study are completely expected, especially in light of past research in this area that has highlighted the presence of WiFi bottlenecks in home networks [14]. The purpose of this paper is not to present a new, “surprising” result, but rather to shed light and provide concrete evidence from home networks in deployment to demonstrate the prevalence of these bottlenecks in practice. Although the state of home WiFi is known anecdotally, for many audiences, especially for ISPs, operators, and regulators, it is important to have both documentation and public data confirming the existence of these bottlenecks in real networks, as well as a framework for repeating these measurements in other networks in the future. This paper presents all of these contributions. These results are particularly important to document in light of ongoing investments in Internet infrastructure to bring faster speeds to homes via access ISPs.
References
- [1] Chung, J.Y., Choi, Y., Park, B., Hong, J.: Measurement analysis of mobile traffic in enterprise networks. pp. 1–4 (09 2011). https://doi.org/10.1109/APNOMS.2011.6076977
- [2] Deloitte: Internet usage and device ownership. https://wisdomanswer.com/how-many-digital-devices-does-the-average-person-have/ (2020)
- [3] Feamster, N., Livingood, J.: Measuring Internet Speed: Current Challenges and Future Recommendations. Communications of the ACM (CACM) 63(12), 72–80 (Dec 2020), https://dl.acm.org/doi/10.1145/3372135?cid=81548029281
- [4] Grazia, C.A.: Future of tcp on wi-fi 6. IEEE Access 9, 107929–107940 (2021)
- [5] Lepaja, S., Maraj, A., Efendiu, I., Berzati, S.: The impact of the security mechanisms in the throughput of the wlan networks. In: 2018 7th Mediterranean Conference on Embedded Computing (MECO). pp. 1–5. IEEE (2018)
- [6] Maity, M., Raman, B., Vutukuru, M.: Tcp download performance in dense wifi scenarios: Analysis and solution. IEEE Transactions on Mobile Computing 16(1), 213–227 (2016)
- [7] Netrics. https://github.com/internet-equity/netrics/ (2023)
- [8] Internet broadband fact sheet. https://www.pewresearch.org/internet/fact-sheet/internet-broadband/ (Apr 2021), pew Research Center
- [9] Sheth, J., Dezfouli, B.: Enhancing the energy-efficiency and timeliness of iot communication in wifi networks. IEEE Internet of Things Journal 6(5), 9085–9097 (2019)
- [10] Shi, J., Meng, L., Striegel, A., Qiao, C., Koutsonikolas, D., Challen, G.: A walk on the client side: Monitoring enterprise wifi networks using smartphone channel scans. In: IEEE INFOCOM 2016 - The 35th Annual IEEE International Conference on Computer Communications. pp. 1–9 (2016). https://doi.org/10.1109/INFOCOM.2016.7524453
- [11] Sui, K., Sun, S., Azzabi, Y., Zhang, X., Zhao, Y., Wang, J., Li, Z., Pei, D.: Understanding the impact of ap density on wifi performance through real-world deployment. In: 2016 IEEE international symposium on local and metropolitan area networks (LANMAN). pp. 1–6. IEEE (2016)
- [12] Sui, K., Zhou, M., Liu, D., Ma, M., Pei, D., Zhao, Y., Li, Z., Moscibroda, T.: Characterizing and improving wifi latency in large-scale operational networks. pp. 347–360 (06 2016). https://doi.org/10.1145/2906388.2906393
- [13] Sui, K., Zhou, M., Liu, D., Ma, M., Pei, D., Zhao, Y., Li, Z., Moscibroda, T.: Characterizing and improving wifi latency in large-scale operational networks. In: Proceedings of the 14th Annual International Conference on Mobile Systems, Applications, and Services. pp. 347–360 (2016)
- [14] Sundaresan, S., Feamster, N., Teixeira, R.: Home or Access? Locating Last-Mile Downstream Throughput Bottlenecks. In: Passive and Active Measurement Conference (PAM). pp. 111–123. Heraklion, Crete, Greece (Mar 2016)
- [15] Vollero, L., Iannello, G.: Frame dropping: A qos mechanism for multimedia communications in wifi hot spots. In: Workshops on Mobile and Wireless Networking/High Performance Scientific, Engineering Computing/Network Design and Architecture/Optical Networks Control and Management/Ad Hoc and Sensor Networks/Compil. pp. 54–59. IEEE (2004)
- [16] Yang, Y., Jiang, Y., Misra, V., Rubenstein, D.: Virtual wires: Rethinking wifi networks. In: 2019 IEEE International Symposium on Local and Metropolitan Area Networks (LANMAN). pp. 1–6. IEEE (2019)