Remarkably Compact Quiescent Candidates at in JWST-CEERS
Abstract
In this letter, we measure the rest-frame optical and near-infrared sizes of ten quiescent candidates at , first reported by Carnall et al. (2023a). We use James Webb Space Telescope (JWST) Near-Infrared Camera (NIRCam) F277W and F444W imaging obtained through the public CEERS Early Release Science (ERS) program and imcascade, an astronomical fitting code that utilizes Multi-Gaussian Expansion, to carry out our size measurements. When compared to the extrapolation of rest-optical size-mass relations for quiescent galaxies at lower redshift, eight out of ten candidates in our sample (80%) are on average more compact by 40%. Seven out of ten candidates (70%) exhibit rest-frame infrared sizes 10% smaller than rest-frame optical sizes, indicative of negative color gradients. Two candidates (20%) have rest-frame infrared sizes 1.4 larger than rest-frame optical sizes; one of these candidates exhibits signs of ongoing or residual star formation, suggesting this galaxy may not be fully quenched. The remaining candidate is unresolved in both filters, which may indicate an Active Galactic Nuclei (AGN). Strikingly, we observe three of the most massive galaxies in the sample (log(M⋆/M⊙) = 10.74 - 10.95) are extremely compact, with effective radii 0.7 kpc. Our results indicate that quiescent galaxies may be more compact than previously anticipated beyond , even after correcting for potential color gradients. This suggests that the size evolution of quiescent galaxies is steeper than previously anticipated and our current understanding is biased by the limited wavelength capabilities of the Hubble Space Telescope (HST) and the presence of negative color gradients in quiescent galaxies.
1 Introduction
| ID | ID | RA | DEC | z50 | z50 | log(M⋆/M⊙)50 | log(M⋆/M⊙)50 | log(sSFR/yr)84 | log(sSFR/yr)84 |
|---|---|---|---|---|---|---|---|---|---|
| [Carnall+23] | [This Work] | [Carnall+23] | [This Work] | [Carnall+23] | [This Work] | [Carnall+23] | [This Work] | ||
| 101962 | 68124 | 215.03906 | 53.00278 | 4.39 | 4.01 | 10.63 | 10.59 | -14.14 | -9.33-1.15 |
| 97581 | 82632 | 214.98181 | 52.99124 | 3.46 | 3.37 | 10.81 | 10.80 | -13.14 | -10.76-0.68 |
| 75768 | 82419 | 214.90485 | 52.93535 | 3.31 | 3.22 | 10.48 | 10.51 | -11.95 | -9.33-1.47 |
| 36262 | 47006 | 214.89561 | 52.85650 | 3.26 | 3.23 | 11.06 | 10.74 | -14.66 | -11.28-1.57 |
| 29497 | 89019 | 214.76063 | 52.84531 | 3.25 | 3.15 | 11.34 | 11.26 | -11.32 | -9.82-1.10 |
| 92564 | 85652 | 214.95789 | 52.98030 | 3.47 | 3.40 | 10.49 | 10.45 | -11.49 | -10.87-2.01 |
| 52175 | 71124 | 214.86605 | 52.88426 | 3.44 | 3.54 | 10.87 | 10.95 | -14.67 | -10.21-1.76 |
| 42128 | 67843 | 214.85057 | 52.86603 | 4.19 | 3.58 | 11.06 | 10.27 | -14.56 | -8.12-1.20 |
| 17318 | 65713 | 214.80817 | 52.83221 | 4.50 | 4.42 | 10.13 | 10.33 | -13.69 | -10.13-1.71 |
| 8888 | 73305 | 214.76723 | 52.81771 | 3.49 | 3.40 | 10.54 | 10.42 | -12.83 | -10.22-1.6 |
Note. — Median redshift, stellar mass and sSFR estimates for all ten candidates in the sample. This work adopts the Prospector- model (Wang et al., 2023a), whereas Carnall et al. (2023a) utilizes BAGPIPES (Carnall et al., 2018). 1 errors are shown for redshift and stellar mass estimates. 1 upper-bound estimates are shown for sSFR with 1 lower-bound errors.
The size evolution of quiescent galaxies over cosmic time has been extensively studied and well-established up to (e.g., Trujillo et al., 2004; van Dokkum et al., 2008a; Kriek et al., 2008; Cutler et al., 2022; Nedkova et al., 2021), and more recently extended to (Ito et al., 2023; Ormerod et al., 2023). Robustly defining and understanding the size evolution of quiescent galaxies provides us with insight regarding which physical mechanisms primarily contribute to the shut-down of star formation in galaxies (also known as quenching). Quiescent galaxies are, on average, much smaller than star-forming galaxies up to log(M⋆/M⊙)11 (Shen et al., 2003; van der Wel et al., 2014). The primary physical processes that link this compact morphology with quiescence are still unknown, but there are several theories that could explain this correlation. One such theory is that compactness triggers quenching; when star-forming galaxies attain a certain central density or velocity dispersion threshold, a star-formation shutdown is triggered (Franx et al., 2008; Bell et al., 2012; Omand et al., 2014; Teimoorinia et al., 2016; Whitaker et al., 2017). Conversely, some theories claim the opposite; the compact nature of older quiescent galaxies is a result of quenching in an earlier universe. This theory can be attributed to a concept known as ‘progenitor bias’ (van Dokkum & Franx, 2001). This could explain why older quiescent galaxies are denser; because they quenched in an earlier, denser universe (Lilly & Carollo, 2016). The age of the universe at the redshift range we examine in our quiescent sample () is Gyr, indicating that galaxies have already quenched in this early universe. Therefore, studying the morphology of these galaxies may illuminate the relationship between compact size and early quenching in quiescent galaxies.
The evolving sizes of quiescent galaxies at reflect both the average evolution of the structures of the growing population and the intrinsic growth of individual quiescent galaxies. Quiescent galaxies experience a more rapid size evolution than star-forming galaxies, more than doubling in size from ‘cosmic noon’ () to the present day (Daddi et al., 2005; van Dokkum et al., 2008b; Damjanov et al., 2009; McLure et al., 2013; van der Wel et al., 2014; Hamadouche et al., 2022). Since these galaxies are no longer forming new stars or experiencing in situ growth, additional evolution - beyond what is expected to be added by late additions to the population - from more extended star-forming galaxies must be explained. A leading theory suggests that they grow in size mainly through the accretion of satellite galaxies or minor mergers (Bezanson et al., 2009; Suess et al., 2019). In this model, quiescent galaxies follow an ‘inside-out’ growth model that should result in an older (redder) stellar population in the central region and a younger (bluer) stellar population on the outskirts of the galaxy (Bezanson et al., 2009; Naab et al., 2009; Hopkins et al., 2009; van de Sande et al., 2013; Suess et al., 2019). This is known as a negative color gradient, which typically results in a noticeable size discrepancy between the light-weighted and true mass-weighted size measurements of the galaxy (Suess et al., 2019). This discrepancy appears most prominently in the rest-frame ultraviolet (UV) and is minimized in rest-frame near-infrared (NIR), which suggests that the latter is the most accurate tracer of stellar mass because it is less subject to changes in the mass-to-light ratio based on factors such as age or dust fraction (Bell & de Jong, 2001).
The longest wavelength filter on the Hubble Space Telescope (HST), F160W ( = 1.6m), probes the rest-frame optical light of galaxies at 2 but migrates to rest-frame UV at higher redshifts. Therefore, with deep, high-resolution imaging from the James Webb Space Telescope (JWST) beyond 2m, we are now able to obtain accurate rest-frame optical and NIR sizes of quiescent galaxies beyond for the first time. Studying the morphology of quiescent galaxies at the epoch of quenching () when the universe was only Gyr old (e.g., Gould et al., 2023; Antwi-Danso et al., 2023; Long et al., 2023), affords us the best opportunity to study the size evolution of quiescent galaxies and simultaneously observe the quenching process before the effects of mergers dilute observational signatures (Ito et al., 2023).
In this letter, we examine the F277W (rest-frame optical, = 0.46 - 0.69m) and F444W (rest-frame NIR, = 0.74 - 1.11m) sizes of a sample of ten high-redshift () robust quiescent candidates first reported by Carnall et al. (2023a). Section 2 presents the details of our data analysis, including the public release of our custom photometric catalog in the CEERS field for the sake of transparency and providing an independent resource to the community, as well as the details of size measurements and stellar population synthesis modeling. In Section 3, we extrapolate the expected size evolution for massive quiescent galaxies defined in van der Wel et al. (2014) out to to compare with our imcascade-measured sizes. As an additional check on our results, we run our sample through GALFIT to ensure our size measurements are robust to any discrepancies in software and parametrization. We additionally incorporate the quiescent sample from Suess et al. (2022) to comprehensively examine the F150W, F277W, and F444W sizes of quiescent galaxies across . The implications of our results are discussed in Section 4. We assume a standard CDM cosmology: =0.3, =0.7, and h=0.7.
2 Data & Methodology
2.1 Sample Selection
Our targets consist of the ‘robust’ sub-sample defined in Carnall et al. (2023a), including ten quiescent candidates estimated within median photometric redshift and stellar mass . The ‘robust’ quiescent selection defined in Carnall et al. (2023a) requires that 97.5% of the specific Star Formation Rate (sSFR) posterior provided by SED-fitting code BAGPIPES (Carnall et al., 2018) satisfies the following:
| (1) |
where tobs is defined as the age of the universe at the redshift of a given galaxy. For a more thorough overview of the quiescent selection criteria, refer to Carnall et al. (2023a).
2.2 Photometric Catalog
The Carnall et al. (2023a) study leverages the CEERS Early Release Science (ERS) program (Finkelstein et al., 2017) over the All-wavelength Extended Groth Strip International Survey (AEGIS) field. For our purposes, we adopt publicly available JWST/NIRCam broadband imaging111https://dawn-cph.github.io/dja/imaging/v7/ covering a total area of 105 sq. arcmin produced with Grizli (Brammer, 2023) (Please refer to Valentino et al. (2023) for the latest image reduction documentation). We would like to note that these candidates were selected by Carnall et al. (2023a) using only CEERS Epoch 1 data, which covers a total area of 30 sq. arcmin (Bagley et al., 2023). Source detection and photometry are computed following Weaver et al. (2023). In brief, sources are detected on a noise-equalized co-add of F277W, F356W, and F444W images. Photometry is extracted in 0.32″ apertures from all available filters from HST (F435W, F606W, F814W, F105W, F125W, F140W, F160W) and JWST/NIRCam (F115W, F150W, F200W, F277W, F356W, F410M, F444W) over the AEGIS field, after psf-matching to F444W. Photometric errors are estimated by means of 10,000 aperture extractions on empty regions of the images (see Whitaker et al. 2011). To ensure robust stellar masses, the aperture photometry is corrected by means of Kron elliptical apertures measured on the F444W mosaic and further corrected by an additional % based on the light in the F444W beyond the circularized Kron apertures. An additional correction for the line-of-sight attenuation through the galaxy is then applied using the dust maps of Schlafly & Finkbeiner (2011). While this study is only focused on ten candidates within this field, the full catalog is available on Zenodo.
2.3 Spectral Energy Distribution Fitting
The SED-fitting analysis follows Wang et al. (2023b), which is briefly reiterated here for completeness. All parameters, including redshift, are inferred jointly using the Prospector inference framework (Johnson et al., 2021), adopting the MIST stellar isochrones (Choi et al., 2016; Dotter, 2016) and MILES stellar library (Sánchez-Blázquez et al., 2006) from FSPS (Conroy & Gunn, 2010). Star Formation History (SFH) is described non-parametrically via mass formed in seven logarithmically spaced time bins (Leja et al., 2017). Note that this differs from the double-power-law model used in Carnall et al. (2023a). A mass function prior, and a dynamic SFH() prior are included to optimize the photometric inference for JWST observations (Prospector-; Wang et al. 2023a). In total, the model consists of 18 free parameters, and sampling is performed using the dynamic nested sampler dynesty (Speagle, 2020).
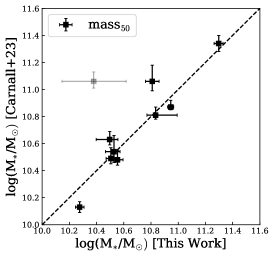
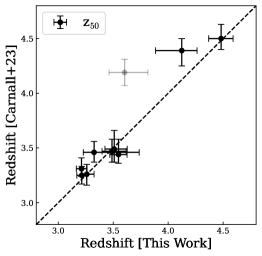
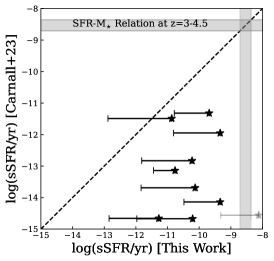
Our median redshift estimates fall within 1 errors reported by Carnall et al. (2023a) for seven out of ten candidates, with the exception of candidates 67843, 82419, and 71124222all candidate IDs listed in this letter correspond with our publicly available photometric catalog. Similarly, our median stellar mass estimates fall within the combined 1 errors provided by BAGPIPES and Prospector- for six out of ten candidates in the sample. In general, we find that our Prospector-- redshift and stellar mass estimates show good agreement with those reported in Carnall et al. (2023a), with the exception of candidate 67843, which we predict to be at (as opposed to the BAGPIPES estimation of ). We additionally note that the median sSFR estimate of this candidate is log(SFR/M⋆)=-8.730.6 yr-1, which is 0.33 dex above the log(SFR)-log(M⋆) relation at (e.g., Speagle et al., 2014) and thus indicative of possible residual or ongoing star formation. Given this tentative evidence for ongoing star formation, we represent this particular target with increased transparency in all plots herein. All median redshift, stellar mass, and sSFR estimates as well as the associated errors are listed in Table 1. These estimates and their errors are also illustrated in Figure 1.
2.4 Morphological Measurements
We fit for the effective radius in two of the available filters, F277W and F444W, selected to sample close to rest-frame 0.5m and 1m. We use the astronomical fitting code imcascade (Miller & van Dokkum, 2021), which models the light profile of galaxies as a mixture of 2-D Gaussians in a Bayesian Framework. imcascade is optimal for studying the morphologies of faint, semi-resolved galaxies such as high-redshift quiescent galaxies (Miller & van Dokkum, 2021). First, we model the point spread function (PSF) as a Gaussian decomposition with four components to account for the complexity of the real JWST PSF (e.g., see Appendix in Weaver et al., 2023). We then use Source Extractor Python sep (Barbary 2016, Bertin & Arnouts 1996) to detect and mask sources in the image, as well as imcascade’s ‘expand mask’ feature to convolve the mask with a Gaussian and shrink or expand the mask, ensuring contamination from neighboring objects is minimized. We use a cutout size of 40 the estimated Kron radius for each galaxy in order to properly model the sky background, with nine Gaussian components with widths logarithmically spaced from 1 pixel to 10 the Kron radius, as recommended by Miller & van Dokkum (2021). We use least-squares minimization to generate best-fit parameters and examine the fits by eye before proceeding with posterior estimation. The posterior distribution and priors are sampled using the Dynamic nested sampling method in dynesty initialized from the least-squares minimization (Speagle, 2020). Finally, we calculate the morphological quantities of effective radius, axis ratio, and position angle using a basic analysis function included in imcascade .
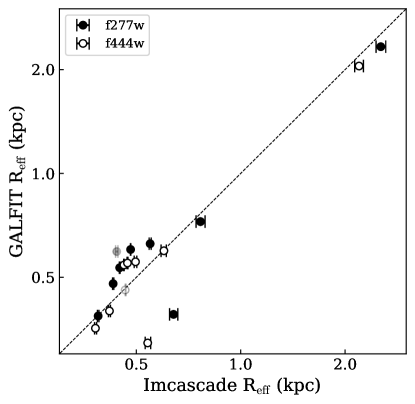
As an additional check on our sizes, we model our sample using another popular fitting code, GALFIT (Peng et al., 2002) (which utilizes Sérsic light profiles) following Cutler et al. (2022). The comparison between our imcascade and GALFIT sizes is shown in Figure 2. We find the sizes are consistent for seven out of ten candidates in our sample, whereas GALFIT yields slightly smaller sizes for the three candidates. This result shows good agreement between these two independent methods and further supports our assertion that these quiescent candidates are extremely compact. Given this result, we proceed herein with imcascade sizes, noting that our conclusions are only further strengthened when adopting GALFIT size measurements.
3 Results
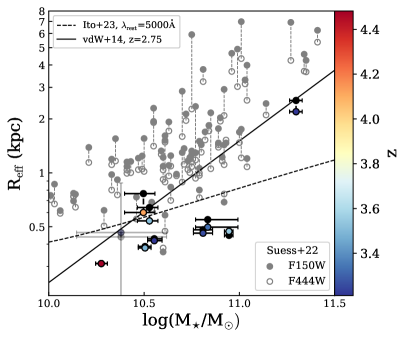
To interpret our results, we first plot the size-mass relation of our sample in the leftmost panel of Figure 4. The black and colored points represent the F277W and F444W sizes of our sample, respectively. As a baseline, we plot the size-mass relation at defined in van der Wel et al. (2014) (Equation 2) as a solid line:
| (2) |
We additionally plot the best-fit size-mass relation from a recent study that examines the size evolution of quiescent galaxies beyond (Ito et al., 2023) as a dotted line for reference. We observe that seven out of ten (70%) candidates in our sample exhibit measured sizes smaller than the size-mass relations of both van der Wel et al. (2014) and Ito et al. (2023). We would like to note that while we use Prospector- for our stellar mass estimates, van der Wel et al. (2014) use FAST (Kriek et al., 2009) and Ito et al. (2023) use eazy-py (Brammer et al., 2008), which could, in principle, contribute to some discrepancies in the size-mass relation. However, considering the high median redshift and mass range of our sample, the difference between Prospector--produced and FAST -produced stellar mass estimates is only 0.00.2 dex (Refer to Figure 3 of Leja et al., 2019)).
For further analysis, we compare our results to the measured redshift evolution of the 5000 rest-frame galaxy size for quiescent galaxies at lower redshifts presented in van der Wel et al. (2014) as a baseline. We extrapolate the size evolution at fixed mass out to in order to explore how our high redshift sample compares with the extrapolation. We plot the size-redshift distribution of our sample relative to the =5000 size relation from van der Wel et al. (2014) (Equation 3) for quiescent galaxies (solid lines) in the rightmost panel of Figure 4
| (3) |
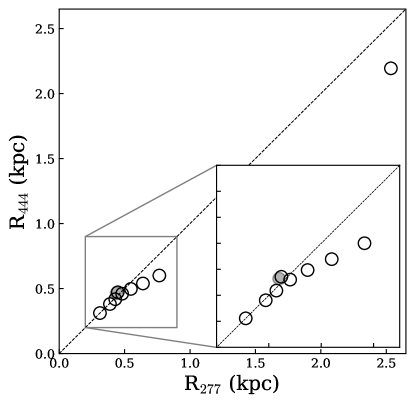
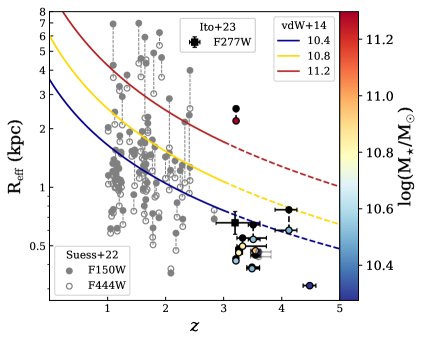
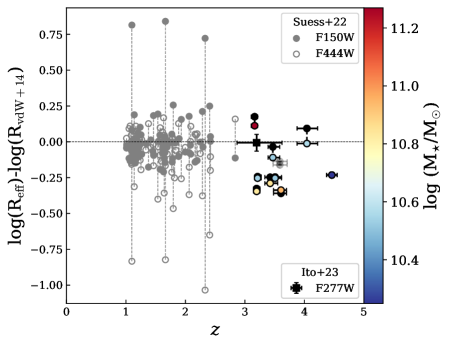
The extended dashed lines in the central panel of Figure 4 represent the extrapolation of this relation out to for three separate mass bins: log(M⋆/M⊙) = 10.4 (blue), 10.8 (yellow), and 11.2 (red). Coefficients Bz and are mass-dependent and can be found in Table 1 of van der Wel et al. (2014). The center panel of Figure 4 illustrates the difference between the measured radius and predicted radius in log space when removing stellar mass dependence; points below zero indicate that the measured size is smaller than predicted, and vice versa. We additionally plot the F150W and F444W sizes of the quiescent sample from Suess et al. (2022) in solid and open grey points, respectively, in order to comprehensively examine the size evolution of quiescent galaxies over the range of based on JWST imaging alone. Eight out of ten (80%) candidates in our sample exhibit rest-frame optical sizes (F277W) smaller than those extrapolated from Equation 2, with the exception of candidates 89019 and 68124. Additionally, seven out of ten (70%) candidates in the sample exhibit rest-frame NIR (F444W) sizes smaller than their rest-frame optical sizes (see Figure 3), with the exception of candidates 67843 and 71124 (65713 does not change). Of the two candidates with larger F444W sizes (67843 and 71124), only one candidate (71124) appears larger in F444W when measured with both GALFIT and imcascade (see Figure 2). Candidate 67843 appears larger in F444W when measured with imcascade, but does not appear larger when measured with GALFIT. This candidate also exhibits signs of possible residual or ongoing star formation, which may explain this discrepancy. We note that object 65713, which does not change in size between filters, appears to be unresolved. Such point sources may be indicative of the presence of Active Galactic Nuclei (AGN), which have been recently uncovered at similar redshifts through JWST (Labbe et al., 2023; Greene et al., 2023; Kocevski et al., 2023).
We find that three of the most massive galaxies in the sample (71124, 82632, 47006) at are surprisingly compact, with rest-frame optical sizes of 0.7 kpc. The average rest-frame optical size for this mass and redshift range extrapolated from van der Wel et al. (2014), and confirmed by Ito et al. (2023), is 1.04-1.33 kpc. These sizes are therefore 0.3 dex smaller than predicted (i.e., 2 deviations from the size-mass relation). Prior to JWST, high-resolution imaging in rest-frame optical and NIR was not possible, thus we only had access to rest-UV where quiescent galaxies are barely visible. As such, it is only in recent years that we have been able to discover quiescent galaxies at (Carnall et al., 2023a; Antwi-Danso et al., 2023; Valentino et al., 2023; Long et al., 2023; Gould et al., 2023). In this letter, we demonstrate that these first quiescent galaxies are overall remarkably compact in both rest-frame optical and NIR imaging.
4 Discussion
In this letter, we measure the effective radii of ten quiescent candidates at . We show that eight out of ten (80%) candidates in the sample exhibit rest-frame optical sizes smaller than those extrapolated from Equation 2 from van der Wel et al. (2014), with extrapolations extending the original 6 Gyr baseline by 1 Gyr or less. This extrapolation agrees well with JWST studies by Ito et al. (2023). However, we observe that seven out of ten (70%) candidates in our sample exhibit measured sizes smaller than the size-mass relations of both van der Wel et al. (2014) and Ito et al. (2023). Moreover, seven out of ten (70%) candidates in the sample exhibit rest-frame NIR sizes smaller than their corresponding rest-frame optical sizes and one candidate is unresolved in both images. Among these, three of the most massive galaxies in our sample (71124, 82632, 47006) are extremely compact, with rest-frame optical sizes 0.7kpc.
Our finding that the majority of our sample appears 10% smaller with longer wavelength imaging is consistent with the 8% size decrease observed between rest-frame optical (F150W) and rest-frame NIR (F444W) imaging for the sample of star-forming and quiescent galaxies reported in Suess et al. (2022). This size decrease with longer wavelength imaging suggests the presence of negative color gradients in our sample. Negative color gradients could indicate that the central region of the galaxy is dominated by older stellar populations (red), and the outskirts are dominated by younger stellar populations (blue). This is consistent with the ‘inside out’ growth scenario of quiescent galaxies, in which quiescent galaxies slowly gain mass over time via mergers, and therefore accumulate a younger stellar population on the outskirts while retaining an older stellar population in the central region (Bezanson et al. 2009, Naab et al. 2009, van de Sande et al. 2013, Hopkins et al. 2009).
However, the central red colors could also be consistent with dust-obscured residual star formation which is commonly observed in star-forming galaxies at (e.g., Nelson et al., 2016). As similarly massive star-forming galaxies are the natural progenitors (e.g. Toft et al., 2017), it stands to reason these negative color gradients may also represent inside-out quenching in at least some cases. Indeed, spatially resolved studies of quiescent galaxies at slightly lower redshift (, about 1 billion years later) show a diverse range of formation pathways, with examples of both inside-out and outside-in quenching (Akhshik et al., 2023). Evidence for residual dust-obscured star-formation in the cores of these early massive galaxies is confirmed through high-resolution millimeter wavelength detections in some cases (Morishita et al., 2022; Lee et al., 2023), but ruled out in others (Whitaker et al., 2021).
The small measured sizes of the first quiescent galaxies herein indicate that the size evolution function of quiescent galaxies may be steeper than previously assumed beyond . This result is in slight tension with a recently published study by Ito et al. (2023), which performs a similar analysis examining the rest-frame 5000 sizes of 26 quiescent candidates first reported by Valentino et al. (2023). The conclusion of Ito et al. (2023) is that quiescent sizes at generally agree with the extrapolation of van der Wel et al. (2014) out to . We illustrate this in the central panel of Figure 4 by plotting the median redshift and size of the UVJ-selected quiescent sample from Ito et al. (2023) as a square marker, which clearly shows good agreement with the extrapolation from van der Wel et al. (2014). We suspect this discrepancy in our results may be due to the fact that Ito et al. (2023) use all publicly available JWST fields in their study (totaling to 145 sq. arcmin), while our study focuses specifically on quiescent candidates found in CEERS Epoch 1 Imaging (30 sq. arcmin) (Bagley et al., 2023). The number density of quiescent galaxies in CEERS is predicted to be much higher than the combined JWST fields, indicating that this field may be overdense, which may thus contribute to this different result. Carnall et al. (2023a) report a number density measurement for CEERS of 10.6 Mpc-3 for (4.4 higher than the number density for this redshift range reported in Valentino et al. 2023) and 2.3 Mpc-3 for (3.3 higher than the number density for this redshift range reported in Valentino et al. 2023). Moreover, our results support the surprisingly compact size of a recently discovered high-redshift quiescent galaxy at by Carnall et al. (2023b). This galaxy has an estimated stellar mass of and a measured size of . This is 33% smaller than the van der Wel et al. (2014) size-mass relation extrapolation of kpc.
Our finding that the majority of rest-NIR sizes are more compact than rest-optical agrees with recent results in the literature (Suess et al., 2022; Miller et al., 2023; van der Wel et al., 2023), with studies reaching a common conclusion that our current understanding of the size growth of quiescent galaxies is biased when only considering m. Additionally, our observation that three of the most massive objects in the sample are extremely compact further strengthens the assertion that more massive galaxies are not necessarily larger than their lower-mass counterparts (e.g., Suess et al., 2022) – an assumption that has until recently been firmly established in our current understanding of the size-mass relation of quiescent galaxies. Now that we have access to the longer wavelength capabilities of JWST to directly measure the rest-frame NIR sizes of quiescent galaxies up to , as well as the angular resolution required to spatially resolve their morphologies (1′′ Nelson et al. 2022), our investigation into the size evolution of quiescent galaxies can finally be extended beyond . However, this sample has yet to be spectroscopically confirmed. Several upcoming JWST Cycle 2 spectroscopic follow-up campaigns (JWST-GO-2913, JWST-GO-3543, JWST-GO-3567, and JWST-GO-4318) will provide the next step in foremost confirming but also further understanding the nature of these rare high-redshift quiescent galaxies. Until then, this letter aims to provide a ‘first glimpse’ into our developing understanding of the size evolution of quiescent galaxies in the distant universe.
5 Acknowledgements
This work is based in part on observations made with the NASA/ESA/CSA James Webb Space Telescope and the NASA/ESA Hubble Space Telescope obtained from the Space Telescope Science Institute, which is operated by the Association of Universities for Research in Astronomy, Inc., under NASA contract NAS 5–26555. The data were obtained from the Mikulski Archive for Space Telescopes at the Space Telescope Science Institute, which is operated by the Association of Universities for Research in Astronomy, Inc., under NASA contract NAS 5-03127 for JWST. These observations are associated with JWST-ERS-1345. These observations are associated with programs HST-GO-12063 and HST-GO-12177. KEW gratefully acknowledges funding from the Alfred P. Sloan Foundation Grant FG-2019-12514. The data products presented herein were retrieved from the Dawn JWST Archive (DJA). DJA is an initiative of the Cosmic Dawn Center, which is funded by the Danish National Research Foundation (DNRF) under grant #140. Computations for this research were performed on the Pennsylvania State University’s Institute for Computational and Data Sciences’ Roar supercomputer.
References
- Akhshik et al. (2023) Akhshik, M., Whitaker, K. E., Leja, J., et al. 2023, The Astrophysical Journal, 943, 179, doi: 10.3847/1538-4357/aca677
- Antwi-Danso et al. (2023) Antwi-Danso, J., Papovich, C., Leja, J., et al. 2023, ApJ, 943, 166, doi: 10.3847/1538-4357/aca294
- Antwi-Danso et al. (2023) Antwi-Danso, J., Papovich, C., Esdaile, J., et al. 2023. https://arxiv.org/abs/2307.09590
- Bagley et al. (2023) Bagley, M. B., Finkelstein, S. L., Koekemoer, A. M., et al. 2023, The Astrophysical Journal Letters, 946, L12, doi: 10.3847/2041-8213/acbb08
- Barbary (2016) Barbary, K. 2016, Journal of Open Source Software, 1, 58, doi: 10.21105/joss.00058
- Bell & de Jong (2001) Bell, E. F., & de Jong, R. S. 2001, The Astrophysical Journal, 550, 212, doi: 10.1086/319728
- Bell et al. (2012) Bell, E. F., van der Wel, A., Papovich, C., et al. 2012, The Astrophysical Journal, 753, 167, doi: 10.1088/0004-637X/753/2/167
- Bertin & Arnouts (1996) Bertin, E., & Arnouts, S. 1996, A&AS, 117, 393, doi: 10.1051/aas:1996164
- Bezanson et al. (2009) Bezanson, R., van Dokkum, P. G., Tal, T., et al. 2009, The Astrophysical Journal, 697, 1290, doi: 10.1088/0004-637X/697/2/1290
- Brammer (2023) Brammer, G. 2023, 1.8.2, Zenodo, Zenodo, doi: 10.5281/zenodo.7712834
- Brammer et al. (2008) Brammer, G. B., van Dokkum, P. G., & Coppi, P. 2008, The Astrophysical Journal, 686, 1503, doi: 10.1086/591786
- Carnall et al. (2018) Carnall, A. C., McLure, R. J., Dunlop, J. S., & Davé, R. 2018, Monthly Notices of the Royal Astronomical Society, 480, 4379, doi: 10.1093/mnras/sty2169
- Carnall et al. (2023a) Carnall, A. C., McLeod, D. J., McLure, R. J., et al. 2023a, MNRAS, 520, 3974, doi: 10.1093/mnras/stad369
- Carnall et al. (2023b) Carnall, A. C., McLure, R. J., Dunlop, J. S., et al. 2023b, Nature, 619, 716, doi: 10.1038/s41586-023-06158-6
- Choi et al. (2016) Choi, J., Dotter, A., Conroy, C., et al. 2016, ApJ, 823, 102, doi: 10.3847/0004-637X/823/2/102
- Conroy & Gunn (2010) Conroy, C., & Gunn, J. E. 2010, ApJ, 712, 833, doi: 10.1088/0004-637X/712/2/833
- Cutler et al. (2022) Cutler, S. E., Whitaker, K. E., Mowla, L. A., et al. 2022, ApJ, 925, 34, doi: 10.3847/1538-4357/ac341c
- Daddi et al. (2005) Daddi, E., Renzini, A., Pirzkal, N., et al. 2005, The Astrophysical Journal, 626, 680, doi: 10.1086/430104
- Damjanov et al. (2009) Damjanov, I., McCarthy, P. J., Abraham, R. G., et al. 2009, The Astrophysical Journal, 695, 101, doi: 10.1088/0004-637X/695/1/101
- Dotter (2016) Dotter, A. 2016, ApJS, 222, 8, doi: 10.3847/0067-0049/222/1/8
- Finkelstein et al. (2017) Finkelstein, S. L., Dickinson, M., Ferguson, H. C., et al. 2017, JWST Proposal ID 1345. Cycle 0 Early Release Science
- Franx et al. (2008) Franx, M., van Dokkum, P. G., Schreiber, N. M. F., et al. 2008, The Astrophysical Journal, 688, 770, doi: 10.1086/592431
- Gould et al. (2023) Gould, K. M. L., Brammer, G., Valentino, F., et al. 2023, The Astronomical Journal, 165, 248, doi: 10.3847/1538-3881/accadc
- Greene et al. (2023) Greene, J. E., Labbe, I., Goulding, A. D., et al. 2023. https://arxiv.org/abs/2309.05714
- Hamadouche et al. (2022) Hamadouche, M. L., Carnall, A. C., McLure, R. J., et al. 2022, Monthly Notices of the Royal Astronomical Society, 512, 1262, doi: 10.1093/mnras/stac535
- Hopkins et al. (2009) Hopkins, P. F., Bundy, K., Murray, N., et al. 2009, Monthly Notices of the Royal Astronomical Society, 398, 898, doi: 10.1111/j.1365-2966.2009.15062.x
- Ito et al. (2023) Ito, K., Valentino, F., Brammer, G., et al. 2023. https://arxiv.org/abs/2307.06994
- Johnson et al. (2021) Johnson, B. D., Leja, J., Conroy, C., & Speagle, J. S. 2021, ApJS, 254, 22, doi: 10.3847/1538-4365/abef67
- Kocevski et al. (2023) Kocevski, D. D., Onoue, M., Inayoshi, K., et al. 2023. https://arxiv.org/abs/2302.00012
- Kriek et al. (2008) Kriek, M., van der Wel, A., van Dokkum, P. G., Franx, M., & Illingworth, G. D. 2008, ApJ, 682, 896, doi: 10.1086/589677
- Kriek et al. (2009) Kriek, M., van Dokkum, P. G., Labbé, I., et al. 2009, ApJ, 700, 221, doi: 10.1088/0004-637X/700/1/221
- Labbe et al. (2023) Labbe, I., Greene, J. E., Bezanson, R., et al. 2023. https://arxiv.org/abs/2306.07320
- Lee et al. (2023) Lee, M. M., Steidel, C. C., Brammer, G., et al. 2023. https://arxiv.org/abs/2311.00023
- Leja et al. (2017) Leja, J., Johnson, B. D., Conroy, C., van Dokkum, P. G., & Byler, N. 2017, ApJ, 837, 170, doi: 10.3847/1538-4357/aa5ffe
- Leja et al. (2019) Leja, J., Johnson, B. D., Conroy, C., et al. 2019, The Astrophysical Journal, 877, 140, doi: 10.3847/1538-4357/ab1d5a
- Lilly & Carollo (2016) Lilly, S. J., & Carollo, C. M. 2016, The Astrophysical Journal, 833, 1, doi: 10.3847/0004-637X/833/1/1
- Long et al. (2023) Long, A. S., Antwi-Danso, J., Lambrides, E. L., et al. 2023, arXiv e-prints, arXiv:2305.04662, doi: 10.48550/arXiv.2305.04662
- McLure et al. (2013) McLure, R. J., Dunlop, J. S., Bowler, R. A. A., et al. 2013, MNRAS, 432, 2696, doi: 10.1093/mnras/stt627
- Miller & van Dokkum (2021) Miller, T. B., & van Dokkum, P. 2021, The Astrophysical Journal, 923, 124, doi: 10.3847/1538-4357/ac2b30
- Miller et al. (2023) Miller, T. B., van Dokkum, P., & Mowla, L. 2023, The Astrophysical Journal, 945, 155, doi: 10.3847/1538-4357/acbc74
- Morishita et al. (2022) Morishita, T., Abdurro’uf, Hirashita, H., et al. 2022. https://arxiv.org/abs/2208.10525
- Naab et al. (2009) Naab, T., Johansson, P. H., & Ostriker, J. P. 2009, The Astrophysical Journal, 699, L178, doi: 10.1088/0004-637X/699/2/L178
- Nedkova et al. (2021) Nedkova, K. V., Häußler, B., Marchesini, D., et al. 2021, MNRAS, 506, 928, doi: 10.1093/mnras/stab1744
- Nelson et al. (2016) Nelson, E. J., van Dokkum, P. G., Schreiber, N. M. F., et al. 2016, The Astrophysical Journal, 828, 27, doi: 10.3847/0004-637X/828/1/27
- Nelson et al. (2022) Nelson, E. J., Suess, K. A., Bezanson, R., et al. 2022. https://arxiv.org/abs/2208.01630
- Omand et al. (2014) Omand, C. M. B., Balogh, M. L., & Poggianti, B. M. 2014, Monthly Notices of the Royal Astronomical Society, 440, 843, doi: 10.1093/mnras/stu331
- Ormerod et al. (2023) Ormerod, K., Conselice, C. J., Adams, N. J., et al. 2023. https://arxiv.org/abs/2309.04377
- Peng et al. (2002) Peng, C. Y., Ho, L. C., Impey, C. D., & Rix, H.-W. 2002, The Astronomical Journal, 124, 266, doi: 10.1086/340952
- Sánchez-Blázquez et al. (2006) Sánchez-Blázquez, P., Peletier, R. F., Jiménez-Vicente, J., et al. 2006, MNRAS, 371, 703, doi: 10.1111/j.1365-2966.2006.10699.x
- Schlafly & Finkbeiner (2011) Schlafly, E. F., & Finkbeiner, D. P. 2011, ApJ, 737, 103, doi: 10.1088/0004-637X/737/2/103
- Shen et al. (2003) Shen, S., Mo, H. J., White, S. D. M., et al. 2003, Monthly Notices of the Royal Astronomical Society, 343, 978, doi: 10.1046/j.1365-8711.2003.06740.x
- Speagle (2020) Speagle, J. S. 2020, Monthly Notices of the Royal Astronomical Society, 493, 3132, doi: 10.1093/mnras/staa278
- Speagle et al. (2014) Speagle, J. S., Steinhardt, C. L., Capak, P. L., & Silverman, J. D. 2014, The Astrophysical Journal Supplement Series, 214, 15, doi: 10.1088/0067-0049/214/2/15
- Suess et al. (2019) Suess, K. A., Kriek, M., Price, S. H., & Barro, G. 2019, ApJ, 877, 103, doi: 10.3847/1538-4357/ab1bda
- Suess et al. (2022) Suess, K. A., Bezanson, R., Nelson, E. J., et al. 2022, The Astrophysical Journal Letters, 937, L33, doi: 10.3847/2041-8213/ac8e06
- Teimoorinia et al. (2016) Teimoorinia, H., Bluck, A. F. L., & Ellison, S. L. 2016, Monthly Notices of the Royal Astronomical Society, 457, 2086, doi: 10.1093/mnras/stw036
- Toft et al. (2017) Toft, S., Zabl, J., Richard, J., et al. 2017, Nature, 546, 510, doi: 10.1038/nature22388
- Trujillo et al. (2004) Trujillo, I., Rudnick, G., Rix, H.-W., et al. 2004, The Astrophysical Journal, 604, 521, doi: 10.1086/382060
- Valentino et al. (2023) Valentino, F., Brammer, G., Gould, K. M. L., et al. 2023, The Astrophysical Journal, 947, 20, doi: 10.3847/1538-4357/acbefa
- van de Sande et al. (2013) van de Sande, J., Kriek, M., Franx, M., et al. 2013, The Astrophysical Journal, 771, 85, doi: 10.1088/0004-637X/771/2/85
- van der Wel et al. (2014) van der Wel, A., Franx, M., van Dokkum, P. G., et al. 2014, ApJ, 788, 28, doi: 10.1088/0004-637X/788/1/28
- van der Wel et al. (2023) van der Wel, A., Martorano, M., Haussler, B., et al. 2023, arXiv e-prints, arXiv:2307.03264, doi: 10.48550/arXiv.2307.03264
- van Dokkum & Franx (2001) van Dokkum, P. G., & Franx, M. 2001, ApJ, 553, 90, doi: 10.1086/320645
- van Dokkum et al. (2008a) van Dokkum, P. G., Franx, M., Kriek, M., et al. 2008a, The Astrophysical Journal, 677, L5, doi: 10.1086/587874
- van Dokkum et al. (2008b) —. 2008b, The Astrophysical Journal, 677, L5, doi: 10.1086/587874
- Wang et al. (2023a) Wang, B., Leja, J., Bezanson, R., et al. 2023a, ApJ, 944, L58, doi: 10.3847/2041-8213/acba99
- Wang et al. (2023b) Wang, B., Leja, J., Labbé, I., et al. 2023b, arXiv e-prints, arXiv:2310.01276. https://arxiv.org/abs/2310.01276
- Weaver et al. (2023) Weaver, J. R., Cutler, S. E., Pan, R., et al. 2023, arXiv e-prints, arXiv:2301.02671, doi: 10.48550/arXiv.2301.02671
- Whitaker et al. (2011) Whitaker, K. E., Labbé, I., van Dokkum, P. G., et al. 2011, ApJ, 735, 86, doi: 10.1088/0004-637X/735/2/86
- Whitaker et al. (2017) Whitaker, K. E., Bezanson, R., van Dokkum, P. G., et al. 2017, The Astrophysical Journal, 838, 19, doi: 10.3847/1538-4357/aa6258
- Whitaker et al. (2021) Whitaker, K. E., Williams, C. C., Mowla, L., et al. 2021, Nature, 597, 485, doi: 10.1038/s41586-021-03806-7