The impact of polymer rheology on the extrusion flow in fused filament fabrication
Abstract
Polymer rheology is the study of the flow and deformation of polymer materials. It is paramount in designing material extrusion applications, such as fused filament fabrication (FFF), as polymer rheology affects the fluid-flow characteristics of the polymer melt inside the nozzle. This work analyses the molten flow patterns inside the printing nozzle in fused filament fabrication process, generated by a range of polymer melts and modelled through a viscoelastic model (Giesekus) based on rheological properties experimentally determined under viscometric flows. The normal stress surface plots show that the distribution of these stresses around the contraction is related to the fluid rheology and partially responsible for the pressure drop differences and instabilities. The elasticity of the molten polymer flowing through small length scales leads to elastic instabilities and eventually to elastic turbulence at actual printing speeds. This phenomenon increases excess pressure drop and, possibly, leads to failures during the printing process.
keywords:
Fused filament fabrication , Polymer rheology , Shear-induced normal stress differences , Excess pressure dropPACS:
0000 , 1111MSC:
0000 , 1111[inst2]organization=Institute of Science and Innovation in Mechanical and Industrial Engineering (INEGI),addressline=Rua Dr. Roberto Frias, 400, city=Porto, postcode=4200-465, country=Portugal
[inst3]organization=Transport Phenomena Research Center (CEFT), Mechanical Engineering Department,addressline=Faculty of Engineering of the University of Porto, Rua Dr. Roberto Frias s/n, city=Porto, postcode=4200-465, country=Portugal
[inst4]organization=ALiCE—Associate Laboratory in Chemical Engineering,addressline=Faculty of Engineering of the University of Porto, Rua Dr. Roberto Frias s/n, city=Porto, postcode=4200-465, country=Portugal
[inst6]organization=Department of Precision and Microsystems Engineering (PME), Faculty of Mechanical, Maritime and Materials Engineering (3mE),addressline=TU Delft (Delft University of Technology), Mekelweg 2, city=Delft, postcode=2628 CD, country=The Netherlands
[inst5]organization=Transport Phenomena Research Center (CEFT), Chemical Engineering Department,addressline=Faculty of Engineering of the University of Porto, Rua Dr. Roberto Frias s/n, city=Porto, postcode=4200-465, state=, country=Portugal
1 Introduction
Material extrusion, an additive manufacturing (AM) method, entails precisely dispensing material through a nozzle, following established standards [1]. Fused filament fabrication (FFF), introduced by S. Scott Crump in 1989 [2], currently stands as the predominant technology for material extrusion [3]. FFF allows for the rapid, cost-effective creation of intricate three-dimensional objects suitable for practical applications [4]. Moreover, post-processing techniques like sanding, chemical treatment, polishing, metal plating, among others, can be employed to enhance surface quality [5, 6].
The FFF procedure consists of introducing thermoplastic materials,usually in filament shape, from spools into a temperature-regulated liquefier, where they undergo transformation into a liquid state. Subsequently, the molten material is extruded through a nozzle and guided by the print head onto a build plate in specific patterns to create a 3D object. Common quality issues in FFF systems encompass over-extrusion and under-extrusion, leading to the formation of blobs or holes. Another extrusion challenge, known as annular backflow, happens when the molten polymer reverses its flow along the ring-shaped region between the filament and the liquefier wall, escaping the heated area and cooling below the glass temperature, where solid/fluid transition occurs () [7]. These issues undoubtedly arise from the interplay of extrusion process parameters with the rheological properties of the molten filament [8], necessitating fundamental research to fully understand the underlying mechanisms and develop preventive measures.
It is well documented on the literature [9, 10, 11, 12, 13, 14] that the flow of viscoelastic fluids through an axisymmetric contraction geometry can lead to elastic instabilities responsible for generating not only upstream vortices, but also excess pressure drop. Furthermore, smaller characteristic length scales in the geometry intensify elastic effects. Previous efforts sought to replicate the polymer melt extrusion process within an FFF printer nozzle using microfluidic chips of a planar geometry with shear-thinning polymer solutions. This led to the construction of a Deborah-Reynolds flow map, revealing the production of growing upstream vortices under typical printing flow conditions in an FFF nozzle die [15]. Subsequently, the formation of vortices upstream of the tapered region in the nozzle, driven by elastic instabilities, was observed. This study was complemented in [16], where numerical analysis confirmed the presence of these vortices when molten Polycarbonate flowed through an axisymmetric nozzle geometry. It also allowed for the disentanglement of the relative significance of extension-induced and shear-induced elastic stresses in this extrusion process. It was concluded that within the upstream vortex, extensional elastic stresses predominated, but their importance diminished with higher extrusion velocities; moreover, they played a determinant role in the size of the upstream vortex structures. However, shear-induced normal stress differences may account for the excess pressure drop and a change in equilibrium height () in the backflow region, where the polymer melt flows upward between the solid filament and the liquefier wall. Recently, an experimental study with PLA [17] allowed the experimental determination of the nozzle pressure drop, which, in combination with traditional top-of-nozzle pressure measurements, permitted determining the pressure drop occurring in the liquefier and the calculation of equilibrium height in the backflow region based on experimental data exclusively. Results showed a non-linear increase in the pressure measured by the feeders, which was associated with shear-induced elastic instabilities occurring in the backflow region at the same extrusion velocity at which the maximum equilibrium height () occurred.
This work aims to expand previous studies by analyzing, numerically, how the polymer rheology of different materials commonly used in FFF, such as PLA, ABS and PET, affect the flow dynamics in a nozzle geometry; special attention will be given to the shear and extensional stress developed in the fluid, and how these are connected to backflow and extra pressure drop.
2 Materials and Methods
2.1 Polymers
Polymer choice is pivotal in FFF 3D printing, directly influencing the produced part characteristics and performance. Common thermoplastics like ABS, PET-G, and PLA offer ease of use, while engineering-grade polymers such as Nylon and Polycarbonate enhance strength and temperature resistance. Polymers and composites with additives like carbon fiber or metal particles offer unique properties like conductivity or flame resistance. Selecting the most suitable polymer depends on specific application needs, considering factors like mechanical load, environment, and functionality. Filament diameter, quality, and printer compatibility are also important considerations.
The polymers that have been selected for this study are:
-
1.
PET-G: PET-G, a glycol-modified thermoplastic polyester, offers durability, chemical resistance, and formability. It surpasses PLA in strength, impact resistance, and temperature tolerance, making it a versatile choice [18]. UltiMaker’s transparent PET-G was the material of choice in this study.
- 2.
- 3.
- 4.
- 5.
-
6.
PET-CF: PET-CF, a carbon fiber-reinforced PET variant, combines printability with enhanced stiffness, chemical, and temperature resistance, making it suitable for industrial 3D printing [24]. For this research LUVOCOM® 3F PET-CF 9780 Black was used.
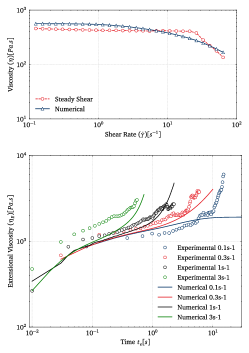
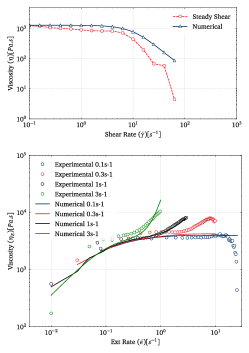
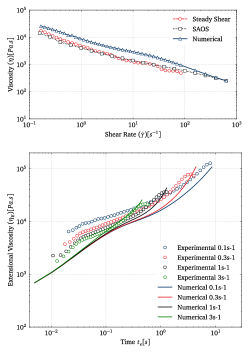
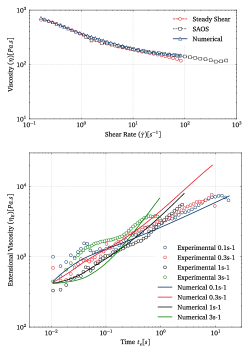
A complete rheological characterization consisting of a combination of steady shear flow curves and steady extensional flow experiments followed the protocols detailed in our previous works [16, 17]. The experimental dataset served to fit the parameters of the Giesekus model (Eq. 1), as in our previous works [16, 17]:
| (1) |
where is the zero-shear viscosity and is the relaxation time, both determined from the relaxation spectrum in steady-state; the dimensionless Giesekus-model mobility factor () governs the extensional viscosity and the ratio of the second normal stress difference to the first. This constitutive model, which is already incorporated into the constitutiveEquations library of rheoTool [25], can predict shear-thinning, shear first and second normal-stress differences. However, it is important to note that in its current version, rheoTool does not perform the automatic fitting of the constitutive model parameters from the user-input experimental data.
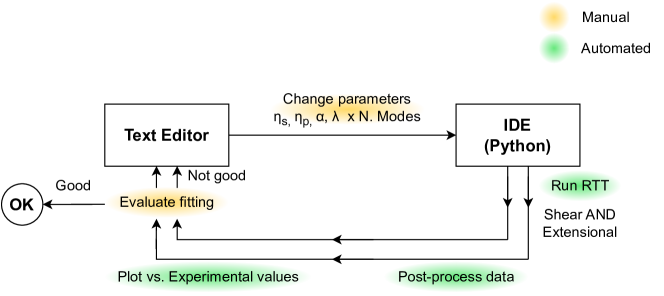
rheoTestFoam was used to compare numerical responses with the rheometric data set under the same experimental conditions to determine model parameters. The initial approach to fitting the models was fully manual, involving the user in all the steps, leading to a repetitive and tedious process. To combat this, a collection of Python scripts was developed to run and plot the data automatically (Figure 1), allowing for a more visual iterative process drastically reducing the model creation time [26].
| Material | PET-G | PLA | PC | PA6/66 | ABS | PET-CF |
|---|---|---|---|---|---|---|
| Temperature [∘C] | 240 | 205 [17] | 260 [16] | 243 | 240 | 265 |
| Model | Giesekus | |||||
| Num. Modes | 3 | 3 | 4 | 2 | 2 | 2 |
| Avg. | 600 | 2220 | 563 | 1300 | 43900 | 1038 |
| Avg. | 0.355 | 0.209 | 0.713 | 0.518 | 13.27 | 27.21 |
| Avg. | 0.0331 | 0.0133 | 0.233 | 0.239 | 0.107 | 0.018 |
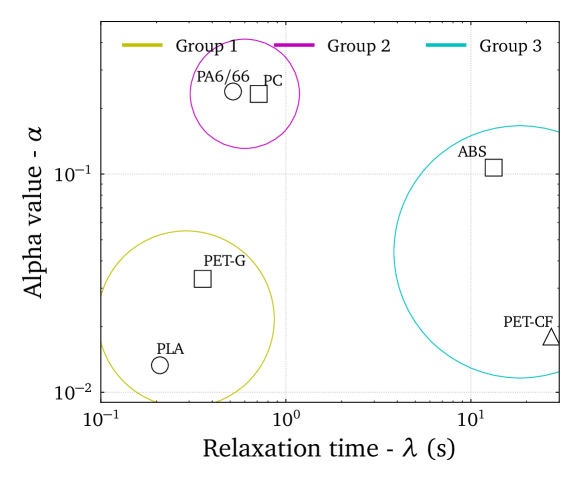
In regards to crystallinity: Amorphous - Square, Semi-crystalline - Circle, Composite - Triangle.
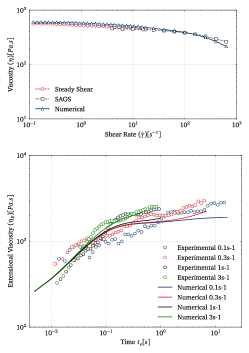
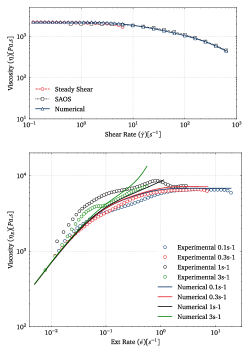
Table 1 details the properties of each polymer model (weight-averaged by ) obtained after applying the fitting process to the rheometric data of the considered polymers at their working temperatures. Figure 2 presents a clustering plot, relating the relaxation time of each material with its value, all while grouping them by “geographical” distance. The goal is to group similar objects into clusters having similar values of the and parameters, enhancing our understanding of their rheological relationships. Figure 3 shows each material’s shear and extensional viscosity curves. These figures were grouped by the groups formed in Figure 2, confirming that similar locations in the parameters-map resulted in similar rheological behaviours.
| Group 1 |
|
|
|---|---|---|
| a) PET-G | b) PLA | |
| Group 2 |
|
|
| c) PC | d) PA6/66 | |
| Group 3 |
|
|
| e) ABS | f) PET-CF |
2.2 Nozzle flow simulations
The nozzle geometry consists of an axisymmetric contraction as described in [16]. The tube length was adjusted to guarantee flow development at the start of the contraction region before the tapered section. Gravity was aligned with the nozzle’s symmetry axis, and the cylindrical coordinate system’s origin coincided with the upstream length’s beginning. Two boundary conditions were applied at the internal wall of the nozzle: a non-slip condition and zero pressure gradient. Additionally, at the inlet face, a uniform velocity profile () was enforced, with representing the average velocity linked to the extrusion velocity :
| (2) |
In this research, we examined nine different extrusion velocities spanning four orders of magnitude: ={0.01, 0.1, 1, 2, 5, 10, 30, 70, 110} mm/s. The Reynolds and Weissenberg numbers corresponding to each velocity and material are detailed in Tables 2 and 3 (refer to Appendix A). Additionally, we applied a zero gradient for pressure at the inlet. At the die exit, where the extruded material encounters atmospheric conditions, we set the pressure to zero, while the boundary condition for velocity was treated as outflow with a zero gradient.
The axisymmetric geometry allowed for efficient 2D numerical simulations instead of 3D, significantly reducing computational time. Consequently, the numerical 2D setup consisted of a narrow-angle wedge, one cell thick, running along the centerline. Wedge-type patches were used for both velocity and pressure, as previously validated in [16]. Similar to our prior studies[16, 17], a structured two-dimensional mesh was created using the blockMesh utility, comprising three zones: 1) the straight upstream section, 2) the tapered area, and 3) the die region. A stream-wise stretch ratio was applied to enhance resolution at the die and abrupt contraction zone. A grid analysis ensured spatial convergence for the presented results in this work.
We assumed isothermal flow through the FFF printer head nozzle for all materials and simulations. Consequently, we were able to separate the energy equation from the governing equations. These equations were solved using the rheoTool library [25, 27] integrated with OpenFOAM® . A high-resolution scheme (CUBISTA) and the log-conformation formulation of the constitutive equation ensured numerical stability [28].
3 Results and discussion
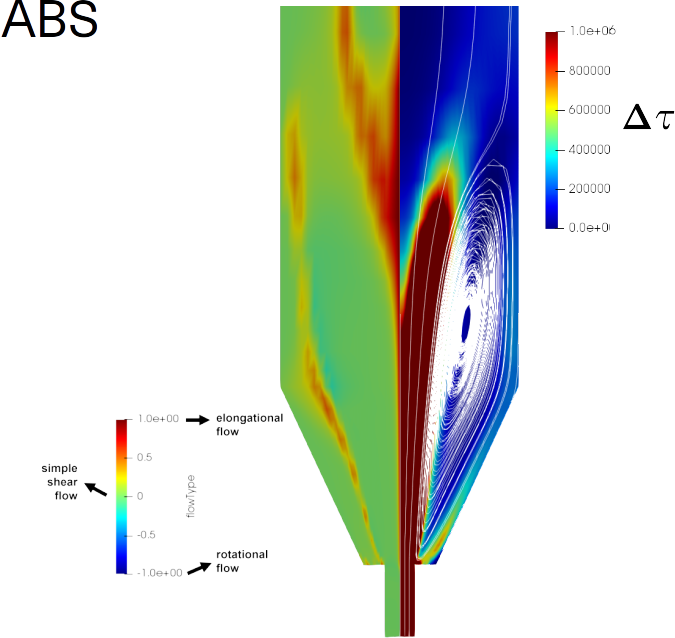
The kinematics of the flow through the nozzle geometry is complex, i.e. at the wall, the polymer melt will undergo pure shear flow () and, at the centerline, the rate of deformation is purely extensional (). The complexity of the contraction flow is well represented by the flow-type parameter [29], defined as:
| (3) |
In this context, represents the magnitude of the rate-of-deformation tensor , and signifies the magnitude of the vorticity tensor , where denotes the velocity field. Irrespective of the fluid’s rheological characteristics and the nozzle’s geometry, reducing the diameter induces a complex flow pattern. This pattern encompasses regions characterized by purely simple shear (), areas of purely elongational flow (), sections approaching solid-body rotation (), and regions displaying a combination of these behaviors [16, 30, 31, 32]. The contraction within the nozzle generates a diverse range of flow types, spanning from simple shear to extensional flow, encompassing the entire nozzle’s cross-section. That kinematics complexity results in a complex distribution of normal stress differences (), that is, at the wall, the normal stress difference corresponds to the shear-induced ones (); at the centerline, the normal stress difference is related to the extension of the molecules (); whereas at any location in between they are coupled.
|
Group 1 |
 |
 |
|---|---|---|
|
Group 2 |
 |
 |
|
Group 3 |
 |
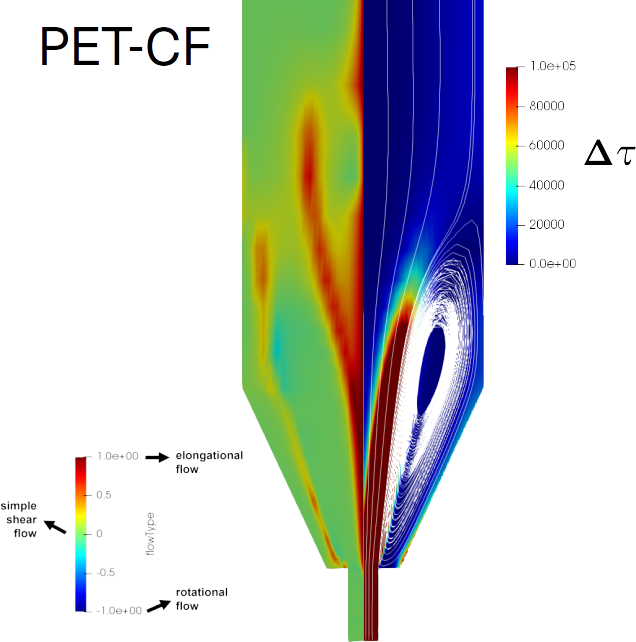 |
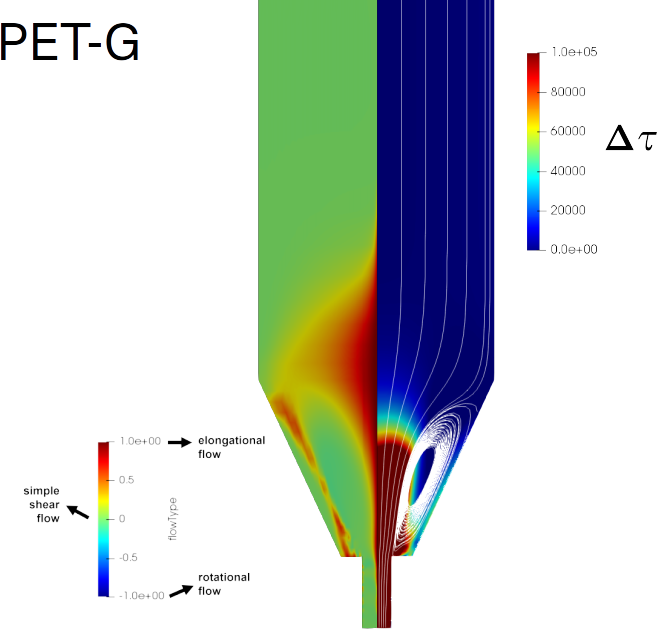
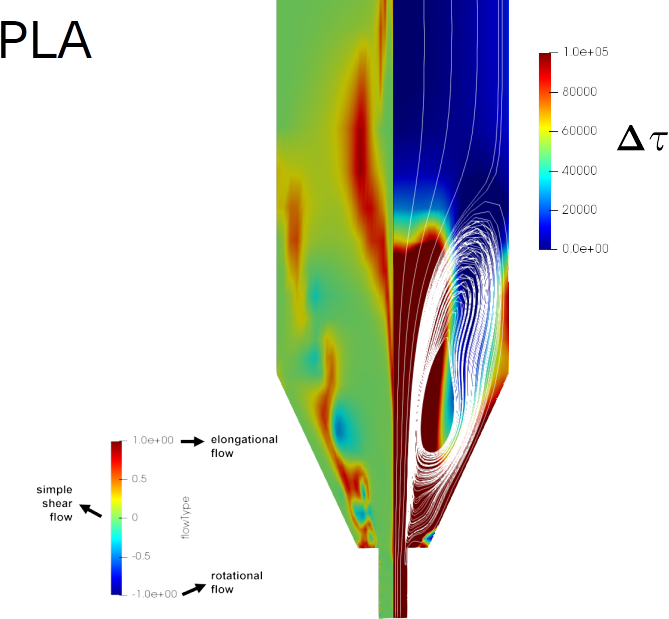
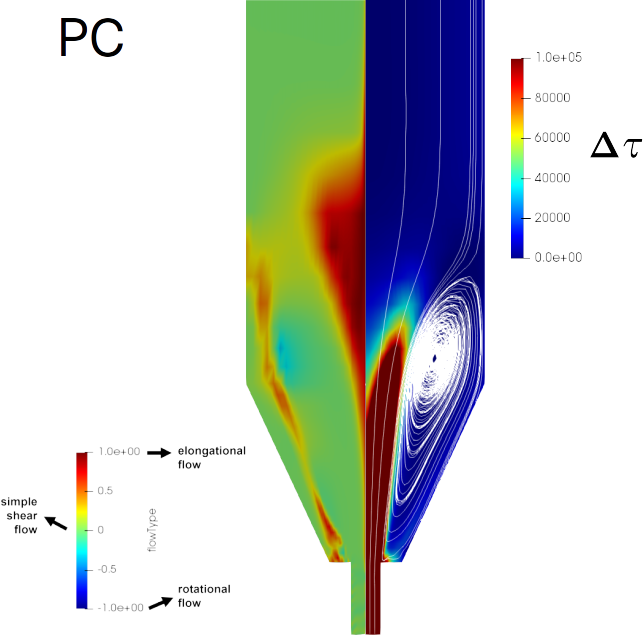
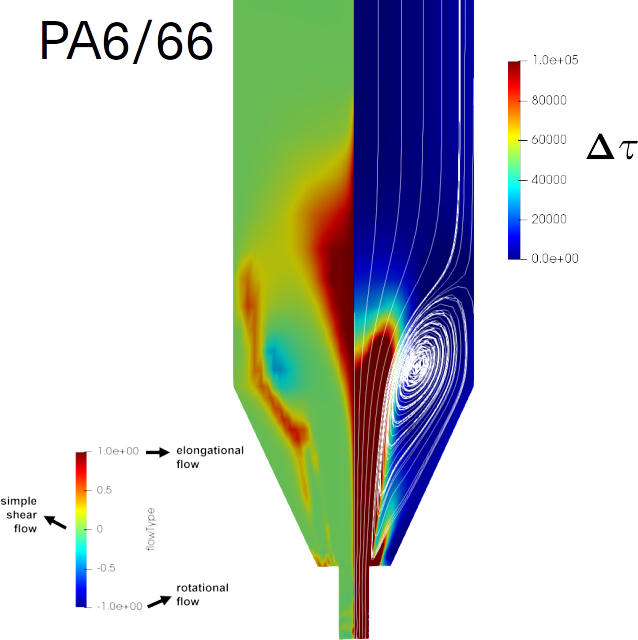
Figure 4 shows a composition of the contour plots corresponding to the gradient of flow type (left half) and the normal stress differences (right half) for all the materials considered in this study. Different patterns in the flow type can be observed depending on the material extruded; as expected, the flow type is mainly dominated by the shear flow (green), although important portions of the fluid domain, axisymmetric and with a dart shape, are pure extensional flow (red). As mentioned above, that complexity leads to a complex rate of deformation distribution, which, depending on the rheological properties of the fluid, results in a complex distribution of stress differences, depending on the material’s rheological properties.
It can be observed in Figure 4 that PLA and PET-G (Group 1) exhibit shear thinning and a soft-curved and asymptotic increase of the extensional viscosity, which resulted in a squared normal stress difference distribution centred at the axis of symmetry. PC and PA6/66 (Group 2) also exhibited shear thinning under shear flow but strain hardening under extensional flow; this rheological behaviour resulted in an indent at the centerline in the previous squared normal stress difference, compared to that shown by PLA and PET-G. ABS and PET-CF (Group 3) presented shear thinning, but a steep increase of the extensional viscosity with the accumulated deformation resulted in an even more pronounced indentation in the normal stress difference contour plot at the centerline. It can be concluded that the steeper the increase of the extensional viscosity with the accumulated deformation, the higher the resistance to the extensional flow at the centerline of the nozzle geometry.
Due to the viscoelastic nature of the polymers, upon a critical flow rate, upstream vortex structures were observed for all of them (Figure 4). The tip of the normal stress difference distribution marked the tip of the upstream vortex structure, confirming that the presence of upstream vortices in viscoelastic contraction flows is due to elastic instabilities. Further increasing the flow rate leads to an unsteady motion of the vortex and oscillating values in the pressure drop, as previously reported [13, 17].
Figure 5 shows the typical S-shaped curve for the upstream vortex size ( [mm]) with a growing flow rate (Q [mm3/s]) for all materials, which tends asymptotically to the Moffatt vortex size at low flow rates and to a saturation size at high flow rates [10]. The combination of considerably high relaxation time and viscosity resulted in a faster growth rate of the upstream vortex size, as could be observed for Group 3 of polymers, whereas relatively low viscosities and relaxation time exhibited a lower rate of growth in upstream vortex structures (e.g. PET-G). The sequence observed in Figure 5 can be inferred from the product (Table 1), which is an estimation of the zero-shear first normal stress coefficient ( [33], A); thus, the large first normal stress coefficient is, the more prone is the polymer to develop upstream vortices [12].
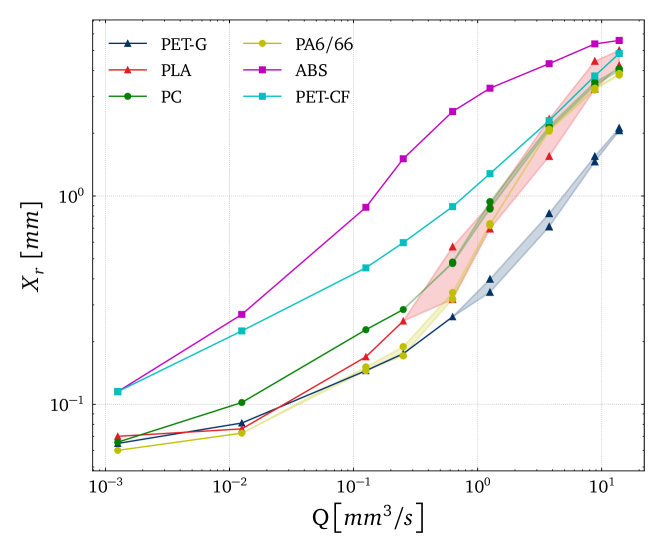
Group 1 - triangles; Group 2 - circles; Group 3 - squares.
In FFF, the solid thermoplastic filament is melted in the liquefier and extruded through a nozzle. The rollers push down the solid filament, which works as a piston to impose a pressure-driven flow to the polymer melt. It has been previously reported [17] that the total pressure drop measured in the feeders can be decoupled as a sum of the pressure drop in the liquefier and the pressure drop in the nozzle, being the latter very close to the one predicted by the numerical model proposed here. In a cylindrical coordinate system, the conservation momentum equation for the steady-state Poiseuille flow of viscoelastic material through the nozzle gets reduced to the following ones, corresponding to and -directions, respectively [34]:
| (4) |
| (5) |
where and must satisfy the mass conservation equation:
| (6) |
The shear viscosity () and the first normal stress difference () are responsible for the pressure gradient in the direction of the flow (Eq. 5), being dependent on the kind of deformation exerted to the polymeric molecules, i.e. extensional at the centerline, pure shear at the wall, or a combination anywhere in between. Therefore, the larger the shear viscosity and the larger the area occupied by large values of first normal stress differences (Figure 4), the more significant the pressure drop will be.
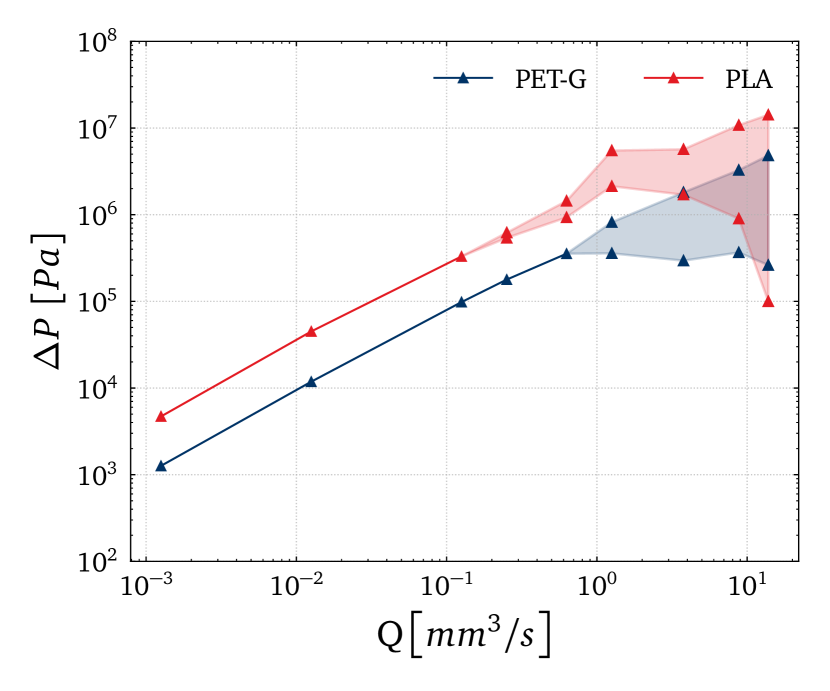
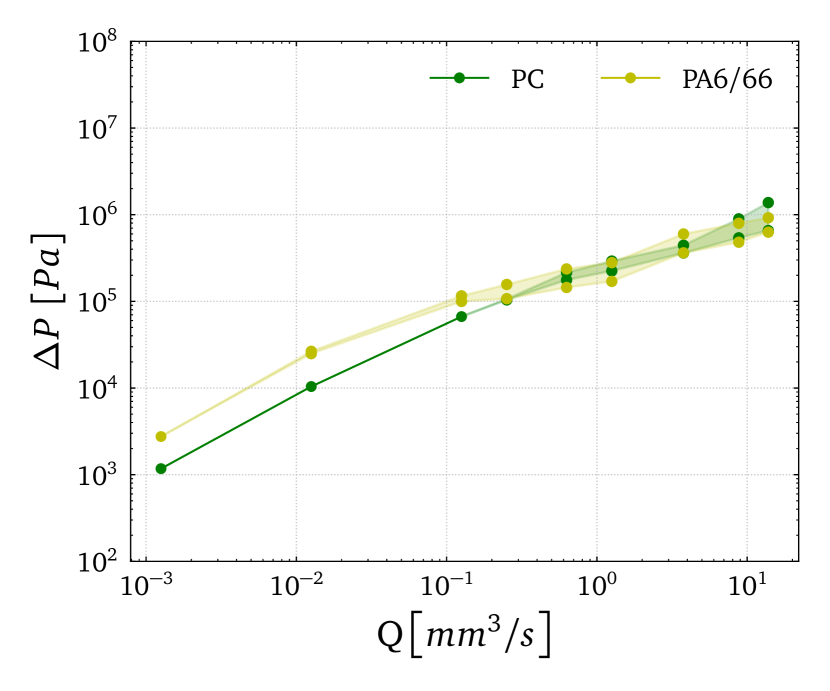
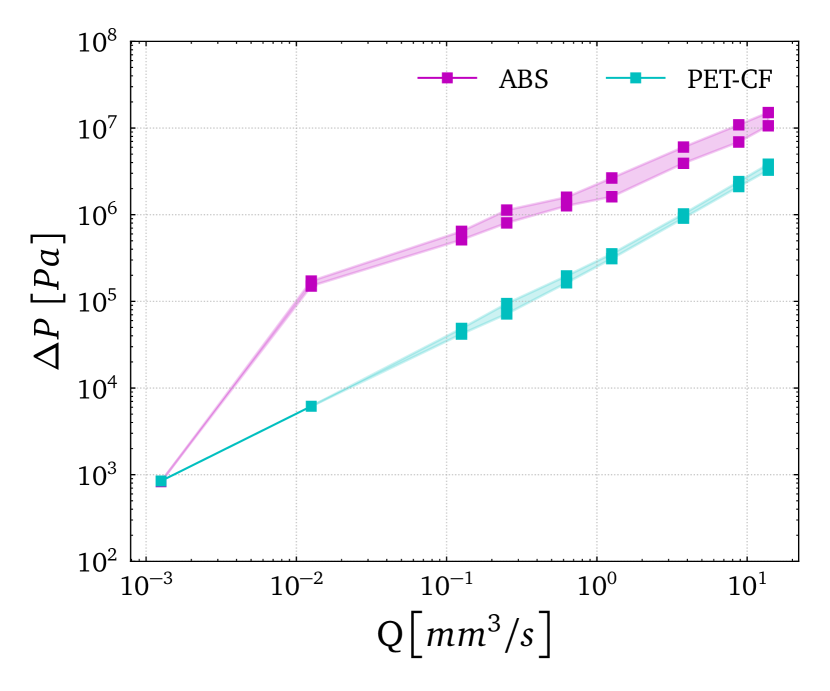
Figure 6 shows the dependence of the pressure drop with the imposed flow rate, and it confirms the previous analysis, showing that ABS, PLA and PET-CF exhibit more significant pressure drops, followed by PET-G and PC and PA6/66. It is important to note that Figure 6 accounts for the pressure drop within the tapered region and the pressure drop in the straight parts of the nozzle. The shear thinning behaviour present in all the polymeric materials provokes a decrease in pressure drop due to viscous contribution; upon a critical flow rate, the elastic instabilities are triggered, and the excess pressure drop is activated [9, 35]. Further increasing the flow rate leads to an unsteady motion of the vortex and, subsequently, oscillating values in the pressure drop [17], which can be associated with elastic turbulence [36, 37]. A low value in the parameter implies a less shear thinning in viscosity, and the fluid tends to a Boger-fluid-like behaviour; thus, the material would be more prone to trigger elastic instabilities and turbulence [38].
In Figure 6 a)-c) it is possible to observe that the larger the viscosity of the polymer, the larger the pressure drop. A stronger shear thinning behaviour (higher values in the parameter) results in a bend of the curve, whereas low values of lead to elastic turbulence, with oscillating and larger pressure drops. This, together with the shapes of normal stress difference plots, allows for the understanding that a more squared/plug-shaped region in the center of the tapered region, along with the approximation of the vortex to the center of the channel (more pronounced in the PLA case (Figure 4)), leads to a higher magnitude of elastic turbulence/instabilities in the reentrant corner, a critical region of the flow.
If the vortex size is plotted against the pressure drop for all materials, it is possible to attest that polymers with relatively low relaxation time ( s) are more sensitive, and the pressure drop increases drastically for a small increase in vortex size in its initial stages. This increase then becomes more gradual as the recirculation grows. This is visible in Figure 7.
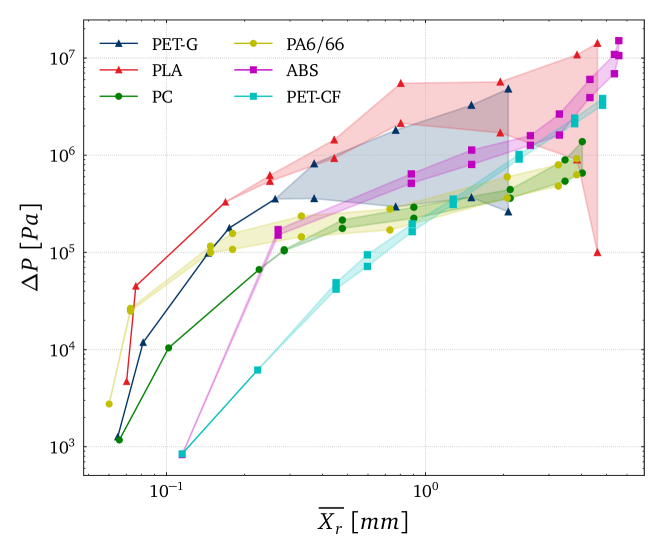
Group 1 - triangles; Group 2 - circles; Group 3 - squares.
Although die-swell was not considered a matter of investigation in this work, it can be an important parameter in FFF, particularly on the fiber orientation and the resulting mechanical properties [39]. Die-swell is not affected by the presence of the upstream vortices [40], and it has been reported in the literature [41] that the swelling ratio decreases as the value of the parameter increases. Therefore, according to Table 1, the larger die-swell would be expected for polymers belonging to Group 2, followed by ABS, PET-G, PET-CF and, finally, PLA.
4 Conclusions
This study has conducted a thorough numerical examination of upstream vortex formation in a standard Fused Filament Fabrication (FFF) nozzle during stable flow conditions. The investigation utilized the Giesekus constitutive model, incorporating data from steady simple shear experiments and transient extensional viscosity experiments conducted at different extension rates.
Significant contributions have been made to the body of knowledge previously derived from prior work [16, 15]. It has been demonstrated that even under steady flow conditions at extrusion velocities representative of practical scenarios, growing upstream vortices are influenced by elastic instabilities. These instabilities manifest as physical disturbances in pressure, leading to the phenomenon known as “elastic turbulence”.
Complex flow patterns induced within the nozzle, ranging from simple shear to extensional flow, have been critically examined. These flow phenomena affect the behaviour of molten polymer from the nozzle walls to the axis (as depicted in Figure 4). This intricate behaviour persists through the tapered region and further upstream into the liquefier, while the flow inside the die is primarily characterized by simple shear.
Two key observations have arisen from the analysis of flow types and variations in normal stress: Firstly, the vortex tip marks the culmination of elastic stresses induced by extensional flow, and secondly, the shape of the stress contour plot has a direct impact on the proximity of the upstream vortex to the nozzle centerline. These observations are further supported by the consistent appearance of rheological groups identified during the characterization. In the examination of the plots displaying normal stress surfaces, the intricate interplay between these stresses surrounding the contraction has been discerned. This relationship sheds light on the rheological properties of the fluid and contributes significantly to variations in pressure drop and the emergence of instabilities. This fluid characteristic appears to correlate with elevated excess pressure drop, potentially causing operational challenges during printing.
Furthermore, the sensitivity of various materials to the creation of recirculation vortices has been uncovered. A thorough comprehension of total pressure drop and upstream vortex formation is paramount for optimizing the FFF process. These factors directly influence extrusion rates, backflow tendencies, and overall print quality, as previously discussed [17]. Elevated pressure drops can give rise to complications such as filament deformation, irregular flow patterns, or even nozzle clogging. Additionally, this insight empowers us to anticipate potential challenges and develop strategies to mitigate them, thereby enhancing the efficiency and reliability of FFF-based 3D printing.
James and Roos recently demonstrated in their work [40] that it is feasible for a viscoelastic fluid to traverse a converging channel without inducing upstream vortices, resulting in an equivalent pressure drop across the contraction as that of a Newtonian fluid with the same viscosity. Under these circumstances, elasticity does not impact pressure drop within the nozzle, but influences die swell at the exit. Achieving this involves modifying the nozzle’s shape to facilitate the radial distribution of normal stress and pressure, prompting streamlines to migrate to the centerline, consequently reducing the shear rate and shear stress at the wall. Consequently, the energy expended on shear within the channel decreases, with the saved energy being redirected toward polymer-related viscous dissipation. That conclusion [40], together with the result obtained in Figure 7 inspired us and allowed us to envisage the possibility of having an optimal nozzle shape for each polymer rheology so that upstream vortices would be suppressed and, consequently, the pressure drop in the nozzle would be minimum, being dependent exclusively on the viscosity of the material. These findings imply that optimizing nozzle geometries through techniques like Optimized Shape Design could facilitate material flows with reduced pressure requirements within the system [42]. However, this is out of the scope of the current manuscript and will be investigated soon.
Acknowledgements
The authors thank Johan Versteegh for the fruitful discussion and selfless support. FJGR and TS acknowledge the financial support from Ultimaker B.V., and also LA/P/0045/2020 (ALiCE), UIDP/00532/2020 (CEFT) and the program Stimulus of Scientific Employment, Individual Support-2020.03203.CEECIND, funded by FEDER funds through COMPETE2020 – Programa Operacional Competitividade e Internacionalização (POCI); and by national funds (PIDDAC) through FCT/MCTES.
Appendix A
White [43] used dimensional analysis for steady second-order fluid flows, revealing three key dimensionless groups. The first, similar to classical fluid mechanics’ Reynolds number (), represents the ratio of inertial to viscous forces, here as , being the average viscosity parameter from Table 1; the second group balances elastic and viscous forces; while the third relates to higher-order properties, particularly the “viscoelastic ratio” number, the ratio of to , which is typically negligible in polymer melts. The group was termed the “Weissenberg number,” now known as ; the Weissenberg number used is , where is the average relaxation time from Table 1. Finally, the elasticity number, , characterizes the elastic and inertial forces balance, defined as ; in this document, , with and as previously defined.
Tables 2 and 3 show the values of and for each material and each extrusion velocity considered in this study. It can be observed the low values of , below and even for low extrusion velocities, depending on the rheological properties of the material. The small characteristic length scale and the large viscosities of every polymer melt ensure large values for at all the extrusion velocities.
| (mm/s) | ABS | PLA | PC | PA6-66 | PET-CF | PET-G |
|---|---|---|---|---|---|---|
| 0.01 | 8.61E-11 | 1.93E-09 | 7.60E-09 | 3.11E-09 | 4.56E-09 | 6.93E-09 |
| 0.1 | 8.61E-10 | 1.93E-08 | 7.60E-08 | 3.11E-08 | 4.56E-08 | 6.93E-08 |
| 1 | 8.61E-09 | 1.93E-07 | 7.60E-07 | 3.11E-07 | 4.56E-07 | 6.93E-07 |
| 2 | 1.72E-08 | 3.86E-07 | 1.52E-06 | 6.22E-07 | 9.12E-07 | 1.39E-06 |
| 5 | 4.31E-08 | 9.64E-07 | 3.80E-06 | 1.56E-06 | 2.28E-06 | 3.47E-06 |
| 10 | 8.61E-08 | 1.93E-06 | 7.60E-06 | 3.11E-06 | 4.56E-06 | 6.93E-06 |
| 30 | 2.58E-07 | 5.78E-06 | 2.28E-05 | 9.33E-06 | 1.37E-05 | 2.08E-05 |
| 70 | 6.03E-07 | 1.35E-05 | 5.32E-05 | 2.18E-05 | 3.19E-05 | 4.85E-05 |
| 110 | 9.47E-07 | 2.12E-05 | 8.36E-05 | 3.42E-05 | 5.01E-05 | 7.63E-05 |
| (mm/s) | ABS | PLA | PC | PA6-66 | PET-CF | PET-G |
|---|---|---|---|---|---|---|
| 0.01 | 0.6635 | 0.01045 | 0.03565 | 0.0259 | 1.3605 | 0.01775 |
| 0.1 | 6.635 | 0.1045 | 0.3565 | 0.259 | 13.605 | 0.1775 |
| 1 | 66.35 | 1.045 | 3.565 | 2.59 | 136.05 | 1.775 |
| 2 | 132.7 | 2.09 | 7.13 | 5.18 | 272.1 | 3.55 |
| 5 | 331.75 | 5.225 | 17.825 | 12.95 | 680.25 | 8.875 |
| 10 | 663.5 | 10.45 | 35.65 | 25.9 | 1360.5 | 17.75 |
| 30 | 1990.5 | 31.35 | 106.95 | 77.7 | 4081.5 | 53.25 |
| 70 | 4644.5 | 73.15 | 249.55 | 181.3 | 9523.5 | 124.25 |
| 110 | 7298.5 | 114.95 | 392.15 | 284.9 | 14965.5 | 195.25 |
References
- [1] ASTM-International, Additive manufacturing: General principles, fundamentals and vocabulary, https://www.astm.org/f3177-21.html (2021).
- [2] S. S. Crump, Modeling apparatus for three-dimensional objects, US Patent US5340433A (2011-08-23, anticipated expiration).
-
[3]
J. C. Najmon, S. Raeisi, A. Tovar,
2
- Review of additive manufacturing technologies and applications in the
aerospace industry, in: F. Froes, R. Boyer (Eds.), Additive Manufacturing
for the Aerospace Industry, Elsevier, 2019, pp. 7–31.
doi:https://doi.org/10.1016/B978-0-12-814062-8.00002-9.
URL https://www.sciencedirect.com/science/article/pii/B9780128140628000029 -
[4]
H. Klippstein, A. Diaz De Cerio Sanchez, H. Hassanin, Y. Zweiri,
L. Seneviratne,
Fused
Deposition Modeling for Unmanned Aerial Vehicles (UAVs): A Review, Advanced
Engineering Materials 20 (2) (2018) 1700552.
arXiv:https://onlinelibrary.wiley.com/doi/pdf/10.1002/adem.201700552,
doi:https://doi.org/10.1002/adem.201700552.
URL https://onlinelibrary.wiley.com/doi/abs/10.1002/adem.201700552 -
[5]
A. Lalehpour, A. Barari,
Post
processing for Fused Deposition Modeling Parts with Acetone Vapour Bath,
IFAC-PapersOnLine 49 (31) (2016) 42–48, 12th IFAC Workshop on Intelligent
Manufacturing Systems IMS 2016.
doi:https://doi.org/10.1016/j.ifacol.2016.12.159.
URL https://www.sciencedirect.com/science/article/pii/S2405896316328300 -
[6]
A. P. Valerga, M. Batista, S. R. Fernandez-Vidal, A. J. Gamez,
Impact of Chemical
Post-Processing in Fused Deposition Modelling (FDM) on Polylactic Acid (PLA)
Surface Quality and Structure, Polymers 11 (3) (2019).
doi:10.3390/polym11030566.
URL https://www.mdpi.com/2073-4360/11/3/566 -
[7]
E. L. Gilmer, D. Miller, C. A. Chatham, C. Zawaski, J. J. Fallon, A. Pekkanen,
T. E. Long, C. Williams, M. Bortner,
Model
analysis of feedstock behavior in fused filament fabrication: Enabling rapid
materials screening, Polymer 152, sI: Advanced Polymers for
3DPrinting/Additive Manufacturing (11 2017).
doi:10.1016/j.polymer.2017.11.068.
URL http://www.sciencedirect.com/science/article/pii/S0032386117311369 -
[8]
A. Das, E. L. Gilmer, S. Biria, M. J. Bortner,
Importance of Polymer Rheology
on Material Extrusion Additive Manufacturing: Correlating Process Physics to
Print Properties, ACS Applied Polymer Materials 3 (3) (2021) 1218–1249.
arXiv:https://doi.org/10.1021/acsapm.0c01228, doi:10.1021/acsapm.0c01228.
URL https://doi.org/10.1021/acsapm.0c01228 -
[9]
G. H. McKinley, W. P. Raiford, R. A. Brown, R. C. Armstrong,
Nonlinear dynamics of
viscoelastic flow in axisymmetric abrupt contractions, Journal of Fluid
Mechanics 223 (-1) (1991) 411.
doi:10.1017/s0022112091001489.
URL https://doi.org/10.1017/s0022112091001489 -
[10]
M. S. Oliveira, P. J. Oliveira, F. T. Pinho, M. A. Alves,
Effect
of contraction ratio upon viscoelastic flow in contractions: The axisymmetric
case, Journal of Non-Newtonian Fluid Mechanics 147 (1) (2007) 92–108.
doi:https://doi.org/10.1016/j.jnnfm.2007.07.009.
URL http://www.sciencedirect.com/science/article/pii/S0377025707001656 -
[11]
F. P. Baaijens, Numerical
analysis of start-up planar and axisymmetric contraction flows using
multi-mode differential constitutive models, Journal of Non-Newtonian Fluid
Mechanics 48 (1-2) (1993) 147–180.
doi:10.1016/0377-0257(93)80069-n.
URL https://doi.org/10.1016/0377-0257(93)80069-n -
[12]
J. P. Rothstein, G. H. McKinley,
Extensional
flow of a polystyrene Boger fluid through a 4:1:4 axisymmetric
contraction-expansion, Journal of Non-Newtonian Fluid Mechanics 86 (1)
(1999) 61–88.
doi:https://doi.org/10.1016/S0377-0257(98)00202-X.
URL http://www.sciencedirect.com/science/article/pii/S037702579800202X -
[13]
J. Rothstein, G. McKinley,
The
axisymmetric contraction–expansion: the role of extensional rheology on
vortex growth dynamics and the enhanced pressure drop, Journal of
Non-Newtonian Fluid Mechanics 98 (1) (2001) 33–63.
doi:https://doi.org/10.1016/S0377-0257(01)00094-5.
URL http://www.sciencedirect.com/science/article/pii/S0377025701000945 -
[14]
F. Pimenta, K. Toda-Peters, A. Q. Shen, M. A. Alves, S. J. Haward,
Viscous flow through
microfabricated axisymmetric contraction/expansion geometries, Experiments
in Fluids 61 (9) (2020) 204.
doi:10.1007/s00348-020-03036-z.
URL https://doi.org/10.1007/s00348-020-03036-z - [15] R. Mendes, P. Fanzio, L. Campo-Deaño, F.-J. Galindo-Rosales, Microfluidics as a Platform for the Analysis of 3D Printing Problems, Materials 12 (2019) 20. doi:10.3390/ma12172839.
-
[16]
T. Schuller, P. Fanzio, F.-J. Galindo-Rosales,
Analysis
of the importance of shear-induced elastic stresses in material extrusion,
Additive Manufacturing 57 (2022).
doi:https://doi.org/10.1016/j.addma.2022.102952.
URL https://www.sciencedirect.com/science/article/pii/S2214860422003463 -
[17]
S. de Vries, T. Schuller, P. Fanzio, F.-J. Galindo-Rosales,
Pressure drop
non-linearities in Fused Filament Fabrication (2023).
doi:10.48550/arXiv.2310.01901.
URL https://doi.org/10.48550/arXiv.2310.01901 -
[18]
P. Latko-Durałek, K. Dydek, A. Boczkowska,
Thermal, rheological and
mechanical properties of PETG/rPETG blends, Journal of Polymers and the
Environment 27 (11) (2019) 2600–2606.
doi:10.1007/s10924-019-01544-6.
URL https://doi.org/10.1007/s10924-019-01544-6 -
[19]
R. B. Kristiawan, F. Imaduddin, D. Ariawan, Ubaidillah, Z. Arifin,
A review on the fused deposition
modeling (FDM) 3d printing: Filament processing, materials, and printing
parameters, Open Engineering 11 (1) (2021) 639–649.
doi:10.1515/eng-2021-0063.
URL https://doi.org/10.1515/eng-2021-0063 - [20] T. Swetham, K. M. M. Reddy, A. Huggi, M. N. Kumar, A critical review on of 3d printing materials and details of materials used in fdm, Int. J. Sci. Res. Sci. Eng. Technol 3 (2017) 353–361.
- [21] R. Krache, I. Debbah, Some mechanical and thermal properties of pc/abs blends, Materials Sciences and Applications 2 (5) (2011) 404–410.
- [22] C. Bierögel, Materials symbols: Polymer solids and polymer melts, Polymer Solids and Polymer Melts–Mechanical and Thermomechanical Properties of Polymers (2014) 16–24.
- [23] C. Bierögel, W. Grellmann, Quasi-static tensile test–tensile properties of thermoplastics-data: Polymer solids and polymer melts, Polymer Solids and Polymer Melts–Mechanical and Thermomechanical Properties of Polymers (2014) 88–99.
- [24] K. Sharma, Effect of fff process parameters on density and mechanical properties of pet-g and carbon fiber reinforced pet-g composites, Master’s thesis (2021).
- [25] F. Pimenta, M. Alves, rheoTool, https://github.com/fppimenta/rheoTool (2016).
- [26] T. Schuller, foamscripts, https://github.com/T-Schuller/foamScripts (2023).
-
[27]
F. Pimenta, M. Alves,
Stabilization
of an open-source finite-volume solver for viscoelastic fluid flows,
Journal of Non-Newtonian Fluid Mechanics 239 (2017) 85–104.
doi:https://doi.org/10.1016/j.jnnfm.2016.12.002.
URL http://www.sciencedirect.com/science/article/pii/S0377025716303329 -
[28]
M. Alves, P. Oliveira, F. Pinho,
Numerical Methods
for Viscoelastic Fluid Flows, Annual Review of Fluid Mechanics 53 (1)
(2021) 509–541.
arXiv:https://doi.org/10.1146/annurev-fluid-010719-060107, doi:10.1146/annurev-fluid-010719-060107.
URL https://doi.org/10.1146/annurev-fluid-010719-060107 -
[29]
J. Ortega-Casanova, M. Jimenez-Canet, F. Galindo-Rosales,
Numerical
study of the heat and momentum transfer between a flat plate and an impinging
jet of power law fluids, International Journal of Heat and Mass Transfer
141 (2019) 102–111.
doi:https://doi.org/10.1016/j.ijheatmasstransfer.2019.06.072.
URL https://www.sciencedirect.com/science/article/pii/S0017931019310737 -
[30]
R. Thompson, P. R. Souza Mendes, M. Naccache,
A
new constitutive equation and its performance in contraction flows1Presented
at the IUTAM Symposium on Rheology and Computation, Sydney, July 1997.1,
Journal of Non-Newtonian Fluid Mechanics 86 (3) (1999) 375–388.
doi:https://doi.org/10.1016/S0377-0257(99)00005-1.
URL https://www.sciencedirect.com/science/article/pii/S0377025799000051 -
[31]
G. Mompean, R. Thompson, P. Souza Mendes,
A
general transformation procedure for differential viscoelastic models,
Journal of Non-Newtonian Fluid Mechanics 111 (2) (2003) 151–174.
doi:https://doi.org/10.1016/S0377-0257(03)00042-9.
URL https://www.sciencedirect.com/science/article/pii/S0377025703000429 -
[32]
A. Fakhari, C. Fernandes, F. J. Galindo-Rosales,
Mapping the volume transfer
of graphene-based inks with the gravure printing process: Influence of
rheology and printing parameters, Materials 15 (7) (2022).
doi:10.3390/ma15072580.
URL https://www.mdpi.com/1996-1944/15/7/2580 -
[33]
Official symbols and nomenclature of
The Society of Rheology, Journal of Rheology 57 (4) (2013) 1047–1055.
arXiv:https://doi.org/10.1122/1.4811184, doi:10.1122/1.4811184.
URL https://doi.org/10.1122/1.4811184 -
[34]
F. Morrison,
Understanding
Rheology, Raymond F. Boyer Library Collection, Oxford University Press,
2001.
URL https://books.google.pt/books?id=bwTn8ZbR0C4C -
[35]
M. A. Alves, R. J. Poole,
Divergent flow in
contractions, Journal of Non-Newtonian Fluid Mechanics 144 (2-3) (2007)
140–148.
doi:10.1016/j.jnnfm.2007.04.003.
URL https://doi.org/10.1016/j.jnnfm.2007.04.003 - [36] A. Groisman, V. Steinberg, Elastic turbulence in a polymer solution flow, Nature 405 (6782) (2000) 53–55.
- [37] R. G. Larson, Turbulence without inertia, Nature 405 (6782) (2000) 27–28.
-
[38]
S. Peng, J. yu Li, Y. liang Xiong, X. yang Xu, P. Yu,
Numerical
simulation of two-dimensional unsteady giesekus flow over a circular
cylinder, Journal of Non-Newtonian Fluid Mechanics 294 (2021) 104571.
doi:https://doi.org/10.1016/j.jnnfm.2021.104571.
URL https://www.sciencedirect.com/science/article/pii/S0377025721000811 -
[39]
B. P. Heller, D. E. Smith, D. A. Jack,
Effects
of extrudate swell and nozzle geometry on fiber orientation in fused filament
fabrication nozzle flow, Additive Manufacturing 12 (2016) 252–264, special
Issue on Modeling & Simulation for Additive Manufacturing.
doi:https://doi.org/10.1016/j.addma.2016.06.005.
URL https://www.sciencedirect.com/science/article/pii/S2214860416301166 -
[40]
D. F. James, C. A. Roos,
Pressure
drop of a Boger fluid in a converging channel, Journal of Non-Newtonian
Fluid Mechanics 293 (2021) 104557.
doi:https://doi.org/10.1016/j.jnnfm.2021.104557.
URL https://www.sciencedirect.com/science/article/pii/S0377025721000707 -
[41]
M. Tomé, M. Araujo, J. Evans, S. McKee,
Numerical
solution of the giesekus model for incompressible free surface flows without
solvent viscosity, Journal of Non-Newtonian Fluid Mechanics 263 (2019)
104–119.
doi:https://doi.org/10.1016/j.jnnfm.2018.11.007.
URL https://www.sciencedirect.com/science/article/pii/S0377025718301939 - [42] T. Borrvall, J. Petersson, Topology optimization of fluids in Stokes flow, International Journal for Numerical Methods in Fluids 41 (1) (2003) 77–107. doi:10.1002/fld.426.
-
[43]
J. L. White, Dynamics of
viscoelastic fluids, melt fracture, and the rheology of fiber spinning,
Journal of Applied Polymer Science 8 (5) (1964) 2339–2357.
doi:10.1002/app.1964.070080527.
URL https://doi.org/10.1002/app.1964.070080527