/,/
\readlist\skonly2.40,0.07,0.09
0.450,0.059,0.026
-1.885,0.865,1.180
0.020,0.016,0.011
1022.0616
\readlist\skonlyi2.40,0.05,0.33
0.475,0.073,0.051
-1.885,1.324,1.969
0.010,0.021,0.008
1027.2899
\readlist\skqfix2.40,0.07,0.09
0.450,0.057,0.026
-1.745,0.760,1.252
0.020,0.015,0.010
1022.0565
\readlist\skqfixi2.40,0.06,0.12
0.450,0.078,0.028
-1.745,0.889,1.217
0.010,0.016,0.007
1027.7470
\readlist\skqfixp0.88132525,0.0091135375
0.41704625,0.019475135
0.98516025,0.0032628229
\readlist\skqfixcls-1.200000000000000000
-1.100000000000000000
-1.066666666666666666
The Super-Kamiokande Collaboration
Atmospheric neutrino oscillation analysis with neutron tagging and an expanded fiducial volume in Super-Kamiokande I–V
Abstract
We present a measurement of neutrino oscillation parameters with the Super-Kamiokande detector using atmospheric neutrinos from the complete pure-water \setsepchar,\readlist\qargI,VSK \qarg[1] (April 1996–July 2020) data set, including events from an expanded fiducial volume. The data set corresponds to live days and an exposure of kiloton-years. Measurements of the neutrino oscillation parameters , , , , and the preference for the neutrino mass ordering are presented with atmospheric neutrino data alone, and with constraints on from reactor neutrino experiments. Our analysis including constraints on favors the normal mass ordering at the \qty[round-mode=places,round-precision=1]220.000000000000000000 level.
I Introduction
Neutrino oscillations in the Pontecorvo-Maki-Nakagawa-Sakata (PMNS) paradigm are parameterized by three mixing angles, two squared-mass differences and a CP-violating phase [ponte1952, mns1962]. Experiments measuring neutrinos of different flavors, energies, and baselines have constrained many of the PMNS parameters with increasing levels of precision. However, the octant of the mixing angle , the phase , and the sign of the larger of the two squared-mass differences, , which determines the neutrino mass ordering, are all presently unknown. To date, the long-baseline accelerator neutrino experiments T2K [t2k_2021] and NOvA [nova_2022] have made the world’s most precise measurements of , , and , but have yet to definitively resolve the remaining questions.
Atmospheric neutrinos are an independent and natural counterpart to accelerator neutrinos for studying neutrino oscillations. Neutrinos created in the earth’s atmosphere span a range of energies and baselines that make their oscillations sensitive to the mixing angle and the magnitude of the squared-mass difference. Additionally, atmospheric neutrinos which pass near or through the dense core of the earth experience matter effects which alter their oscillation probabilities. An observation of these modified oscillation probabilities in either atmospheric neutrino or anti-neutrino data would provide important information towards resolving the neutrino mass ordering.
In this work, we analyze live days of atmospheric neutrino data from the Super-Kamiokande (SK) detector. This analysis improves upon the previous work [sk_atm_2018] in three major ways: We use the number of tagged neutrons to enhance the separation of neutrino events from anti-neutrino events, we enhance the efficiency of classifying multi-ring events using a boosted decision tree (BDT), and we add \qty48 exposure by analyzing events from an expanded fiducial volume and from additional live-days, including data collected after a major detector refurbishment in 2018. In addition to the atmospheric-only analysis, we present an analyses of SK data with an external constraint on the mixing angle from the average measurements of the reactor neutrino experiments Daya Bay [dayabay_2018], RENO [reno_2020] and Double-Chooz [doublechooz_2020].
The paper is organized as follows: Section I presents an overview of neutrino oscillation phenomenology relevant to atmospheric neutrino oscillations. Section II provides a description of the Super-Kamiokande detector and its capabilities for reconstructing neutrino interactions. Section III describes the simulation used to model atmospheric neutrinos interactions at SK. Section IV describes the analysis methodology and presents the results of the analyses without external constraints and with constraints on . We provide an interpretation and summary of the results in Section LABEL:sec:interp.
I.1 Neutrino Oscillations
Neutrinos are produced as flavor eigenstates of the weak interaction, which may be treated as superpositions of mass eigenstates via the PMNS matrix:
| (1) |
where is a label for each lepton flavor, one of , , or , and is an element of the PMNS matrix. The PMNS matrix is parameterized by three mixing angles and a phase, and factorizes into three sub-matrices which describe rotations by each mixing angle from the neutrino mass basis into the neutrino flavor basis:
| U | ||||
| (2) |
In Eq. (I.1), sines and cosines of the mixing angles are written as and respectively, and the phase changes sign for the anti-neutrino case. The probability of a neutrino of one flavor oscillating to a different flavor after some time , or, equivalently, along a baseline , is found by computing the amplitude . The probability is nonzero for the case if the mass states have nonzero mass differences given by the signed quantity .
In the simplest case, neutrinos oscillate in a vacuum and oscillation probabilities may be computed by propagating neutrino states according to their vacuum Hamiltonian, written here in the mass basis:
| (3) |
This leads to oscillation probabilities of the form:
| (4) |
where . Here, is expressed in units of \unit\squared, is the oscillation baseline in kilometers, and is in the neutrino energy in \unit\giga. Experiments have measured all mixing angles and squared mass differences to be significantly different from zero, while the value of the phase is still unknown111Recent results from T2K favor maximal CP violation, [t2knature_2020], while recent measurements from NOvA disfavor CP-violating scenarios [nova_2022].. In addition, solar neutrino oscillation experiments observe evidence for matter effects in the sun which imply the squared mass difference is positive, establishing an ordering for two of the neutrino masses, [sno_2001, sk_2001, wolfenstein_1978, ms_1985]. However, current experiments are consistent with either the normal ordering, , or the inverted ordering, . Consequently, the sign of the squared mass difference between and the next-most-massive neutrino, given by either or , is not known. We use the notation or simply for this squared mass difference where the ordering is not explicitly specified.
Numerically, has been measured to be approximately times larger than , such that . The difference in magnitude between and also implies that the terms in Eq. (I.1) containing one or the other squared mass differences dominate for different ranges of . For long-baseline beam and atmospheric neutrinos, where neutrino baselines range from tens of kilometers to several thousand kilometers, and typical neutrino energies range from \unit\mega to several \unit\giga, the terms are sub-dominant, leading to approximate flavor oscillation probabilities of the form
| (5) |
The approximate oscillation probabilities in Eq. (I.1) are primarily functions of the mixing angles and the absolute value of the squared-mass difference . The phase , and the neutrino mass ordering, i.e., the sign of the squared-mass difference, are sub-leading effects which make them challenging experimental signatures.
Neutrino oscillations in matter enhance the dependence of oscillation probabilities on the neutrino mass ordering. In matter, due to an increased forward scattering amplitude, electron-flavor neutrinos experience a larger potential relative to and flavors which modifies the vacuum Hamiltonian via an additional term,
| (6) |
where . Here, is the Fermi constant, is the electron density, and is the PMNS matrix. The sign of is positive for neutrinos and negative for anti-neutrinos. Propagating the neutrino states according to the matter Hamiltonian leads to an effective squared-mass difference and mixing angle:
| (7) |
where . Equation (I.1) shows that the effective quantities depend on the sign of . In particular, for neutrinos in the normal ordering, maximizes the effective mixing angle . A maximum also occurs for anti-neutrinos in the inverted ordering. This maximum effective mixing angle predicts a resonant enhancement of muon-to-electron flavor conversions for either neutrinos or anti-neutrinos according to the neutrino mass ordering.
I.2 Atmospheric Neutrinos
| Layer | (\unit) | (\unit) | Density (\unit\per\cubed) |
| Atmosphere | – | ||
| Crust | |||
| Mantle | |||
| Outer core | |||
| Inner core |
Atmospheric neutrinos are produced when cosmic rays interact with nuclei in the earth’s atmosphere. These interactions result in hadronic showers of primarily pions and kaons which decay into neutrinos. The atmospheric neutrino energy spectrum extends from a few \unit\mega to several \unit\tera and has an approximate flavor ratio in the few \unit\giga range of . While present, tau neutrinos intrinsic to the atmospheric neutrino flux are suppressed by many orders of magnitude relative to electron- and muon-flavor neutrinos due to kinematic restrictions on their production.
The zenith angle describes atmospheric neutrino baselines. Neutrinos produced directly above a detector are downward going, , and are produced at an average distance of \qty15 above earth’s surface. Neutrinos produced on the other side of the earth from a detector are upward-going, , and travel an approximate distance of \qty13000 through the earth. Oscillation signatures are most evident in upward-going atmospheric neutrinos due to the longer baselines.
A general atmospheric neutrino baseline begins at a production point in the atmosphere and passes through the earth before ending at a detector near the surface. We model the matter effects induced by passage through the earth assuming a simplified version of the preliminary reference Earth model (PREM) [prem1981], where the earth is treated as a sphere with radius and contains concentric spherical shells of decreasing densities. Table 1 lists the earth layers and corresponding densities assumed in this work.
To compute neutrino oscillation amplitudes through layers of different matter densities, amplitudes along steps through matter of fixed densities are multiplied together [barger]. The general matrix form of the propagated mass eigenvectors for neutrinos passing through a fixed matter density is
| (8) |
where are the eigenvalues of . This definition allows the neutrino probability along a baseline of changing matter density to be written as
| (9) |
where and are the baseline and density of the step respectively. In the case of a spherically symmetric earth, as is assumed in this work, the neutrino oscillation baseline only depends on the zenith angle and production height and does not depend on the azimuth.
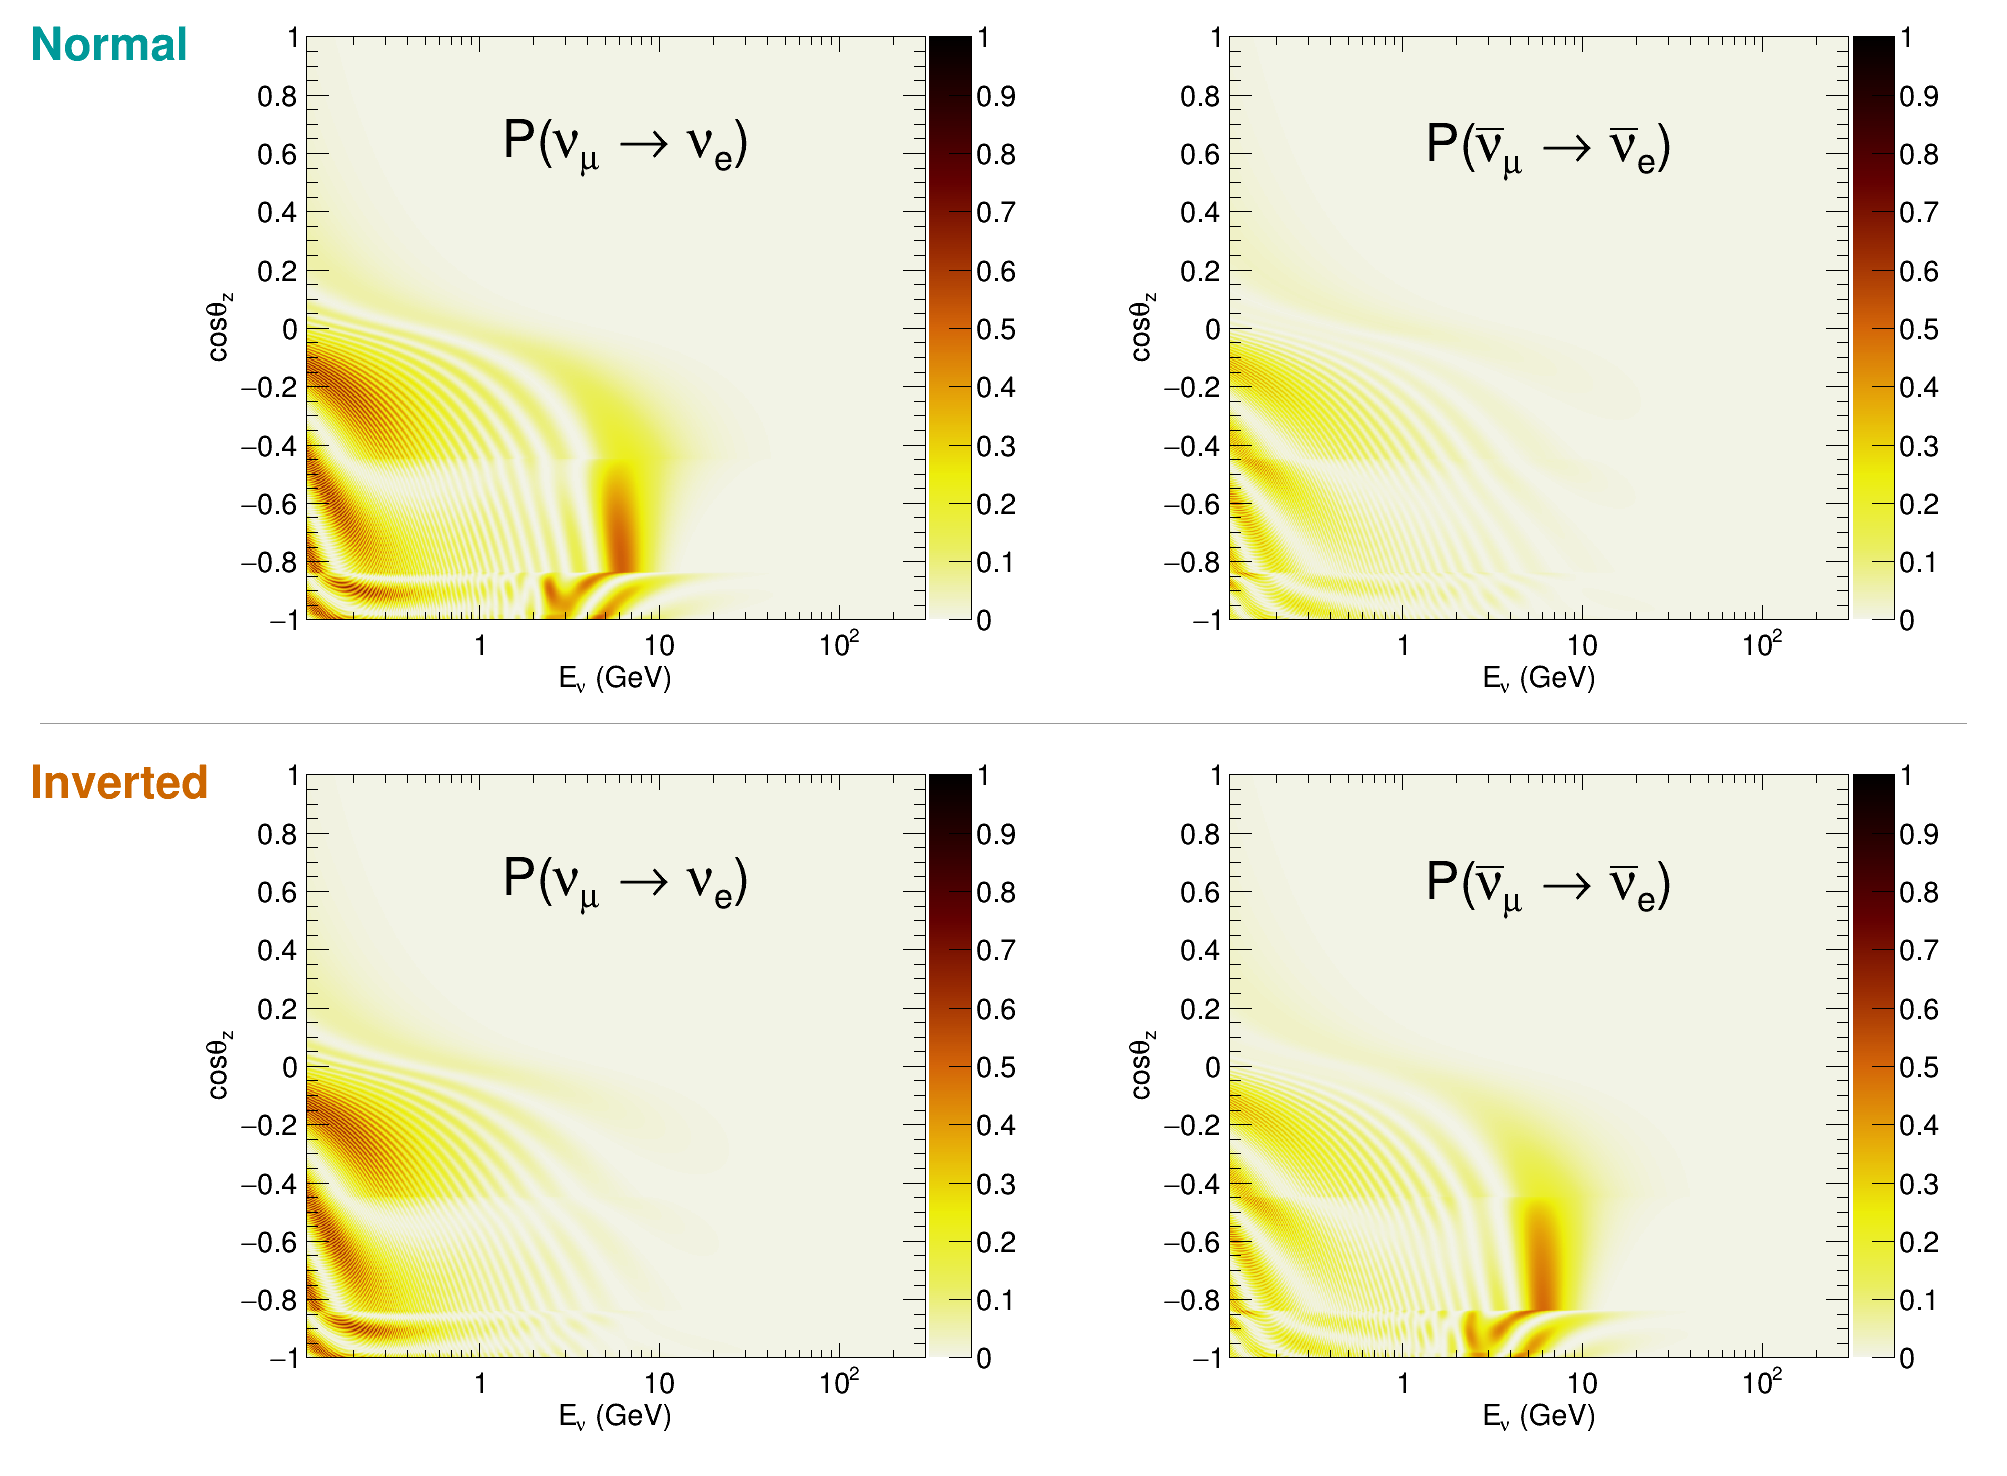
Figure 1 shows the calculated oscillation probabilities for atmospheric neutrinos as a function of the cosine of the zenith angle and the neutrino energy . The two sets of figures show the cases for muon- to electron-flavor neutrino and anti-neutrino oscillation probabilities in each mass ordering scenario, and assuming the current global average neutrino oscillation parameters [pdg2022]. The resonance in or oscillations due to matter effects is exclusively visible in the normal and inverted scenarios respectively, and occurs at baselines of several thousand kilometers and neutrino energies around a few GeV. This resonance in atmospheric neutrinos is the experimental signature of the unknown neutrino mass ordering.
In addition to mass ordering sensitivity via earth matter effects, atmospheric neutrino oscillations also provide sensitivity to other oscillation parameters. Muon-to-tau flavor conversions provide sensitivity to and . While the tau neutrinos are often too low energy to produce CC interactions, the survival probability manifests as a disappearance of upward-going muon neutrinos. Atmospheric neutrinos also provide modest sensitivity to the combined effects of and through electron neutrino or anti-neutrino appearance for neutrinos of all energies.
II The Super-Kamiokande Detector
Super-Kamiokande (SK) is a kiloton cylindrical water-Cherenkov detector located within the Kamioka mine in Gifu, Japan [skdet2003, skdetector_2014]. The detector consists of two optically separated regions: an inner detector (ID) which contains kilotons of water and is viewed by over inward-facing 20-inch photomultiplier tubes (PMTs), and a \qty2 thick outer detector (OD) with over outward-facing 8-inch PMTs for vetoing cosmic backgrounds. To increase the light collected in the OD, the OD walls are covered with reflective Tyvek, and wavelength-shifting plates are mounted to the OD PMTs.
SK has been operational since its construction in 1996, and, until July 2020, has operated with pure water. During the this period, there were five distinct data-taking phases, \setsepchar,\readlist\qargI,VSK \qarg[1], which had similar operating conditions with a few notable exceptions: At the end of the \setsepchar,\readlist\qargISK \qarg[1] phase (1996–2001), an accident222A single PMT imploded during re-filling of the detector, creating a shockwave and chain reaction, destroying additional PMTs. Acrylic covers were mounted to all the PMTs to prevent similar accidents in the future. resulted in the loss of roughly half of the experiment’s PMTs. During the \setsepchar,\readlist\qargIISK \qarg[1] phase (2002–2005), the remaining PMTs were rearranged to provide uniform but reduced (\qty19) photocoverage. New PMTs were installed to restore photocoverage to original conditions starting with the \setsepchar,\readlist\qargIIISK \qarg[1] phase (2006–2008). In 2008, the experiment’s electronics were upgraded [sk_nim_2009], marking the start of the \setsepchar,\readlist\qargIVSK \qarg[1] phase (2008–2018). The \setsepchar,\readlist\qargIVSK \qarg[1] electronics upgrade extended the window of hit times recorded following neutrino-like events which improved the efficiency for detecting decay electrons and enabled the detection of the \qty2.2\mega gamma emission following neutron captures on hydrogen [sk_ieee_2010].
During 2018, the SK detector was drained to conduct work in preparation of loading gadolinium sulfate, a compound with a high neutron capture cross section, into the detector’s water. The work comprised of installing a new water circulation system capable of continuously purifying gadolinium sulfate, sealing the welding joints of the tank walls to repair and prevent leaks, and replacing several hundred PMTs that had failed during the \setsepchar,\readlist\qargIIISK \qarg[1] and \setsepchar,\readlist\qargIVSK \qarg[1] phases. The subsequent \setsepchar,\readlist\qargVSK \qarg[1] (2019–2020) phase resumed data taking with pure water and reaffirmed the detector’s stability and performance after the refurbishment work. In July 2020, gadolinium was dissolved into the detector’s water for the first time [first_gd_loading], marking the start of the \setsepchar,\readlist\qargGdSK \qarg[1] phase. This work includes data from the pure water, \setsepchar,\readlist\qargI,VSK \qarg[1] phases only. Future analyses using data from the \setsepchar,\readlist\qargGdSK \qarg[1] phase will feature enhanced neutron tagging efficiency due to the high neutron capture cross section of the gadolinium and its subsequent \qty8\mega cascade. The operating conditions of the SK phases are summarized in Tab. 2.
| Phase | Dates | Livetime | Photo- | Neutron |
| (Days) | coverage (%) | tagging | ||
| \setsepchar,\readlist\qargISK \qarg[1] | 1996–2001 | 40 | – | |
| \setsepchar,\readlist\qargIISK \qarg[1] | 2002–2005 | 19 | – | |
| \setsepchar,\readlist\qargIIISK \qarg[1] | 2006–2008 | 40 | – | |
| \setsepchar,\readlist\qargIVSK \qarg[1] | 2008–2018 | 40 | H | |
| \setsepchar,\readlist\qargVSK \qarg[1] | 2019–2020 | 40 | H | |
| \setsepchar,\readlist\qargGdSK \qarg[1] | 2020–Present | – | 40 | H+Gd |
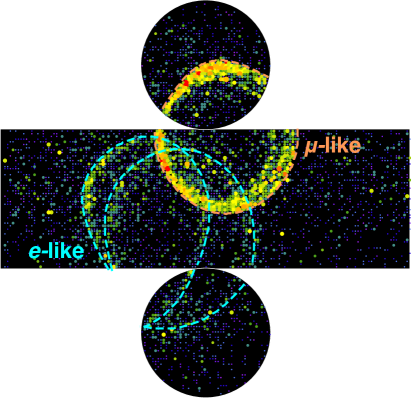
The SK detector observes Cherenkov light from charged particles with sufficient momentum produced following neutrino interactions. The light projected onto the PMT-lined walls of the detector forms ring patterns of hit PMTs. The ring patterns are reconstructed using the APFit [shiozawa_1999] algorithm: The timing information of hits establishes an event vertex, and a fit considering the spatial distribution and observed charges of hit PMTs determines the particle’s direction, momentum, and particle type. APFit separates rings into -like and -like: Electrons and photons tend to scatter and produce electromagnetic showers, resulting in many overlapping rings which appear as a single ring with blurred edges. Heavier particles such as muons and charged pions do not create showers and therefore have sharp ring edges. Higher-momentum particles produce more light, so the charge contained within the ring provides an estimate of the particle’s momentum. Figure 2 shows an example of the Cherenkov light patterns observed in SK following a neutrino candidate interaction, and their fitted properties. The event contains multiple ring patterns, each corresponding to a different particle.
In addition to Cherenkov rings, SK identifies electrons from muon decays. Decay electrons are found by scanning for time-clustered hits above background following a primary neutrino interaction trigger. A hit-time-based fitter estimates the decay electron vertex for each candidate hit cluster, and candidates are accepted if there are or more hits within a \qty50 time window. The overall decay electron tagging efficiency is estimated to be \qty96 for and \qty80 for in the \setsepchar,\readlist\qargIVSK \qarg[1] and \setsepchar,\readlist\qargVSK \qarg[1] periods. The reduced efficiency for is due to capture in the water, in which no decay electron is produced.
Neutrons in the SK detector are captured on hydrogen, producing deuterium in an excited state. The decay of the excited deuterium produces a \qty2.2\mega which results in a few time-coincident and spatially clustered PMT hits. These emissions from neutron captures are identified using a two-step process [neutron2013]: In the first step, a sliding \qty10 hit-time window finds candidate neutron captures from clusters of hits with fewer than hits in a surrounding \qty200 window. In the second step, hits within each candidate window are used to form variables which quantify the isotropy, likelihood of single-vertex origin, and the time spread of the hits. A neural network classifies candidates as either signal or background based on these variables. The average neutron tagging efficiency for neutron capture on hydrogen is \qty26 in the \setsepchar,\readlist\qargIVSK \qarg[1] and \setsepchar,\readlist\qargVSK \qarg[1] periods.
In the SK detector, the charge of particles, and therefore neutrino and anti-neutrino interactions, cannot be differentiated on an event-by-event basis. However, statistical separation is possible. For example, in the process , in which an anti-neutrino interacts with a proton , the outgoing negatively-charged pion is more likely to be captured by an nucleus before decaying than is a positively-charged pion produced in the equivalent interaction. Captured pions do not produce decay electrons, so requiring one or more decay electrons preferentially selects more neutrino than anti-neutrino events for this process. The statistical separation can be further improved by also considering the number of neutrons, which will be described in Sec. II.2.2.
II.1 Calibration
Calibration ensures an accurate and consistent response of the detector to particle interactions. Calibration studies based on the detector geometry, PMT responses, and properties of the SK water are documented in Ref. [skdetector_2014].
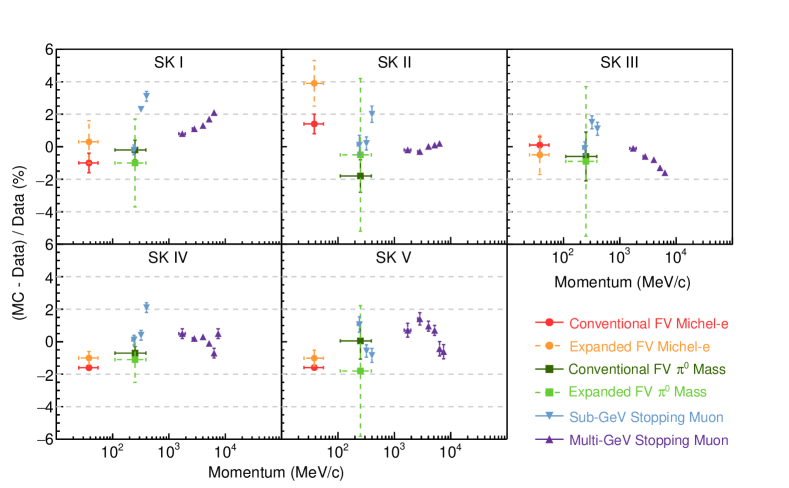
We assess APFit’s energy determination using calibration sources at multiple energies which span as much of the atmospheric neutrino energy spectrum as possible. Cosmic ray muons which stop within the detector and produce a decay electron provide a way to measure photoproduction as a function of the muon’s track length. The track length of these muons is determined by their ID entrance point and decay electron vertex. The expected momentum of each muon assuming minimum-ionization along the track length may be compared to the fitted Cherenkov ring momentum. The energy spectrum of decay electrons from these muons also provides a low-energy calibration source. We use the momenta of the two -like rings from neutral pion decay, , which add to form an invariant mass distribution of neutral pion events, as a third calibration source. Figure 3 shows the difference between data and Monte Carlo (MC) for these calibration sources during each SK phase. In this analysis, the decay electron and mass measurements were also performed separately using events with vertices greater than (conventional fiducial volume) and between \qtyrange100200 (additional fiducial volume, see Sec. II.2.4) from the detector walls.
II.2 Neutrino Sample Selection
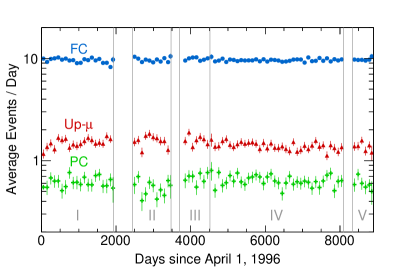
Neutrino events at SK are broadly categorized as fully-contained (FC), partially-contained (PC) or upward-going muons (Up-). FC and PC events have a reconstructed event vertex within the ID and are differentiated based on the number of hits detected in the OD: FC events have minimal OD activity, while PC events have OD activity following the primary event trigger. Up- events are neutrino interactions within the rock below the SK tank or in the OD water which produce muons travelling upward. Figure 4 shows the average number of FC, PC, and Up- events observed per day during the \setsepchar,\readlist\qargI,VSK \qarg[1] phases.
We separate neutrino candidate interactions from each category into analysis samples to enhance the different oscillation signals present in the atmospheric neutrino data. The data taken during the \setsepchar,\readlist\qargIVSK \qarg[1] and \setsepchar,\readlist\qargVSK \qarg[1] periods, days, or \qty57 of the total \setsepchar,\readlist\qargI,VSK \qarg[1] exposure, uses the observed number of neutron captures on hydrogen as an additional classification handle to enhance the purity of neutrino and anti-neutrino samples.
II.2.1 Analysis Samples
Fully contained events span the energy range of \qty100\mega to \qty100\giga and are a mixture of charged-current (CC) and neutral current (NC) neutrino interactions of all flavors. Because the normal and inverted neutrino mass ordering scenarios predict an enhancement to either the number of or events, and SK cannot distinguish the sign of neutrino interactions on an event-by-event basis, the FC sample definitions are designed to increase the statistical purity of and events.
Fully contained events with a single Cherenkov ring are first separated by the ring’s particle identification (PID) score, either -like or -like. Events are further divided based on the visible energy into sub-GeV, , and multi-GeV, . Next, events are separated by the number of decay electrons. For sub-GeV events, we use the number of decay electrons to separate events by likely interaction processes. Samples enhanced with quasi-elastic interactions are formed by requiring no decay electrons for -like events and either zero or one decay electron for -like events. Sub-GeV -like and -like events with one or more, or two or more decay electrons, respectively, are separated into additional samples enhanced in interaction processes which produce a pion below Cherenkov threshold. For multi-GeV events, the number of decay electrons, either zero, or one or more, is used to separate -like events into anti-neutrino- and neutrino-enhanced samples. Fully contained single ring events in the \setsepchar,\readlist\qargIVSK \qarg[1] and \setsepchar,\readlist\qargVSK \qarg[1] phases have been revised in this analysis to additionally incorporate the number of tagged neutrons, and are discussed in Sec. II.2.2.
Multi-ring events can contain mixtures of -like and -like rings, making the neutrino flavor ambiguous. However, multi-ring events also provide extra information which is useful for separating events from events. For multi-GeV multi-ring events, we use a boosted decision tree (BDT) to classify these events as -like, -like, -like, or “other.” The “other” sample primarily selects NC events. More details on the BDT are presented in Sec. II.2.3.
Sub-GeV multi-ring events are not included in the analysis due to their poor direction resolution and consequently minimal sensitivity to oscillation effects, with two exceptions: First, multi-ring events with where the most energetic ring is -like and has a reconstructed momentum of at least \qty600\mega\per¸ are included in the multi-ring -like sample. Second, FC NC interactions which produce a are an oscillation-insensitive background to the other samples, but are included in the analysis to constrain NC interactions. These neutral current events are identified from sub-GeV events using a dedicated fitter which assumes there are two rings present, regardless of the number of reconstructed rings. Events are classified as -like based on the likelihood that the two fitted rings originate from a decay. Events which are classified as -like are separated into two samples based on the number of reconstructed rings without the two-ring assumption, either one or two.
Partially contained events have typical energies between \qty1\giga to \qty1\tera, and are nearly all CC interactions, as the muon produced in the interaction often exits the ID. The muon momentum in PC events can only be estimated using the portion of the track within the detector. Partially contained events which exit the ID and stop within the OD, determined by comparing the amount of light in the OD to simulated PC events, are classified as stopping, while PC events that completely exit the detector are classified as through-going.
Upward-going muon events are the highest-energy events, up to , observed at SK and are classified into three samples: “stopping” if the muon stops within the ID, otherwise “showering” or “non-showering,” depending on whether or not the exiting muon’s charge deposition is consistent with radiative losses. The earth shields the Up- sample from cosmic ray backgrounds from below the horizon. However, upward-scattered muons from downward-going cosmic rays are an irreducible background near the horizon. We estimate the background rate in each Up- sample at the horizon by comparing the cosmic muon rate at the azimuthal directions with the smallest and largest mountain overburdens. The estimated number of background events is subtracted from the number of Up- data events with reconstructed directions near the horizon. The estimated Up- background rate is approximately .
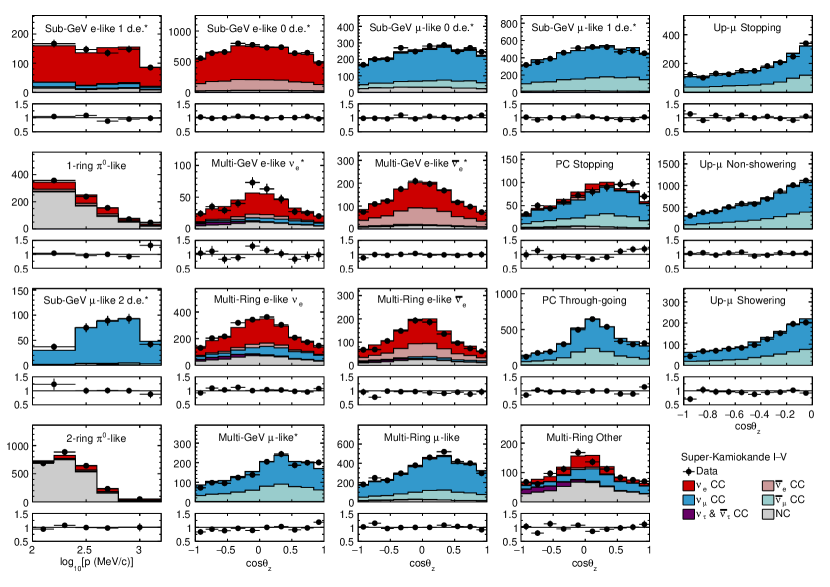
The event classification outlined in this section corresponds to distinct analysis samples. There are eight FC CC-enhanced single ring samples which are used for data collected during the \setsepchar,\readlist\qargI,IIISK \qarg[1] phases, while the remaining FC multi-ring, NC , PC, and Up- samples are used for data taken during all phases. The data and MC counts for the standard analysis samples are presented in Fig. 5 as a function of reconstructed lepton momentum or zenith angle.
II.2.2 SK IV–V Neutron-Tagged Samples
This analysis modifies the FC single-ring event selection during the \setsepchar,\readlist\qargIVSK \qarg[1] and \setsepchar,\readlist\qargVSK \qarg[1] phases based on the number of observed neutron captures on hydrogen. The modification is motivated by the greater average neutron production in anti-neutrino interactions relative to neutrino interactions: Additional neutrons are expected in anti-neutrino events from proton-to-neutron () conversions in CC processes, , where denotes lepton flavor, and also in both CC and NC deep inelastic scattering (DIS) processes due to the larger fraction of energy transferred to the recoiling hadronic system. We incorporated neutron information into the analysis sample definitions to create 10 additional samples, five for sub-GeV events and five for multi-GeV events, as follows:
-
•
FC single-ring -like: Both sub-GeV and multi-GeV events are divided into three samples: Events with one or more decay electron and any number of neutrons are classified as -like. Events with no decay electrons are considered -like, and are further separated into two samples based on whether or not there is at least one tagged neutron.
-
•
FC single-ring -like: Both sub-GeV and multi-GeV events are divided into two sub-samples: Events with exactly one decay electron and one or more tagged neutrons are considered -like, otherwise they are considered -like.
| Sample | Energy bins | bins | MC purity | Events | ||||||
| CC | CC | CC | CC | CC | NC | MC | Data | |||
| Fully contained (FC), single ring, Sub-GeV | ||||||||||
| SK I-III | ||||||||||
| -like | ||||||||||
| 0 decay- | momentum | in | ||||||||
| 1 decay- | momentum | single bin | ||||||||
| -like | ||||||||||
| 0 decay- | momentum | in | ||||||||
| 1 decay- | momentum | in | ||||||||
| 2 decay- | momentum | single bin | ||||||||
| SK IV-V | ||||||||||
| -like | momentum | in | ||||||||
| -like 0 | momentum | in | ||||||||
| -like 1 | momentum | in | ||||||||
| -like | momentum | in | ||||||||
| -like | momentum | in | ||||||||
| Fully contained (FC), single ring, Multi-GeV | ||||||||||
| SK I-III | ||||||||||
| -like | momentum | in | ||||||||
| -like | momentum | in | ||||||||
| -like | momentum | in | ||||||||
| SK IV-V | ||||||||||
| -like | momentum | in | ||||||||
| -like 0 | momentum | in | ||||||||
| -like 1 | momentum | in | ||||||||
| -like | momentum | in | ||||||||
| -like | momentum | in | ||||||||
| SK I-V common samples | ||||||||||
| Fully contained (FC) Sub-GeV NC -like | ||||||||||
| Single-ring | momentum | single bin | ||||||||
| Two-ring | momentum | single bin | ||||||||
| Fully contained (FC) Multi-GeV, multi-ring | ||||||||||
| -like | 3 visible energy | in | ||||||||
| -like | 3 visible energy | in | ||||||||
| -like | 4 visible energy | in | ||||||||
| Other | 4 visible energy | in | ||||||||
| Partially-contained (PC) | ||||||||||
| Stopping | 2 visible energy | in | ||||||||
| Through-going | 4 visible energy | in | ||||||||
| Upward-going muons (Up-) | ||||||||||
| Stopping | 3 visible energy | in | 1753.8 | |||||||
| Non-showering | single bin | in | 6423.9 | |||||||
| Showering | single bin | in | 1110.6 | |||||||
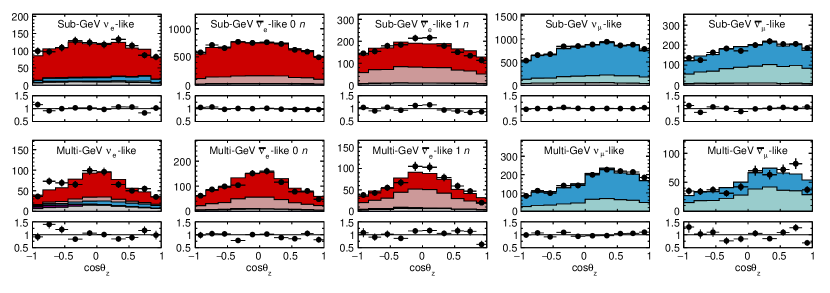
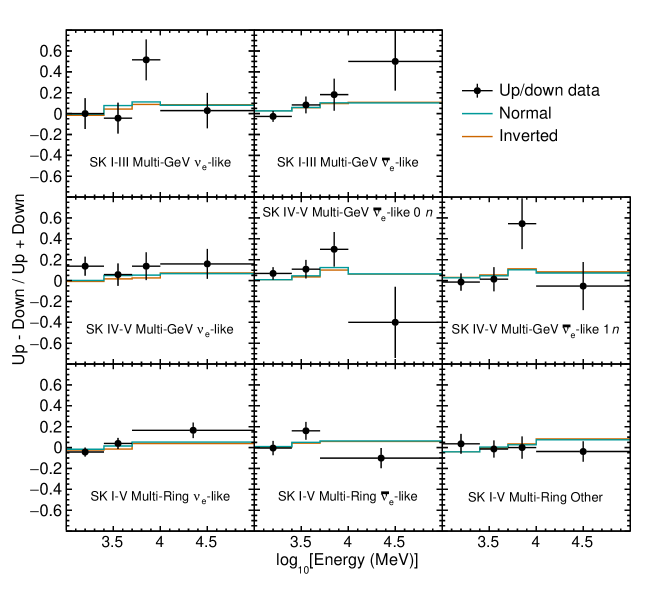
More details about the neutron tagging algorithm and the event selection modifications may be found in Refs. [neutron2013, pablo_2017]. Figure 6 shows the data and MC comparisons for the \setsepchar,\readlist\qargIV-VSK \qarg[1] neutron tagged samples. Compared to the equivalent anti-neutrino samples shown in Fig. 5, the \setsepchar,\readlist\qargIV,VSK \qarg[1] samples requiring at least one tagged neutron have a higher purity of true MC events, summarized in Tab. 3.
II.2.3 Multi-Ring Boosted Decision Tree
A previous version of this analysis [wendell_2010] classified multi-ring events into -like or -like using a likelihood function based on seven input variables: the number of rings, the number of decay electrons, a continuous PID variable of the most energetic ring present in the event, the fraction of energy carried by the most energetic ring, the transverse momentum of the most energetic ring, the maximum distance of any decay electrons from the event vertex, and the visible energy. The selection was performed in two steps, first to separate -like events from -like events, then to further separate -like events into -like and -like events. An additional “other” category was also present to separate NC events from CC events.
This analysis replaces the likelihood-based selection with a boosted decision tree (BDT) selection for multi-ring events, utilizing the same set of variables as in the likelihood-based classification [matsumoto_2020]. Labeled true multi-ring MC events are used to train the BDT classifier. Additionally, we optimize the BDT for sensitivity to the neutrino mass ordering by weighting these training events: Adjusting the weights of CC and training events relative to CC and “other” events changes the expected signal purities obtained from the BDT selection, which in turn affects the expected mass ordering sensitivity. We find that the optimized BDT improves the efficiency for selecting CC events while maintaining an equivalent wrong-flavor contamination rate as the likelihood selection. The increased efficiency results in a higher proportion of correctly-classified CC -like, -like, and -like multi-ring events and a decreased proportion of “other” events relative to the previous analysis.
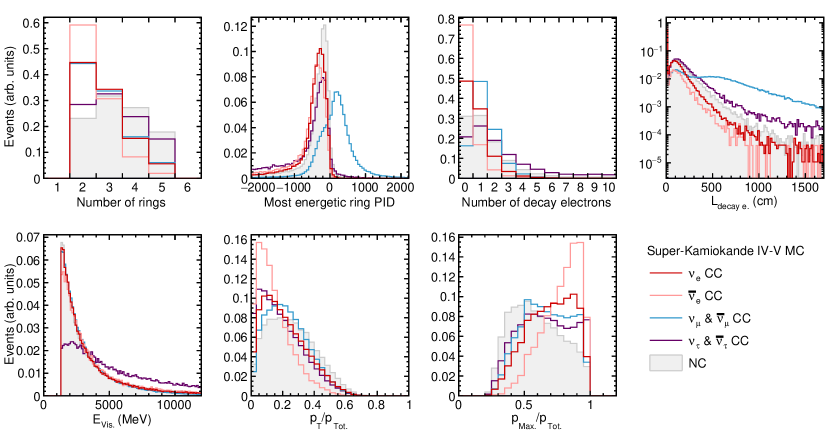
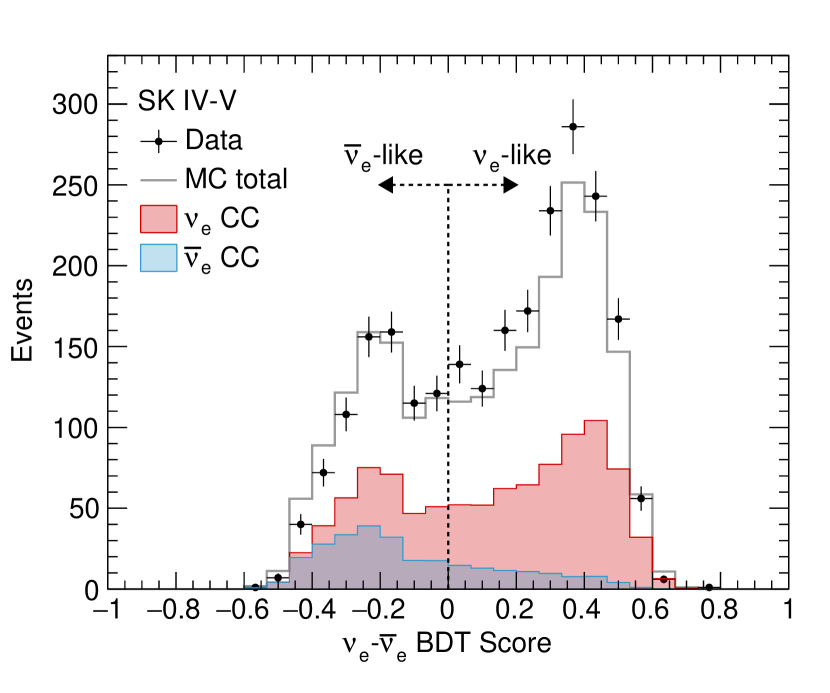
Figure 7 shows the distributions of the BDT input variables from MC events. The largest differences between electron- and muon- flavor neutrino interactions are in the PID of the most energetic ring, the number of decay electrons, and the maximum distance travelled by decay electrons, . The difference in between -like and -like events results from muons produced in CC interactions having higher momenta and traveling further on average than charged pions which are potentially produced in multi-ring interactions of any flavor. Electron neutrino and anti-neutrino interactions differ in the number of rings, and in the fractional and transverse momentum of the most energetic ring. These differences are a consequence of the different angular and momentum dependencies between neutrino and anti-neutrino cross sections. Figure 8 demonstrates the and separation performance of the BDT in the \setsepchar,\readlist\qargIV,VSK \qarg[1] phases. Neutron information from the \setsepchar,\readlist\qargIV,VSK \qarg[1] phases was also considered as an input variable to the BDT, but was found to only result in a marginal improvement to - separation while introducing a large amount of systematic uncertainty.
II.2.4 Expanded Fiducial Volume
Previous SK analyses used a kiloton fiducial volume for FC events defined by requiring the event vertex be at least \qty200 away from the ID walls (conventional fiducial volume). This analysis includes events in the kiloton region \qtyrange[range-units = single]100200 from the ID walls (additional fiducial volume) for all SK phases, representing a \qty20 increase in exposure. To include events in the additional fiducial volume region, both the reconstruction algorithms and background estimations required re-evaluation [takenaka_2020]. In 2018, the pre-tabulated expected charge distributions, which are the basis of the ring counting and PID likelihoods used in APFit, were re-computed as a function of a particle’s distance to the nearest detector wall. These new charge tables encode the reduced number of hits and increased angular dependence expected from events near the detector walls. Adopting the updated charge tables reduced the - mis-identification of single ring events in the additional region by up to \qty35.
Cosmic muons with vertices mis-reconstructed in the fiducial volume also become more prevalent closer to the detector walls. To estimate the size of these backgrounds, events in the additional fiducial volume region were eye-scanned by experts. A slightly higher background rate of \qty0.5, compared to \qty0.1 in the conventional fiducial volume, was found. The increased background rate in the additional fiducial volume is acceptable, although the background rate rises quickly for events with vertices , prohibiting further expansion.
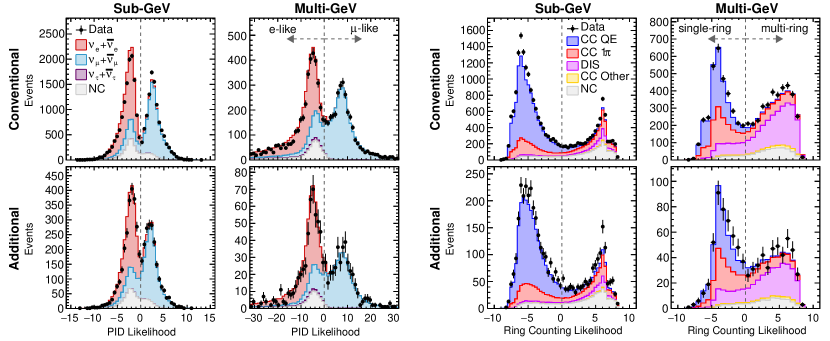
We note that Ref. [takenaka_2020] included events from the additional fiducial volume region in the context of a proton decay search which was primarily concerned with sub-GeV atmospheric neutrino backgrounds. In contrast, this oscillation analysis includes both sub-GeV and multi-GeV atmospheric neutrino events. Additional studies to those presented in Ref. [takenaka_2020] were needed to confirm the performance of the reconstruction algorithms for multi-GeV events in the additional fiducial volume region. We studied the reconstructed momentum and direction biases and resolutions using MC events, and confirmed that these quantities were similar between events in the conentional and additional fiducial volume regions. We also studied the data versus MC agreement between the ring PID and ring counting likelihoods for events in the additional fiducial volume region, as shown in Fig. 9. The figure compares the data and MC distributions for sub-GeV and multi-GeV events in both fiducial volume regions. The level of agreement in the likelihood distributions using the updated reconstruction algorithms is found to be equivalent between events in the conventional and expanded fiducial volume regions at both sub-GeV and multi-GeV energies.
This analysis is the first SK atmospheric neutrino oscillation analysis to include FC events from the additional fiducial volume region, resulting in a total fiducial volume of kiloton for all SK phases. The total exposure for FC events in this analysis is kiloton-years, a \qty48 increase over the previous published analysis.
III Simulation
We produce simulated Monte Carlo (MC) events to provide a prediction of atmospheric neutrino data. The SK MC consists of simulated neutrino interactions generated according to the flux model of Honda et al. [honda_2011] and the cross section models of the neut simulation software [neut, neut2021]. neut also propagates intermediate particles within the nuclear medium, and produces the final-state particles which exit the nucleus. These final-state particles are stepped through a geant3-based [geant_1994] simulation of the SK detector which models particle propagation in the detector water, Cherenkov radiation emission, and the detection of Cherenkov radiation by PMTs [skdetector_2014]. The SK detector simulation also implements a data-driven model of PMT electronics, dark noise, and disabled PMTs.
III.1 Neutrino Interaction Model
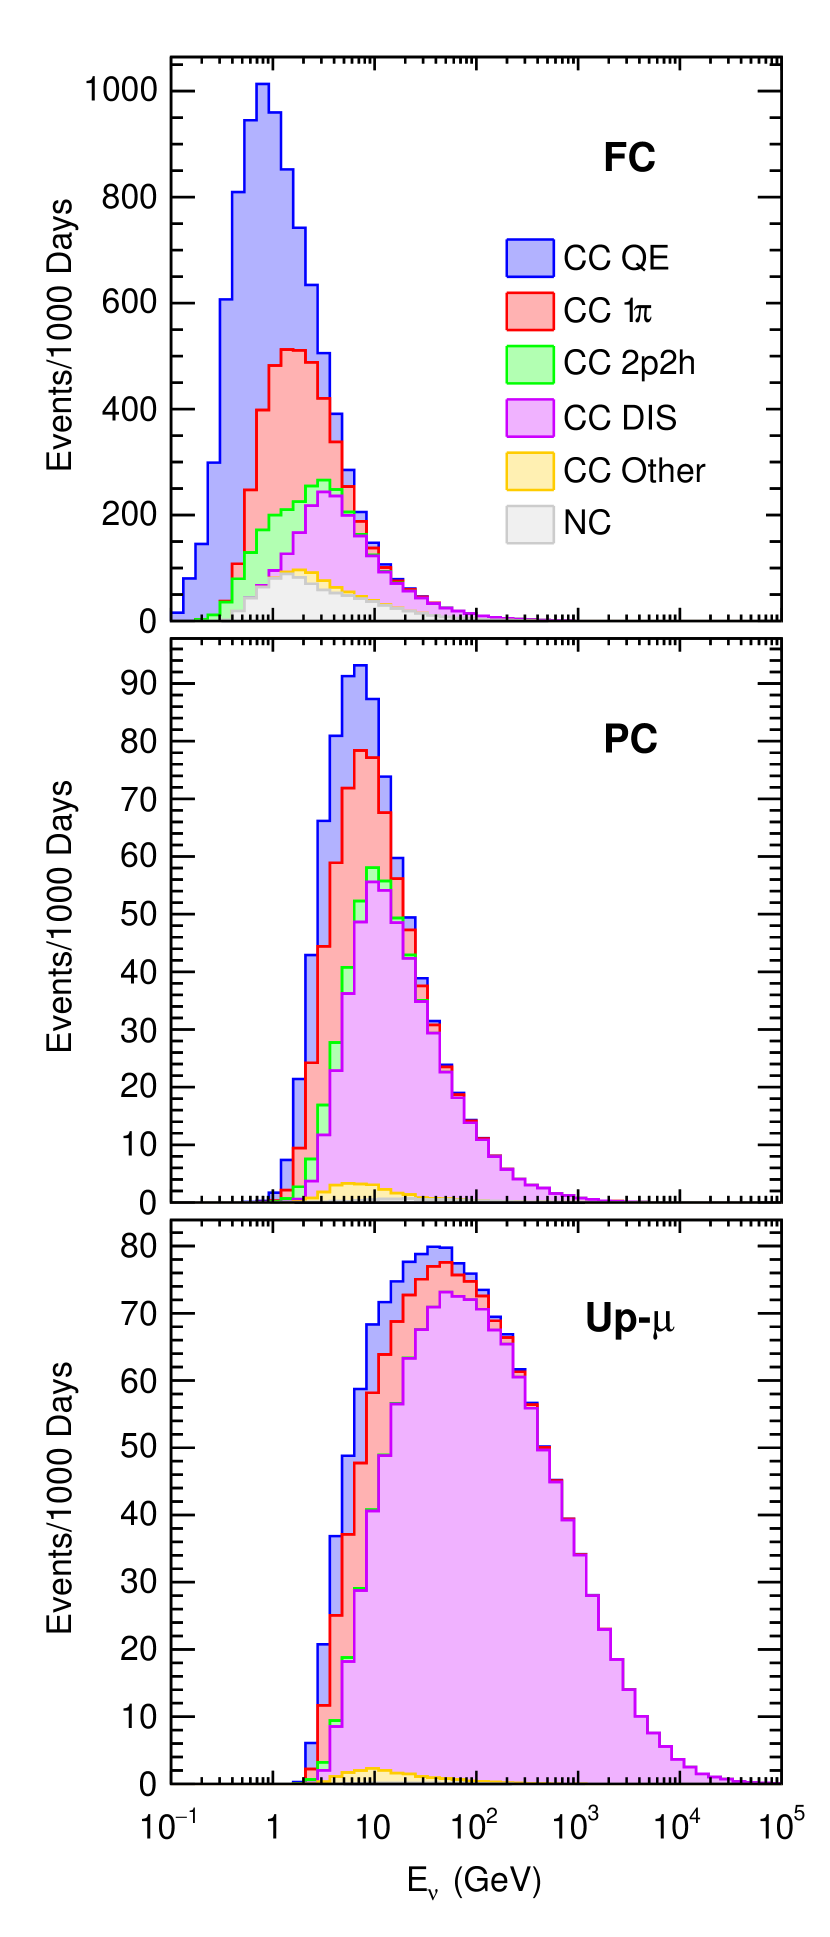
Because atmospheric neutrinos span several orders of magnitude in energy, multiple interaction processes are relevant across the different SK neutrino samples. Fully contained events, which are the lowest-energy atmospheric neutrinos in this analysis, have leading contributions from charged-current quasi-elastic (CCQE) and single-pion production processes. Partially contained and Up- events consist of higher-energy neutrinos where deep inelastic scattering (DIS) becomes dominant. The contribution to the event rate from each cross section process is shown in Fig. 10.
This analysis uses neut version 5.4.0 [neut2021] for the nominal neutrino interaction models, which is an update from version 5.3.6 used in the previous analysis. Notable changes in this version include the replacement of the nominal one-particle-one-hole (1p1h) model, responsible for the CCQE and NCQE processes, from the Smith and Moniz relativistic Fermi gas (RFG) model [smith_moniz_1972] to the local Fermi gas (LFG) model by Nieves et al. [nieves2011]. The nominal value of the axial mass parameter was decreased from \qty1.21\giga\per\̧squared to \qty1.05\giga\per\̧squared. This change results in an overall decrease of CCQE events in the nominal MC by , although the previous value is still within the uncertainty, see Sec. IV.2. The LFG model also includes a correction to the cross section at low four-momentum () transfers due to weak charge screening calculated via the random phase approximation (RPA) technique [nieves_rpa]. The BBBA05 [bbba05] vector form factors are used in the nominal 1p1h model, which is unchanged from the previous analysis.
neut implements the Rein-Sehgal resonant single-pion production model [rein_sehgal_1981], which is unchanged from the previous analysis. The coherent pion production cross section calculation, which was previously based on the Rein-Sehgal model, has been updated to use the Berger-Sehgal model [berger_sehgal_2007] for neutrino events with . This was done to improve the agreement in total cross section and angular distribution of the outgoing pion with recent scattering experiments [martins2016charged].
Deep inelastic scattering cross sections in neut are calculated using the GRV98 parton distribution functions (PDFs) [grv98], with corrections to the low- regime from Bodek & Yang [bodek_yang]. neut simulates the production of multiple hadrons using two separate models, selected based on the invariant mass of the hadronic system, . For , a custom multi-pion generator is used, while for , neut uses pythia v5.72 [pythia572]. The DIS hadron production models are only used to produce final states with multiple hadrons to avoid overlap with the single-hadron models.
Final state interactions (FSIs) are processes which modify particles exiting the nucleus due to intra-nuclear effects. Secondary interactions (SIs) are equivalent processes which occur in the detector medium instead of within the nucleus. neut implements four FSI+SI processes: quasi-elastic scattering, charge exchange, pion absorption, and hadron production. Six parameters adjust the probabilities of these processes. neut 5.4.0 updated the default values of these parameters [duet2017], which increased the pion absorption probability by \qty27, and decreased the probability of charge exchange for pions with momentum by \qty30 compared to version 5.3.6.
The cross section for the two-particle-two-hole (2p2h) process, in which no pions are produced but a pair of nucleons is ejected from the nucleus, is calculated using the Valencia model of Nieves et al. [nieves_2p2h_2013]. This is unchanged from the previous version of neut.
IV Atmospheric Neutrino Oscillation Analysis
Atmospheric neutrino data are analyzed via fit of binned MC counts to data. We bin atmospheric neutrino MC and data events using two-dimensional bins of reconstructed cosine zenith angle and momentum. The bin definitions for the samples used in this analysis are listed in Tab. 3. The zenith angle bin definitions were updated for this analysis, and are discussed in Sec. IV.1.
Systematic uncertainties are incorporated in the analysis as additional nuisance parameters which modify the nominal MC prediction in the fit. We estimate the effect of each systematic uncertainty by quantifying the change induced in each analysis bin due to and deviations from its nominal value. The systematic uncertainties considered in this analysis are described in Sec. IV.2.
IV.1 Zenith Angle Binning
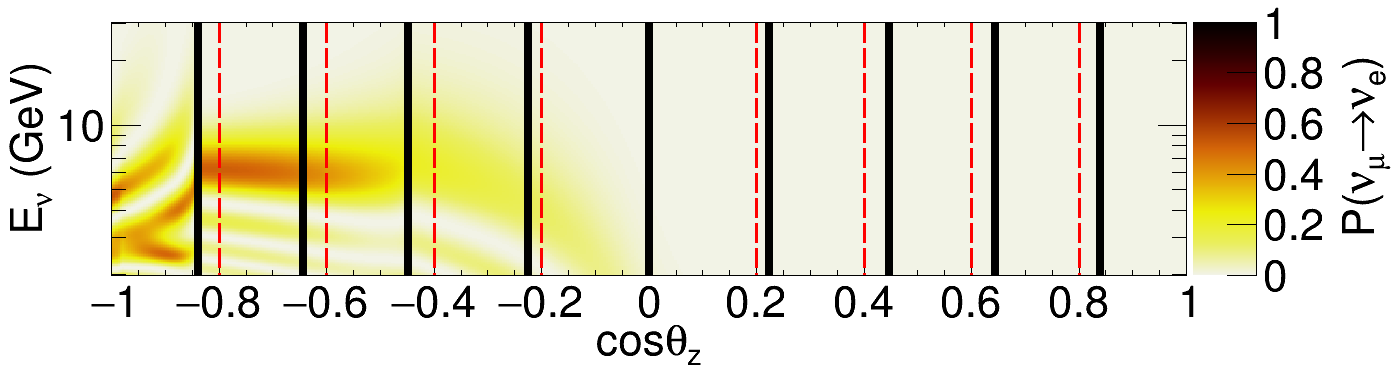
In the previous analysis, FC and PC events were binned into evenly spaced cosine zenith angle bins on the interval [-1,1]. This separated the expected oscillation resonance region across two bins, reducing the signal-to-background ratio in samples sensitive to the neutrino mass ordering. In this analysis, the zenith angle bins for FC and PC events have been updated to more precisely cover the resonance region, demonstrated in Fig. 11. The updated bins are defined by the edges , , , , , , , , , , and . With the present statistics, adopting the updated bins results in a negligible effect on the expected sensitivity of this analysis to the mass ordering. However, the updated bins reduce the ambiguity as to whether or not events in the signal region occur in the expected zenith angle range or slightly outside of it.
IV.2 Systematic Uncertainties
The analysis includes independent systematic uncertainty sources: describe atmospheric neutrino flux and cross section effects common to all phases, and the remaining describe reconstruction efficiencies which are separately estimated for each data taking phase. Additional details on the formulation of the systematic uncertainties may be found in Ref. [twester_2023].
IV.2.1 Flux and Cross Section Uncertainties
The atmospheric neutrino flux uncertainties in this analysis are unchanged from the previous analysis [sk_atm_2018]. Two energy-dependent uncertainties scale the normalization of the flux above and below \qty1\giga. Additionally, there are three energy-dependent uncertainties which modify the ratios of muon-to-electron, electron-to-anti-electron, and muon-to-anti-muon flavor neutrinos present in the atmospheric neutrino flux. An uncertainty based on the ratio of the Honda flux calculation with a modified kaon-to-pion ratio over the nominal model is also included [honda_2007].
The effects of uncertainties on parameters in the CCQE and single-pion cross section models are computed by re-weighting MC events by the ratio of the double-differential cross section after and changes in each parameter. For CCQE events, is taken to be . There are three parameters which control the single pion production cross section in the Rein-Sehgal model: the axial mass, , the axial form factor coefficient, , and the isospin- background contribution scaling parameter, .
In addition to the uncertainty, we place additional uncertainty on CCQE events due to differences between the LFG and RFG models. There are five uncertainties where the effect is computed by forming ratios between the predictions of the two models: the absolute event rate (both sub-GeV and multi-GeV), the shape of the dependence, and in the ratios of and . These uncertainties are computed as a function of neutrino energy. The uncertainty on the 2p2h contribution to CCQE interactions is set to \qty100, due to a lack of direct measurements, and is unchanged from the previous analysis.
An uncertainty on FSIs and SIs is implemented by re-computing the final states for MC events using multiple sets of the six neut FSI parameters. Each set consists of variations of one or more FSI parameters by their uncertainties as determined by a fit to external pion scattering from Ref. [t2k_2015]. The set which produces the largest change in classification outcome is taken as a conservative estimate of the FSI+SI uncertainty.
Two neutron-related systematic uncertainties are included in this analysis to account for the dependence on neutron production models in the neutron-based event selection used for \setsepchar,\readlist\qargIVSK \qarg[1] and \setsepchar,\readlist\qargVSK \qarg[1] data. Variations in these systematic uncertainties move events between samples with no tagged neutrons and samples with one or more tagged neutrons. The largest of the two uncertainties originates from measurements of neutron production as a function of transverse momentum by T2K [akutsu_2020]. An additional neutron-related systematic uncertainty accounts for differences in neutron multiplicity predicted by the different neutrino interaction generators neut and genie [Andreopoulos:2009rq].
In addition to model parameter uncertainties, we assign a \qty20 uncertainty on the ratio of NC to CC events and a \qty25 uncertainty on the tau neutrino CC cross section [sk_tau_2013]. The tau neutrino cross section uncertainty was estimated from a comparison between neut and the cross section model of Hagiwara et al. [hagiwara_2003].
IV.2.2 Reconstruction Uncertainties
Ring reconstruction systematic uncertainties include efficiencies of ring-based particle identification (PID), ring counting, and identification of decays. The estimation of these systematic uncertainties is unchanged from the previous analysis, and is performed using a “scale-and-shift” procedure: First, MC events are labeled as either signal or background, where the particular label differs for each systematic uncertainty source. For example, the ring counting systematic uncertainty estimation considers events with a single charged particle with true momentum sufficient to produce a Cherenkov ring as signal, and events with multiple particles capable of producing rings as background. Similarly, the PID uncertainty estimation considers true -like events as signal and true -like events as background. Once labeled, the signal and background distributions of each reconstruction quantity, , e.g., the ring-counting or PID likelihoods, are scaled and shifted by a linear function, , and fit to a subset of atmospheric neutrino data. The signal and background distributions have independent parameters. The fitted parameters are then fluctuated according to their fitted uncertainties to generate toy data sets with random amounts of signal and background events. The maximum fractional change in signal purity observed in the toy data sets is taken as a conservative estimate of the uncertainty.
The scale-and-shift procedure is used to separately evaluate ring-related systematic uncertainties for events in the conventional and additional fiducial volume regions during each data-taking phase. The ring counting and PID systematic uncertainties are separately computed for each combination of -like and -like, and sub-GeV and multi-GeV events. As in the previous analysis, the scale-and-shift procedure is used to place an additional uncertainty on the normalization of contamination present in the -like samples, estimated from the fitted fraction of events classified as -like. We also use the scale-and-shift procedure to estimate the uncertainty associated with the multi-ring BDT: Two sources of systematic uncertainty are considered for multi-ring events based on the data-MC agreement in the input distributions used to train the BDT, and in the output BDT scores themselves. The changes in the event rate in each multi-ring sample obtained through fluctuating the input and output distributions according to their fitted uncertainty are taken as the effects.
As in the previous analysis, this analysis takes the maximum data-MC disagreement between the decay electron, mass, and stopping muon calibration sources during each SK phase, shown in Fig. 3, as an estimate of the overall energy scale uncertainty. Variations in this uncertainty increase or decrease the reconstructed momenta of all MC events, causing these events to move between momentum bins. The energy scale uncertainty was newly estimated for the \setsepchar,\readlist\qargVSK \qarg[1] phase and is \qty1.8 in the conventional fiducial volume and \qty2.0 in the additional fiducial volume.
This analysis introduces a systematic uncertainty for the neutron tagging efficiency and false detection rate during the \setsepchar,\readlist\qargIVSK \qarg[1] and \setsepchar,\readlist\qargVSK \qarg[1] phases, which is factored into two components: detector conditions, and neutron travel distance. The contribution to the uncertainty due to detector conditions was estimated from comparisons between data from an AmBe source [first_ntag_2009] and MC events generated with variations in PMT gain, PMT dark rate, and water transparency within the ranges observed during the \setsepchar,\readlist\qargIV,VSK \qarg[1] phases. The neutron travel distance contribution to the uncertainty was estimated from an atmospheric neutrino data-MC comparison of the distance between the primary neutrino event vertex and reconstructed neutron capture vertex, convolved with the estimated capture efficiency as a function of the distance. The quadrature sum of these effects sets the overall neutron tagging uncertainty. Similarly to the neutron production uncertainties, variations in the tagging efficiency uncertainty move events between samples requiring no tagged neutrons and samples requiring one or more tagged neutron.
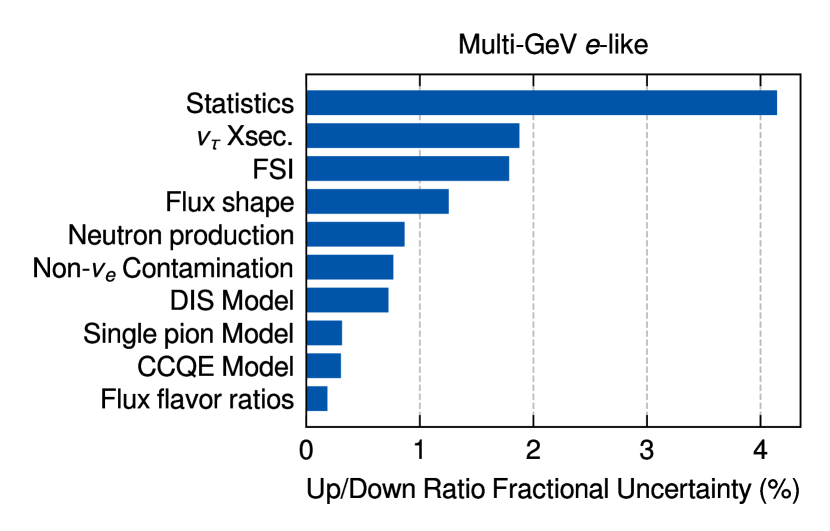
The systematic uncertainties with the largest effect on the analysis’ sensitivity to the neutrino mass ordering are those which can change the ratio of upward-going, , versus downward-going, , events in the multi-GeV -like samples. This is because the mass ordering signal region occurs in the upward-going bins of these samples, and downward-going neutrino events act as an un-oscillated data set which constrains uncertainties without zenith angle dependence independent of oscillation effects. Figure 12 shows the estimated largest sources of uncertainty which affect the ratio of upward-versus-downward going events in the multi-GeV -like samples. The largest source of uncertainty is statistics, indicating the mass ordering sensitivity is statistics-limited. The cross section uncertainty is the next-largest: Tau neutrino interactions at SK are almost exclusively upward-going since they are the result of oscillations, so there are no downward-going tau neutrino events to constrain the cross section uncertainty. Additionally, tau neutrino interactions tend to be reconstructed as multi-GeV, multi-ring -like events, which places them in the mass ordering signal region [li2018]. In contrast, uncertainties on the overall flux and cross section normalizations are less important for the mass ordering analysis, since these modify the predicted number of events independent of zenith angle.
IV.3 Fitting Method
This work presents two fits of atmospheric neutrino data: First, we perform an “atmospheric-only” fit which measures , , , , and the neutrino mass ordering using the SK atmospheric neutrino data with no external constraints. Next, we analyze the same data including a constraint on from reactor neutrino experiments.
In both fits, we evaluate data-MC agreement by computing a statistic at each point on a fixed grid of neutrino oscillation parameters, defined for each fit in Tab. 4. Oscillation probabilities are applied to the MC events using the oscillation parameters at each point in the grid, and systematic uncertainty nuisance parameters are fit to determine the lowest value. The best-fit neutrino oscillation parameters are taken to be the grid point with the lowest value.
| Parameter | Min. | Max. | Points |
| SK, Atmospheric Only | |||
| 0.3 | 0.775 | 20 | |
| (\qtye-3\squared) | 1.2 | 3.6 | 25 |
| (rad) | 21 | ||
| 0 | 0.075 | 16 | |
| SK, Constrained | |||
| 0.3 | 0.7 | 35 | |
| (\qtye-3\squared) | 1.0 | 4.9 | 40 |
| (rad) | 37 | ||
| 1 | |||
The statistic is computed via a summation over bins assuming Poisson statistics, and with systematic uncertainty pull terms, , which have units of . Each scales the effect of the systematic uncertainty, and is included in the calculation as an additional penalty term:
| (10) |
In Eq. (10), indexes each bin and are the observed counts in the bin. The expected counts are calculated from a nominal MC prediction scaled by the effect of systematic uncertainties. The effect of the systematic uncertainty is calculated as times the fractional change induced in the bin by a change, :
| (11) |
The constraint at the minimum value yields a system of equations which may be solved to find the configuration of s that produce the smallest for a given MC prediction.
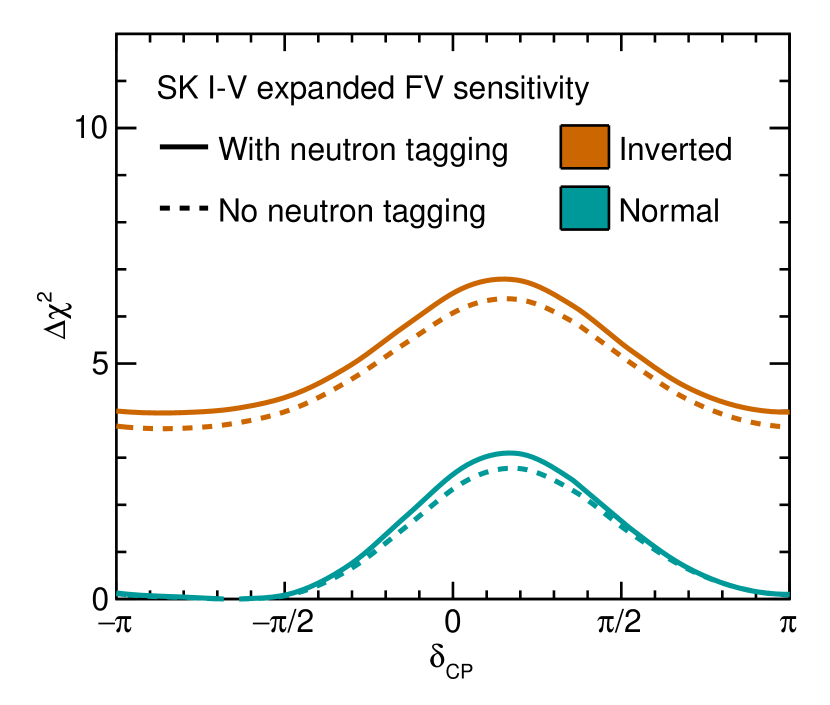
IV.4 Mass Ordering Sensitivity with Neutron Tagging
We studied the impact of using neutron captures on hydrogen with a tagging efficiency of \qty26 on the sensitivity to the mass ordering. As discussed in Sec. II.2.2, tagged neutrons provide an additional handle during event reconstruction which improves the statistical separation of neutrinos and anti-neutrinos in SK versus only considering the number of decay electrons. This corresponds to an increased purity of correct-sign and events in samples where sensitivity to the the mass ordering is expected. The increased purity can be seen by comparing the FC multi-GeV single ring -like samples listed in Tab. 3: The \setsepchar,\readlist\qargI,IIISK \qarg[1] multi-GeV -like sample requiring no decay electron has a MC purity of \qty34 true CC interactions, while the \setsepchar,\readlist\qargIV,VSK \qarg[1] multi-GeV -like sample requiring no decay electrons and one tagged neutron has a MC purity of \qty46 true CC interactions.