Hydrogen diffusion in the lower mantle revealed by machine learning potentials
Abstract
Hydrogen may be incorporated into nominally anhydrous minerals including bridgmanite and post-perovskite as defects, making the Earth’s deep mantle a potentially significant water reservoir. The diffusion of hydrogen and its contribution to the electrical conductivity in the lower mantle are rarely explored and remain largely unconstrained. Here we calculate hydrogen diffusivity in hydrous bridgmanite and post-perovskite, using molecular dynamics simulations driven by machine learning potentials of ab initio quality. Our findings reveal that hydrogen diffusivity significantly increases with increasing temperature and decreasing pressure, and is considerably sensitive to hydrogen incorporation mechanism. Among the four defect mechanisms examined, (Mg + 2H)Si and (Al + H)Si show similar patterns and yield the highest hydrogen diffusivity. Hydrogen diffusion is generally faster in post-perovskite than in bridgmanite, and these two phases exhibit distinct diffusion anisotropies. Overall, hydrogen diffusion is slow on geological time scales and may result in heterogeneous water distribution in the lower mantle. Additionally, the proton conductivity of bridgmanite for (Mg + 2H)Si and (Al + H)Si defects aligns with the same order of magnitude of lower mantle conductivity, suggesting that the water distribution in the lower mantle may be inferred by examining the heterogeneity of electrical conductivity.
keywords:
Hydrogen diffusion , bridgmanite , post-perovskite , molecular dynamics simulations , machine learning[inst1]organization=Department of Geosciences, addressline=Princeton University, city=Princeton, postcode=08544, state=NJ, country=USA.
1 Introduction
Water is widely present in the Earth’s deep interior (Ohtani, 2021), and affects the physical and chemical properties of the Earth’s materials, including rheology (Karato et al., 1986), seismic wave velocities (Karato, 1995), phase transitions (Ohtani and Litasov, 2006), and electrical conductivity (Karato, 1990). Therefore, investigating the behavior of hydrogen in mantle phases is important for understanding the dynamics and evolution of the Earth. Bridgmanite (Brg) is believed to be the dominant phase in the Earth’s lower mantle and may transform into post-perovskite (pPv) at the lowermost mantle conditions (Murakami et al., 2004). Water or hydrogen can be incorporated into bridgmanite and post-perovskite as defects (Fu et al., 2019; Townsend et al., 2016), potentially forming volatile-rich reservoirs in the lower mantle (Hallis et al., 2015). The water storage capacity in the lower mantle is still under debate. Experimental estimates of water solubility in the bridgmanite span a wide range from less than 10 ppm (nearly dry, Bolfan-Casanova et al., 2003) to 0.4 wt% (relatively wet, Murakami et al., 2002) and values in between (Litasov et al., 2003). Owing to its light atomic weight, hydrogen may be highly mobile and characterized with large diffusivity. The possible incorporation of hydrogen into bridgmanite and post-perovskite and its presumably large diffusivity may affect the geophysical and geochemical properties of the deep mantle, including electrical conductivity.
Electrical conductivity of the Earth’s lower mantle exhibits significant variations both radially and laterally revealed by geomagnetic observations (e.g., Olsen, 1999b; Verhoeven et al., 2021; Tarits and Mandea, 2010; Khan et al., 2011). Yet, the source of these heterogeneities remains enigmatic. The electrical conductivity of the lower mantle is sensitive to the presence of a trace amount of hydrogen due to its high mobility (Karato, 1990). Consequently, the heterogeneous electrical conductivity may be caused by the heterogeneous distribution of water (Hae et al., 2006; Ohtani, 2021; Sun et al., 2015; Zhou et al., 2022). Assessing this hypothesis requires a thorough understanding of hydrogen diffusivity in bridgmanite and post-perovskite, as both the distribution of water in the lower mantle and hydrogen’s contribution to electrical conductivity are governed by the diffusion of hydrogen. However, neither theoretical nor experimental data of hydrogen diffusivity in bridgmanite or post-perovskite are currently available.
In this study, we perform molecular dynamics (MD) simulations driven by machine learning potentials to investigate the hydrogen diffusion in bridgmanite and post-perovskite. Calculating diffusivity using ab initio molecular dynamics (AIMD) simulations is straightforward and well-developed, with no ad hoc diffusion pathway assumed. Deriving a statistically robust result, however, is very costly, especially when the diffusion of atoms is sluggish (e.g., Caracas and Panero, 2017). Moreover, a system composed of thousands of atoms or even tens of thousands of atoms is required to simulate bridgmanite and post-perovskite with realistic water contents of less than thousands of ppm, which exceeds the capacity of ab initio methods.
Machine learning potentials (MLPs) are an emerging method allowing to simulating large systems and long trajectories with high efficiency while maintaining ab initio accuracy (Zhang et al., 2018). MLPs have recently proven successful in accurately capturing various crystal defect properties, including their kinetics (Freitas and Cao, 2022). Our MLP for water-bearing bridgmanite and post-perovskite is developed by training an artificial neural network model with the ab initio data, following the protocol described in Deng et al. (2023). The long trajectories and large systems made possible by the MLP facilitate a detailed examination of hydrogen diffusion under wide pressure, temperature, and compositional conditions. The results inform the distribution of water in the lower mantle and the contributions of hydrogen to the electrical conductivity of bridgmanite and post-perovskite, which are further compared against geophysical observations.
2 Methods
2.1 Building a Machine Learning Potential
We adopt the DeePMD approach (Wang et al., 2018; Zhang et al., 2018) to build an MLP from ab initio data. In this approach, the total potential energy is written as the sum of the energy of each atom, , where is the total number of atoms, is the contribution to the total energy from atom i, and is a descriptor representing the local atomic environment and is a function of the coordinates of the atoms in the vicinity of atom .
In this study, the descriptor is parameterized using an embedding network with three hidden layers of 25, 50, and 100 nodes, and the form of the potential energy surface is determined using a three-layer fitting network with 240 nodes in each layer. The atomic local surroundings are described with a cutoff radius of 6 Å. The loss function is defined as
| (1) |
where , , are tunable prefactors for the difference between the MLP prediction and training data. Here is the energy per atom, is the atomic force of atom , is the Virial tensor divided by , and is the number of atoms. We follow Deng et al. (2023) to increase both and from 0.02 to 1 while decreasing from 1000 to 1 over the course of training.
Our MLP is built upon an earlier version for pure MgSiO3 (Deng et al., 2023). This new MLP targets at a wider compositional space, covering not only pure MgSiO3, but also pure H2O, pure H2 (liquid only), and intermediate compositions with bulk compositions of , and of , where or 32, to 9, to 18. In addition, we explicitly consider the intermediate composition obtained by charge-coupled cation substitution, i.e., , where , , corresponding to (2H)Mg; , where , , corresponding to (4H)Si; , where , , corresponding to (Mg + 2H)Si.
For all compositions, we employ an iterative training scheme proposed by Deng et al. (2023) to ensure that the potential energy surface is sufficiently sampled. This scheme mainly entails enhanced sampling using LAMMPS (Plimpton, 1995) interfaced with PLUMED 2 (Tribello et al., 2014), principal component analysis on the MD trajectories with the farthest point sampling technique (Cheng et al., 2020; Imbalzano et al., 2018), recalculation with DFT at higher accuracy for selected frames, and refining the MLP with recalculated new frames. The iterative training scheme ensures that the training set is succinct and balanced. Indeed, the size of the final training set is very small, consisting of only 9095 configurations, while covering a wide range of temperature and pressure (1000–8000 K and 0–220 GPa), compared to typically tens of thousands of frames for mono-atomic species over much narrower ranges of pressure and temperature conditions (Niu et al., 2020; Yang et al., 2021). The electronic temperatures are taken into account during both the DFT calculation and the MLP training processes. To mitigate edge effects during machine learning, we deliberately encompass a pressure range significantly exceeding the highest pressure found in Earth’s mantle. This approach ensures robustness. For instance, when the input data covers solely the 0–140 GPa pressure range, the MLP’s performance might be compromised, particularly at the core-mantle boundary conditions. We note that our training set includes a significant number of frames that sample various defects and interfaces, thanks to the multithermal-multibaric technique used (Deng et al., 2023; Piaggi and Parrinello, 2019). As such, though not the focus of this study, our MLP can also be useful for studying the phase transition of the (hydrous) system.
2.2 ab initio Molecular Dynamics Simulations
To train the MLP, we perform AIMD simulations on pure and hydrous , as well as pure H2 and based on density functional theory (DFT) under periodic boundary conditions. We adopt the PBEsol approximation (Perdew et al., 2008) using VASP (Kresse and Furthmuller, 1996) with the projector augmented wave (PAW) method (Kresse and Joubert, 1999). The physical properties of silicates and oxides calculated using the PBEsol approximation are consistent with experimental data (Deng and Stixrude, 2021a; Scipioni et al., 2017). The core radii of O (2s22p4), Si (3s23p2), Mg (2p63s2), and H (1s1) are 0.820 Å, 1.312 Å, 1.058 Å, and 0.370 Å, respectively. AIMD simulations are performed in the NVT ensemble with a fixed number of atoms, volume, and temperature, controlled by the Nosé-Hoover thermostat (Hoover, 1985). Our AIMD simulations run for 5–20 ps with a time step of 1 fs. The Mermin functional is used to presume that ions and electrons reach thermal equilibrium (Mermin, 1965). For the initial dataset, we employ a 500-eV energy cutoff for AIMD simulations and sample the Brillouin zone at the point. The energy, force, and stress of selected configurations for building the MLP are recalculated at higher precision with the following changes. The energy cutoff is increased from 500 eV to 800 eV, the precision for finding the self-consistent solution to the Kohn-Sham equations is increased from 10-4 eV to 10-6 eV, and sampling of the Brillouin zone is increased from the point only to a Monkhorst-Pack mesh. We emphasize that this high-accuracy recalculation is crucial for enhancing the precision and scope of the MLP (Deng and Stixrude, 2021b).
2.3 Molecular Dynamics Simulations Driven by Machine Learning Potentials
Hydrogen may be incorporated into nominally anhydrous minerals as Si or Mg vacancies through charge-coupled substitution mechanisms. We introduce hydrogen defects by substituting Mg and Si with H while maintaining charge balance. For the MgSiO3 system, we explore three representative hydrogen incorporation mechanisms: (2H)Mg, (4H)Si, and (Mg + 2H)Si, where the subscript indicates the lattice site of the defect, and inside the parentheses are atoms after substitution. These defects are also found in other mantle silicates such as wadsleyite and ringwoodite (Kudoh and Inoue, 1999; Panero et al., 2013). Muir and Brodholt (2018) presents evidence that water is preferentially incorporated into bridgmanite as (Al + H)Si due to its high configurational entropy. It’s worth noting that this defect shares some commonalities with the (Mg + 2H)Si: both have a cation carrying a positive charge but less than that of Si, and achieves charge balance by supplementing protons. Given the possibility of (Al + H)Si being an energy-favorable defect, we employed ab initio calculations combined with the machine learning force field (MLFF) method using VASP to simulate the Al-bearing bridgmanite with (Al + H)Si defects. We observed that (Al + H)Si and (Mg + 2H)Si exhibit remarkably similar hydrogen diffusion patterns, with closely matching hydrogen diffusion coefficients. Our detailed methods for (Al + H)Si are presented in the Supplementary Material. Owing to the similarity in hydrogen diffusion between (Al + H)Si and (Mg + 2H)Si, we propose that they can be treated analogously, and the following discussions about (Mg + 2H)Si might well apply to (Al + H)Si too.
We consider a range of supercells for bridgmanite and post-perovskite, containing 80 ( for Pbnm bridgmanite and for Cmcm post-perovskite) to 81,920 ( for Pbnm bridgmanite and for Cmcm post-perovskite) atoms. The largest supercell considered enables constructing systems with water content as low as 175 ppm. The distribution of water in the supercell is initially uniform, i.e., all defects are evenly distributed in the supercell, except for the data in \figrefanisotropy, where the defect sites are randomly selected. We carefully study the relative stability of different configurations with random defect distributions and their impact on the hydrogen diffusion coefficient, concluding that the influence of defect distribution on bulk diffusivity is minimal, but it slightly affects the anisotropy of diffusion. The computational details are provided in the Supplementary Material.
MD simulations are performed using LAMMPS (Plimpton, 1995) and DeePMD-kit (Wang et al., 2018) under periodic boundary conditions. For each defect mechanism, we consider three representative temperatures (2000, 3000, and 4000 K) and three pressures (25, 75, and 140 GPa), covering the P/T conditions of the entire lower mantle. Additionally, we conduct simulations along an adiabatic geotherm (Katsura et al., 2010), ranging from 700 km to 2900 km in depth. Detailed simulation setups can be found in Table S1 and Table S2. Initially, we relax systems under an NPT ensemble for 25 ps at target temperatures and pressures. The resulting configurations are then used for simulations under an NVT ensemble employing the Nosé-Hoover thermostat (Hoover, 1985), generating 1-ns trajectories from which hydrogen diffusivity is derived. The timestep of all simulations is 0.5 fs.
2.4 Hydrogen diffusion coefficient and proton conductivity
Hydrogen diffusivity, is derived as the slope of mean square displacement (MSD) by,
| (2) |
where is the particle trajectories continuous in Cartesian space, and represents an average over all hydrogen atoms and over time with different origins (Karki, 2015). Only when MSD is a linear function of time do we intercept the segment of MSD and calculate the diffusion coefficient by linear fitting (Fig. S1). The diffusion coefficient as a function of temperature may be fitted by Arrhenius equation,
| (3) |
where is the pre-exponential factor, is the ideal gas constant, and is the activation enthalpy.
The hydrogen diffusion coefficient and the proton conductivity , i.e., the electrical conductivity contributed by hydrogen diffusion, are related by the Nernst-Einstein equation (Karato, 1990),
| (4) |
where is the Faraday’s constant; is the ideal gas constant; is the valence of the ion (+1 for proton); and is the concentration of hydrogen.
3 Results
3.1 Benchmarks of the machine learning potential
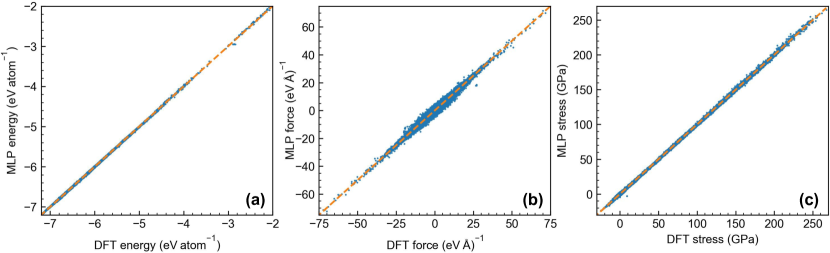
We compare the energies, atomic forces, and stresses from the MLP to those from DFT simulations for 50,587 configurations that are not included in the training set (\figrefbenchmark). The root-mean-square errors of the energies, atomic forces, and stresses are 6.39 meV atom-1, 0.28 eV Å-1, and 0.45 GPa, respectively. These uncertainties are comparable to the typical precision of AIMD simulations (Deng and Stixrude, 2021a).
To further validate the reliability of the MLP, we compare hydrogen diffusivity obtained from ab initio calculations to that from our MLP (Fig. S1). For the same initial condition, these two methods yield nearly identical MSDs. Consequently, hydrogen diffusivities derived are highly consistent, indicating that our MLP has accuracy comparable to ab initio calculations in computing the transport properties. We emphasize that in this example the simulation using MLP is approximately 5000 times faster than that driven by DFT.
3.2 Convergence and uncertainty of hydrogen diffusion coefficient
To investigate the impact of system size on diffusivity, we construct a series of supercells of hydrous bridgmanite that contain 81 to 41,472 atoms, incorporating hydrogen via (2H)Mg mechanism. The results suggest that hydrogen diffusivities initially increase with system sizes before eventually converging to a constant. The positive correlation between system size and diffusivity is reminiscent of the liquid phase, for which long-range hydrodynamic interactions result in a linear decay with the reciprocal spatial scale of the simulation system characterized by the Oseen tensors (Yeh and Hummer, 2004). The associated standard deviation (SD) drops significantly as the system expands (Fig. S2). We can characterize uncertainties following the approach proposed by He et al. (2018),
| (5) |
where and SD are the average value and standard deviation of diffusion coefficients, respectively; denotes the total number of effective ion hops; and are constants. A larger supercell with a given water content contains more hydrogen atoms, leading to a larger number of effective hydrogen hops, and consequently reducing uncertainties of diffusivity as shown in Fig. S2. The diffusion coefficients reported in \tabref1, Table S1, and Table S2 are based on systems consisting of at least 4000 atoms to guarantee size convergence.
To examine how long of a simulation is sufficient to calculate an adequately accurate diffusion coefficient, we run a long simulation for 10 ns of hydrous bridgmanite (Mg960Si1024O3072H128) at 2000 K and 25 GPa. We take the first 1, 2, 3, 4, 5, and 7 ns segment from this 10 ns trajectory, and then calculate the respective hydrogen diffusion coefficients (Fig. S3). The data point at 1 ns is the average result of 10 independent simulations, while the other data points are obtained from single simulations. The results show that as the simulation time increases, the calculated hydrogen diffusion coefficient gradually converges to the results of the 10 ns simulation. However, even with as short as 1-ns simulation, the maximum deviation is within 20%, and the average value is extremely close to the 10-ns simulation result. Therefore, we confirm that a 1-ns trajectory is sufficient to obtain an accurate result of the hydrogen diffusion coefficients.
The uncertainties of the calculated diffusivities are evaluated by performing 10 independent simulations with different initial velocity distributions or different defect distributions in the supercell (see Supplementary Material). The error bars calculated by the above method are represented by solid lines in the figures. However, due to the limitations of computational resources, it is computationally impractical to perform 10 independent simulations for all data reported in this paper. Therefore, based on our existing results, we estimated the uncertainties of the hydrogen diffusion coefficients for some similar systems. The estimated error bars are represented by dashed lines in the figures.
3.3 Hydrogen diffusion coefficients in bridgmanite and post-perovskite
Fig. S1a illustrates an example of MSD results for hydrous bridgmanite (Mg15Si16O48H2) at 3000 K and 25 GPa. During the initial few tens of femtoseconds, MSD as a function of time resembles that of ballistic motion. For the calculation of diffusion coefficients, we exclude this ballistic stage and only consider the portion of MSD which is a linear function of time.
We obtain hydrogen diffusion coefficients for both bridgmanite and post-perovskite with four representative water concentrations (175 ppm, 700 ppm, 1400 ppm, and 1.13 wt%), three hydrogen incorporation mechanisms (i.e., (2H)Mg, (4H)Si, and (Mg + 2H)Si), and various pressures and temperatures (\tabref1, Table S1, and Table S2).
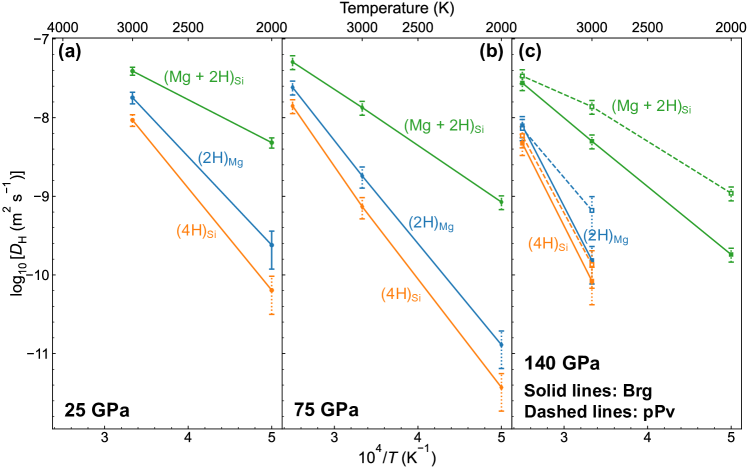
As an example, \figrefsummary summarizes the results for systems that contain 1400 ppm of water. Similar trends are observed for other water concentrations. Calculations for post-perovskite are conducted only at 140 GPa (Murakami et al., 2004). Bridgmanite melts at 4000 K and 25 GPa, and thus no data is displayed under this P/T condition. At 2000 K and 140 GPa, The slopes of all MSD-time plots are close to zero because no effective ion hop is observed during the total simulation time of 1 ns, and thus corresponding diffusivities cannot be derived.
| Defect | Pressure (GPa) | Mineral | Chemical composition | (wt%) | (kJ mol-1) | |
|---|---|---|---|---|---|---|
| (2H)Mg | 25 | Brg | 0.0175 | 174.5 | -4.57 | |
| (2H)Mg | 25 | Brg | 0.0702 | 212.5 | -4.02 | |
| (2H)Mg | 25 | Brg | 0.140 | 215.4 | -4.00 | |
| (2H)Mg | 75 | Brg | 0.140 | 250.1 | -4.36 | |
| (2H)Mg | 140 | Brg | 0.140 | 393.5 | -2.96 | |
| (2H)Mg | 25 | Brg | 1.14 | 159.8 | -5.19 | |
| (2H)Mg | 75 | Brg | 1.14 | 198.8 | -5.25 | |
| (2H)Mg | 140 | Brg | 1.14 | 265.4 | -4.65 | |
| (4H)Si | 25 | Brg | 0.140 | 248.5 | -3.70 | |
| (4H)Si | 75 | Brg | 0.140 | 262.2 | -4.48 | |
| (4H)Si | 140 | Brg | 0.140 | 402.4 | -3.07 | |
| (4H)Si | 25 | Brg | 1.13 | 163.5 | -5.05 | |
| (4H)Si | 75 | Brg | 1.13 | 199.3 | -5.07 | |
| (4H)Si | 140 | Brg | 1.13 | 197.5 | -5.40 | |
| (Mg + 2H)Si | 25 | Brg | 0.140 | 104.5 | -5.59 | |
| (Mg + 2H)Si | 75 | Brg | 0.140 | 136.6 | -5.50 | |
| (Mg + 2H)Si | 140 | Brg | 0.140 | 166.8 | -5.39 | |
| (Mg + 2H)Si | 25 | Brg | 1.12 | 82.9 | -5.92 | |
| (Mg + 2H)Si | 75 | Brg | 1.12 | 104.9 | -5.88 | |
| (Mg + 2H)Si | 140 | Brg | 1.12 | 114.8 | -6.01 | |
| (2H)Mg | 140 | pPv | 0.140 | 239.2 | -5.01 | |
| (2H)Mg | 140 | pPv | 1.14 | 256.1 | -4.85 | |
| (4H)Si | 140 | pPv | 0.140 | 376.7 | -3.31 | |
| (4H)Si | 140 | pPv | 1.13 | 182.9 | -5.61 | |
| (Mg + 2H)Si | 140 | pPv | 0.140 | 115.9 | -5.91 | |
| (Mg + 2H)Si | 140 | pPv | 1.12 | 101.6 | -6.20 |
4 Discussion
4.1 Factors affecting hydrogen diffusivity in bridgmanite and post-perovskite
4.1.1 Temperature and Pressure
Hydrogen diffusivity exhibits a significant increase with temperature, following an Arrhenius-type behavior, while it decreases with compression (\figrefsummary). \tabref1 presents pre-exponential factors and activation enthalpies for various defects, pressures, mineral phases, and water contents, calculated based on our hydrogen diffusivity results by fitting into \eqtrefeq:Arrhenius. The opposing effects of pressure and temperature along the geotherm (Katsura et al., 2010) leads to a near-constant hydrogen diffusivity throughout most of the lower mantle (see Table S2).
4.1.2 Hydrogen incorporation mechanisms
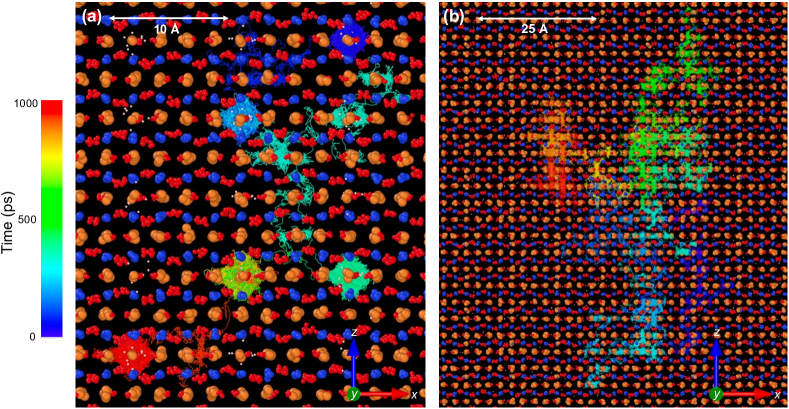
summary reveals that the diffusivity of hydrogen is the highest when incorporated via the (Mg + 2H)Si defect. Additionally, the (Al + H)Si defect exhibits a hydrogen diffusivity close to (Mg + 2H)Si, far surpassing that of the other two defect mechanisms (Fig. S8). To explore the underlying reason, we examine the color mapping trajectories of hydrogen diffusion in hydrous bridgmanite systems with (2H)Mg, (Mg + 2H)Si, and (Al + H)Si defects (\figrefmapping and Fig. S7). We also plot the atomic positions (Fig. S5) along the three crystallographic axes as a function of time corresponding to the trajectories shown in \figrefmapping. For the (2H)Mg defect (\figref[a]mapping, Fig. S5a), the hydrogen atom spends the majority of the time (about 95%) bound within Mg vacancy sites, while the remaining time is spent jumping and migrating through the interstitial sites. Specifically, the hydrogen atom stays in a Mg vacancy site for 72 ps until it starts a diffusion migration towards another Mg vacancy site. After staying for 228 ps, this hydrogen atom begins its next migration and arrives at another vacancy site at 341 ps. This migration crosses multiple interstitial sites, undergoing several consecutive jumps from one interstitial site to another. After staying for 75 ps, the hydrogen atom moves to the next vacancy site through a rapid diffusion jump that takes only 2 ps, and then jumps to the final vacancy 511 ps later. For the (Mg + 2H)Si defect (\figref[b]mapping, Fig. S5b, Fig. S7b) and the (Al + H)Si defect (Fig. S7a), however, the hydrogen atoms quickly jump through the interstitial sites and do not exhibit prolonged stays at defect sites, showing significantly higher mobility.
Generally, hydrogen atoms predominantly occupy vacancy or interstitial sites between diffusion jumps. Diffusion occurs through rapid jumps between vacancy or interstitial sites (i.e., effective ion hops), with jump lengths reaching up to several angstroms. The microscopic processes of hydrogen diffusion in bridgmanite and post-perovskite resemble those in wadsleyite and ringwoodite (Caracas and Panero, 2017).
In fact, this microscopic mechanism is closely related to the activation enthalpy in the Arrhenius equation \eqtrefeq:Arrhenius. The activation enthalpy is the energy difference between the system when hydrogen occupies the most energetically favorable position and when hydrogen passes the saddle point connecting the two energy minima (Ingrin and Blanchard, 2006). Activation enthalpies of (Mg + 2H)Si are notably lower than those of (2H)Mg and (Mg + 2H)Si, for both bridgmanite and post-perovskite (\tabref1 and Fig. S4). Given that the ionic radius of Mg2+ (86 pm) and Al3+ (67.5 pm) is larger than that of Si4+ (54 pm) (Slater, 1964), Mg and Al can effectively take up most of the space within a Si vacancy, making it difficult for hydrogen atoms to fit in. As such, (Mg + 2H)Si and (Al + H)Si have relatively higher potential energies, and lower activation enthalpies, leading to the fastest hydrogen diffusion across all considered temperatures, pressures, and mineral phases.

4.1.3 Bridgmanite vs. post-perovskite
Bridgmanite and post-perovskite exhibit significantly different characteristics of hydrogen diffusion. Hydrogen diffuses overall faster in post-perovskite than in bridgmanite, particularly at low temperatures (\figref[c]summary). Furthermore, these two minerals show completely different hydrogen diffusivities along their crystallographic axes (\figrefanisotropy). In bridgmanite, for initial configurations with various defect distributions, the error bars of diffusion coefficients along the three directions overlap with each other, exhibiting nearly isotropic hydrogen diffusion. Changes in the defect distribution will affect the order of diffusivity magnitudes along different directions. In post-perovskite, hydrogen atoms prefer diffusing along the -direction, showing a significant anisotropy. This pattern of anisotropy remains regardless of defect incorporation mechanisms, defect distributions in the supercell, and defect densities considered. Similar to the anisotropic diffusion of protons in rutile (Farver, 2010), the diffusion pathway connecting the large open channels between the SiO6 octahedra (see \figref[b]anisotropy) in post-perovskite along the -direction is more favored. In contrast, hydrogen migration along the -direction or -direction involves proton transfer from one channel to another. Therefore, a more efficient hydrogen diffusion along the -direction is observed in post-perovskite.
4.1.4 Water concentration
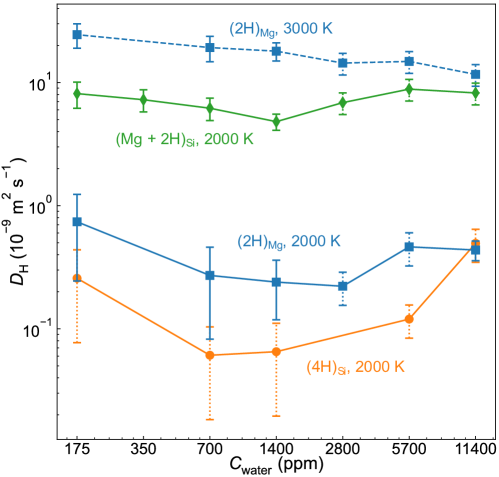
Water concentration also affects the hydrogen diffusivity in the host mineral (e.g., Caracas and Panero, 2017). We find that the effects of water content are moderate and nonlinear (\figrefwater). At 3000 K, the hydrogen diffusivity decreases with increasing water content; while at 2000 K, simulations of all three defect mechanisms show a trend where the diffusivity first increases and then decreases with increasing water content.
To understand the underlying reason for this phenomenon, we compare the microscopic mechanisms of hydrogen diffusion in hydrous bridgmanite systems with the same (2H)Mg defect but different water contents. \figref[a]mapping and Fig. S6a present the hydrogen trajectories of Mg960Si1024O3072H128 ( wt%) and Mg16368Si16384O49152H32 ( wt%), respectively. We find that in the simulation with wt% water, most (80%) of hydrogen atoms hop at least twice, passing through multiple vacancy sites, and spend the majority of the simulation time (95%) residing within these vacancy sites. In contrast, for simulations with wt% water, only 3 out of the 32 hydrogen atoms successfully migrate to neighboring sites. The other 29 atoms either remain at the initial sites throughout the 1-ns simulation or attempt to migrate but return to their initial positions quickly. Additionally, hydrogen atoms with successful diffusion migration often reside in interstitial sites for a significant amount of time (up to 500 ps) (Fig. S6a).
We believe that water content primarily affects the diffusion coefficient by changing the distance between neighboring vacancy sites. Let us consider two systems with different water contents while the attempt frequency of hydrogen diffusion migration is the same. In the water-rich system, due to the short distance between vacancies, these attempts are more likely to succeed in transporting the hydrogen atom to a new site, achieving net diffusion. This is the reason why we observe many more hydrogen atom migrations in \figref[a]mapping than Fig. S6a. In contrast, in the water-poor system, the hydrogen atom struggles to find a stable vacancy site to settle in and frequently returns to the initial defect site under the attraction of a local negative charge. Since the Coulombic force diminishes rapidly with distance (), once hydrogen reaches a distance far enough to escape the attraction, it lingers in the interstitial site for a long time and diffuses rapidly (the interstitial site has high potential energy) until it reaches the next low-energy vacancy site (Fig. S6a).
In high-temperature scenarios, the situation is straightforward: since the hydrogen atom is very light, it has high velocity, easily escapes the Coulombic attraction, and diffuses quickly in interstitial sites. An increase in water content (or a decrease in the average distance between vacancies) results in hydrogen being more constrained within the vacancy sites, leading to more pauses during diffusion (\figref[a]mapping). Consequently, the diffusion coefficient decreases monotonically with increasing water content.
In the case of low temperatures, the situation becomes more intricate. The velocity of hydrogen is lower, making it harder to overcome Coulombic attraction and achieve a successful migration attempt. In high water content scenarios (1400 ppm), nearby vacancy sites do not act as obstacles to diffusion. Instead, a nearby attractive vacancy can transform a failed migration attempt into a successful one. This is consistent with previous studies on wadsleyite and ringwoodite with high water content, where increasing the defect density may shorten the hopping distance of hydrogen and consequently enhance its diffusion (Caracas and Panero, 2017). However, when the water content decreases to a certain threshold (1400 ppm), the nearest defects are too distant to have any significant influence on hydrogen during a migration attempt. The facilitative effect of vacancies disappears, and the only remaining influence is their inhibitory effect on the rapid diffusion in interstitial sites, degenerating to the situation at high temperatures. As a result, the diffusion coefficient of hydrogen first increases and then decreases with increasing water content, reaching a minimum of around 1400 ppm.
In addition, higher water concentration may cause additional hydrogen to occupy interstitial sites, obstructing some diffusion pathways, and decelerating hydrogen diffusion, similar to the saturation effect in metal-hydrogen systems (e.g., Shelyapina, 2022). With respect to the (Mg + 2H)Si defect, since hydrogen atoms mainly reside in interstitial sites, this can also be a potential factor affecting hydrogen diffusivity.
In summary, hydrogen diffusion as a function of water concentration in mantle minerals is controlled by many competing factors and thus exhibits a complicated dependence on water contents. Nevertheless, for all conditions considered in this study, the variance of diffusion coefficients due to varying water concentrations does not exceed one order of magnitude (\figrefwater). Overall, the water content does not have a significant impact on the hydrogen diffusion coefficient. Based on this finding, we conclude that our hydrogen diffusivity results are applicable to the lower mantle given the similar plausible range of water content (Ohtani, 2021).
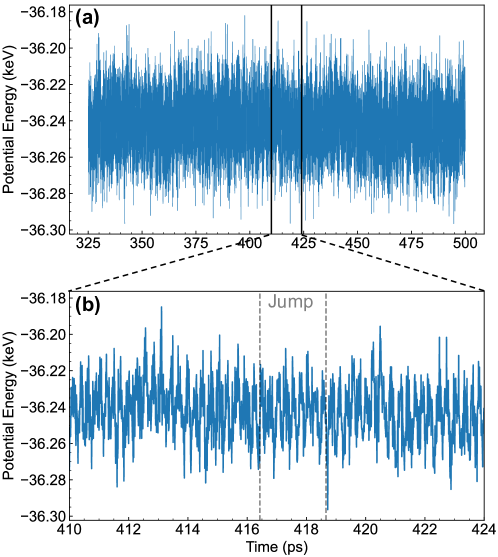
4.2 Energy fluctuation
We also monitor potential energy fluctuations upon hydrogen diffusion. The total potential energy of the system does not exhibit a clear local energy maximum or a saddle point during the diffusion jumps of hydrogen (\figreffluctuation) described in \secrefsec:micro_mech, \figrefmapping, and Fig. S5, in contrast to the classical transition state theory (Henkelman et al., 2000). The absence of an energy saddle point may be explained by the low concentration of hydrogen (thousands of ppm) considered in this study, which dilutes the effect of diffusion on the total potential energy of the entire system. Another possibility is that other atoms within the system also adjust their positions when diffusion occurs. This behavior highlights the intricate interplay between the positions of all atoms in the lattice and the total energy of the system, rather than just the positions of diffusing atoms. This result is consistent with the energy fluctuation observed during hydrogen diffusion in wadsleyite and ringwoodite (Caracas and Panero, 2017).
4.3 Self- and chemical diffusion of hydrogen in mantle silicates
The above discussions focus on the self-diffusion of hydrogen since the simulated system does not exhibit a concentration gradient of both hydrogen and defects. Since the transport of water in the Earth’s interior often occurs with a concentration gradient, the chemical diffusion of hydrogen in mantle silicates becomes crucial.
Different mechanisms have been proposed for the chemical diffusion of hydrogen in mantle silicates. First, protons may diffuse in interstitial sites and the proton flux is coupled with a counter flux of polarons, facilitated by the mobile excess charge on ferric iron (\ceFe^2+ ¡=¿ Fe^3+ + e^-) (e.g., Mackwell and Kohlstedt, 1990; Kohlstedt and Mackwell, 1998; Hae et al., 2006). Since the diffusivity of polarons significantly surpasses that of protons (Schmalzried and Schmalzried, 1974), the chemical diffusivity can be written as (Kohlstedt and Mackwell, 1998; Hae et al., 2006).
| (6) |
where and are the self-diffusion coefficients of hydrogen and polaron, respectively. Thus, the chemical diffusivity of hydrogen can be directly estimated using the self-diffusivity obtained in this study. Second, hydrogen diffusion can be coupled with the diffusion of intrinsic point defects such as Mg and Si vacancies (e.g., Kohlstedt and Mackwell, 1998; Demouchy and Mackwell, 2003). In this case, the chemical diffusion of hydrogen is much slower (two orders of magnitude slower than the first mechanism (Kohlstedt and Mackwell, 1998), and the self-diffusivity of hydrogen may not effectively constrain its chemical diffusivity. Third, activated hydrogen atoms may dissociate from a thermal vacancy and migrate as an interstitial particle until it is trapped again at another thermal vacancy, known as the dissociative mechanism (Novella et al., 2017; Frank and Turnbull, 1956). This closely resembles the self-diffusion of hydrogen in our simulations (see \secrefsec:micro_mech and \secrefsec:cwater). This dissociative mechanism can well explain why the self-/chemical diffusivity of hydrogen (e.g., Novella et al., 2017; Hae et al., 2006) is close to the diffusivity of small polarons (Novella et al., 2017), but much higher than those of Mg and Si in mantle silicates (e.g., Xu et al., 2011).
Furthermore, we note that Al might be extensively present in the lower mantle (e.g., Irifune, 1994) and thus obtain the diffusion coefficient of hydrogen in Al-bearing bridgmanite at 2000 K and 25 GPa (see Supplementary Material). Intriguingly, this diffusion is independent of any vacancy movement, as the incorporation of hydrogen does not rely on the presence of such vacancies. Given that Al3+ bears one less positive charge than Si4+, and the bridgmanite crystal remains electrically neutral, the non-protonated Al3+ ions might be associated with Fe3+ (McCammon, 1997). This suggests that the chemical diffusion of hydrogen in Al-bearing bridgmanite could also potentially involve the flux of excess charge on ferric iron, showing a similar pattern with the self-diffusion.
4.4 The water distribution in the lower mantle
Hydrous minerals in the subducted oceanic crust may transport a substantial amount of water into the Earth’s deep interior, reaching as deep down as the core-mantle boundary (e.g., Ohtani, 2015). Previous experimental and observational studies suggest a heterogeneous water distribution in the mantle transition zone (Hae et al., 2006; Sun et al., 2015; Zhou et al., 2022).
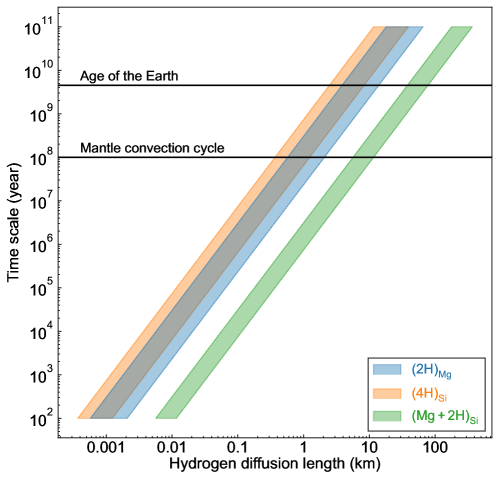
Bridgmanite is the most abundant mineral phase of the lower mantle, while the second most abundant, ferropericlase, remains dry under lower mantle conditions (Bolfan-Casanova et al., 2002; Muir and Brodholt, 2018). Therefore, we believe that the main medium for water transport in the lower mantle is bridgmanite. To evaluate the effect of hydrogen diffusivity on the distribution of water in the lower mantle, we calculate hydrogen diffusion length scales for bridgmanite and post-perovskite, based on hydrogen diffusion coefficients derived along the mantle geotherm (Katsura et al., 2010) (\figreflength). The diffusion length scale is given by , where is the estimated chemical diffusivity of hydrogen (\eqtrefeq:chemical) and represents the time scale, considering the first chemical diffusion mechanism as discussed in \secrefsec:chemical. With an assumed mantle convection velocity of 5 cm per year, the estimated time scale for one mantle convection cycle is 100 Ma (Holzapfel et al., 2005). The corresponding hydrogen diffusion length scales in bridgmanite and post-perovskite are less than 12 km, regardless of depths, water content, and hydrogen incorporation mechanisms (assuming (Mg + 2H)Si and (Al + H)Si are analogs regarding hydrogen diffusion). Considering that a portion of water may undergo much slower chemical diffusion coupled with cation vacancies (\secrefsec:chemical), this diffusion length would be shorter. Therefore, water brought into the lower mantle by the subducting slabs would be locally confined, leading to a heterogeneous distribution of water throughout the Earth’s lower mantle. However, other important factors that might influence hydrogen diffusion behavior in bridgmanite, such as grain boundary diffusion and compositional effects (e.g., iron content), need further study to corroborate this conclusion.
4.5 The electrical conductivity in the lower mantle
The electrical conductivity of mantle silicates is mainly contributed by four conduction mechanisms: ionic conduction, hopping (small polaron) conduction, large polaron conduction, and proton conduction (Yoshino, 2010). Due to its low bonding energy and small ionic radius, the energy barrier of the transiting proton is relatively low, causing proton conductivity to potentially dominate the bulk conductivity under wet conditions (Sun et al., 2015; Yoshino, 2010).
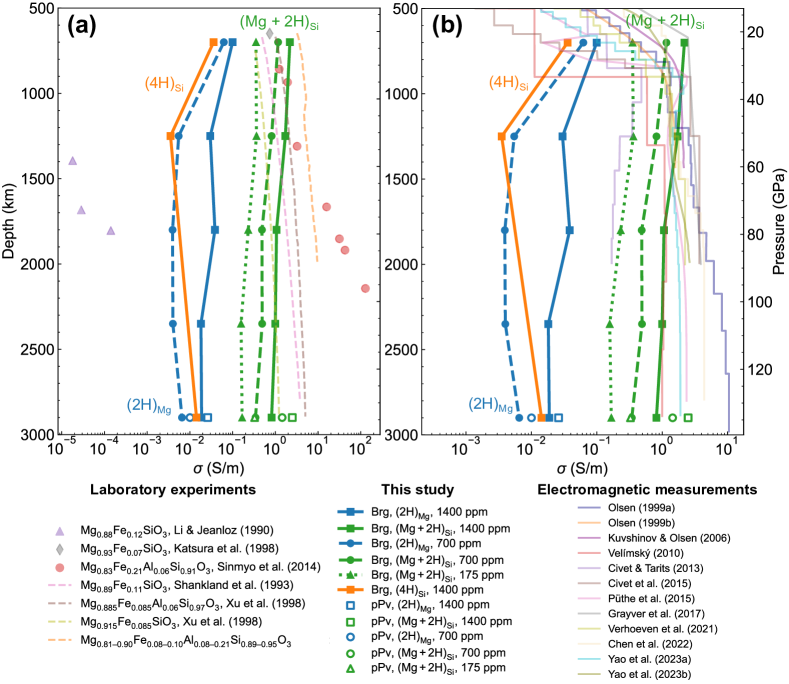
In this study, we employ the Nernst-Einstein equation (\eqtrefeq:NE) to calculate the proton conductivity in bridgmanite and post-perovskite, based on hydrogen diffusivities obtained from MD simulations along the geotherm (Katsura et al., 2010) (Table S2). Proton conductivity results for various systems are plotted as a function of depth, along with experimental results (\figref[a]EC) and observations (\figref[b]EC) of the bulk conductivity of the lower mantle. The proton conductivity of bridgmanite is sensitive to the water content and hydrogen incorporation mechanisms. If water content remains constant and the hydrogen incorporation mechanism is consistent throughout the lower mantle, the proton conductivity would show relatively low depth sensitivity due to the near-constant hydrogen diffusivity. The diffusivity of hydrogen is the largest when incorporated as (Mg + 2H)Si defects (or the diffusionally analogous (Al + H)Si defects), resulting in the highest proton conductivity of up to 1 S m-1 (Table S2 and \figrefEC). Under the lowermost mantle conditions, the proton conductivity in post-perovskite is higher than that in bridgmanite, with the difference within one order of magnitude.
[a]EC presents experimentally measured conductivity results of dry bridgmanite with various Fe and Al contents (Katsura et al., 1998; Li and Jeanloz, 1990; Shankland et al., 1993; Sinmyo et al., 2014; Xu et al., 1998), except for one study that used bridgmanite samples containing 0–92 ppm water (Yoshino et al., 2016). These experimental results, although highly scattered, suggest that the conductivity of bridgmanite is sensitive to chemical compositions, e.g., Al and Fe contents. The relatively high conductivity results measured by Yoshino et al. (2016), compared to other studies, may be caused by the presence of water in their samples. We find that the contribution of proton for Earth-relevant water contents is comparable to the sum of all other three conduction mechanisms in bridgmanite (i.e., the conductivity of dry bridgmanite) when hydrogen is incorporated as (Mg + 2H)Si or (Al + H)Si defects. The 1D conductivity-depth profiles in the lower mantle, as determined from electromagnetic induction studies, are shown in \figref[b]EC (Civet and Tarits, 2013; Civet et al., 2015; Grayver et al., 2017; Kuvshinov and Olsen, 2006; Olsen, 1999a, b; Puthe et al., 2015; Velimsky, 2010; Verhoeven et al., 2021). Most of these conductivity data fall within two orders of magnitude (0.1–10 S m-1) and generally remain nearly constant or slightly increase with increasing depth. Considering (Mg + 2H)Si or (Al + H)Si defects, our results of proton conductivity are within the same magnitude as the measured conductivity, supporting the potential role of water in affecting the electrical conductivity of the lower mantle.
Previous studies reported strong lateral heterogeneities of the electrical conductivity in the mid-lower mantle regions (e.g., Khan et al., 2011; Tarits and Mandea, 2010). Since the proton conductivity in bridgmanite is sensitive to both temperature and water content, the possible thermal anomalies (Hsieh et al., 2020) as well as the potential heterogeneous water distribution discussed in \secrefsec:distribution may lead to these heterogeneities of the lower mantle conductivity. If we consider bridgmanite with relatively high but still reasonable water contents, for example, around 700 ppm (assuming it primarily exists in the form of (Mg + 2H)Si or (Al + H)Si), the proton conductivity is 1 S m-1 at 900 km depth, which aligns perfectly with the heterogeneity in the observed mantle conductivity at a depth of 900 km (1.4–2.4 S m-1, Khan et al., 2011). Therefore, water may act as a significant charge carrier in the hydrated regions of the lower mantle, and contribute to the heterogeneity of electrical conductivity. Further, by analyzing electrical conductivity variations, we can potentially deduce water distribution in the lower mantle. It is worth noting that the strong anisotropic hydrogen diffusion in post-perovskite discussed in \secrefsec:anisotropy may result in anisotropic electrical conductivity, similar to the case with olivine in the upper mantle (Bahr and Simpson, 2002).
We acknowledge that real-world scenarios involve a multitude of factors influencing hydrogen diffusivity and electrical conductivity. However, considering this is the first study on the diffusion of hydrogen in lower mantle minerals, we position our results as an initial step and believe our current results provide a foundational step towards creating more comprehensive models that can capture the multifaceted nature of diffusion processes in the Earth’s mantle.
5 Conclusions
We have developed a unified machine learning potential of ab initio quality, which, for the first time, enables a comprehensive examination of hydrogen diffusion in bridgmanite and post-perovskite under the Earth’s lower mantle conditions. Our systematic analysis of factors influencing hydrogen diffusivity demonstrates that hydrogen diffusion is highly sensitive to defect mechanism, temperature, and pressure, while relatively insensitive to water content. The trade-off between pressure and temperature leads to a nearly constant hydrogen diffusivity in the lower mantle along the geotherm. Among the four defect mechanisms examined, (Mg + 2H)Si and (Al + H)Si show similar patterns and yield the highest hydrogen diffusivity, which may result from the low activation enthalpy. Hydrogen diffuses overall faster in post-perovskite than in bridgmanite, especially at relatively low temperatures. In addition, these two minerals exhibit distinct anisotropies of hydrogen diffusion. Based on our diffusivity results, we conclude that hydrogen diffusion is sluggish on the geological time scale, suggesting that the water distribution in the lower mantle may be localized and highly heterogeneous. We also calculate the electrical conductivities contributed by hydrogen diffusion in bridgmanite and post-perovskite. When hydrogen incorporates via (Mg + 2H)Si and (Al + H)Si defects, the proton conductivity of bridgmanite falls within the same order of magnitude as the reported lower mantle conductivity profile and can well explain its lateral heterogeneity, indicating that we can potentially deduce water distribution by analyzing electrical conductivity variations in the lower mantle.
Acknowledgments
J.D. acknowledges National Science Foundation EAR-2242946. We are grateful to John Brodholt and the other reviewer whose comments helped to improve the manuscript. The simulations presented in this article were performed on computational resources managed and supported by Princeton Research Computing, a consortium of groups including the Princeton Institute for Computational Science and Engineering (PICSciE) and the Office of Information Technology’s High-Performance Computing Center and Visualization Laboratory at Princeton University.
Data Availability
Data are stored at the Open Science Framework (https://osf.io/brwcv/) with DOI 10.17605/OSF.IO/BRWCV.
Appendix A Supplementary Material
Text S1 presents our calculation of the relative stability of different defect distributions and their impact on the hydrogen diffusion coefficient. Text S2 presents the simulation of the hydrogen diffusion in Al-bearing bridgmanite with (Al + H)Si defects. Table S1 and Table S2 present diffusion coefficients, , , and proton conductivities in a text-based numerical format.
References
- Bahr and Simpson (2002) Bahr, K., Simpson, F., 2002. Electrical anisotropy below slow- and fast-moving plates: Paleoflow in the upper mantle? Science (New York, N.Y.) 295, 1270–1272. doi:10.1126/science.1066161.
- Bolfan-Casanova et al. (2003) Bolfan-Casanova, N., Keppler, H., Rubie, D.C., 2003. Water partitioning at 660 km depth and evidence for very low water solubility in magnesium silicate perovskite. Geophysical Research Letters 30. doi:10.1029/2003GL017182.
- Bolfan-Casanova et al. (2002) Bolfan-Casanova, N., Mackwell, S., Keppler, H., McCammon, C., Rubie, D.C., 2002. Pressure dependence of H solubility in magnesiowüstite up to 25 GPa: Implications for the storage of water in the Earth’s lower mantle. Geophysical Research Letters 29, 89–1–89–4. doi:10.1029/2001GL014457.
- Caracas and Panero (2017) Caracas, R., Panero, W.R., 2017. Hydrogen mobility in transition zone silicates. Progress in Earth and Planetary Science 4, 11. doi:10.1186/s40645-017-0119-8.
- Cheng et al. (2020) Cheng, B.Q., Griffiths, R.R., Wengert, S., Kunkel, C., Stenczel, T., Zhu, B.N., Deringer, V.L., Bernstein, N., Margraf, J.T., Reuter, K., Csanyi, G., 2020. Mapping materials and molecules. Accounts of Chemical Research 53, 1981–1991. doi:10.1021/acs.accounts.0c00403.
- Civet and Tarits (2013) Civet, F., Tarits, P., 2013. Analysis of magnetic satellite data to infer the mantle electrical conductivity of telluric planets in the solar system. Planetary and Space Science 84, 102–111. doi:10.1016/j.pss.2013.05.004.
- Civet et al. (2015) Civet, F., Thebault, E., Verhoeven, O., Langlais, B., Saturnino, D., 2015. Electrical conductivity of the Earth’s mantle from the first Swarm magnetic field measurements. Geophysical Research Letters 42, 3338–3346. doi:10.1002/2015gl063397.
- Demouchy and Mackwell (2003) Demouchy, S., Mackwell, S., 2003. Water diffusion in synthetic iron-free forsterite. Physics and Chemistry of Minerals 30, 486–494. doi:10.1007/s00269-003-0342-2. 10.1007/s00269-003-0342-2.
- Deng et al. (2023) Deng, J., Niu, H., Hu, J., Chen, M., Stixrude, L., 2023. Melting of MgSiO3 determined by machine learning potentials. Physical Review B 107, 064103. doi:10.1103/PhysRevB.107.064103.
- Deng and Stixrude (2021a) Deng, J., Stixrude, L., 2021a. Deep fractionation of Hf in a solidifying magma ocean and its implications for tungsten isotopic heterogeneities in the mantle. Earth and Planetary Science Letters 562, 8. doi:10.1016/j.epsl.2021.116873.
- Deng and Stixrude (2021b) Deng, J., Stixrude, L., 2021b. Thermal conductivity of silicate liquid determined by machine learning potentials. Geophysical Research Letters 48, 10. doi:10.1029/2021gl093806.
- Farver (2010) Farver, J.R., 2010. Oxygen and hydrogen diffusion in minerals. Reviews in Mineralogy and Geochemistry 72, 447–507. doi:10.2138/rmg.2010.72.10.
- Frank and Turnbull (1956) Frank, F.C., Turnbull, D., 1956. Mechanism of Diffusion of Copper in Germanium. Physical Review 104, 617–618. doi:10.1103/PhysRev.104.617. 10.1103/PhysRev.104.617.
- Freitas and Cao (2022) Freitas, R., Cao, Y., 2022. Machine-learning potentials for crystal defects. MRS Communications 12, 510–520. doi:10.1557/s43579-022-00221-5.
- Fu et al. (2019) Fu, S.Y., Yang, J., Karato, S., Vasiliev, A., Presniakov, M.Y., Gavriliuk, A.G., Ivanova, A.G., Hauri, E.H., Okuchi, T., Purevjav, N., Lin, J.F., 2019. Water concentration in single-crystal (Al,Fe)-Bearing bridgmanite grown from the hydrous melt: Implications for dehydration melting at the topmost lower mantle. Geophysical Research Letters 46, 10346–10357. doi:10.1029/2019gl084630.
- Grayver et al. (2017) Grayver, A.V., Munch, F.D., Kuvshinov, A.V., Khan, A., Sabaka, T.J., Toffner-Clausen, L., 2017. Joint inversion of satellite-detected tidal and magnetospheric signals constrains electrical conductivity and water content of the upper mantle and transition zone. Geophysical Research Letters 44, 6074–6081. doi:10.1002/2017gl073446.
- Hae et al. (2006) Hae, R., Ohtani, E., Kubo, T., Koyama, T., Utada, H., 2006. Hydrogen diffusivity in wadsleyite and water distribution in the mantle transition zone. Earth and Planetary Science Letters 243, 141–148. doi:10.1016/j.epsl.2005.12.035.
- Hallis et al. (2015) Hallis, L.J., Huss, G.R., Nagashima, K., Taylor, G.J., Halldorsson, S.A., Hilion, D.R., Mottl, M.J., Meech, K.J., 2015. Evidence for primordial water in Earth’s deep mantle. Science (New York, N.Y.) 350, 795–797. doi:10.1126/science.aac4834.
- He et al. (2018) He, X.F., Zhu, Y.Z., Epstein, A., Mo, Y.F., 2018. Statistical variances of diffusional properties from ab initio molecular dynamics simulations. Npj Computational Materials 4, 9. doi:10.1038/s41524-018-0074-y.
- Henkelman et al. (2000) Henkelman, G., Uberuaga, B.P., Jonsson, H., 2000. A climbing image nudged elastic band method for finding saddle points and minimum energy paths. Journal of Chemical Physics 113, 9901–9904. doi:10.1063/1.1329672.
- Holzapfel et al. (2005) Holzapfel, C., Rubie, D.C., Frost, D.J., Langenhorst, F., 2005. Fe-Mg interdiffusion in (Mg,Fe)SiO3 perovskite and lower mantle reequilibration. Science (New York, N.Y.) 309, 1707–1710. doi:10.1126/science.1111895.
- Hoover (1985) Hoover, W.G., 1985. Canonical dynamics - equilibrium phase-space distributions. Physical Review A 31, 1695–1697. doi:10.1103/PhysRevA.31.1695.
- Hsieh et al. (2020) Hsieh, W.P., Ishii, T., Chao, K.H., Tsuchiya, J., Deschamps, F., Ohtani, E., 2020. Spin transition of iron in delta-(Al,Fe)OOH induces thermal anomalies in earth’s lower mantle. Geophysical Research Letters 47, 10. doi:10.1029/2020gl087036.
- Imbalzano et al. (2018) Imbalzano, G., Anelli, A., Giofre, D., Klees, S., Behler, J., Ceriotti, M., 2018. Automatic selection of atomic fingerprints and reference configurations for machine-learning potentials. Journal of Chemical Physics 148, 9. doi:10.1063/1.5024611.
- Ingrin and Blanchard (2006) Ingrin, J., Blanchard, M., 2006. Diffusion of Hydrogen in Minerals. Reviews in Mineralogy and Geochemistry 62, 291–320. doi:10.2138/rmg.2006.62.13.
- Irifune (1994) Irifune, T., 1994. Absence of an aluminous phase in the upper part of the Earth’s lower mantle. Nature 370, 131–133. doi:10.1038/370131a0.
- Karato (1990) Karato, S., 1990. The role of hydrogen in the electrical-conductivity of the upper mantle. Nature 347, 272–273. doi:10.1038/347272a0.
- Karato (1995) Karato, S., 1995. Effects of water on seismic-wave velocities in the upper-mantle. Proceedings of the Japan Academy Series B-Physical and Biological Sciences 71, 61–66. doi:10.2183/pjab.71.61.
- Karato et al. (1986) Karato, S.I., Paterson, M.S., Fitz Gerald, J.D., 1986. Rheology of synthetic olivine aggregates - influence of grain-size and water. Journal of Geophysical Research-Solid Earth and Planets 91, 8151–8176. doi:10.1029/JB091iB08p08151.
- Karki (2015) Karki, B.B., 2015. First-principles computation of mantle materials in crystalline and amorphous phases. Physics of the Earth and Planetary Interiors 240, 43–69. doi:10.1016/j.pepi.2014.11.004.
- Katsura et al. (1998) Katsura, T., Sato, K., Ito, E., 1998. Electrical conductivity of silicate perovskite at lower-mantle conditions. Nature 395, 493–495. doi:10.1038/26736.
- Katsura et al. (2010) Katsura, T., Yoneda, A., Yamazaki, D., Yoshino, T., Ito, E., 2010. Adiabatic temperature profile in the mantle. Physics of the Earth and Planetary Interiors 183, 212–218. doi:10.1016/j.pepi.2010.07.001.
- Khan et al. (2011) Khan, A., Kuvshinov, A., Semenov, A., 2011. On the heterogeneous electrical conductivity structure of the Earth’s mantle with implications for transition zone water content. Journal of Geophysical Research: Solid Earth 116. doi:10.1029/2010JB007458. 10.1029/2010JB007458.
- Kohlstedt and Mackwell (1998) Kohlstedt, D.L., Mackwell, S.J., 1998. Diffusion of hydrogen and intrinsic point defects in olivine. Zeitschrift fur Physikalische Chemie 207, 147–162. doi:10.1524/zpch.1998.207.part_1_2.147. 10.1524/zpch.1998.207.part_1_2.147.
- Kresse and Furthmuller (1996) Kresse, G., Furthmuller, J., 1996. Efficient iterative schemes for ab initio total-energy calculations using a plane-wave basis set. Physical Review B 54, 11169–11186. doi:10.1103/PhysRevB.54.11169.
- Kresse and Joubert (1999) Kresse, G., Joubert, D., 1999. From ultrasoft pseudopotentials to the projector augmented-wave method. Physical Review B 59, 1758–1775. doi:10.1103/PhysRevB.59.1758.
- Kudoh and Inoue (1999) Kudoh, Y., Inoue, T., 1999. Mg-vacant structural modules and dilution of the symmetry of hydrous wadsleyite, -Mg2-xSiH2xO4 with 0.00x0.25. Physics and Chemistry of Minerals 26, 382–388. doi:10.1007/s002690050198.
- Kuvshinov and Olsen (2006) Kuvshinov, A., Olsen, N., 2006. A global model of mantle conductivity derived from 5 years of CHAMP, Orsted, and SAC-C magnetic data. Geophysical Research Letters 33, 5. doi:10.1029/2006gl027083.
- Li and Jeanloz (1990) Li, X.Y., Jeanloz, R., 1990. Laboratory studies of the electrical-conductivity of silicate perovskites at high-pressures and temperatures. Journal of Geophysical Research-Solid Earth and Planets 95, 5067–5078. doi:10.1029/JB095iB04p05067.
- Litasov et al. (2003) Litasov, K., Ohtani, E., Langenhorst, F., Yurimoto, H., Kubo, T., Kondo, T., 2003. Water solubility in Mg-perovskites, and water storage capacity in the lower mantle. Earth and Planetary Science Letters 211, 189–203. doi:10.1016/s0012-821x(03)00200-0.
- Mackwell and Kohlstedt (1990) Mackwell, S.J., Kohlstedt, D.L., 1990. Diffusion of hydrogen in olivine: Implications for water in the mantle. Journal of Geophysical Research: Solid Earth 95, 5079–5088. doi:10.1029/JB095iB04p05079. 10.1029/JB095iB04p05079.
- McCammon (1997) McCammon, C., 1997. Perovskite as a possible sink for ferric iron in the lower mantle. Nature 387, 694–696. doi:10.1038/42685. 10.1038/42685.
- Mermin (1965) Mermin, N.D., 1965. Thermal properties of the inhomogeneous electron gas. Physical Review 137, 1441–+. doi:10.1103/PhysRev.137.A1441.
- Muir and Brodholt (2018) Muir, J.M.R., Brodholt, J.P., 2018. Water distribution in the lower mantle: Implications for hydrolytic weakening. Earth and Planetary Science Letters 484, 363–369. doi:10.1016/j.epsl.2017.11.051.
- Murakami et al. (2004) Murakami, M., Hirose, K., Kawamura, K., Sata, N., Ohishi, Y., 2004. Post-perovskite phase transition in MgSiO3. Science (New York, N.Y.) 304, 855–858. doi:10.1126/science.1095932.
- Murakami et al. (2002) Murakami, M., Hirose, K., Yurimoto, H., Nakashima, S., Takafuji, N., 2002. Water in earth’s lower mantle. Science (New York, N.Y.) 295, 1885–1887. doi:10.1126/science.1065998.
- Niu et al. (2020) Niu, H., Bonati, L., Piaggi, P.M., Parrinello, M., 2020. Ab initio phase diagram and nucleation of gallium. Nature Communications 11. doi:10.1038/s41467-020-16372-9.
- Novella et al. (2017) Novella, D., Jacobsen, B., Weber, P.K., Tyburczy, J.A., Ryerson, F.J., Du Frane, W.L., 2017. Hydrogen self-diffusion in single crystal olivine and electrical conductivity of the Earth’s mantle. Scientific Reports 7, 5344. doi:10.1038/s41598-017-05113-6. 10.1038/s41598-017-05113-6.
- Ohtani (2015) Ohtani, E., 2015. Hydrous minerals and the storage of water in the deep mantle. Chemical Geology 418, 6–15. doi:10.1016/j.chemgeo.2015.05.005.
- Ohtani (2021) Ohtani, E., 2021. Hydration and dehydration in earth’s interior, in: Jeanloz, R., Freeman, K.H. (Eds.), Annual Review of Earth and Planetary Sciences, Vol 49, 2021. Annual Reviews, Palo Alto. volume 49 of Annual Review of Earth and Planetary Sciences, pp. 253–278. doi:10.1146/annurev-earth-080320-062509.
- Ohtani and Litasov (2006) Ohtani, E., Litasov, K.D., 2006. The effect of water on mantle phase transitions. Water in Nominally Anhydrous Minerals 62, 397–419. doi:10.2138/rmg.2006.62.17.
- Olsen (1999a) Olsen, N., 1999a. Induction studies with satellite data. Surveys in Geophysics 20, 309–340. doi:10.1023/a:1006611303582.
- Olsen (1999b) Olsen, N., 1999b. Long-period (30 days-1 year) electromagnetic sounding and the electrical conductivity of the lower mantle beneath Europe. Geophysical Journal International 138, 179–187. doi:10.1046/j.1365-246x.1999.00854.x.
- Panero et al. (2013) Panero, W.R., Smyth, J.R., Pigott, J.S., Liu, Z.X., Frost, D.J., 2013. Hydrous ringwoodite to 5 K and 35 GPa: Multiple hydrogen bonding sites resolved with FTIR spectroscopy. American Mineralogist 98, 637–642. doi:10.2138/am.2013.3978.
- Perdew et al. (2008) Perdew, J.P., Ruzsinszky, A., Csonka, G.I., Vydrov, O.A., Scuseria, G.E., Constantin, L.A., Zhou, X.L., Burke, K., 2008. Restoring the density-gradient expansion for exchange in solids and surfaces. Physical Review Letters 100, 4. doi:10.1103/PhysRevLett.100.136406.
- Piaggi and Parrinello (2019) Piaggi, P.M., Parrinello, M., 2019. Multithermal-multibaric molecular simulations from a variational principle. Physical Review Letters 122, 6. doi:10.1103/PhysRevLett.122.050601.
- Plimpton (1995) Plimpton, S., 1995. Fast parallel algorithms for short-range molecular-dynamics. Journal of Computational Physics 117, 1–19. doi:10.1006/jcph.1995.1039.
- Puthe et al. (2015) Puthe, C., Kuvshinov, A., Khan, A., Olsen, N., 2015. A new model of Earth’s radial conductivity structure derived from over 10 yr of satellite and observatory magnetic data. Geophysical Journal International 203, 1864–1872. doi:10.1093/gji/ggv407.
- Schmalzried and Schmalzried (1974) Schmalzried, H., Schmalzried, H., 1974. Solid state reactions. Materials science and technology, Verl. Chemie, Weinheim, Bergstr.
- Scipioni et al. (2017) Scipioni, R., Stixrude, L., Desjarlais, M.P., 2017. Electrical conductivity of SiO2 at extreme conditions and planetary dynamos. Proceedings of the National Academy of Sciences of the United States of America 114, 9009–9013. doi:10.1073/pnas.1704762114.
- Shankland et al. (1993) Shankland, T.J., Peyronneau, J., Poirier, J.P., 1993. Electrical-conductivity of the earths lower mantle. Nature 366, 453–455. doi:10.1038/366453a0.
- Shelyapina (2022) Shelyapina, M.G., 2022. Hydrogen diffusion on, into and in magnesium probed by DFT: A review. Hydrogen 3, 285–302. doi:10.3390/hydrogen3030017.
- Sinmyo et al. (2014) Sinmyo, R., Pesce, G., Greenberg, E., McCammon, C., Dubrovinsky, L., 2014. Lower mantle electrical conductivity based on measurements of Al, Fe-bearing perovskite under lower mantle conditions. Earth and Planetary Science Letters 393, 165–172. doi:10.1016/j.epsl.2014.02.049.
- Slater (1964) Slater, J.C., 1964. Atomic radii in crystals. Journal of Chemical Physics 41, 3199. doi:10.1063/1.1725697.
- Sun et al. (2015) Sun, W., Yoshino, T., Sakamoto, N., Yurimoto, H., 2015. Hydrogen self-diffusivity in single crystal ringwoodite: Implications for water content and distribution in the mantle transition zone. Geophysical Research Letters 42, 6582–6589. doi:10.1002/2015gl064486.
- Tarits and Mandea (2010) Tarits, P., Mandea, M., 2010. The heterogeneous electrical conductivity structure of the lower mantle. Physics of the Earth and Planetary Interiors 183, 115–125. doi:10.1016/j.pepi.2010.08.002.
- Townsend et al. (2016) Townsend, J.P., Tsuchiya, J., Bina, C.R., Jacobsen, S.D., 2016. Water partitioning between bridgmanite and postperovskite in the lowermost mantle. Earth and Planetary Science Letters 454, 20–27. doi:10.1016/j.epsl.2016.08.009.
- Tribello et al. (2014) Tribello, G.A., Bonomi, M., Branduardi, D., Camilloni, C., Bussi, G., 2014. PLUMED 2: New feathers for an old bird. Computer Physics Communications 185, 604–613. doi:10.1016/j.cpc.2013.09.018.
- Velimsky (2010) Velimsky, J., 2010. Electrical conductivity in the lower mantle: Constraints from CHAMP satellite data by time-domain EM induction modelling. Physics of the Earth and Planetary Interiors 180, 111–117. doi:10.1016/j.pepi.2010.02.007.
- Verhoeven et al. (2021) Verhoeven, O., Thebault, E., Saturnino, D., Houliez, A., Langlais, B., 2021. Electrical conductivity and temperature of the Earth’s mantle inferred from Bayesian inversion of Swarm vector magnetic data. Physics of the Earth and Planetary Interiors 314, 11. doi:10.1016/j.pepi.2021.106702.
- Wang et al. (2018) Wang, H., Zhang, L.F., Han, J.Q., E, W.N., 2018. DeePMD-kit: A deep learning package for many-body potential energy representation and molecular dynamics. Computer Physics Communications 228, 178–184. doi:10.1016/j.cpc.2018.03.016.
- Xu et al. (2011) Xu, J., Yamazaki, D., Katsura, T., Wu, X., Remmert, P., Yurimoto, H., Chakraborty, S., 2011. Silicon and magnesium diffusion in a single crystal of MgSiO3 perovskite. Journal of Geophysical Research: Solid Earth 116. URL: https://onlinelibrary.wiley.com/doi/abs/10.1029/2011JB008444, doi:10.1029/2011JB008444. _eprint: https://onlinelibrary.wiley.com/doi/pdf/10.1029/2011JB008444.
- Xu et al. (1998) Xu, Y.S., McCammon, C., Poe, B.T., 1998. The effect of alumina on the electrical conductivity of silicate perovskite. Science (New York, N.Y.) 282, 922–924. doi:10.1126/science.282.5390.922.
- Yang et al. (2021) Yang, M., Karmakar, T., Parrinello, M., 2021. Liquid-liquid critical point in phosphorus. Physical Review Letters 127. doi:10.1103/PhysRevLett.127.080603.
- Yeh and Hummer (2004) Yeh, I.C., Hummer, G., 2004. System-size dependence of diffusion coefficients and viscosities from molecular dynamics simulations with periodic boundary conditions. Journal of Physical Chemistry B 108, 15873–15879. doi:10.1021/jp0477147.
- Yoshino (2010) Yoshino, T., 2010. Laboratory electrical conductivity measurement of mantle minerals. Surveys in Geophysics 31, 163–206. doi:10.1007/s10712-009-9084-0.
- Yoshino et al. (2016) Yoshino, T., Kamada, S., Zhao, C.C., Ohtani, E., Hirao, N., 2016. Electrical conductivity model of Al-bearing bridgmanite with implications for the electrical structure of the Earth’s lower mantle. Earth and Planetary Science Letters 434, 208–219. doi:10.1016/j.epsl.2015.11.032.
- Zhang et al. (2018) Zhang, L.F., Han, J.Q., Wang, H., Car, R., Weinan, E., 2018. Deep potential molecular dynamics: A scalable model with the accuracy of quantum mechanics. Physical Review Letters 120, 6. doi:10.1103/PhysRevLett.120.143001.
- Zhou et al. (2022) Zhou, W.Y., Hao, M., Zhang, J.S., Chen, B., Wang, R.J., Schmandt, B., 2022. Constraining composition and temperature variations in the mantle transition zone. Nature Communications 13, 9. doi:10.1038/s41467-022-28709-7.