Universal productivity patterns in research careers
Abstract
A common expectation is that career productivity peaks rather early and then gradually declines with seniority. But whether this holds true is still an open question. Here we investigate the productivity trajectories of almost 8,500 scientists from over fifty disciplines using methods from time series analysis, dimensionality reduction, and network science, showing that there exist six universal productivity patterns in research. Based on clusters of productivity trajectories and network representations where researchers with similar productivity patterns are connected, we identify constant, u-shaped, decreasing, periodic-like, increasing, and canonical productivity patterns, with the latter two describing almost three-fourths of researchers. In fact, we find that canonical curves are the most prevalent, but contrary to expectations, productivity peaks occur much more frequently around mid-career rather than early. These results outline the boundaries of possible career paths in science and caution against the adoption of stereotypes in tenure and funding decisions.
Introduction
Scientific productivity is routinely used to measure and assess the performance of researchers, as it quantifies their contributions to the scientific community through scholarly publications [1]. When combined with other indicators of research quality, productivity plays an important role in determining job placement [2], promotions to tenured positions [3], funding allocation [4, 5], and in mapping the development of science [6, 7]. Given its importance, understanding productivity patterns over the course of scientific careers has been a long-standing priority for researchers from various disciplines, and Lehman’s monograph is considered a seminal work in this regard [8]. In 1953, he observed that the aggregated contributions of scientists, musical composers, artists, and writers exhibit a pattern of rapid early-career growth followed by a gradual decline in productivity as their careers progressed. This pattern has been consistently observed in various contexts and datasets, and it is often referred to as the “canonical productivity narrative” [8, 9, 10, 11, 12, 13, 14, 15, 16, 17, 18, 19].
But the notion that there is a universal pattern of productivity across scientific disciplines and demographic groups has been significantly challenged by recent research. Indeed, studies have found evidence for a variety of productivity patterns, including constant [12, 17], decreasing [20, 21, 13], increasing [17], and periodic-like [22, 11, 23]. However, many studies have used aggregated data, which may introduce bias due to the “compositional fallacy” [15] – a common issue that arises when trying to infer typical productivity trajectories based on average behavior across many individuals. Other studies have been restricted to a reduced set of career years in specific fields of knowledge [20, 21] and have often relied on linear regression models [21, 20, 23, 14, 17], which may not fully capture the complexity of productivity patterns. Some authors have also proposed generative models of productivity curves [14, 15, 24], but have been unable to validate these patterns with empirical evidence.
Large-scale studies that investigate individual shapes of productivity trajectories are scarce, with the work of Way et al. [25] being one of the few exceptions. Using data from over two thousand computer science faculty members in the U.S. and Canada, they applied a segmented linear model composed of two continuous lines to each researcher’s career to evaluate the universality of the canonical productivity narrative. Research has found that almost half of the careers in this dataset is consistent with strictly constant, increasing, or decreasing productivity trajectories. Conversely, only 20% of the trajectories have been found to exhibit early growth followed by a slow decline in productivity, thus suggesting that the canonical narrative may not be as prevalent as previously thought. However, the use of piecewise regressions limits the emergence of possible nonlinear patterns such as periodic trajectories, and the focus on computer science may limit the generalization of these conclusions to other academic disciplines. Additionally, research so far has ignored that structural changes in the scientific enterprise – such as the increase in scientific collaboration [26] and pressure to produce in large quantities [27, 28, 29] – may impact the research culture of different cohorts and their productivity trajectories.
Here we investigate the productivity trajectories of over eight thousand scientists from the elite of the Brazilian research community, spanning more than fifty research disciplines. We employ a coherent data-driven approach that combines methods from time series analysis, dimensionality reduction, and network science to cluster productivity trajectories based on their pairwise similarities. Unlike most previous works, our approach considers trajectories individually, accounts for discipline-specific inflation of productivity [30, 31, 18], the noisy nature of individual productivity trajectories, and possible cohort effects. Importantly, we do not explicitly assume one or a set of predetermined shapes for the productivity curves, which allows us to discern the natural emergence of universal patterns of productivity in scientific careers. Our research identifies productivity patterns that have been only qualitatively hypothesized [23] or found in studies based on aggregated data [23, 12, 20, 21, 13, 17]. In particular, we identify six categories of productivity trajectories: constant, u-shaped, decreasing, periodic, increasing, and canonical, with the latter two categories describing almost three-fourths of researchers. Increasing trajectories are much more frequent among early-career researchers than among senior researchers (45% vs. 19%), while canonical curves are much more prevalent among senior researchers than among younger scholars (65% vs. 27%). However, the initial career years of senior researchers are categorized as increasing trajectories with slightly less prevalence than those found for younger researchers. Only a small fraction of senior researchers with initially increasing productivity trends is able to maintain this pattern, while the majority of the remainder progresses to canonical trajectories. This result highlights the importance of considering cohort and size effects when investigating productivity trajectories, and it indicates that young researchers characterized by increasing trajectories may also progress to canonical patterns in the future.
In what follows, we present these results in detail, and then discuss the influence of funding allocation, tenure positions, and job security in research on the emergence of productivity patterns. We also caution against widely held but fixed and oversimplified assumptions associated with scientific careers, in the hope that the reported universal patterns will open the door for more inclusive and improved evaluation of research productivity.
Results
Our results are based on the academic curricula of 8,493 Brazilian researchers from 56 disciplines who hold the CNPq Research Productivity Fellowship (see Methods for details). This traditional fellowship aims to support the scientific enterprise and has been awarded to scholars producing high-quality research since the 1970s. Scholars holding this fellowship are commonly considered among the elite of Brazilian scientists. All curricula vitae were collected from the Lattes platform (Plataforma Lattes, a widely used governmental curriculum platform in Brazil) where CNPq fellows are required to keep their complete and up-to-date records for maintaining or applying for the fellowship. Compared to other databases often used in science of science studies, our dataset has the main advantage of not suffering from author name disambiguation issues as well as it offers a systematic coverage of scientists across the country. We construct raw time series of yearly productivity (number of publications per year) for all researchers, assuming that each career starts after doctorate completion. The researchers in our study have career lengths of at least ten years (the same threshold used by Way et al. [25]), and the median career length is 17 years (Fig. S1 [32]).
We do not directly use raw productivity series in our analysis. Instead, we take into account three characteristics that may hinder the identification of the most common productivity curves: inflation, different scales, and the noisy nature of productivity series. Scientific productivity has been rising worldwide over the years [30, 31, 18], and the researchers in our study show an overall increase in productivity of approximately papers per year per decade. This inflation is also discipline-specific (Figs. S2 and S3 [32]). To account for inflation effects, we first deflate the productivity series using the yearly average values of each discipline [33], such that the deflated productivity represents the re-scaled number of papers per year as if they were published in 2015. Second, to make productivity trajectories comparable among researchers, we calculate standard score values (-scores) of productivity relative to each researcher from the deflated productivity series. The -scores quantify how many standard deviation units researchers perform above or below their own average productivity and make all time series comparable in scale. Productivity series also have an intrinsic noisy nature that reflects the complex processes involved in producing and publishing scientific papers. The publication year often does not mark the actual completion time of an article, as most papers are not promptly accepted for publication. Thus, lastly, we apply a Gaussian filter to the -scores productivity series to account for these random fluctuations.
After obtaining deflated, standardized, and smoothed productivity curves, we apply the dynamic time warping (DTW) algorithm [34] to estimate the similarities among all pairs of researchers’ trajectories. The DTW is a shape-based dissimilarity measure that allows the comparison of time series with different lengths and non-optimal alignment – crucial features for comparing researchers with different career lengths and patterns that can be shifted in time. Next, we use the DTW dissimilarity matrix along with the uniform manifold approximation and projection (UMAP) method [35] to create a network representation of the similarities among researchers’ trajectories. UMAP is a state-of-the-art dimensionality reduction technique based on the mathematical grounds of Riemannian geometry and algebraic topology capable of balancing the emphasis between local and global structures [35]. In short, it creates a graph representation from a dissimilarity matrix of high-dimensional datapoints and projects them into a lower-dimensional space using a force-directed layout algorithm. We focus only on the first step of the UMAP algorithm, mapping our dissimilarity matrix into a network where researchers are represented as nodes and weighted edges connect researchers with similar productivity trajectories. Finally, we apply the Infomap algorithm to identify the community structure of the network created by UMAP, which corresponds to groups of researchers with similar productivity trajectories. A similar approach has been recently and successfully used by Lee et al. [36] to cluster extracellular spike waveforms in a Neuroscience context. All steps used to cluster productivity trajectories are further detailed in the Methods section and illustrated in Fig. S4 [32].
While the final low-dimensional embeddings produced by UMAP are not deterministic (meaning that UMAP yields similar but different embeddings), the network created in its first step is always the same for a fixed dataset. However, the Infomap algorithm is based on probability flows of random walks on the network and produces similar but different network partitions. To account for this non-deterministic nature, we run one thousand realizations of the Infomap algorithm and observe that all partitions are qualitatively comparable. The number of detected communities ranges from 7 to 14, but almost 85% of all realizations yield from 9 to 11 communities, with 10 being the most common number of partitions (34%, Fig. S5 [32]). We select the best partition as the one with the largest silhouette score [37] among all realizations with 10 communities (see Methods for details). We use Infomap because it is one of the best-performing methods for detecting planted partitions in benchmark graphs [38, 39, 40], particularly for undirected and weighted networks as in our case. However, deterministic community detection methods such as the Louvain [41] and the Leiden [42] also generate similar clustering patterns (Figs. S6 and S7 [32]), but with lower silhouette scores (Fig. S8 [32]).
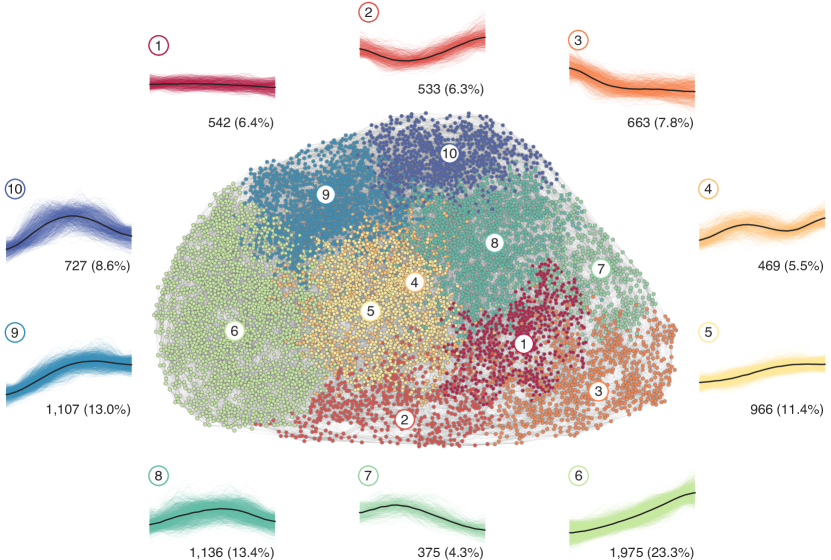
The central panel of Figure 1 displays the network representation produced by UMAP, with different colors indicating the ten communities detected by Infomap’s best partition. Surrounding the network visualization, we plot the productivity trajectories of all researchers in each group, as well as the average behavior of each cluster (labeled 1 to 10). We also re-scale the lengths of researchers’ careers in each group to the unit interval to better visualize trajectories with different lengths. Productivity trajectories in each group display very similar shapes and the silhouette score of the clustering is significantly higher than values obtained by shuffling trajectories among clusters (Fig. S8 [32]). Our best partition not only generates internally consistent groups, but it also yields a significantly higher silhouette score compared to null models in which artificial careers are generated from a binomial distribution and the shuffling of productivity trajectories of each researcher (Fig. S8 [32]). This network representation preserves both local and global structures of the dissimilarity matrix (Fig. S9 [32]), meaning that nodes and clusters that are close together share similar productivity patterns. For example, clusters 7-10 all have an average behavior marked by a peak in productivity and appear adjacent to each other in the network. In contrast, clusters 3 and 6 represent opposite behaviors (increasing vs. decreasing trends) and are therefore located far apart. When visually inspecting productivity patterns over the network representation (see this page for an interactive visualization), we also observe that nodes located close to the frontiers between two or more communities often display more complex productivity patterns that may resemble a mixture of the average behavior of adjacent clusters.
Our analysis uncovers a diverse set of productivity trajectories that go beyond the canonical narrative and include patterns that were only conjectured or observed in studies using aggregated data [23, 12, 20, 21, 13, 17]. A detailed examination of the trajectories and their derivatives (Fig. S10 [32]) allows us to group the ten clusters into six categories: constant (cluster 1), u-shaped (cluster 2), decreasing (cluster 3), periodic-like (cluster 4), increasing (clusters 5 and 6), and canonical-like (clusters 7 to 10) curves. Constant trajectories, which make up 6.4% of researchers, are characterized by stable or slightly decreasing productivity. U-shaped trajectories, accounting for 6.3% of researchers, show a decline before an increase in productivity. Decreasing trajectories, representing 7.8% of researchers, exhibit a sharp decline in the first half of careers followed by an almost constant plateau in productivity. Periodic-like trajectories, which constitute 5.5% of researchers, have a peak before mid-career followed by a decline before another increase in productivity. Together, these patterns represent slightly more than a quarter of researchers, with periodic-like patterns being the least common. As a result, increasing and canonical-like patterns describe almost three-fourths of the researchers in our study. Specifically, 35% of researchers display increasing curves, which are divided into two clusters: one where productivity always increases over careers (cluster 6) and the other exhibiting growing trends with declining rates or approaching a plateau (cluster 5). Canonical-like curves, broadly defined here as careers containing a single peak in productivity (clusters 7 to 10), are the most frequent type of trajectory, comprising 39% of researchers in our dataset. We use the term canonical-like because Lehman’s definition is more restrictive, assuming the canonical narrative as “curves of creativity that rise rapidly in early maturity and then decline slowly after attaining an earlier maximum” [8]. Although this definition is qualitative, one may interpret that solely cluster 7 strictly meets Lehman’s definition, as it is the only cluster that shows a maximum before mid-career (Fig. S11 [32]). The peak positions are indeed one of the most distinct behaviors among clusters 7 to 10, and the reason they emerge as separated clusters (Table S1 [32]).
To validate the robustness of the six categories of productivity trajectories, we perform ten realizations of our clustering procedure using subsamples obtained by randomly dividing our dataset into three equal-sized parts. For every part and realization, we verify that the clusters can be categorized into the same six patterns observed in the complete data. We classify each researcher into one of the six categories in each realization, allowing us to verify the consistency with the classification obtained from the entire dataset. On average, 73% of researchers are assigned to the same category as determined from the full data. The confusion matrix primarily exhibits a diagonal pattern, with inconsistencies occurring mainly when periodic curves are labeled as increasing or canonical trajectories (Fig. S12A [32]). We also calculate the normalized entropy related to the assignment probabilities of each pattern for every researcher across the ten realizations. This analysis reveals that 80% of researchers display normalized entropy below 0.5, indicating low variability in their assigned category (Fig. S12B [32]). Moreover, approximately one-third of researchers exhibit zero entropy, signifying that they are consistently assigned to a single category. We further observe that researchers displaying higher entropy are located in the frontier between two or more clusters (where patterns tend to be more complex) as well as in the region of overlap between the periodic (cluster 4) and increasing with declining rates (cluster 5) trajectories in the network representation (Fig. S12C [32]). These same observations hold true when dividing the dataset into two halves (Fig. S13 [32]).
Additionally, we conduct a human validation where a panel of two experts categorizes 25% of trajectories randomly sampled from our dataset in a stratified manner. They are introduced to an interactive application where -scores and smoothed trajectories are individually shown. Buttons are provided for each category, and an additional button is available when they disagree on the classification, for performing the task. We compare these human-based labels with those determined from our clustering procedure, finding an overall agreement of 73% and a confusion matrix mostly diagonal (Fig. S14A [32]). Inconsistencies occur primarily when experts classify decreasing trajectories as u-shaped curves and periodic trajectories as canonical curves. Periodic and u-shaped curves are also the categories with the highest levels of disagreement between the experts. Among increasing and canonical categories, the increasing with declining rates (cluster 5) and late peak (cluster 9) productivity curves are most frequently confused with each other (Fig. S14B [32]). Similar to the subsampling validation analysis, disagreements between the experts’ classification and our clustering process occur for careers located in the frontier between two or more clusters and in the overlapping region between periodic (cluster 4) and increasing with declining rates (cluster 5) patterns (Fig. S14C [32]).
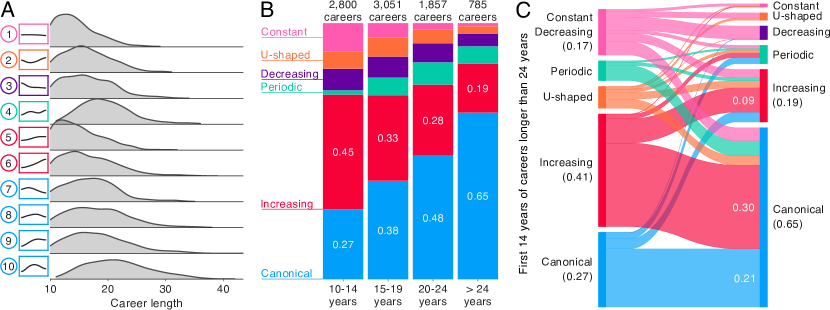
The prevalence of each productivity pattern may vary among academic careers with different lengths. To examine this potential size effect, we estimate the career size distributions of researchers in each cluster. Figure 2A shows that all clusters encompass a broad range of career lengths, but with distinct median career sizes (Table S1 [32]). Constant and increasing curves exhibit the smallest median career sizes (median of 15 years), while canonical and periodic-like trajectories represent more senior researchers (median of 20 years). To identify the most common productivity pattern at each career stage, we group academic careers into four length categories (10-14, 15-19, 20-24, and larger than 24 years) and calculate the prevalence of each pattern. Figure 2B shows that increasing trajectories are the dominant pattern for short careers, accounting for 45% of researchers in the shortest career category. However, increasing curves become less prevalent among researchers with longer careers, representing only 19% of researchers in the longest career category. Canonical-like trajectories present the opposite behavior and are much more prevalent among researchers with longer careers. Only 27% of the researchers with 10-14 career years display canonical-like productivity trajectories, whereas this pattern characterizes 65% of researchers with more than 24 career years. Even when combined, constant, u-shaped, decreasing, and periodic-like careers occur less frequently than increasing or canonical-like curves in all length categories. Still, we observe that constant, u-shaped, and decreasing trajectories are relatively more common among younger researchers, while periodic-like curves appear more often among researchers with careers longer than 14 years.
Overall, we find similar occupation trends when analyzing the individual behavior of clusters comprising increasing and canonical-like curves (Fig. S15 [32]). However, some clusters are more prevalent across the length categories. The always-increasing pattern (cluster 6) is more frequent than the increasing with declining rate pattern (cluster 5) in all length categories, but especially among the most experienced researchers. Almost all researchers exhibiting increasing trajectories with careers longer than 24 years belong to cluster 6. Among the canonical-like curves, the middle and later-career peak patterns of clusters 8 and 9 are the most common behaviors across all length categories, except among the most experienced researchers, for which cluster 10 is the most common. The early-stage peak behavior of cluster 8 is the rarest pattern across all categories, except for the youngest researchers, and it is the only canonical-like curve whose prevalence does not increase with career length. We also obtain similar occupation trends when considering disciplines separately, with only Biochemistry exhibiting an almost constant fraction of increasing productivity curves across the categories of career length. There are however appreciable differences in the prevalence of specific patterns among disciplines (as detailed in Figs. S16 and S17 [32]). For example, canonical-like curves are 8.9 times more frequent than increasing curves among the most experienced mathematicians and only 1.4 times more prevalent among senior biochemists. Conversely, increasing curves are twice as common as canonical-like ones among the youngest mathematicians and chemists and only 1.3 times more prevalent among physicists.
Career length is directly linked to the year of doctorate completion of each researcher (Fig. S18 [32]) and serves as a proxy for grouping different generations of scientists. Indeed, the overwhelming majority of researchers with 10-14 career years concluded their doctorates after the 2000s, while those with more than 24 career years did it before the 1990s. These groups of young and senior scientists represent unique cohorts that are subject to specific socioeconomic conditions, cultural environments, knowledge base of the field, and baseline level of research ability [23, 14]. Therefore, the different prevalence of productivity curves may partially reflect the distinct research and publication cultures of these groups. In particular, the much higher fraction of increasing trajectories among the youngest cohort seems to align with the increasing pressure on scholars to produce in large quantities [27, 28, 29] and with the fact this pressure is considered exceptionally high on young scientists [43]. At the same time, the careers of young researchers cannot be regarded as complete careers as even patterns emerging after 10-14 career years may change over time. For instance, part of the increasing patterns exhibited by young researchers may eventually represent only the beginning of canonical-like productivity curves. The precise identification of generational effects in the prevalence of productivity patterns thus requires a dataset comprising entire careers of different scientist cohorts, which is not the case in our study.
However, we can partially test this hypothesis by analyzing the initial career years of senior scientists and comparing the prevalence of productivity patterns with the youngest cohort. To do this, we apply our clustering approach to the entire dataset, but only consider the initial 14 career years of researchers with careers longer than 24 years. The best Infomap partition is again formed by ten clusters (Figs. S19 and S20 [32]) with average patterns very similar to those reported in Figure 1. This allows us to group them into the same six categories, with only the constant and decreasing patterns (clusters 1 and 2) merged into a single cluster (cluster 1 of Fig. S19 [32]). Figure 2C shows the prevalence of productivity patterns associated with the beginning of senior careers and the patterns they evolve to when considering the entire length of senior careers (Fig. S21 [32] details the transitions among individual clusters). Corroborating our hypothesis, we observe that almost half of the senior careers classified as canonical are classified as increasing curves in their beginnings. Only 9% of senior researchers exhibiting early-career increasing productivity sustain this pattern with career progression. Conversely, 78% of senior researchers with canonical-like early careers maintain this pattern in later career stages. Moreover, about 21% of senior careers classified as canonical show an initial part compatible with constant/decreasing, periodic, and u-shaped patterns. These rarer transitions are usually associated with careers localized in the border between two or more communities, representing thus more complex productivity patterns (see Fig. S22 [32] for examples).
The behavior of senior scientists may not predict the future for young scholars, but our findings suggest that the high prevalence of increasing productivity patterns among young researchers reflects the incomplete nature of their careers. If early-career researchers follow their senior counterparts, much more researchers will likely have productivity patterns represented by canonical curves in the future. However, we cannot ignore the potential effects of generational differences when comparing the productivity patterns of young researchers even with the initial career years of senior researchers. Indeed, our results show that increasing patterns are 10% more common among young researchers, while periodic-like curves are three times more frequent in the initial years of senior careers (Figs. 2B and 2C). At the same time, these early differences are relatively small, suggesting that the structural changes in the scientific enterprise [44, 29, 5] may have only a minor impact on researchers’ productivity trajectories.
Discussion and Conclusions
We have performed a comprehensive analysis of productivity trajectories for over eight thousand researchers from 56 different research disciplines. Unlike previous studies that have focused on specific disciplines [21, 20, 25, 19], inferred typical productivity curves from averaged behavior [8, 9, 10, 22, 11, 23, 12, 21, 20, 13, 14, 16, 17, 19], or assumed particular forms of productivity trajectories beforehand [14, 15, 24, 25], we have evaluated pairwise similarities among these trajectories, and accounted for inflation, different scales, and random fluctuations of productivity curves. Moreover, our research uses a comprehensive dataset with no issues involving name disambiguation that offers systematic coverage of Brazilian scientists across different areas and generations, which in turn contributes to reducing the so-called “WEIRD bias” [45] in science of science studies. Our approach revealed clusters of productivity trajectories that are internally consistent, more cohesive than null models, and robust against data subsampling, as well as that are in semantic agreement with human validation. In addition, our clustering procedure resulted in a network representation where researchers and clusters with similar productivity patterns are closely connected. We have uncovered a range of productivity patterns that go beyond the traditional narrative and can be classified into six universal categories: constant, u-shaped, decreasing, periodic-like, increasing, and canonical-like curves. When combined, constant, u-shaped, decreasing, and periodic-like curves account for slightly more than a quarter of researchers, while the majority of researchers, nearly three-fourths, exhibit canonical-like or increasing patterns.
We have also investigated possible career length and cohort effects on the prevalence of the different productivity patterns. This analysis has revealed that all clusters encompass a broad range of career lengths, but increasing productivity curves are the dominant pattern among researchers with shorter careers, who are also younger scholars, while canonical-like curves are the most common pattern among senior researchers. We have hypothesized that the higher incidence of increasing productivity patterns among younger scholars may be linked to changes in the scientific enterprise, such as increased collaboration [26, 46] and pressure on scholars (particularly on young scientists [43]) to publish in large quantities [44, 29, 5], but also to the fact that early-career patterns may evolve as young researchers progress in their careers. While identifying clear generational effects in the prevalence of productivity patterns would require data on the entire careers of different scientist cohorts, we have partially tested our hypotheses by comparing the initial career years of senior scientists with the careers of young scholars. These results showed that almost half of the canonical-like curves among senior researchers are classified as increasing patterns in the beginning. Conversely, only 9% of senior researchers who exhibited early-career increasing productivity sustained this pattern as their careers progressed. The relatively small differences in the prevalence of patterns observed between young researchers and the initial career years of senior researchers suggest that the behavior observed for senior scientists does not necessarily dictate the career trajectory of young scholars. However, if early-career researchers follow the same trajectory as their senior counterparts, the prevalence of canonical-like curves is likely to be underestimated.
But even if possibly underestimated, canonical-like curves – broadly defined here as careers with a single peak in productivity – are the most prevalent productivity pattern, accounting for almost two-fifths of researchers. While this result somehow supports the canonical narrative of scientific productivity, we have also observed that less than 5% of researchers in our study strictly meet Lehman’s “canonical productivity narrative” [8] and exhibit productivity curves that “rise rapidly in early maturity and then decline slowly after attaining an earlier maximum” [8]. These researchers belong to cluster 7, which is only one of four clusters that is classified as canonical-like, have median career lengths of 17 years, and present a peak in productivity approximately 6 years after their doctorates. The other three clusters (8, 9, and 10) account for almost 90% of researchers with canonical-like patterns, who have slightly larger median career lengths but a peak in productivity around 12 years after their doctorates. Although the “earlier maximum” in Lehman’s definition is subjective, our research shows that the peak in productivity is more likely to occur around mid-career rather than early-career. Additionally, the rise and decline in the productivity of researchers observed in our study is much more varied than in Lehman’s definition.
We have further revealed that, when focusing on the initial career years, most researchers in our study exhibit an increasing productivity pattern. This initial trend emerges among clusters 4 to 10 and accounts for approximately 80% of them. The high incidence of increasing productivity patterns in early-career stages can likely be attributed to the way funding and hiring decisions are made in academia. Research has shown that productivity plays a significant role in determining job placement [2] and access to financial resources needed to continue research [47, 48, 49, 4, 50, 5]. Therefore, it is likely that the prevalence of early-rising trends in productivity reflects the tendency to reward more productive researchers. On the other hand, about half of the researchers in our sample (those belonging to clusters 7 to 10 and 3) exhibit a decline in productivity that is more often observed after mid-career stages. Several hypotheses may account for this pattern. For example, the consolidation of academic prestige in late-career stages may reduce the urgency of maintaining high productivity [51]. The tension between time spent performing scientific research, which is arguably often larger for young researchers, and administrative tasks, which in turn is usually larger for senior researchers, may also be partly responsible for the decline in productivity during late-career stages [52, 53, 17]. Parenthood may also contribute to a drop in productivity since time spent on research is typically reduced in such circumstances [54]. Finally, the hardly avoidable decline in intellectual potential over time may also be related to a reduction in productivity with career progression [15].
In conclusion, our research reveals that the scientific productivity of a significant number of researchers increases during their early careers and declines after reaching mid-career. However, the presence of six universal productivity patterns and the wide variability among different cohorts caution against relying on stereotypes in funding and tenure decisions. We hope that our findings will inspire further investigations into the characteristics that define each cluster of researchers and contribute to a more comprehensive and inclusive evaluation of scholarly performance.
Methods
Data
The dataset used in our study was extracted from the Lattes Platform (Plataforma Lattes) [55]. This platform is hosted and maintained by the Brazilian National Council for Scientific and Technological Development (CNPq – Conselho Nacional de Desenvolvimento Científico e Tecnológico), a governmental agency that promotes scientific and technological research in Brazil. The Lattes Platform contains a consolidated national database of curriculum vitae (CV), research groups, and institutions in a standardized form. Furthermore, the Lattes CV has become the official curriculum vitae for Brazilian researchers and is widely used by science funding agencies and universities in performance evaluations. The platform contains a wide range of information for each researcher, including basic data such as discipline, workplace history, and current affiliation, as well as more detailed information such as academic mentorship relationships and scientific production records. Compared to other datasets, our data based on the Lattes Platform has the main advantage of solving issues related to author name disambiguation as well as ensuring comprehensive coverage of scientists across diverse academic disciplines.
We initially selected the CVs of the 14,487 researchers from 88 disciplines holding the CNPq Research Productivity Fellowship as of May 2017. The total scientific output of these researchers comprises 1,121,652 publications. The CNPq fellowship has been awarded to scholars presenting outstanding scientific impact and innovation in their respective areas of knowledge since the 1970s. These researchers, commonly regarded as the elite of the Brazilian scientific community, are required to maintain a complete and up-to-date record of their research activities on the Lattes Platform. To construct the productivity trajectories, we collected the yearly publication records of each researcher starting from the doctorate completion date. We filled in missing information using the CrossRef API (via the DOI reference of the papers) and filtered out researchers with missing doctorate conclusion date or discipline information. Additionally, we only considered researchers with ten or more career years, the same threshold used by Way et al. [25].
Deflated, standardized, and smoothed productivity series
The volume of scientific production has been consistently increasing over time, as observed in both individual and aggregate productivity levels [30, 31, 18]. However, this increase in productivity, or productivity inflation, does not affect all disciplines equally and is likely influenced by varying publication practices among them [56, 57, 18]. In our study, we found that researchers present an overall rise in productivity of approximately 0.8 papers/year per decade, and this inflation varies among disciplines (Figs. S2 and S3 [32]). For example, while productivity has increased by approximately 2.1 papers/year per decade among researchers working in medicine, it has only risen by approximately 0.7 papers/year per decade among physicists. To account for this discipline-specific inflation, we followed Petersen et al. [33] and calculated a deflated measure of productivity defined as
where is the raw productivity of researcher in year and is the average value of productivity of his/her discipline in year . We used the Huber robust estimator [58] for location (as implemented in the Python package statsmodels [59]) to estimate the average productivity of each discipline and account for outlier observations (Fig. S23 [32]). Additionally, we only estimated the average productivity of disciplines for years containing the publication of records of at least 50 researchers, discarding all researchers with at least one year without their discipline’s average productivity estimate. This approach yielded our final dataset comprising the deflated productivity trajectories of 8,493 researchers divided into 56 research disciplines (Fig. S24 [32]).
To make the deflated productivity trajectories comparable in scale, we further standardized their values by calculating the -score productivity for researcher in year via
where is the average and is the standard deviation of deflated productivity along the entire career of researcher . The noisy nature of productivity trajectories (Fig. S25 [32]) also poses a challenge in estimating dissimilarity measures among them. These fluctuations reflect the intrinsic nature of scientific publishing, as every work goes through a time-consuming and non-deterministic process of reasoning, testing, writing, and peer-review evaluation [60]. The exact point in time a paper is published often does not reflect the actual completion time of the work. To address this issue, we applied a Gaussian smoothing filter to all -score productivity series (as implemented in the Python SciPy package [61]). This filter assigns Gaussian weights with a standard deviation centered on each data point and uses these weights to average the time series values through a convolution process. The parameter controls the degree of smoothing and defines a time scale for averaging the productivity values over neighboring years (Fig. S26 [32]). We used years for all results in the main text, but similar clustering patterns were obtained when varying from to years in half-year intervals (Figs. S27, S28, and S29 [32]). By applying the Gaussian filter on the -score productivity trajectories, we ensured that the smoothing was uniformly applied across researchers with different productivity variability.
Time series clustering
We estimated the similarities between all pairs of pre-processed productivity trajectories using the dynamic time warping (DTW) algorithm [34] (as implemented in the Python package dtaidistance [62]). The DTW is a shape-based dissimilarity measure that allows for optimal alignment of sequences by creating a non-linear warping path between them, providing more flexibility for matching sequences that show similar patterns but are shifted in time. The resulting dissimilarity matrix was then used as a precomputed metric in the uniform manifold approximation and projection (UMAP) dimensionality reduction algorithm [35] (as implemented in the Python package umap [63] and with default parameters). UMAP first creates a fuzzy simplicial complex, which can be represented as a weighted graph, and then projects the data into a lower-dimensional space via a force-directed graph layout algorithm. The first step of the algorithm thus creates a network representation of the dissimilarity matrix, where nodes represent researchers and weighted edges connect researchers with similar productivity trajectories.
Following the recent work of Lee et al. [36] in Neuroscience, we used only the network topological structure and discarded the low-dimensional representation produced by UMAP, mapping thus the clustering of time series into a community detection problem. Specifically, we applied the map equation [64, 65] and the hierarchical map equation [66], the so-called Infomap approach, to determine the community structure of the UMAP network. Infomap is a network clustering technique based on concepts of information theory that relies on random walks as a proxy for information flow over the network. This method is one of the best-performing in detecting planted partitions in benchmark graphs [38, 39, 40] and is capable of identifying network partitions (clusters and sub-clusters) where the random walker is more likely to spend time. The map equation and the hierarchical map equation represent the theoretical limits of how concisely one can describe an infinite random walk on the network (the description length) with a particular partition configuration. By minimizing the map equation or the hierarchical map equation, Infomap uncovers the community structure of the network. We used the Infomap implementation available in the Python package infomap [67] with default parameters and tested both the standard two-level model and the hierarchical model. We verified that the hierarchical map equation more effectively estimates the network’s modular structure (that is, it yields smaller description lengths when compared with the two-level model) and was therefore chosen as our clustering algorithm. We ran one thousand realizations of the Infomap algorithm by varying the seed parameter in each iteration and found visually similar community structures. However, we defined the best network partition as the one maximizing the silhouette coefficient [37] among all partitions with the modal number of clusters. Finally, we verified that the Louvain [41] and the Leiden [42] (as used by Lee et al. [36]) community detection algorithms also resulted in similar clustering patterns (Figs. S6 and S7 [32]).
Acknowledgements.
The authors acknowledge the support of the Coordenação de Aperfeiçoamento de Pessoal de Nível Superior (CAPES), the Conselho Nacional de Desenvolvimento Científico e Tecnológico (CNPq – Grant 303533/2021-8), and the Slovenian Research Agency (Grants J1-2457 and P1-0403).References
- Merton and Storer [1973] R. Merton and N. Storer, The Sociology of Science: Theoretical and Empirical Investigations (University of Chicago Press, 1973).
- Clauset et al. [2015] A. Clauset, S. Arbesman, and D. B. Larremore, Systematic inequality and hierarchy in faculty hiring networks, Science Advances 1, e1400005 (2015).
- Bertsimas et al. [2015] D. Bertsimas, E. Brynjolfsson, S. Reichman, and J. Silberholz, Or forum–tenure analytics: Models for predicting research impact, Operations Research 63, 1246 (2015).
- Stephan [2015] P. Stephan, How Economics Shapes Science (Harvard University Press, 2015).
- Meirmans et al. [2019] S. Meirmans, R. K. Butlin, A. Charmantier, J. Engelstädter, A. T. Groot, K. C. King, H. Kokko, J. M. Reid, and M. Neiman, Science policies: How should science funding be allocated? An evolutionary biologists’ perspective, Journal of Evolutionary Biology 32, 754 (2019).
- Fortunato et al. [2018] S. Fortunato, C. T. Bergstrom, K. Börner, J. A. Evans, D. Helbing, S. Milojević, A. M. Petersen, F. Radicchi, R. Sinatra, B. Uzzi, A. Vespignani, L. Waltman, D. Wang, and A.-L. Barabási, Science of science, Science 359, eaao0185 (2018).
- Liu et al. [2023] L. Liu, B. F. Jones, B. Uzzi, and D. Wang, Data, measurement and empirical methods in the science of science, Nature Human Behaviour 7, 1046 (2023).
- Lehman [1953] H. C. Lehman, Age and Achievement, Vol. 33 (Princeton University Press, 1953).
- Lehman [1954] H. C. Lehman, Men’s creative production rate at different ages and in different countries, The Scientific Monthly 78, 321 (1954).
- Dennis [1956] W. Dennis, Age and productivity among scientists, Science 123, 724 (1956).
- Behymer and Blackburn [1975] C. E. Behymer and R. T. Blackburn, Environmental and Personal Attributes Related to Faculty Productivity (ERIC Clearinghouse, 1975).
- Cole [1979] S. Cole, Age and scientific performance, American journal of sociology 84, 958 (1979).
- Horner et al. [1986] K. L. Horner, J. P. Rushton, and P. A. Vernon, Relation between aging and research productivity of academic psychologists, Psychology and Aging 1, 319 (1986).
- Levin and Stephan [1991] S. G. Levin and P. E. Stephan, Research productivity over the life cycle: Evidence for academic scientists, The American Economic Review 81, 114 (1991).
- Simonton [1997] D. K. Simonton, Creative productivity: A predictive and explanatory model of career trajectories and landmarks, Psychological Review 104, 66 (1997).
- Gingras et al. [2008] Y. Gingras, V. Lariviere, B. Macaluso, and J.-P. Robitaille, The effects of aging on researchers’ publication and citation patterns, PLOS ONE 3, e4048 (2008).
- Rørstad and Aksnes [2015] K. Rørstad and D. W. Aksnes, Publication rate expressed by age, gender and academic position – a large-scale analysis of norwegian academic staff, Journal of Informetrics 9, 317 (2015).
- Sunahara et al. [2021] A. S. Sunahara, M. Perc, and H. V. Ribeiro, Association between productivity and journal impact across disciplines and career age, Physical Review Research 3, 033158 (2021).
- Spake et al. [2022] C. S. Spake, V. G. Zeyl, J. W. Crozier, V. Rao, and L. K. Kalliainen, An analysis of publication trajectory in plastic surgery across the decades, Journal of Plastic, Reconstructive & Aesthetic Surgery 75, 439 (2022).
- Over [1982a] R. Over, Does research productivity decline with age?, Higher Education 11, 511 (1982a).
- Over [1982b] R. Over, Is age a good predictor of research productivity?, Australian Psychologist 17, 129 (1982b).
- Pelz and Andrews [1966] D. C. Pelz and F. M. Andrews, Scientists in Organizations: Productive Climates for Research and Development (John Wiley, 1966).
- Bayer and Dutton [1977] A. E. Bayer and J. E. Dutton, Career age and research-professional activities of academic scientists, The Journal of Higher Education 48, 259 (1977).
- Rinaldi et al. [2000] S. Rinaldi, R. Cordone, and R. Casagrandi, Instabilities in creative professions: A minimal model, Nonlinear Dynamics, Psychology, and Life Sciences volume 4, 255 (2000).
- Way et al. [2017] S. F. Way, A. C. Morgan, A. Clauset, and D. B. Larremore, The misleading narrative of the canonical faculty productivity trajectory, Proceedings of the National Academy of Sciences 114, E9216 (2017).
- Wuchty et al. [2007] S. Wuchty, B. F. Jones, and B. Uzzi, The increasing dominance of teams in production of knowledge, Science 316, 1036 (2007).
- Miller et al. [2011] A. N. Miller, S. G. Taylor, and A. G. Bedeian, Publish or perish: Academic life as management faculty live it, Career development international 16, 422 (2011).
- Van Dalen and Henkens [2012] H. P. Van Dalen and K. Henkens, Intended and unintended consequences of a publish-or-perish culture: A worldwide survey, Journal of the American Society for Information Science and Technology 63, 1282 (2012).
- Schimanski and Alperin [2018] L. A. Schimanski and J. P. Alperin, The evaluation of scholarship in academic promotion and tenure processes: Past, present, and future, F1000Research 7, 1 (2018).
- de Solla Price [1963] D. J. de Solla Price, Little Science, Big Science (Columbia University Press, 1963).
- Sinatra et al. [2016] R. Sinatra, D. Wang, P. Deville, C. Song, and A.-L. Barabási, Quantifying the evolution of individual scientific impact, Science 354, aaf5239 (2016).
- [32] Supplemental Material for Figs. S1–S29 and Table S1.
- Petersen et al. [2019] A. M. Petersen, R. K. Pan, F. Pammolli, and S. Fortunato, Methods to account for citation inflation in research evaluation, Research Policy 48, 1855 (2019).
- Sakoe and Chiba [1978] H. Sakoe and S. Chiba, Dynamic programming algorithm optimization for spoken word recognition, IEEE Transactions on Acoustics, Speech, and Signal Processing 26, 43 (1978).
- McInnes et al. [2018a] L. McInnes, J. Healy, and J. Melville, UMAP: Uniform Manifold Approximation and Projection for Dimension Reduction, ArXiv 10.48550/arXiv.1802.03426 (2018a).
- Lee et al. [2021] E. K. Lee, H. Balasubramanian, A. Tsolias, S. U. Anakwe, M. Medalla, K. V. Shenoy, and C. Chandrasekaran, Non-linear dimensionality reduction on extracellular waveforms reveals cell type diversity in premotor cortex, Elife 10, e67490 (2021).
- Rousseeuw [1987] P. J. Rousseeuw, Silhouettes: A graphical aid to the interpretation and validation of cluster analysis, Journal of Computational and Applied Mathematics 20, 53 (1987).
- Lancichinetti and Fortunato [2009] A. Lancichinetti and S. Fortunato, Community detection algorithms: A comparative analysis, Physical Review E 80, 056117 (2009).
- Fortunato [2010] S. Fortunato, Community detection in graphs, Physics Reports 486, 75 (2010).
- Fortunato and Hric [2016] S. Fortunato and D. Hric, Community detection in networks: A user guide, Physics Reports 659, 1 (2016).
- Blondel et al. [2008] V. D. Blondel, J.-L. Guillaume, R. Lambiotte, and E. Lefebvre, Fast unfolding of communities in large networks, Journal of Statistical Mechanics: Theory and Experiment 2008, P10008 (2008).
- Traag et al. [2019] V. A. Traag, L. Waltman, and N. J. Van Eck, From Louvain to Leiden: Guaranteeing well-connected communities, Scientific Reports 9, 1 (2019).
- Powell [2016] K. Powell, Young, talented and fed-up: Scientists tell their stories, Nature 538, 446 (2016).
- Moher et al. [2018] D. Moher, F. Naudet, I. A. Cristea, F. Miedema, J. P. Ioannidis, and S. N. Goodman, Assessing scientists for hiring, promotion, and tenure, PLOS Biology 16, e2004089 (2018).
- Arnett [2016] J. J. Arnett, The neglected 95%: Why American psychology needs to become less American, American Psychologist 63, 602 (2016).
- Danús et al. [2023] L. Danús, C. Muntaner, A. Krauss, M. Sales-Pardo, and R. Guimerà, Differences in collaboration structures and impact among prominent researchers in europe and north america, EPJ Data Science 12, 12 (2023).
- [47] Nuffield Council on Bioethics. The findings of a series of engagement activities exploring the culture of scientific research in the UK, https://www.nuffieldbioethics.org/assets/pdfs/The-culture-of-scientific-research-report.pdf, [Acessed: January 2023].
- [48] San Francisco Declaration on Research Assessment, https://sfdora.org/read/, [Accessed: January 2023].
- Hicks et al. [2015] D. Hicks, P. Wouters, L. Waltman, S. D. Rijcke, and I. Rafols, Bibliometrics: The Leiden Manifesto for research metrics, Nature 520, 429 (2015).
- Wilsdon [2016] J. Wilsdon, The Metric Tide: Independent Review of the Role of Metrics in Research Assessment and Management (Sage, 2016).
- Bourdieu [1975] P. Bourdieu, The specificity of the scientific field and the social conditions of the progress of reason, Social Science Information 14, 19 (1975).
- Bourdieu [1991] P. Bourdieu, The peculiar history of scientific reason, Sociological Forum 6, 3 (1991).
- Bourdieu [2004] P. Bourdieu, Science of Science and Reflexivity (Polity Press, 2004).
- Morgan et al. [2021] A. C. Morgan, S. F. Way, M. J. Hoefer, D. B. Larremore, M. Galesic, and A. Clauset, The unequal impact of parenthood in academia, Science Advances 7, eabd1996 (2021).
- [55] Lattes Plataform, http://lattes.cnpq.br, [Acessed: January 2023].
- Dundar and Lewis [1998] H. Dundar and D. R. Lewis, Determinants of research productivity in higher education, Research in Higher Education 39, 607 (1998).
- Foster et al. [2015] J. G. Foster, A. Rzhetsky, and J. A. Evans, Tradition and innovation in scientists’ research strategies, American Sociological Review 80, 875 (2015).
- Huber [2004] P. J. Huber, Robust Statistics (Wiley, 2004).
- Seabold and Perktold [2010] S. Seabold and J. Perktold, statsmodels: Econometric and statistical modeling with Python, in 9th Python in Science Conference (2010).
- Björk and Solomon [2013] B.-C. Björk and D. Solomon, The publishing delay in scholarly peer-reviewed journals, Journal of Informetrics 7, 914 (2013).
- Virtanen et al. [2020] P. Virtanen et al., SciPy 1.0: Fundamental Algorithms for Scientific Computing in Python, Nature Methods 17, 261 (2020).
- [62] W. Meert, K. Hendrickx, and T. Van Craenendonck, dtaidistance.
- McInnes et al. [2018b] L. McInnes, J. Healy, N. Saul, and L. Grossberger, UMAP: Uniform Manifold Approximation and Projection, The Journal of Open Source Software 3, 861 (2018b).
- Rosvall and Bergstrom [2008] M. Rosvall and C. T. Bergstrom, Maps of random walks on complex networks reveal community structure, Proceedings of the National Academy of Sciences 105, 1118 (2008).
- Rosvall et al. [2009] M. Rosvall, D. Axelsson, and C. T. Bergstrom, The map equation, The European Physical Journal Special Topics 178, 13 (2009).
- Rosvall and Bergstrom [2011] M. Rosvall and C. T. Bergstrom, Multilevel compression of random walks on networks reveals hierarchical organization in large integrated systems, PLOS ONE 6, e18209 (2011).
- [67] Infomap, https://www.mapequation.org/infomap/, [Acessed: January 2023].
See pages 1-29 of supplementary.pdf See pages 30 of supplementary.pdf