Measuring Adversarial Datasets
Abstract
In the era of widespread public use of AI systems across various domains, ensuring adversarial robustness has become increasingly vital to maintain safety and prevent undesirable errors. Researchers have curated various adversarial datasets (through perturbations) for capturing model deficiencies that cannot be revealed in standard benchmark datasets. However, little is known about how these adversarial examples differ from the original data points, and there is still no methodology to measure the intended and unintended consequences of those adversarial transformations. In this research, we conducted a systematic survey of existing quantifiable metrics that describe text instances in NLP tasks, among dimensions of difficulty, diversity, and disagreement. We selected several current adversarial effect datasets and compared the distributions between the original and their adversarial counterparts. The results provide valuable insights into what makes these datasets more challenging from a metrics perspective and whether they align with underlying assumptions.
Measuring Adversarial Datasets
Yuanchen Bai††thanks: equal contribution. Raoyi Huang∗ Vijay Viswanathan Tzu-Sheng Kuo Tongshuang Wu Carnegie Mellon University, Pittsburgh PA, USA ybai2@andrew.cmu.edu raoyih@andrew.cmu.edu vijayv@cs.cmu.edu tzushenk@cs.cmu.edu sherryw@cs.cmu.edu
1 Introduction
NLP models that exceed on standard benchmarks can exhibit unexpected errors when tested on different distributions (Shen et al., 2021; Ganin and Lempitsky, 2015; Luo et al., 2019; Blitzer et al., 2006; Ganin et al., 2017). In particular, a subcategory of distribution shift, adversarial attacks, tends to cause severe safety concerns: models can be over- or under- sensitive to small changes on the input, and a seemingly reliable model may be easily broken under adversarial attack (e.g., large language models can be used to generate misinformation if we simply change a knowledge context in the prompt Qian et al. (2023).
To flag such model behaviors, the research community has created an extensive list of adversarial datasets (and methods for generating them), e.g., TextFooler (Jin et al., 2020), Adversarial GLUE (Shen et al., 2021) and Adversarial NLI (Nie et al., 2020). Most of them are created by perturbing existing benchmark dataset throughs certain pre-defined operations (e.g., switching synonyms, adding or removing negations, changing the time). Indeed, these datasets can effectively capture model vulnerability — model performance tends to decrease significantly on this data compared to performance on the original benchmark. Even ChatGPT111https://openai.com/blog/chatgpt, a highly competent model by many measures, still lacks robustness to adversarial attacks Wang et al. (2023); Liu et al. (2023).
| Category | Diversity | Difficulty | Disagreement |
|---|---|---|---|
| Text-Level |
Frequency Distribution
Redundancy Keyword Extraction Data Density Topic Diversity/Density Fairness-related Diversity |
Lexical Complexity
Long Text Structure Grammaticality Text Coherence Topic Distribution Usable Information Confidence Spurious Bias |
Label Disagreement |
| Annotation-Level | Demographic Diversity | Subjective Ambiguity | Inter-Annotator |
Despite its importance, there is currently no methodology to measure the intended and unintended consequences of adversarial transformations on a dataset, such as how those adversarial perturbations change the data distribution. This is partly caused by a lack of holistic methods for evaluating dataset properties — when we create and evaluate a dataset, what dimensions should we compare it with existing datasets? While there exist ample surveys on metrics that capture model performances (Liang et al., 2022; Lee et al., 2022), surveys on metrics for describing data are more sparse and tend to focus on qualitative descriptions (e.g., Mitchell et al., 2023) than quantitative measures. However, such quantification is important for contextualizing the usefulness of adversarial data. If a method changes the distribution too aggressively (e.g., an over-emphasis on a particular domain or vocabulary that the model is not familiar with), evaluations on these datasets may be meaningless Bowman (2021).
In this work, we explore quantitatively comparing adversarial data points (created through perturbation) with their original counterparts in a systematic way. We first conduct a systematic survey on existing quantifiable metrics that describe text data instances, broadly dividing them into three crucial dimensions: difficulty, diversity, and disagreement Mitchell et al. (2023). We then run a subset of relevant metrics on two adversarial datasets, assessing the characteristics of these datasets and distribution patterns.
We find that a comprehensive frame of meta-evaluation metrics, specifically focusing on difficulty, diversity, and disagreement, provides valuable insights for adversarial research. Through experimentation on our selected datasets, these metrics offer a detailed profiling of dataset attributes. A deeper exploration of these metrics at the characteristic level proves essential for tasks like dataset curation, model performance analysis, attack scenario design, and controlled experimental setups.
2 Metrics
Inspired by Mitchell et al. (2023), we survey existing metrics on datasets from three dimensions: difficulty, diversity, and disagreement. The challenges in this literature survey involve: distinguishing between dataset and text instance metrics, necessitating a meticulous examination of full-text content to identify metrics instead of relying solely on keyword searches, addressing the interdisciplinary nature of applicable metrics, and, as a result, not limiting them to specific paper venues. Thus, we apply the method of detecting anchor papers and snowball sampling on papers citing relevant literature. We finally compiled a set of 52 papers and several websites. The metrics are selected based on their widespread usage, state-of-the-art status, or high ranking in benchmarks. We then manually categorized the related metrics into the three dimensions above as shown in Table 1. The items listed in the table are middle-level categorizations and more details can be found Appendix A. Note that as shown in Table 1, these metrics are divided into text- and annotator- levels, as both instances and people who create them change the data distribution.
-
•
Diversity characterizes the data variety in different aspects such as topics and lexicons and granular levels such as samples or corpus. A more diverse dataset usually covers a wider range of topics and contexts that represent the complexity of real-world application scenarios better, thus evaluating the model generalizability (Gururangan et al., 2018).
-
•
Difficulty intuitively represents the hardness of learning an instance. It can be influenced by various factors, including whether a sentence is readable (e.g., lexical complexity (Pires et al., 2017) or text coherence Vadlapudi and Katragadda (2010)) and what it talks about (topic distribution); In the model testing context, it can also be reflected in certain model behaviors like confidence or whether any spurious bias is detected.
-
•
Disagreement refers to the variability of the assigned label (Swayamdipta et al., 2020). It can emerge both among labelers, different models, and models’ decisions among epochs. What is worth noticing is that labeler disagreements can provide crucial insights into data reliability and diversity issues (Aroyo et al., 2023).
The metrics we will discuss include the traditional ones and new ones and span over applied statistics, linguistics, and natural language processing. We are not aimed at an exhaustive list of metrics but to show the depth, breadth, and significance of them in texts and datasets inspection and their insights for enhancing model adversarial robustness.
3 Experiment
Dataset
We picked two textual datasets that have pairs of original instances and perturbed ones for model evaluation:
-
•
LLM-knowledge-conflict (Xie et al., 2023), a dataset that investigates the knowledge conflicts of LLMs. They construct alternative context paragraphs for question-answering tasks by perturbing an LLM-generated paragraph that represents the models’ parametric memory. We rely on its data points on StrategyQA generated using ChatGPT.
-
•
IMDB Sentiment Contrast Set Kaushik et al. (2019), a dataset constructed by having crowdworkers manually edit IMDB movie reviews for flipping their labels with minimal perturbation. It is one of the contrast sets generated in the paper based on the concept of models’ decision boundaries and has been proven to be more challenging for the models.
Both datasets focus on higher-level perturbations; We believe they have a higher tendency to change the data distribution compared to lower-level local changes like synonym replacement.
For both two datasets, we compute five metrics from the difficulty level (coherence, perplexity, FRE readability score, semantic noise, and semantic clarity), four metrics from the diversity level (sentence, word, syllable and topic number) and one metric from the disagreement level (variance). For IMDB contrast set, we further compute PVI and assess spurious bias. The referred literature and computation methods are illustrated in the next subsection in detail.
3.1 Metrics Implementation
We have carefully selected methods of calculating metrics across three dimensions (Table 3, 4, 5), which can be found in Appendix B with more details. We have also implemented them as APIs to make them more convenient for other reference, released for the public in a GitHub repository222https://github.com/BYC-Sophie/TextMetrics.
4 Results
While IMDB datasets perturb mostly at the high level, Conflict-LLM datasets perturb both high-level and low-level textual information.
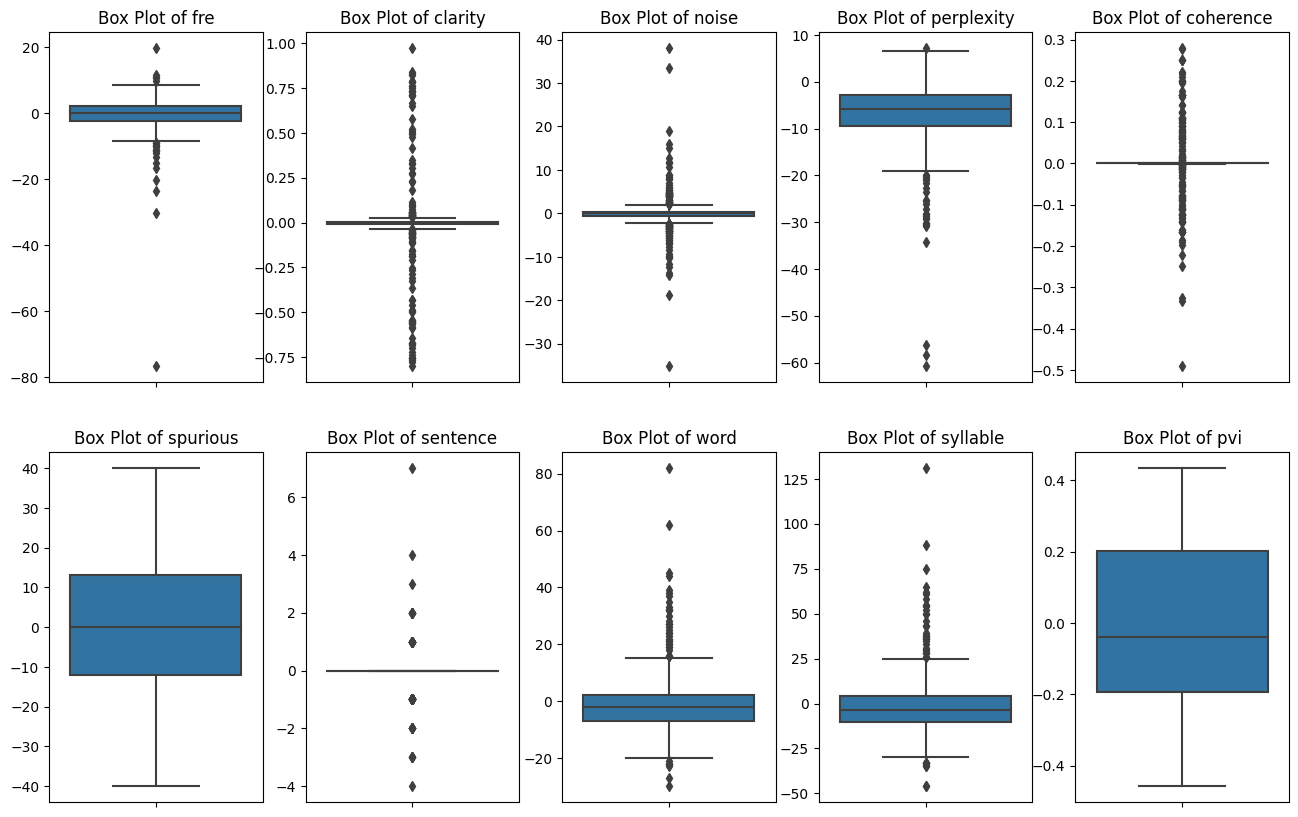
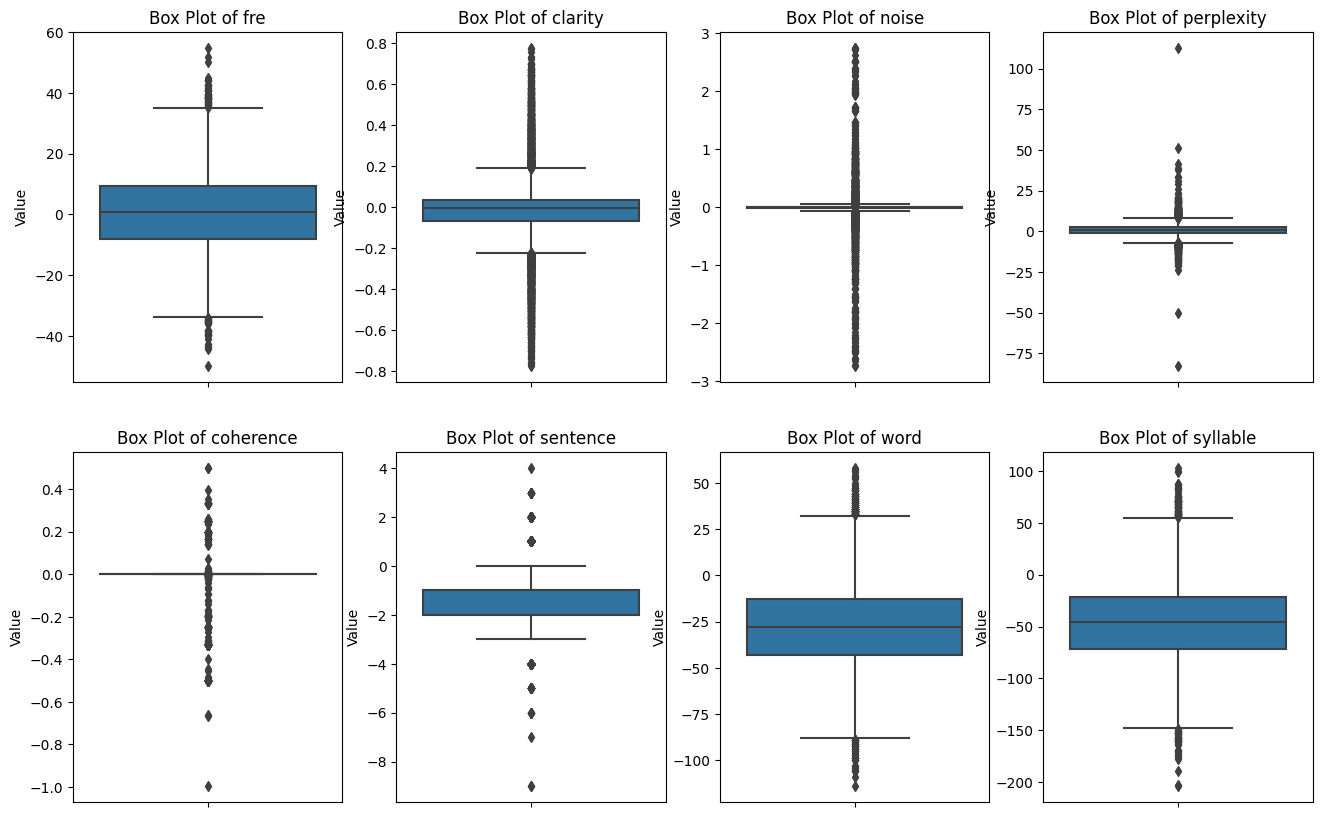
For the IMDB datasets, as the correlation in spurious bias and PVI turns very low, and more than half samples increase their perplexity, the revised datasets are mostly perturbed in fluency and task difficulty. In contrast, as the Conflict-LLM datasets show a low correlation in perplexity, coherence, sentence count, word count, and syllable count, and more than half of the samples increase their counts of sentences, words, and syllables, the revised datasets are perturbed in fluency and surface-level lexical structure (Table 6, Figure 1, Figure 2). We used Wilcoxon signed-rank test to test the significance of metrics differences and confirm our test results with one-sample t-test for metrics that roughly follow a normal distribution. While only perplexity, sentence count, word count, and syllable count exhibit a significant difference for IMDB dataset, all metrics differences are significant for LLM-Conflict datasets (significance level 0.025) (Table 7, Table 8). The topic distributions after revision for two datasets show no apparent pattern, and the variance in labels makes no difference as there is only one label.
The values of coherence align with the papers’ assumptions.
Regarding the papers’ assumption on metrics, both datasets mention the metrics coherence. LLM-knowledge-conflict is stated to be generated by LLM to "ensure high coherence", and IMDb Sentiment Analysis is stated to "remain coherent and factually consistent". The experiment results show that the coherence metrics remain consistently high with minimal differences after revision, which shows the intended control during the adversarial transformations.
Unintended impacts are demonstrated from metrics’ perspective.
The two datasets do not deliberately consider metrics other than the coherence above. All metrics changes do not show apparent patterns, especially LLM-Conflict, focusing on conflict memory, which is generated by language models and is thus reasonable to demonstrate limited controls for other metrics. However, there are still some changes induced by the transformation, but not always make the datasets more difficult: For IMDb, for example, a slight increase in perplexity indicates smaller fluency, while the increase in PVI suggests a slight decrease in difficulty. There is also a reduction in spurious bias in the dataset (Table 9), which, in turn, can be interpreted as an increase in difficulty.
5 Discussion
Design diverse adversarial scenarios with transparency
As mentioned in the dataset selection section, while there have been several adversarial datasets, such as HANS (McCoy et al., 2019), ANLI (Nie et al., 2020) and SWAG (Zellers et al., 2018). However, most of them focus on the training process rather than evaluation and focus on low-level perturbations. Besides, although the adversarial version is available, it lacks a corresponding original version from which it was revised. This complicates comparisons and resembles the challenges we encountered during data selection experiments. Thus, to better study adversalarity topics, it is worthwhile to explore additional high-level adversarial attack scenarios and make the generating process more transparent, such as providing the (original, revised) pairs, which would greatly enhance their utility.
Clarify what else makes the dataset more challenging
The adversarial datasets are often designed to focus on specific attack scenarios, and their effectiveness becomes evident through the observed reduction in model performance and the mistakes made by the models. By conducting additional instance-level metrics, we can delve into a more micro perspective and gain a clearer understanding of whether the attacks have affected specific metrics or introduced additional complexities that further challenge the models.
Curate adversarial evaluation datasets with focuses
For adversarial evaluation dataset curation, it is possible to concentrate on instances with particular metrics. This approach enhances interpretability and alignment with real-world application scenarios, which can assist researchers in gaining deeper insights into the inherent properties of datasets and the related models, and also make it easier to cater to various practical needs.
6 Conclusion & Limitations
In this paper, we presented a systematic survey of the meta-evaluation metrics that quantify the difficulty, diversity, and disagreement of datasets to assist research in adversalarity. We experimented with two datasets LLM-knowledge-conflict and Contrast Set IMDb Sentiment Analysis, and used the calculated metrics to profile the dataset properties from different perspectives. Based on the analysis, we find it crucial to delve deeper into the metrics at the characteristic level, which can be helpful in various circumstances, such as dataset curation, analyzing model performance results, designing attack scenarios, and conducting controlled experiments. There are a few limitations to consider for future research. First, datasets that meet the criteria for local or high-level changes are rare, and there is a need for more diverse and transparent datasets in this regard. Second, the contrast dataset was published in 2020, during which BERT was used for testing and showed performance degradation. As more advanced structures and models appear, there is a need for more recent and challenging datasets to further explore these dynamics.
References
- Al-Thanyyan and Azmi (2021) Suha S. Al-Thanyyan and Aqil M. Azmi. 2021. Automated text simplification: A survey. ACM Comput. Surv., 54(2).
- Aroyo et al. (2023) Lora Aroyo, Alex S. Taylor, Mark Diaz, Christopher M. Homan, Alicia Parrish, Greg Serapio-Garcia, Vinodkumar Prabhakaran, and Ding Wang. 2023. Dices dataset: Diversity in conversational ai evaluation for safety.
- Bartolo et al. (2020) Max Bartolo, Alastair Roberts, Johannes Welbl, Sebastian Riedel, and Pontus Stenetorp. 2020. Beat the ai: Investigating adversarial human annotation for reading comprehension. Transactions of the Association for Computational Linguistics, 8:662–678.
- Basile et al. (2021) Valerio Basile, Michael Fell, Tommaso Fornaciari, Dirk Hovy, Silviu Paun, Barbara Plank, Massimo Poesio, and Alexandra Uma. 2021. We need to consider disagreement in evaluation. In Proceedings of the 1st Workshop on Benchmarking: Past, Present and Future, pages 15–21, Online. Association for Computational Linguistics.
- Bender and Friedman (2018) Emily M. Bender and Batya Friedman. 2018. Data statements for natural language processing: Toward mitigating system bias and enabling better science. Transactions of the Association for Computational Linguistics, 6:587–604.
- Bhowmick et al. (2008) Plaban Kr. Bhowmick, Pabitra Mitra, and Anupam Basu. 2008. An agreement measure for determining inter-annotator reliability of human judgements on affective text. Proceedings of the Workshop on Human Judgements in Computational Linguistics - HumanJudge ’08, pages 58–65.
- Blei et al. (2001) David M. Blei, A. Ng, and Michael I. Jordan. 2001. Latent dirichlet allocation. J. Mach. Learn. Res., 3:993–1022.
- Blitzer et al. (2006) John Blitzer, Ryan McDonald, and Fernando Pereira. 2006. Domain adaptation with structural correspondence learning. In Proceedings of the 2006 Conference on Empirical Methods in Natural Language Processing - EMNLP ’06, page 120, Sydney, Australia. Association for Computational Linguistics.
- Bommasani and Cardie (2020) Rishi Bommasani and Claire Cardie. 2020. Intrinsic evaluation of summarization datasets. In Proceedings of the 2020 Conference on Empirical Methods in Natural Language Processing (EMNLP), pages 8075–8096, Online. Association for Computational Linguistics.
- Bowman (2021) Samuel R Bowman. 2021. The dangers of underclaiming: Reasons for caution when reporting how nlp systems fail. arXiv preprint arXiv:2110.08300.
- Bras et al. (2020) Ronan Le Bras, Swabha Swayamdipta, Chandra Bhagavatula, Rowan Zellers, Matthew E. Peters, Ashish Sabharwal, and Yejin Choi. 2020. Adversarial filters of dataset biases.
- Brown et al. (2020) Tom B. Brown, Benjamin Mann, Nick Ryder, Melanie Subbiah, Jared Kaplan, Prafulla Dhariwal, Arvind Neelakantan, Pranav Shyam, Girish Sastry, Amanda Askell, Sandhini Agarwal, Ariel Herbert-Voss, Gretchen Krueger, Tom Henighan, Rewon Child, Aditya Ramesh, Daniel M. Ziegler, Jeffrey Wu, Clemens Winter, Christopher Hesse, Mark Chen, Eric Sigler, Mateusz Litwin, Scott Gray, Benjamin Chess, Jack Clark, Christopher Berner, Sam McCandlish, Alec Radford, Ilya Sutskever, and Dario Amodei. 2020. Language models are few-shot learners.
- Campos et al. (2018) Ricardo Campos, Vítor Mangaravite, Arian Pasquali, Alípio Mário Jorge, Celia Nunes, and Adam Jatowt. 2018. Yake! collection-independent automatic keyword extractor. In European Conference on Information Retrieval.
- Chen et al. (2023) Hanjie Chen, Faeze Brahman, Xiang Ren, Yangfeng Ji, Yejin Choi, and Swabha Swayamdipta. 2023. REV: Information-theoretic evaluation of free-text rationales. In Proceedings of the 61st Annual Meeting of the Association for Computational Linguistics (Volume 1: Long Papers), pages 2007–2030, Toronto, Canada. Association for Computational Linguistics.
- Chen and Gao (2022) Zeming Chen and Qiyue Gao. 2022. Curriculum: A broad-coverage benchmark for linguistic phenomena in natural language understanding. In Proceedings of the 2022 Conference of the North American Chapter of the Association for Computational Linguistics: Human Language Technologies, pages 3204–3219, Seattle, United States. Association for Computational Linguistics.
- Cover and Hart (1967) Thomas M. Cover and Peter E. Hart. 1967. Nearest neighbor pattern classification. IEEE Trans. Inf. Theory, 13:21–27.
- Das et al. (2015) Rajarshi Das, Manzil Zaheer, and Chris Dyer. 2015. Gaussian lda for topic models with word embeddings. In Annual Meeting of the Association for Computational Linguistics.
- Devlin et al. (2019) Jacob Devlin, Ming-Wei Chang, Kenton Lee, and Kristina Toutanova. 2019. Bert: Pre-training of deep bidirectional transformers for language understanding. In Proceedings of the 2019 Conference of the North American Chapter of the Association for Computational Linguistics: Human Language Technologies, Volume 1 (Long and Short Papers), pages 4171–4186, Minneapolis, Minnesota. Association for Computational Linguistics.
- Dieng et al. (2016) Adji B. Dieng, Chong Wang, Jianfeng Gao, and John William Paisley. 2016. Topicrnn: A recurrent neural network with long-range semantic dependency. ArXiv, abs/1611.01702.
- Dinan et al. (2019) Emily Dinan, Samuel Humeau, Bharath Chintagunta, and Jason Weston. 2019. Build it break it fix it for dialogue safety: Robustness from adversarial human attack.
- Dixon et al. (2018) Lucas Dixon, John Li, Jeffrey Scott Sorensen, Nithum Thain, and Lucy Vasserman. 2018. Measuring and mitigating unintended bias in text classification. Proceedings of the 2018 AAAI/ACM Conference on AI, Ethics, and Society.
- DrEng (2001) Shigeo Abe DrEng. 2001. Pattern classification. In Springer London.
- Ethayarajh et al. (2022) Kawin Ethayarajh, Yejin Choi, and Swabha Swayamdipta. 2022. Understanding dataset difficulty with $\mathcal{V}$-usable information.
- Ferreira et al. (2016) Rafael Ferreira, Rafael Dueire Lins, Steven J. Simske, Fred Freitas, and Marcelo Riss. 2016. Assessing sentence similarity through lexical, syntactic and semantic analysis. Computer Speech & Language, 39:1–28.
- Ganin and Lempitsky (2015) Yaroslav Ganin and Victor Lempitsky. 2015. Unsupervised domain adaptation by backpropagation.
- Ganin et al. (2017) Yaroslav Ganin, Evgeniya Ustinova, Hana Ajakan, Pascal Germain, Hugo Larochelle, François Laviolette, Mario Marchand, and Victor Lempitsky. 2017. Domain-adversarial training of neural networks. Domain Adaptation in Computer Vision Applications, pages 189–209.
- Geva et al. (2019) Mor Geva, Yoav Goldberg, and Jonathan Berant. 2019. Are we modeling the task or the annotator? an investigation of annotator bias in natural language understanding datasets. Proceedings of the 2019 Conference on Empirical Methods in Natural Language Processing and the 9th International Joint Conference on Natural Language Processing (EMNLP-IJCNLP), pages 1161–1166.
- Gururangan et al. (2018) Suchin Gururangan, Swabha Swayamdipta, Omer Levy, Roy Schwartz, Samuel Bowman, and Noah A. Smith. 2018. Annotation artifacts in natural language inference data. Proceedings of the 2018 Conference of the North American Chapter of the Association for Computational Linguistics: Human Language Technologies, Volume 2 (Short Papers), pages 107–112.
- Jelinek et al. (2005) F. Jelinek, R. L. Mercer, L. R. Bahl, and J. K. Baker. 2005. Perplexity—a measure of the difficulty of speech recognition tasks. The Journal of the Acoustical Society of America, 62(S1):S63.
- Jia and Liang (2017) Robin Jia and Percy Liang. 2017. Adversarial examples for evaluating reading comprehension systems. ArXiv, abs/1707.07328.
- Jin et al. (2020) Di Jin, Zhijing Jin, Joey Tianyi Zhou, and Peter Szolovits. 2020. Is bert really robust? a strong baseline for natural language attack on text classification and entailment.
- Jones (2021) Karen Spärck Jones. 2021. A statistical interpretation of term specificity and its application in retrieval. J. Documentation, 60:493–502.
- Kaushik et al. (2019) Divyansh Kaushik, Eduard Hovy, and Zachary C Lipton. 2019. Learning the difference that makes a difference with counterfactually-augmented data. arXiv preprint arXiv:1909.12434.
- Kiela et al. (2021) Douwe Kiela, Max Bartolo, Yixin Nie, Divyansh Kaushik, Atticus Geiger, Zhengxuan Wu, Bertie Vidgen, Grusha Prasad, Amanpreet Singh, Pratik Ringshia, Zhiyi Ma, Tristan Thrush, Sebastian Riedel, Zeerak Waseem, Pontus Stenetorp, Robin Jia, Mohit Bansal, Christopher Potts, and Adina Williams. 2021. Dynabench: Rethinking benchmarking in nlp.
- Kipf and Welling (2016) Thomas Kipf and Max Welling. 2016. Semi-supervised classification with graph convolutional networks. ArXiv, abs/1609.02907.
- Koo and Li (2016) Terry K. Koo and Mae Y. Li. 2016. A guideline of selecting and reporting intraclass correlation coefficients for reliability research. Journal of Chiropractic Medicine, 15(2):155–163.
- Lee et al. (2021) Bruce W. Lee, Yoo Sung Jang, and Jason Hyung-Jong Lee. 2021. Pushing on text readability assessment: A transformer meets handcrafted linguistic features.
- Lee et al. (2022) Mina Lee, Megha Srivastava, Amelia Hardy, John Thickstun, Esin Durmus, Ashwin Paranjape, Ines Gerard-Ursin, Xiang Lisa Li, Faisal Ladhak, Frieda Rong, et al. 2022. Evaluating human-language model interaction. arXiv preprint arXiv:2212.09746.
- Lees et al. (2022) Alyssa Lees, Vinh Q. Tran, Yi Tay, Jeffrey Sorensen, Jai Gupta, Donald Metzler, and Lucy Vasserman. 2022. A new generation of perspective api: Efficient multilingual character-level transformers.
- Liang et al. (2022) Percy Liang, Rishi Bommasani, Tony Lee, Dimitris Tsipras, Dilara Soylu, Michihiro Yasunaga, Yian Zhang, Deepak Narayanan, Yuhuai Wu, Ananya Kumar, Benjamin Newman, Binhang Yuan, Bobby Yan, Ce Zhang, Christian Cosgrove, Christopher D. Manning, Christopher Ré, Diana Acosta-Navas, Drew A. Hudson, Eric Zelikman, Esin Durmus, Faisal Ladhak, Frieda Rong, Hongyu Ren, Huaxiu Yao, Jue Wang, Keshav Santhanam, Laurel Orr, Lucia Zheng, Mert Yuksekgonul, Mirac Suzgun, Nathan Kim, Neel Guha, Niladri Chatterji, Omar Khattab, Peter Henderson, Qian Huang, Ryan Chi, Sang Michael Xie, Shibani Santurkar, Surya Ganguli, Tatsunori Hashimoto, Thomas Icard, Tianyi Zhang, Vishrav Chaudhary, William Wang, Xuechen Li, Yifan Mai, Yuhui Zhang, and Yuta Koreeda. 2022. Holistic evaluation of language models.
- Liu et al. (2023) Yugeng Liu, Tianshuo Cong, Zhengyu Zhao, Michael Backes, Yun Shen, and Yang Zhang. 2023. Robustness over time: Understanding adversarial examples’ effectiveness on longitudinal versions of large language models. arXiv preprint arXiv:2308.07847.
- Luo et al. (2019) Yawei Luo, Liang Zheng, Tao Guan, Junqing Yu, and Yi Yang. 2019. Taking a closer look at domain shift: Category-level adversaries for semantics consistent domain adaptation. 2019 IEEE/CVF Conference on Computer Vision and Pattern Recognition (CVPR), pages 2502–2511.
- McCoy et al. (2019) R. Thomas McCoy, Ellie Pavlick, and Tal Linzen. 2019. Right for the wrong reasons: Diagnosing syntactic heuristics in natural language inference.
- McHugh (2012) Mary L. McHugh. 2012. Interrater reliability: The kappa statistic. Biochemia Medica, 22(3):276.
- Meyer et al. (2018) Bonnie J. F. Meyer, Kausalai Wijekumar, and Puiwa Lei. 2018. Comparative signaling generated for expository texts by 4th–8th graders: Variations by text structure strategy instruction, comprehension skill, and signal word. Reading and Writing, 31(9):1937–1968.
- Mihalcea and Tarau (2004) Rada Mihalcea and Paul Tarau. 2004. Textrank: Bringing order into text. In Conference on Empirical Methods in Natural Language Processing.
- Mikolov et al. (2013) Tomas Mikolov, Kai Chen, Gregory S. Corrado, and Jeffrey Dean. 2013. Efficient estimation of word representations in vector space. In International Conference on Learning Representations.
- Mitchell et al. (2023) Margaret Mitchell, Alexandra Sasha Luccioni, Nathan Lambert, Marissa Gerchick, Angelina McMillan-Major, Ezinwanne Ozoani, Nazneen Rajani, Tristan Thrush, Yacine Jernite, and Douwe Kiela. 2023. Measuring data.
- Nie et al. (2020) Yixin Nie, Adina Williams, Emily Dinan, Mohit Bansal, Jason Weston, and Douwe Kiela. 2020. Adversarial nli: A new benchmark for natural language understanding. Proceedings of the 58th Annual Meeting of the Association for Computational Linguistics, pages 4885–4901.
- Park et al. (2020) Chanjun Park, Yeongwook Yang, Chanhee Lee, and Heuiseok Lim. 2020. Comparison of the evaluation metrics for neural grammatical error correction with overcorrection. IEEE Access, 8:106264–106272.
- Parrish et al. (2023) Alicia Parrish, Hannah Rose Kirk, Jessica Quaye, Charvi Rastogi, Max Bartolo, Oana Inel, Juan Ciro, Rafael Mosquera, Addison Howard, Will Cukierski, D. Sculley, Vijay Janapa Reddi, and Lora Aroyo. 2023. Adversarial nibbler: A data-centric challenge for improving the safety of text-to-image models.
- Pennington et al. (2014) Jeffrey Pennington, Richard Socher, and Christopher D. Manning. 2014. Glove: Global vectors for word representation. In Conference on Empirical Methods in Natural Language Processing.
- Pexman et al. (2008) Penny M. Pexman, Ian S. Hargreaves, Paul D. Siakaluk, Glen E. Bodner, and Jamie Pope. 2008. There are many ways to be rich: Effects of three measures of semantic richness on visual word recognition. Psychonomic Bulletin & Review, 15(1):161–167.
- Pires et al. (2017) Carla Pires, Afonso Cavaco, and Marina Vigário. 2017. Towards the definition of linguistic metrics for evaluating text readability. Journal of Quantitative Linguistics, 24(4):319–349.
- Qian et al. (2023) Cheng Qian, Xinran Zhao, and Sherry Tongshuang Wu. 2023. "merge conflicts!" exploring the impacts of external distractors to parametric knowledge graphs.
- Rabiner (1989) L.R. Rabiner. 1989. A tutorial on hidden markov models and selected applications in speech recognition. Proceedings of the IEEE, 77(2):257–286.
- Radford et al. (2019) Alec Radford, Jeffrey Wu, Rewon Child, David Luan, Dario Amodei, Ilya Sutskever, et al. 2019. Language models are unsupervised multitask learners. OpenAI blog, 1(8):9.
- Rose et al. (2010) Stuart Rose, Dave Engel, Nick Cramer, and Wendy Cowley. 2010. Automatic keyword extraction from individual documents. Text mining: applications and theory, pages 1–20.
- Rousseau and Vazirgiannis (2015) François Rousseau and Michalis Vazirgiannis. 2015. Main core retention on graph-of-words for single-document keyword extraction. In European Conference on Information Retrieval.
- Sakaguchi et al. (2020) Keisuke Sakaguchi, Ronan Le Bras, Chandra Bhagavatula, and Yejin Choi. 2020. Winogrande: An adversarial winograd schema challenge at scale. Proceedings of the AAAI Conference on Artificial Intelligence, 34(05):8732–8740.
- Sang and Meulder (2003) Erik Tjong Kim Sang and Fien De Meulder. 2003. Introduction to the conll-2003 shared task: Language-independent named entity recognition. In Conference on Computational Natural Language Learning.
- Schmidt-Fajlik (2023) Ronald Schmidt-Fajlik. 2023. Chatgpt as a grammar checker for japanese english language learners: A comparison with grammarly and prowritingaid. AsiaCALL Online Journal, 14(1):105–119.
- Shannon (1948) C. E. Shannon. 1948. A mathematical theory of communication. The Bell System Technical Journal, 27(3):379–423.
- Shen et al. (2021) Zheyan Shen, Jiashuo Liu, Yue He, Xingxuan Zhang, Renzhe Xu, Han Yu, and Peng Cui. 2021. Towards out-of-distribution generalization: A survey. ArXiv.
- Siddharthan (2004) Advaith Siddharthan. 2004. Syntactic simplification and text cohesion. Technical Report UCAM-CL-TR-597, University of Cambridge, Computer Laboratory.
- Siddharthan (2006) Advaith Siddharthan. 2006. Syntactic simplification and text cohesion. Research on Language and Computation, 4(1):77–109.
- Swayamdipta et al. (2020) Swabha Swayamdipta, Roy Schwartz, Nicholas Lourie, Yizhong Wang, Hannaneh Hajishirzi, Noah A. Smith, and Yejin Choi. 2020. Dataset cartography: Mapping and diagnosing datasets with training dynamics. In Proceedings of the 2020 Conference on Empirical Methods in Natural Language Processing (EMNLP), pages 9275–9293, Online. Association for Computational Linguistics.
- Teh (2006) Yee Whye Teh. 2006. A hierarchical bayesian language model based on pitman-yor processes. In Annual Meeting of the Association for Computational Linguistics.
- Theil (1967) H. Theil. 1967. Economics and Information Theory. Studies in mathematical and managerial economics. North-Holland Publishing Company.
- Treviso et al. (2023) Marcos Treviso, Ji-Ung Lee, Tianchu Ji, Betty van Aken, Qingqing Cao, Manuel R. Ciosici, Michael Hassid, Kenneth Heafield, Sara Hooker, Colin Raffel, Pedro H. Martins, André F. T. Martins, Jessica Zosa Forde, Peter Milder, Edwin Simpson, Noam Slonim, Jesse Dodge, Emma Strubell, Niranjan Balasubramanian, Leon Derczynski, Iryna Gurevych, and Roy Schwartz. 2023. Efficient methods for natural language processing: A survey.
- Vadlapudi and Katragadda (2010) Ravikiran Vadlapudi and Rahul Katragadda. 2010. On automated evaluation of readability of summaries: Capturing grammaticality, focus, structure and coherence. In North American Chapter of the Association for Computational Linguistics.
- Vaswani et al. (2017) Ashish Vaswani, Noam M. Shazeer, Niki Parmar, Jakob Uszkoreit, Llion Jones, Aidan N. Gomez, Lukasz Kaiser, and Illia Polosukhin. 2017. Attention is all you need. In NIPS.
- Wang et al. (2023) Jindong Wang, Xixu Hu, Wenxin Hou, Hao Chen, Runkai Zheng, Yidong Wang, Linyi Yang, Haojun Huang, Wei Ye, Xiubo Geng, Binxin Jiao, Yue Zhang, and Xing Xie. 2023. On the robustness of chatgpt: An adversarial and out-of-distribution perspective.
- Xie et al. (2023) Jian Xie, Kai Zhang, Jiangjie Chen, Renze Lou, and Yu Su. 2023. Adaptive chameleon or stubborn sloth: Unraveling the behavior of large language models in knowledge clashes.
- Xu et al. (2020) Yilun Xu, Shengjia Zhao, Jiaming Song, Russell Stewart, and Stefano Ermon. 2020. A theory of usable information under computational constraints.
- Zellers et al. (2018) Rowan Zellers, Yonatan Bisk, Roy Schwartz, and Yejin Choi. 2018. Swag: A large-scale adversarial dataset for grounded commonsense inference.
- Zipf (1949) George K. Zipf. 1949. Human Behaviour and the Principle of Least Effort. Addison-Wesley.
Appendix A Metrics Related Work
This is a section for the details of the criteria for the metrics classification.
A.1 Diversity
Diversity characterizes the data variety in different aspects such as topics and lexicons and granular levels such as samples or corpus. It provides insights about data informativeness and coverage. A more diverse dataset usually covers a wider range of topics and contexts that represent the complexity of real-world application scenarios better, thus evaluating the model generalizability (Gururangan et al., 2018). Typical application scenarios include bias mitigation (Bender and Friedman, 2018) and robustness ensurance Jia and Liang (2017) since various groups or perspectives are well represented, and a wider range of cases are tested for unexpected input handling with a more diverse dataset.
A.1.1 Lexical diversity
Lexical diversity measures the dispersion of tokens at different granular levels such as lexicons and n-grams from a statistical perspective rather than related to a specific NLP task. N-gram represents contiguous sequences of n items from texts where items can be phonemes, syllables, letters, or words depending on the application (Shannon, 1948), where terms are most extensively used with Hidden Markov Models (Rabiner, 1989) or Language Models (Brown et al., 2020) in areas such as text prediction and spelling correction.
-
•
Frequency distribution: The most straightforward way to measure the lexical diversity is to calculate the number unique instances and their corresponding frequencies at different granular levels (Zipf, 1949). Text data with higher lexical diversity should include more distinct tokens with a more evenly frequency distribution.
-
•
Redundancy: Shannon entropy from information theory can measure the randomness and uncertainty of a text dataset at a granular level which is typically words or characters (Shannon, 1948). A higher entropy represents less predictability, indicating less redundancy. Another metric is the generalized entropy index used primarily in economics to assess income distribution within a population (Theil, 1967), which can be adapted to the text data context where individuals become tokens, and incomes become the corresponding frequencies. However, almost all those metrics do not capture the sequence order of tokens except n-grams, and n-grams are hard to use due to the exponential complexity of storing and retrieving them.
A.1.2 Semantic diversity
Semantic diversity captures the variation of key information in various aspects including keywords, topics, and contextual terms requiring special notice. While lexical diversity contains statistical measures at the surface level based on syntactical structure, semantic diversity intends to capture important information of the text data at a higher level of meaning.
-
•
Keyword extraction: Keyword extraction extracts vital terms from each text sample based on the term scores. A traditional metric to weigh term importance is TF-IDF (Jones, 2021), which only uses the surface-level measures of term frequency and document frequency but was shown effective in the Information Retrieval area. However, TF-IDF only considers the useful terms after case conversion, stopword removal, and stemming without contextual and positional information. In addition to TF-IDF, RAKE (Rapid Automatic Keyword Extraction) (Rose et al., 2010), TextRank (Mihalcea and Tarau, 2004), YAKE (Yet Another Keyword Extractor) (Campos et al., 2018) are well-known models to extract keywords by surface-level knowledge, such as word frequencies, word co-occurrence frequencies, and sentence overlaps, as well as statistical manipulation. The keyword importance can also be extracted from term weights learned from large language models such as BERT (Devlin et al., 2019).
-
•
Topic modeling: Topic modeling to extract topics from the text data such as LDA (Latent Dirichlet Allocation) (Blei et al., 2001) that generate topic labels consisting of a group of keywords, which is one step further from plain keywords extraction methods. More advanced methods use architectures like graph-based models (Kipf and Welling, 2016), Neural Networks or transformers (Vaswani et al., 2017), learned text embeddings such as Word2Vec, Skip-gram (Mikolov et al., 2013), or GloVe (Pennington et al., 2014) for topic modeling, and additional meta information. Improving on LDA, Gaussian LDA (Das et al., 2015) uses Gaussian distributions instead of Multinomial distributions for topics with continuous word embeddings to better capture the word semantic relationships, and Hierarchical Dirichlet Process (Teh, 2006) uses a non-parametric Bayesian method to eliminate the need of the number of topics to be specified in advance. Also, some methods use Neural Networks such as TopicRNN (Dieng et al., 2016) and graphs to model word-document relationships such as Graph-of-Words model (Rousseau and Vazirgiannis, 2015). The state-of-the-art model BERTopic uses transformer-based language models such as BERT with a clustering algorithm to discover topics.
-
•
Data density: As pre-trained text embeddings are naturally a vector in a multidimensional space, metrics like data density measure the vector density for each sample naturally. As data density increases, the average number of sample vector ending points within a unit space increases, which means the vectors become more similar, and the lexical diversity is likely to decrease. Data density at a more granular level terms can capture the linguistic density of the dataset. Also, the machine learning model KNN (Cover and Hart, 1967) can be used to calculate the average KNN density for each centroid to measure the vector density at a deeper level with consideration of clusters. The variation of data density can be an indicator of noise due to the occurrences of outliers.
-
•
Fairness-related diversity: Some fairness-related diversity may need special attention such as gender and race. Several methods can be adopted to measure fairness-related diversity. The simplest method is to build a list of keywords for each minority group such as female and male, and parse the text samples to label the minority groups captured and corresponding frequencies (Dixon et al., 2018). Samples with higher fairness-related diversity should include more diversity groups with higher frequencies. Also, samples whose contexts do not relate to fairness should be filtered out to avoid excessive calculation. The state-of-the-art methods are based on Transformers to tag each term with the corresponding fairness-related entity, which is adapted from the Name Entity Recognition task (Sang and Meulder, 2003).
-
•
Labeler demographic diversity: Each labeler can be represented by a vector depending on the self-reported information by one-hot encoding or label encoding based on the feature properties, for example, a categorical variable is nominal or ordinal. For instance, females and males can be converted to a binary number 0 or 1, and labeler incomes can be labeled by the plain or normalized income values. The labeler demographic diversity can be calculated by average distance metrics from two labeler vectors such as Euclidean Distance (DrEng, 2001).
A.2 Difficulty
A.2.1 Lexical complexity
We use “lexical complexity” for surface-level features of a text, such as the number of complex words used or syntactic structure. These phonological and lexical units and patterns can provide intuitive indicators of the difficulty of a text (Pires et al., 2017) and are widely used to create various metrics. Prominent examples include the Flesch Reading Ease (FRE), Fog Index (FOG) score, and Lesch-Kincaid Grade Level (FKGL) index, which are composite measures derived from combinations of these attributes (Al-Thanyyan and Azmi, 2021). These indices are useful for determining whether a text is appropriate for a particular reading age, assuming that the texts are well-written, coherent, and relevant in content. (Siddharthan, 2004)
A.2.2 Text structure
Explicit signal words and structure information (e.g. text-level, indent, order, connective) can impact the conjunction and cohesion of text, thus affecting the difficulty of understanding it (Siddharthan, 2006, Meyer et al., 2018). In the context of the widespread adoption of Large Language Models (LLMs), the importance of text structure also becomes more pronounced. For instance, in the online course "ChatGPT Prompt Engineering for Developers" offered by DeepLearning.AI in collaboration with OpenAI, the official recommendation highlights the significance of clarifying the structure to enhance the quality of generated responses (e.g. “Use delimiters to clearly indicate distinct parts of the input”)333https://learn.deeplearning.ai/chatgpt-prompt-eng/.
A.2.3 Grammaticality
Grammatical errors can lead to confusion and misinterpretation of a text, increasing the difficulty of comprehending its intended meaning. Grammatical Error Correction (GEC) has gained great attention in recent years. Various GEC models are trained and tested on benchmarks like CoNLL-2014, JFLEG, BEA Shared Task, etc. (GEC work tracking444http://nlpprogress.com/english/grammatical_error_correction.html ) GPT models also have a certain degree of good correction ability at the sentence level (Schmidt-Fajlik, 2023). Multiple metrics can be utilized to quantify the efforts needed to correct the texts (e.g. Edit distance, Sentence similarity (Ferreira et al., 2016, Park et al., 2020)), which can be a proxy of grammaticality evaluation.
A.2.4 Text coherence
The concept of coherence, which pertains to the semantic meaningfulness of text, is a crucial aspect of instance difficulty (Vadlapudi and Katragadda, 2010). Bert, a language model specifically pre-trained on the Next Sentence Prediction (NSP) task (Devlin et al., 2019), has proven to be an efficient tool in quantifying text coherence metrics (Bommasani and Cardie, 2020). These metrics including the calculation of the average probability of each subsequent sentence conditioned on the preceding one, are proven to provide valuable insights into the overall coherence of multi-sentence texts (Bommasani and Cardie, 2020). Perplexity, one of the most widely used metrics for language model evaluation can also indicate how complex the instance seems to the model555https://huggingface.co/docs/transformers/perplexity (Jelinek et al., 2005). An instance with a lower perplexity value is considered more "probable" or "expected" by the language model, while higher perplexity indicates that the language model is less confident in predicting the sentence and may struggle to make accurate predictions for it.
A.2.5 Topic distribution
In addition to the number of identified topics, the topic distribution within a text plays a significant role in understanding its difficulty. This concept of topic distribution encompasses three important aspects, as discussed in Lee et al., 2021: semantic richness, semantic clarity, and semantic noise. Semantic richness is measured through various indicators such as semantic neighbors, feature numbers, and contextual dispersion (Pexman et al., 2008). In Lee et al., 2021, a novel approach is introduced that quantifies semantic richness based on the product total of the sorted probabilities list (SPL) derived from topic modeling models. Additionally, a more intricate semantic structure within a text tends to increase its level of difficulty (Pires et al., 2017). Semantic clarity refers to the difficulty in identifying the main topic of the text and can be measured using the trend of the SPL (Lee et al., 2021). On the other hand, semantic noise indicates the presence of less probable topics and can be assessed by examining the “tailness” of the SPL (Lee et al., 2021).
A.2.6 Usable information
-Usable Information, extended from the work in information theory (Xu et al., 2020), is proven to be effective in indicating the difficulty of a dataset (Ethayarajh et al., 2022). It can be interpreted as “how much information an input variable X can provide about Y when constrained to functions V” (Chen and Gao, 2022). Pointwise V-information (PVI) can further indicate the difficulty of an individual instance for a given distribution (Ethayarajh et al., 2022). The higher the values, the easier the dataset/instance for the model/the distribution (Ethayarajh et al., 2022). These metrics are widely recognized in academic papers and serve as a reliable indicator (Chen and Gao, 2022, Treviso et al., 2023). Other metrics regarding information include REV (Rationale Evaluation with conditional V-information), indicating “the amount of new, label-relevant information in a rationale beyond the information already available in the input or the label” (Chen et al., 2023).
A.2.7 Confidence
Confidence here refers to the degree of certainty the model possesses when making predictions about a given instance. It indicates the likelihood of a prediction being correct or a generated result satisfying the users. The precise meaning of confidence varies depending on the specific context. For example, it may represent the probability of making accurate predictions across epochs (Swayamdipta et al., 2020), or the level of certainty that an answer will match a user’s query in a Q&A system666https://learn.microsoft.com/en-us/. Intuitively, when the model is less confident, it suggests that the instance is more challenging to handle.
A.2.8 Incidental bias (Annotation artifacts)
Models may “solve the problems right, but for wrong reasons” due to annotation artifacts, resulting in an overestimation of their true machine commonsense capabilities (e.g. Gururangan et al., 2018, Geva et al., 2019). This can lead to significant performance degradation when faced with adversarial or out-of-distribution samples. To mitigate this issue, for example, the AFLITE algorithm has been proposed as an effective means to detect dataset-specific spurious bias (Sakaguchi et al., 2020, Bras et al., 2020). The filtering process utilizes the Predictability Score, which measures the ratio of correct label predictions in each iteration, as a key metric. After going through more rounds of iterations, it the less likely for the remaining dataset to contain spurious bias, and can thus be more challenging. Pointwise Mutual Information (PMI) based filtering is another popular debias method (Gururangan et al., 2018). By summing all token-level PMI values for a text, instance pairs hard to discriminate can be detected (Gururangan et al., 2018, Sakaguchi et al., 2020).
A.2.9 Safety - Detected toxicity
We also employ the term “Toxicty” as a broad category encompassing interconnected concepts such as hate speech and violent speech as in (Liang et al., 2022). Toxicity detection models can provide scores of various aspects. We do not assume the accuracy and reliability of those models. Thus, we refer to this metric as “detected toxicity” by the models utilized. Widely used toxicity detection tools include Perspective API777https://perspectiveapi.com/ (Lees et al., 2022)). This metric can help better evaluate a model’s performance on instances with various toxicity levels.
A.2.10 Safety - Adversariality
Prior research has emphasized the development of adversarial datasets as a means to enhance the robustness of models (e.g. Bartolo et al., 2020, Kiela et al., 2021, Dinan et al., 2019). With the widespread utilization of generative AI, there is an increasing concern regarding potentially unsafe behaviors that may give rise to undesirable issues, such as the inclusion of "violent, sexually explicit, or biased and derogatory stereotypes" (Parrish et al., 2023). Current ongoing investigations are specifically targeting these challenging examples, particularly focusing on "adversarial attacks that can bypass existing safety filters" (Parrish et al., 2023). By incorporating adversarial examples into evaluation datasets, the safety of models can be further examined and assessed.
A.2.11 Annotator subjective ambiguity
Annotations inherently carry the subjectiveness of the annotators. In certain situations, annotators may experience uncertainty when applying the pre-defined annotation criteria (Aroyo et al., 2023). We refer to this uncertainty as the "subjective ambiguity" of the annotators.
A.3 Disagreement
In human-labeled datasets, instances often exhibit disagreement among annotators, which serves as a significant characteristic. This disagreement can arise from three primary sources: individual differences, stimulus characteristics, and context, as discussed in (Basile et al., 2021). Analyzing the instances and annotator disagreement can be valuable in assessing data reliability and selecting a meaningful subset of data. For instance, by considering background information of annotators such as age, gender, and education level, examining rater disagreement across different groups, including intersectional groups, can provide valuable insights into safety concerns (Aroyo et al., 2023). To measure and evaluate inter-annotator reliability catering to different data types and usage scenarios, various metrics are available and can be adapted. These include percent agreement (McHugh, 2012), Cohen’s Kappa (McHugh, 2012), Intraclass Correlation Coefficient (Koo and Li, 2016), and the Agreement Measure, which is useful when assigning texts to more than one class (Bhowmick et al., 2008).
Appendix B Metrics Implementation
Here is a detailed illustration of our selected metrics’ implementation.
We used FRE (Flesch Reading Ease) (Al-Thanyyan and Azmi, 2021) to evaluate the readability, which indicates the lexical complexity of an instance. To access spurious bias using the AFLITE algorithm, which has shown significant effectiveness. Hyperparameters are set proportionally to those stated in (Bras et al., 2020), which have proven to be effective. We use the rounds of elimination as our metric, where more iterations lead to less potential for the remaining dataset to contain spurious bias. Regarding spurious bias, We conducted two sets of experiments using datasets, each containing 488 instances. We eliminated a total of 400 instances during each iteration, removing 10 instances at a time. This approach allowed us to track the elimination round for each instance. We then applied a threshold of 0.75 to identify instances with potentially higher spurious bias, determining the number of iterations needed to filter out those surpassing this specific threshold and the total removed instance number. To measure text coherence, we calculate semantic coherence (Bommasani and Cardie, 2020). This metric predicts the probability of each successive sentence conditioned on the previous one using BERT, indicating fluency at the sentence level. However, semantic coherence does not cover cases with only a single sentence. To address this, we include the perplexity score based on GPT2-large 888https://huggingface.co/gpt2-large, a widely recognized causal language model (Radford et al., 2019). For assessing usable information, we use PVI, a commonly used indicator for instance/dataset distribution (Ethayarajh et al., 2022). For topic distribution, we consider semantic clarity and noise. The calculation methods for these two are relatively alternative to the standard kurtosis equation from statistics and the kurtosis equation under Fisher’s definition, as adopted and proved effective in Lee et al., 2021.
We have also implemented them as APIs to make them more convenient for other reference and use. We have already set default values for the hyperparameters and default models corresponding to the calculation method. Nevertheless, users have the flexibility to fine-tune them to achieve more desirable results. It is worth noting that some metrics are label-independent, while others depend on label information, so users must provide sufficient details for the calculation process. Comprehensive explanations for each metric can be found in the GitHub repository999https://github.com/BYC-Sophie/TextMetrics.
| Category | Metrics Name | Computation Methods |
| Lexical Complexity | Readability | FRE (Flesch Reading Ease) Score |
| Spurious Bias | Elimination rounds through AFLITE algorithm | |
| Text Coherence | Semantic coherence | Average successive sentence probability by Bert |
| Perplexity | Perplexity score based on GPT2-Large | |
| Usabel Information | PVI | Additional knowledge gained from labels |
| Topic Distribution | Semantic clarity | Alternative of standard skewness equation |
| Semantic noise | kurtosis equation under Fisher definition |
| Category | Metrics Name | Computation Methods |
|---|---|---|
| Lexical diversity | Sentence, Word, Syllable Counts | Tokenizers and Dictionary |
| Topic Density | Topic Number | BertTopic |
| Category | Metrics Name | Computation Methods |
| Label Disagreement | Instance Label Disagreement | Variance |
| Datasets | FRE | clarity | noise | perplexity | coherence |
|---|---|---|---|---|---|
| IMDB | .9484 | .8390 | .9607 | .9094 | .6932 |
| LLM-Conflict | .2189 | .6078 | .6864 | .0738 | -.0086 |
| Datasets | spurious bias | pvi | sent_count | word_count | syllable_count |
|---|---|---|---|---|---|
| IMDB | .0796 | .0861 | .9836 | .9853 | .9844 |
| LLM-Conflict | - | - | .0675 | .0317 | .0182 |
| Tests | FRE | clarity | noise | perplexity | coherence |
|---|---|---|---|---|---|
| Wilcoxon signed-rank test | .4374 | .1613 | .5052 | .0000 | .0375 |
| one-sample t-test | .0537 | .7204 | .8607 | - | - |
| Tests | spurious bias | pvi | sent_count | word_count | syllable_count |
|---|---|---|---|---|---|
| Wilcoxon signed-rank test | .9748 | .7057 | .0048 | .0000 | .0000 |
| one-sample t-test | 1.0000 | - | .0243 | - | - |
| FRE | clarity | noise | perplexity | coherence | sent_count | word_count | syllable_count | |
|---|---|---|---|---|---|---|---|---|
| Wilcoxon signed-rank test | .0000 | .0000 | .0000 | .0000 | .0000 | .0000 | .0000 | .0000 |
| one-sample t-test | .0000 | .0000 | .0289 | .0000 | - | - | .0000 | .0000 |
| run-1 | run-2 | run-3 | run-4 | run-5 | mean | ||
|---|---|---|---|---|---|---|---|
| iteration num | original | 3 | 1 | 1 | 1 | 3 | 1.8 |
| revised | 1 | 1 | 1 | 1 | 1 | 1 | |
| removal instance num | original | 21 | 2 | 3 | 4 | 23 | 10.6 |
| revised | 0 | 2 | 0 | 0 | 2 | 0.8 |