remarkRemark
Characterization in Geant4 of different PET configurations
Abstract
Positron Emission Tomography (PET) is a Nuclear Medicine technique that creates images that allow the study of metabolic activity and organ function using radiopharmaceuticals. Continuous improvement of scintillation detectors for radiation in PET as well as improvement in electronic detectors (e.g., SiPMs) and signal processing, makes the field of PET a fast and changing environment. If industry desires to build new systems implementing these technological improvements, it is of its interest to develop modelling strategies that can provide information on how to build them, reducing time and material costs. Bearing this in mind three different PET configurations, were simulated in Geant4, to determine which one presented the best performance according to quality parameters such as spatial resolution (SR), coincident time resolution (CTR) and acceptance value (A). This was done with three different (in size) pairs of LYSO crystals + SiPM detectors. It was found that the 2 Modules system presented worst results than the two Ring detector configurations. Between the Ring configurations the first was marginally better than the second.
1 Introduction
Nuclear Medicine is a specialty of diagnostic medicine used to assess organ function as well as diagnosing the severity of different illnesses. It accomplishes this using radiopharmaceutical (RPs). RPs are built attaching a biological compatible molecule to a radionuclide (RN) which emits different particles or rays that are then detected and measured. RPs are adapted for each body part and illness that needs to be targeted and diagnosed radio ; radioinfo ; RP3 ; RP2 . For PET applications (a technique of nuclear medicine), the RNs used to build RPs are based on decays: A proton from the atom nucleus decomposes into a neutron plus a positron and an electron neutrino () and the and are then ejected from the RN. The does not interact with the matter, i.e., all the atoms of the surrounding organs and therefore can be ignored. However, when the slows down due to electrostatic interaction with the surrounding atoms, it will then interact with a random electron, producing the phenomenon of annihilation in which their mass is converted in energy emissions. Each of the two gamma rays produced then, have an energy of 511 keV and are ejected at from each other. The detection of these two gamma rays allows clinicians to know the place where they originated, and is the basis used by PET to obtain an image pet ; pet2 ; pet3 .
The most common detection pair used in PET for gamma ray detection is: Lutetium–yttrium oxyorthosilicate (LYSO) scintillating crystals lyso ; lyso2 ; B10 coupled to Photo-Multiplier Tubes (PMTs). Preclinical PET scanners (or scanners for small species), have smaller bore sizes compared to their human counterparts B11 ; petanimal3 ; petanimal2 . Therefore, the crystals must be smaller (order of millimeters) to maintain a proportional spatial resolution to those of human use. Silicon Photomultipliers (SiPM) are different types of photosensors, smaller than PMTs (order of millimeters) BeBe . For this reason, the use of SiPM instead of PMT in PET is recently being seriously considered B15 ; B16 , especially for the preclinical system cases. In fact, the use of SiPMs may allow the use of configurations of a single crystal coupled to one SiPM improving spatial resolution, efficiency, and photon time detection B17 .
As the electronic capabilities advance, so does the interest in optimizing PET systems (human and preclinical). To this end, new scintillation + detector pairs for PET or micro-PET are under constant development B15 ; B17 ; B18 . The process of new developments and designs must always be preceded by simulations that give a theoretical quantification of the performance of the new systems. Geant4 is a software developed to study through Monte Carlo statistics the interaction of radiation with matter geant4 . It was especially developed for radiotherapy scenarios but can model the interaction of gamma rays with radiation detectors B20 . Geant4 has been used in the past to model PET hardware and configurations as can be seen in B21 and B22 .
Finally, to perform these simulations as well as quantifications of new PET systems, a series of established parameters are used to compare the performance of the different PET systems B23 :
- Coincident Time Resolution (CTR)
-
Time difference between the first crystal that detects one gamma and the diametrically opposite crystal that detects the other gamma due to electron-positron annihilation.
- Spatial Resolution (SR)
-
Minimum distance by which two points in a medical image can be differentiated.
- Acceptance
-
Defined by the following equation:
(1)
The work presented here was aimed at simulating new combinations of crystal + SiPM pairs for three different PET configurations using Geant4. This to provide a quantification of which of the three configurations would produce better technical results and therefore, reduce costs and time when building these systems. Each configuration was characterized by measuring the CTR, SR and parameters which have been previously introduced, and compared in the case of SR, with different values from the literature bib9 .
2 Methodology
2.1 Software and Hardware
Geant4 v.10.7 software bib4 was used for all simulations. Modelling was run on a commercial laptop ASUS VivoBook model X512FB-BR332T with the following characteristics: Intel® Core™ i5-8265U processor, with a frequency of 1.6 GHz, with 4 cores, 12 GB RAM. A total storage capacity of 1128 GB, with an HDD of 1000 GB and a SSD of 120 GB.
2.2 Pair modellation (crystal + SiPM)
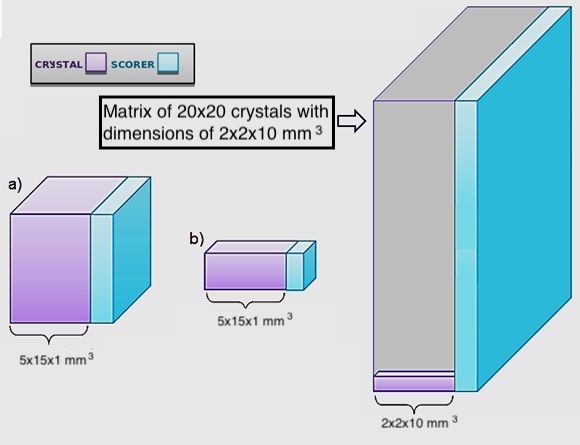
For the simulations performed in this paper, the medium surrounding the system was made up by air. To model the LYSO crystals, the elemental composition of the material (presented in Table 1) as well as its optical properties (Table 2) were considered by Geant4 software. However, this platform does not simulate electronics and therefore, it was not possible to simulate the electronic components of a SiPM. For this reason, the LYSO crystals were considered to be coupled to the sensitive detecting area named from now on as scorer, with a efficiency. That scorer represents and replaces the whole SiPM in these models. Figure 1 shows the three different dimensions of simulated LYSO crystals coupled to a scorer of equal size. LYSO crystal dimensions were: (a) coupled to scorer with area of ; (b) coupled to a scorer with area of . (c) Array of LYSO crystals. Each crystal has dimensions of coupled to a scorer with an area of . In all cases the crystal matrix covered the entire scorer sensitive area.
| Element | Symbol | Percentage |
|---|---|---|
| Lutetium | ||
| Yttrium | ||
| Silicon | ||
| Oxygen |
| Absorption | Wavelength | Attenuation | Refractive | Light output |
| length (cm) | (nm) | length (mm) | index | (photons/keV) |
2.3 PET configurations
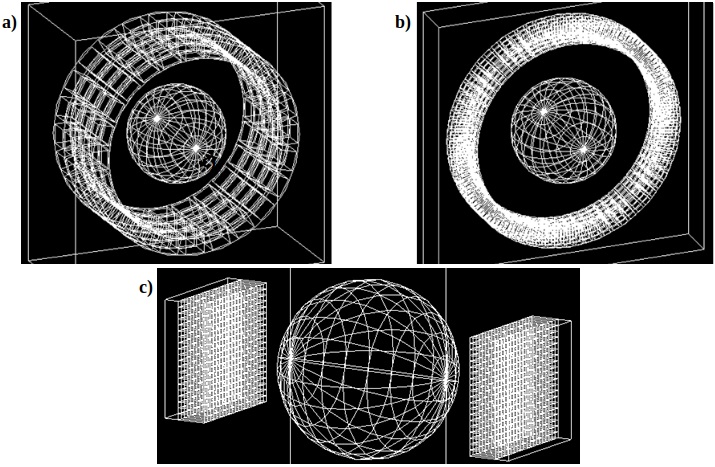
The three different PET configurations modelled in this work can be seen in Figure 2, and are described as follows:
-
1.
Ring-PET: Designed by four rings of crystal detectors with a 12 cm diameter. Each ring was made up by 24 LYSO crystals of sizes , giving a grand total of 96 crystals. Separation between crystals in each ring was . This PET configuration was based on petanimal3 and is shown in Figure 2 a.
-
2.
Ring-PET2: Designed as the previous configuration with the only difference being the size of the crystals, which in this case were maintaining the separation of between each other. Each ring was therefore composed of 72 crystals, giving a total of 288 elements. This configuration is presented in Figure 2 b.
-
3.
2 Module-PET: The design was based on a two module PET instead of the standard ring geometry bib5 . Each module contained a matrix of LYSO crystals of with a separation of between them. In total there were 800 crystals. The separation between modules was 10.2 cm. This configuration is presented in Figure 2 c.
For each of the three PET configurations, 356,000 events for the four RNs (18F, 11C, 13N and 15O) were modeled. These are RNs usually employed in PET. The kinetic energy distributions for the different positron sources simulated for this study can be observed in Figure 3. A phantom in the shape of a sphere, with a diameter of 6 cm, composed of deionized water was the source of gamma rays in these configurations. The positrons were simulated in each case as a punctual event liberated at the center of the sphere and left to scatter randomly in the radial direction until annihilation. Annihilation would happen when the kinetic energy of each positron was completely lost. Therefore, when positrons were deposited in the center of the sphere, they were deposited with different kinetic energies corresponding to the emitting RN.

2.4 PET Parameter calculation (CTR, SR and )
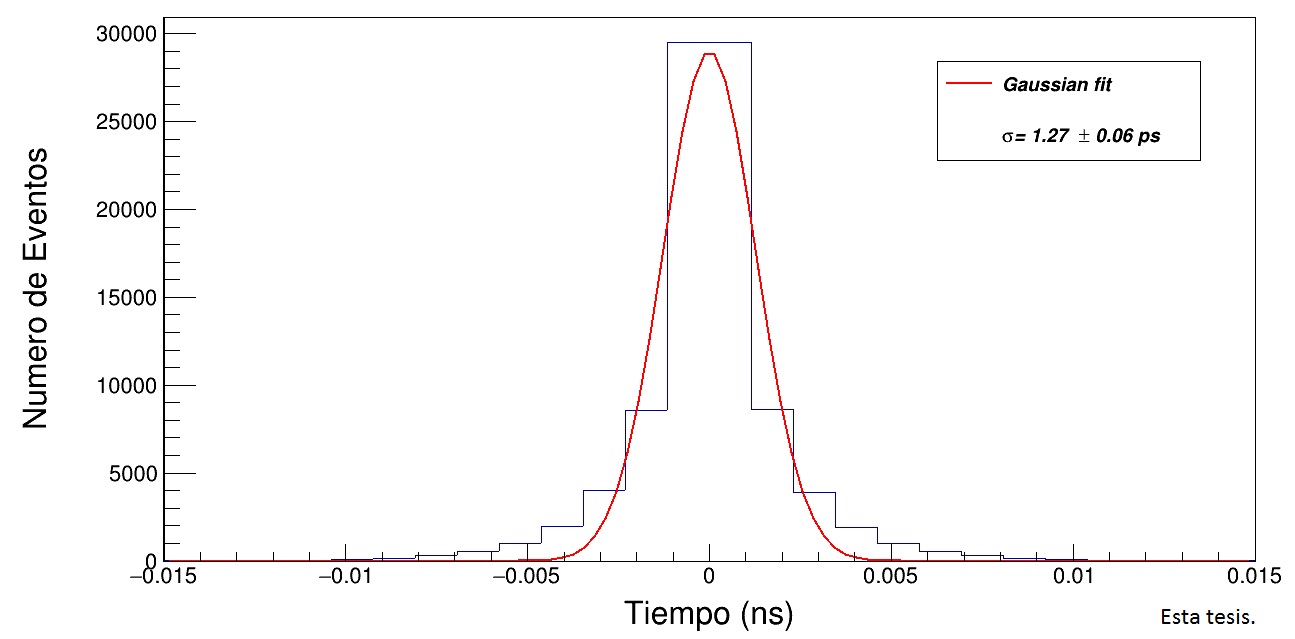
To calculate the coincident temporal resolution (CTR), the time difference between photon arrivals, was obtained for all events and for each RNs, and then plotted as an histogram. A Gaussian fit was applied to show the central tendency as seen in Figure 4. In which represents the dispersion of the data round the mean. Sigma has been used in the past to calculate the time resolution of a system BeBe .
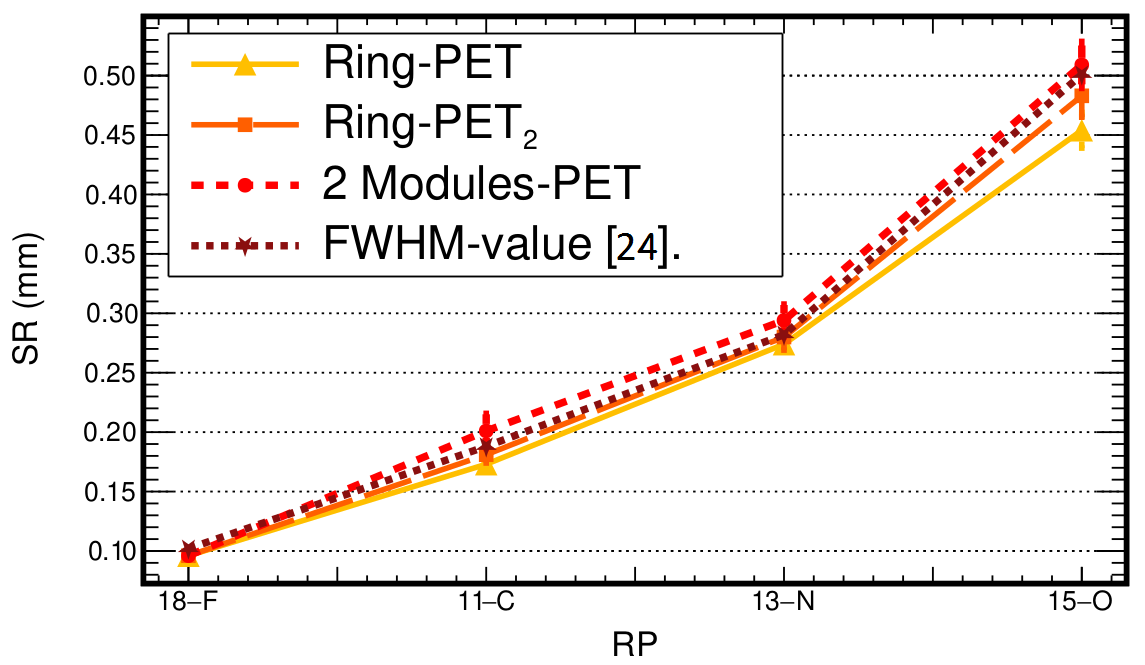
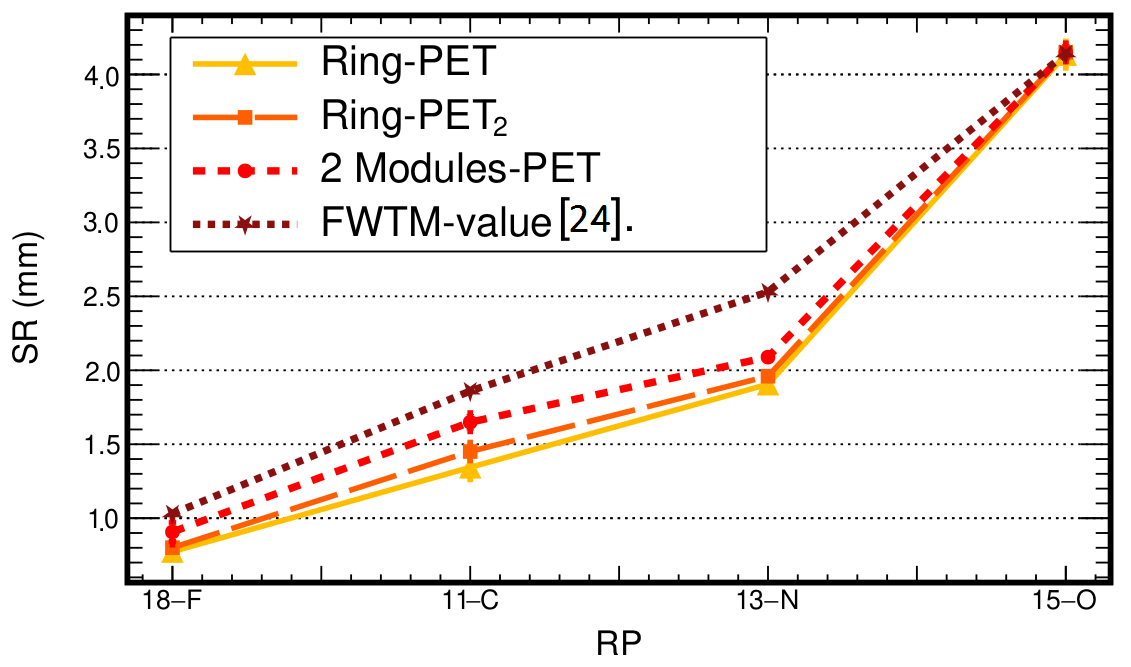
To calculate the Spatial Resolution (SR), Geant4 provides information on the coordinates (X, Y, Z) of the impact in the crystal of the gamma ray and the flight time (from creation to the first impact). The most important assumption in these calculations was to choose the two gammas that came from the same annihilation. If one gamma was detected in one crystal, the other gamma should be detected in the diametrically opposite crystal. With all this information in mind, it was possible to assume that the angle of their trajectories was approximately . Thus, using the geometry and calculating the difference in arrival times between the coincident gammas, it was possible to calculate the coordinates of the annihilation point. To this end, a histogram of the distribution on the X coordinates for the four RNs in the different configurations was plotted. From these distributions, the full width at half maximum (FWHM) and the full width at maximum (FWTM) were obtained. These values determined the minimum separation distance between measured points, that is, the SR. Finally, to obtain the acceptance value of the system (), the relationship between the number of coincident events detected in each PET configuration by the total number of annihilations produced was calculated. An event consists in the emission of a positron.
2.5 Statistics
All tables present in this work show values in the format mean standard deviation. All graphics in figures in this paper present the average value with error bars in the y axis corresponding to standard deviation. When comparing the different parameters of this study, first parametricity was assessed and then once it was confirmed, One way ANOVA tests were performed on data with the three configurations as the ANOVA factor. If ANOVA showed independence between variables, Post-hoc testing (Turkey tests) were calculated after to find differences between pairs of data. A standard 0.05 was required to achieve statistical significance. IBM SPSS statistics version 24 for statistical analysis was used for these calculations.
3 Results
3.1 CTR
The values for the four RNs and the three configurations are presented in Figure 5.
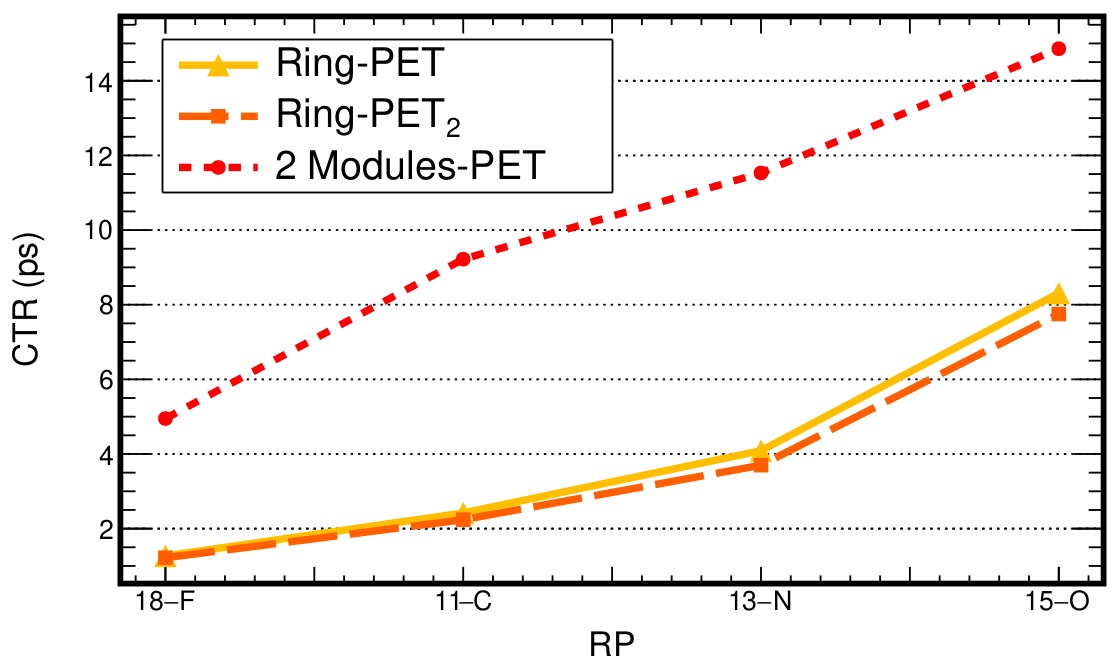
ANOVA tests showed independence of the three variables (). Post hoc tests showed that there was no statistically significant difference between CTR values of the Ring-PET and Ring-PET2 () configurations. Significant differences were obtained with the 2 Modules-PET, where the CTR values were higher by for 18F and ps for 15O compared to the other two PET configurations ( for Ring-PET and for Ring-PET2). These results can be seen in Table III. These calculations show that CTR values were larger for the 2 Module-PET configuration and the CTR value for the Ring-PET and the Ring-PET2 was similar.
3.2 Spatial Resolution
Figure 6 presents a sample reconstruction of the points where the electron-positron annihilations occurred inside the water sphere with the Ring-PET configuration for the four simulated RNs.
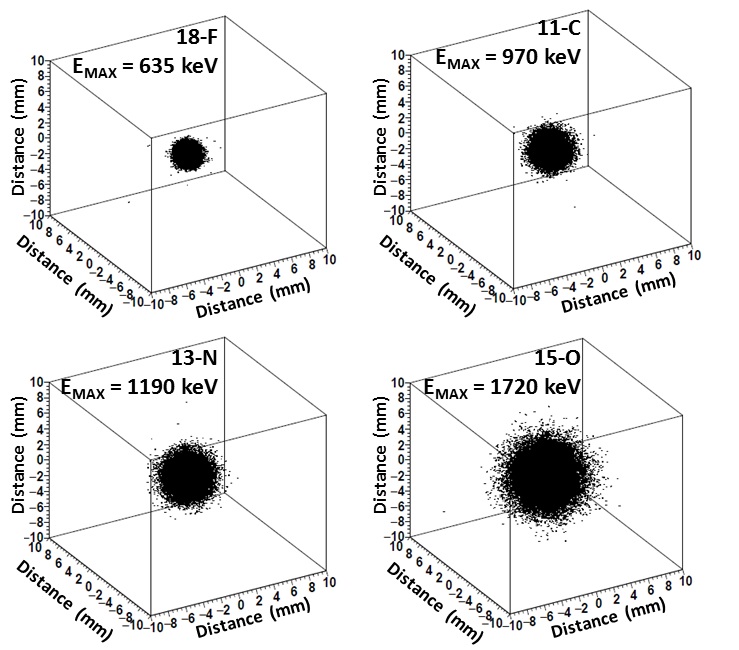
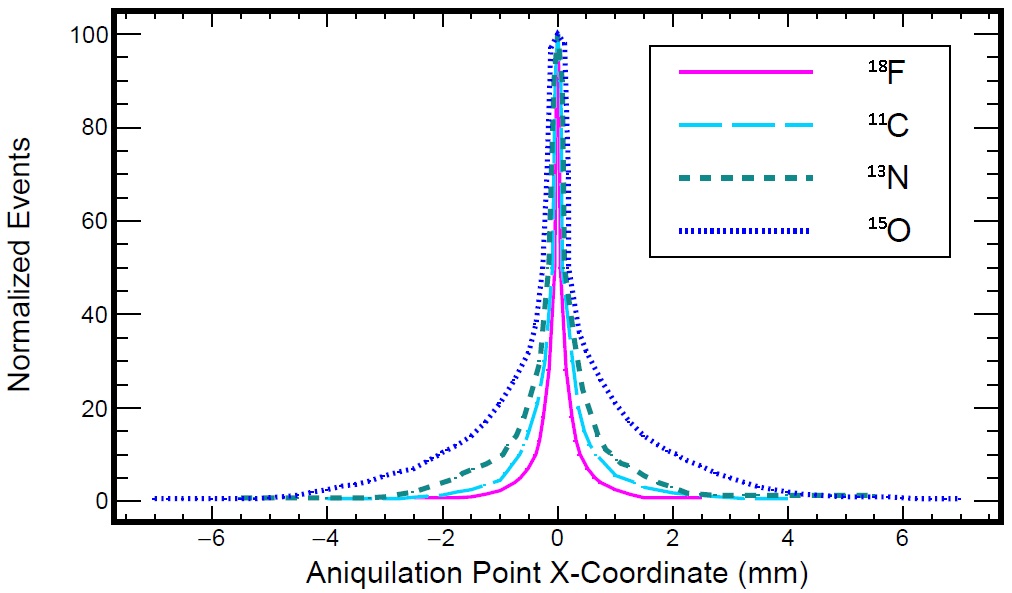
Figure 7 shows the histogram of the distribution on the coordinate for the four RNs in the Ring-PET configuration. The analysis was repeated for the three PET distributions and the four RN for comparison purposes.
Figures 8 and 9 present the results from SR calculations. Both graphs are presented for the four RNs, but the first one calculated SR with the FWHM method and the second with the FWTH method.
These results can be seen quantified in Table III. For the SR comparisons, the ANOVA tests showed independence of the three variables (configuration) for the FWHM and the FWTH measurements ( in both cases). The two Ring configurations showed no significant differences with each other for FWHM () and for FWTH (). When comparing Ring-PET with 2 Modules-PET, FWHM differences were not significant (), and FWTH were also not significant (). When comparing Ring-PET2 with 2 Modules-PET, FWHM differences were also not significant (), and either were FWTH differences (). It is of interest to point out that almost all these values were not statistically different for small margins (), which shows a trend of Ring configurations having a slighter smaller (and therefore better) SR.
3.3 Acceptance
Table 3 presents the values for the three PET configurations considering the four RNs inside of the modelled sphere. For the A comparisons, ANOVA tests showed independence of the three variables (). Post hoc tests showed that: there was a significant difference between both Ring-PET configurations with respect to values (), being Ring-PET A values larger than those of Ring-PET2. Ring-PET and 2Modules-PET had also significant different A values () being the Ring-PET values larger. In contrast, Ring-PET2 values were not significantly different from those of 2 Modules-PET ().
| RN | ||||
|---|---|---|---|---|
| FWHM (mm) | ||||
| Ring-PET | ||||
| Ring-PET2 | ||||
| 2 Modules-PET | ||||
| Literature [24] | ||||
| FWTM (mm) | ||||
| Ring-PET | ||||
| Ring-PET2 | ||||
| 2 Modules-PET | ||||
| Literature [24] | ||||
| CTR (ps) | ||||
| Ring-PET | ||||
| Ring-PET2 | ||||
| 2 Modules-PET | ||||
| Ring-PET | ||||
| Ring-PET2 | ||||
| 2 Modules-PET | ||||
4 Discussion
In this work we modelled using Geant4, three configurations for possible preclinical PET scanners with pairs of LYSO + SiPM of different sizes: This to find which configuration would be best in future scanners. The SR values calculated, were in the range of previously reported SR values in the literature (24), but did not present differences between the three configurations. CTR values were statistically better for the Ring-PET configurations compared to the 2 Modules-PET while CTR values for Ring-PET and Ring-PET2 were similar. The Ring-PET configuration due to its larger detection area, was more efficient in capturing gammas.
4.1 CTR
As mentioned in previous sections, positrons with higher kinetic energy (1,720 keV) reach greater distances before the annihilation process, compared to positrons with lower kinetic energy (635 keV) carter . Therefore, the annihilation point was located at a greater distance from the center of the sphere, closer to one crystal than the diametrically opposite (see Figure 6). Thus, the difference in the arrival time of the gammas to the crystals is greater for sources that produce positrons with higher kinetic energy. This behavior was observed for the three different PET configurations and for all RNs. The smallest CTR values were obtained for Ring-PET2, followed by Ring-PET (see Table 3). The highest CTRs were found for the 2 Modules-PET, which made it, regarding the CTR parameter, the lest adequate configuration of the three for preclinical PETs.
4.2 Spatial Resolution
In Figure 3 the maximum kinetic energy value for each RN can be observed. This characteristic turned out to be important for the annihilation point reconstruction. Positrons emitted by the 15O (EMax = 1,720 keV) traveled at least twice the distance before the annihilation process, compared with positrons emitted by 18F (EMax = 635 keV), in which the annihilation process occurred before. Consequently, the range of the positron increased as the maximum energy of the radionuclide increased. This was verified in Figure 7, in which the width of the distributions increased with energy emitted by RNs.
As it can be observed in Table 3, the values reported in literature (no error information available). Differences between literature values and FWHM were in average , while differences for the FWTH were much larger representing . We did not find a statistical difference between these values for the FWHM (), and the same for the FWTH (). Figures 8 and 9 implement a trace that corresponded to the literature values, presented there to compare with those of the simulations presented in this manuscript. This lack of statistical difference between the results from this work and those of literature, represents a partial validation for the use of Geant4 for these kinds of modellations.
The values obtained for the Ring-PET were different to the other two PET configurations regarding FWHM. That was mm for the Ring-PET2 and mm for the 2 Modules-PET.
Meanwhile, the difference between the FWTM values was mm for Ring-PET2 and mm for 2 Modules-PET. Furthermore, there was no significant evidence that the variances were different between them. Therefore, the spatial resolution was not a valid parameter in these simulations to make a decision on which configuration was best. Still, and as commented in the results section, there was an almost significant trend for the 2 Modules configuration to have a worst SR.
4.3 Acceptance
A values are presented in Table 3 for the three PET configurations and the four RNs. The 2 Modules-PET had a smaller detection area: therefore, it had the lower value, being 14.49 and 12.97 for 18F and 15O respectively. The largest value was obtained for the Ring-PET, (with 17.41 and 16.54 for 18F and 15O respectively), which had bigger crystal sizes than the Ring-PET2. This made it a more feasible configuration to detect gamma particles. It can be concluded that this parameter depends mainly on detector area and for these configurations Ring-PET was the best as it had larger LYSO detecting elements.
4.4 Limitations
The CTR values presented in this work are at most 15 ps for the 2 Modules-PET and the 15O RN. One the of the limitations of this study was to be able to physicaly measure events in that time order. A typical Time to Digital Counter (TDC) has a time resolution of 20 ps. Typically CTR values are in ns capilar , which were i.e. the 2 Modules-PET values. However, a new pico-TDC card has recently been designed to measure 2.2 ps B28 . Then, it will be possible to measure the values obtained in this work.
5 Conclusions
n this work we modelled using Geant4, three configurations for possible micro-PET scanners with pairs of LYSO + SiPM of different sizes: all this for four RNs of typical use in nuclear medicine. The main objective of this work was to facilitate future PET designs and construction saving time and resources. The SR values modeled here were in the range of the reported SR values in the literature bib9 . This represents a partial validation of the use of Geant4 as a platform on which these types of simulations were possible. CTR values were statistically better for the PET ring configurations compared to the 2 Modules-PET while CTR values for Ring-PET and Ring-PET2 were similar. The radionuclides that produced positrons with high energy presented a higher positron range than radionuclides that emitted positrons with lower energy. Therefore, the energy of the simulated source is a factor that affects the SR and CTR parameters. The Ring-PET configuration due to its larger detection area (Acceptance parameter), was more efficient in capturing gammas, and therefore reconstructing a greater number of annihilation points to produce a better image. The result of this modelling effort and this parameter analysis was, that the 2 Modules-PET configuration was worst in its performance than the Ring configurations. When comparing Ring PET and Ring-PET2 comparisons, there was a trend for the first being better (larger A but similar SR and CTR).
6 Declaration of competing interest
The authors declare that they have no known competing finan- cial interests or personal relationships that could have appeared to influence the work reported in this paper.
7 Acknowledgements
Authors would like to thank the Consejo Nacional de Humanidades Ciencias y Tecnología (CONAHCyT) for the doctoral grant of MLLT. Authors would also like to thank the access to the facilities of the Medical Physics Lab from the Faculty of Mathematical and Physical Sciences, as well as the National Supercomputing Laboratory of Southeast Mexico (LNS) of the Benemérita Universidad Autónoma de Puebla (BUAP).
References
References
- (1) Blaine P, Spicer J, Generali J, Hladik W, Johnson G. Development of a radiopharmaceutical information database. J Nucl Med Technol. (3). 230-3. PMID: 10512481. (1999)
- (2) Chain, Yamil; Illanes, Luis. «Radiofármacos». Medicina Nuclear. Fundamentos y Aplicación Clínica. Argentina: Editorial de la Universidad de la Plata. (2015). pp. 5-30.
- (3) Payolla, Filipe and Massabni, Antonio and Orvig, Chris. Radiopharmaceuticals for diagnosis in nuclear medicine: a short review. Eclética Química Journal. 44.(2019) pp. 11-19. 10.26850/1678-4618eqj.v44.3.2019.p11-19.
- (4) Yeong, Chai-Hong; Cheng, Mu-hua; Ng, Kwan-Hoong. Therapeutic radionuclides in nuclear medicine: current and future prospects. Journal of Zhejiang University SCIENCE B, 15 (10), (2014) 845–863. doi:10.1631/jzus.B1400131
- (5) Vansteenkiste J, Deroose C and Dooms C. 21-Positron Emission Tomography ed Courtney V et al. (2016) Chapter 21 360.
- (6) Vaquero, J. J., Kinahan, P. Positron Emission Tomography: Current Challenges and Opportunities for Technological Advances in Clinical and Preclinical Imaging Systems. Annual review of biomedical engineering, (2015) 17, pp. 385–414. https://doi.org/10.1146/annurev-bioeng-071114-040723
- (7) Jones, Terry; Townsend, David. History and future technical innovation in positron emission tomography. Journal of Medical Imaging (2017) 4 1, https://doi.org/011013–.doi:10.1117/1.jmi.4.1.011013
- (8) Alva-Sanchez H, Zepeda-Barrios A, Diaz-Martinez VD, Murrieta-Rodriguez T, Martinez-Davalos A, Rodriguez-Villafuerte M. Understanding the intrinsic radioactivity energy spectrum from Lu-176 in LYSO/LSO scintillation crystals. Sci Rep-Uk. 2018;8.
- (9) Saint-Gobain. CRYSTAL SAINT-GOBAIN LYSO Scintillation Material Lu1.8YSiO5:Ce. In: Saint-Gobain, editor. 2020.
- (10) Kalinnikov V, Velicheva E, Uozumi Y. Comparison of the Scintillation Properties of Long LYSO:Ce Crystals from Different Manufacturers. Phys Part Nuclei Let. 2021;18(4):457-68.
- (11) Lancelot S, Zimmer L. Small-animal positron emission tomography as a tool for neuropharmacology. Trends Pharmacol Sci. 2010;31(9):411-7.
- (12) Lara Camacho, Víctor M., Altamirano Ley, Javier. MicroPET: tomo-grafía por emisión de positrones para animales de laboratorio. Revista de la Facultad de Medicina (México), (2015) 58 1, p. 29-32.
- (13) Alva-Sánchez, Héctor et. al. Investigación preclínica por microPET en la UNAM. Revista de la Facultad de Medicina (México), 55 3, (2012) pp. 4-10.
- (14) Alvarado M, Ayala A, Ayala-Torres MA, Bietenholz W, Dominguez I, Fontaine M, et al. A beam–beam monitoring detector for the MPD experiment at NICA, Nucl. Instrum. Methods Phys. Res. A 953 (2020).
- (15) Otte N, Dolgoshein B, Hose J, Klemin S, Lorenz E, Mirzoyan R, et al. The SiPM - A new photon detector for PET. Nucl Phys B-Proc Sup. 2006:150:417-20.
- (16) Xi DM, Xie QG, Zhu J, Lin L, Niu M, Xiao P, et al. Optimization of the SiPM Pixel Size for a Monolithic PET Detector. Physcs Proc. 2012:37:1497-503.
- (17) Zepeda CH. Time Resolution Simulation Measurement for the Configuration Plastic Scintillator Material plus SiPM and its Application to Medical Physics. J Phys Conf Ser. 2020 1540.
- (18) Cates JW, Gundacker S, Auffray E, Lecoq P, Levin CS. Improved single photon time resolution for analog SiPMs with front end readout that reduces influence of electronic noise. Phys Med Biol. 2018:63(18).
- (19) GEANT collaboration G. Geant4 User’s Guide for Application Developers, GEANT4 10.7 2020.
- (20) Li Q, Wang SL, Zhao YA, Fan YQ, Zhang XJ, Zhang RQ, et al. Geant4 simulation of detection efficiency and self-attenuation effect of particles for radioxenon measurement using coincidence equipment. J Radioanal Nucl Ch. 2021;330(1):325-32.
- (21) Hurtado S, García-León M, García-Tenorio R. GEANT4 code for simulation of a germanium gamma-ray detector and its application to efficiency calibration. Nucl Instrum Meth A. 2004;518(3):764-74.
- (22) Arneodo F, Di Giovanni A, Marpu P. A Review of Requirements for Gamma Radiation Detection in Space Using CubeSats. Appl Sci-Basel. 2021;11(6).
- (23) Altruda S, Christiansen J, Horstmann M, Perktold L, Porret D, Prinzie J. PicoTDC: a flexible 64 channel TDC with picosecond resolution. J Instrum. 2023;18.
- (24) Levin CS, Hoffman EJ. Calculation of positron range and its effect on the fundamental limit of positron emission tomography system spatial resolution. Phys Med Biol. 1999;44(3):781-99.
- (25) Enriquez-Mier-y-Teran FE, Alva-Sanchez H, Zepeda-Barrios A, Murrieta-Rodriguez T, Martinez-Davalos A, Rodriguez-Villafuerte M. GATE simulation of the intrinsic radioactivity in LYSO scintillation crystals. Nucl Instrum Meth B. 2019;454:1-5.
- (26) Usubov Z. Light output simulation of LYSO single crystal. arXiv. 2013.
- (27) Carter LM, Kesner AL, Pratt EC, Sanders VA, Massicano AVF, Cutler CS, Lapi SE, Lewis JS. The Impact of Positron Range on PET Resolution, Evaluated with Phantoms and PHITS Monte Carlo Simulations for Conventional and Non-conventional Radionuclides. Mol Imaging Biol. 2020 Feb;22(1):73-84.
- (28) Alva-Sánchez H. Prototipo de microtomógrafo por emisión de positrones. Resolución espacial y estudios metabólicos. Rev Mex Fis. 2010;56(2):7.
- (29) Sui T, Zhao Z, Xie S, Huang Q, Xu J, Peng Q. Pico-TDC: a novel FPGA-based TDC with 2.2ps RMS timing resolution. Ieee Nucl Sci Conf R. 2017.