Phase-field simulations of the effect of temperature and interface for zirconium hydrides
Abstract
Hydride precipitation in zirconium cladding materials can damage their integrity and durability. Service temperature and material defects have a significant effect on the dynamic growth of hydrides. In this study, we have developed a phase field model based on the assumption of elastic behaviour within a specific temperature range (613-653K). This model allows us to study the influence of temperature and interfacial effects on the morphology, stress, and average growth rate of zirconium hydride. The results suggest that changes in temperature and interfacial energy influence the aspect ratio and average growth rate of the hydride morphology. The ultimate determinant of hydride orientation is the loss of interfacial coherence, primarily induced by interfacial dislocation defects and quantifiable by the mismatch degree . An escalation in interfacial coherence loss leads to a transition of hydride growth from horizontal to vertical, accompanied by the onset of redirection behaviour. Interestingly, redirection occurs at a critical mismatch level, denoted , and remains unaffected by variations in temperature and interfacial energy. However, this redirection leads to an increase in the maximum stress, which may influence the direction of hydride crack propagation. This research highlights the importance of interfacial coherence and provides valuable insights into the morphology and growth kinetics of hydrides in zirconium alloys.
pacs:
Zirconium hydride, Phase-field method, Temperature effect, Mismatch degreeI IINTRODUCTION
Zirconium (Zr) alloys are extensively employed as cladding materials in various reactor typeshedayat2017developing due to their low neutron absorption rate, robust resistance to corrosion, and adequate high temperature strength, excellent thermal conductivity, and ductilitybair2015review ; motta2019hydrogen . However, hydrogen is absorbed into the Zr cladding by the waterside corrosion reaction during reactor operationensor2017role , thereby precipitating hydrides when the solid solubility limit of the hydrogen in the Zr alloys is exceeded. Hydride precipitates causes a degradation in the mechanical properties of the claddingghosal2001corrosion , increasing the embrittlement and even inducing the fracture of the claddingmotta2019hydrogen ; kim2022hydride . Consequently, the investigation of the hydrogen corrosion behavior in Zr is crucial for predicting material property degradation and assessing the service life of the cladding.
A great deal of experimental works have been done to better understand hydride precipitate and growth in Zr alloyskim2022hydride . Based on experimentszuzek1990h ; daum2009identification ; puls2012effect , there are four recognized phases of hydrides which can form in Zr, namely, -ZrH0.5, -ZrH, -ZrH1.5+x, and -ZrH2 phases. -phase is a stable face-centered cubic (fcc) phase and the most prevalent phase in the cladding materials. -hydrides usually form on the circumferential planes of cladding in the absence of stresses, and have a platelet-like shapehan2019phase ; heo2019phase . Moreover, when the cladding with hydrides is subjected to high temperature (350∘C for example) and applied tensile circumferential stress during dry storage, these hydride platelets undergo a transition from circumferential to radial orientations relative to the cladding tube geometry by dissolving and precipitatingcolas2010situ ; colas2010hydride ; colas2013effect . The reoriented radial hydrides serve as fracture initiators and propagation, and ultimately cause the mechanical failure of the cladding. Therefore, the mechanical properties and performance of the Zr cladding are highly sensitive to the specific hydride microscopic morphology. However, more information is still needed in the areas of the formation mechanisms of various hydride morphology, particularly to develop the capability to simulate accurately these various morphology under varying conditions, such as different temperatures.
Phase-field (PF) modeling, based on principles of thermodynamics and kinetics, provides a powerful approach for simulating microstructure evolution in various phase transformation phenomena, such as spinodal decompositionkwon2007coarsening ; seol2003three , coarseningkwon2009topology ; mendoza2004topological , solidificationboettinger2002phase ; YANG2020109220 ; yang2021hydride , and film growthwang2004phase ; SHI2022118147 ; shi2022ultrafast ; shi2022phase . Numerous PF models have been developed to investigate the microstructure evolution of different hydrides in Zr alloys. Most of them were created for the -hydridezhao2008characterization ; thuinet2012phase ; thuinet2013mesoscale and the -hydridema2002phase ; ma2002simulation ; ma2002effect ; ma2006phase ; shi2015quantitative ; bair2016phase . In recent years, many researchers have focused on the -hydrides and started to develop corresponding PF models to study the characteristics of -hydride morphology. Jokisaari et al.jokisaari2015general developed a -hydride PF model to study the growth kinetics of the -hydride by modifying the free energies based on the CALPHAD (CALculation of PHAse Diagrams). Bair et al.bair2017formation investigated the effects of metastable phases (-phase and -phase) on the nucleation and growth of the -hydride using a multiphase field model. Han et al.han2019phase explored the stacking structure formation and transition of -hydride precipitates in Zr. Heo et al.heo2019phase developed a polycrystalline PF model considering the loss of the interfacial coherency and the grain boundary segregation to investigate -hydride growth behavior. Additionally, Lin et al.lin2019modeling and Shin et al.shin2020phase examined the reorientation behavior of -hydrides under applied stress fields. Simon et al.simon2021investigation developed a quantitative PF model for -hydrides and analyzed the role of anisotropic elastic interaction on hydride stacking and reorientation. Wu et al.wu2022phase studied the microstructural evolution of hydride blister formed by -hydride aggregation. However, the morphology and growth kinetics of -hydride are strongly influenced by the environmental temperature and metal/hydride interfacial effects (interfacial energy and interfacial coherency). Previous studies on -hydrides in Zr lacked detailed discussions on the these key factors governing -hydride morphology and growth kinetics, hindering the accurate simulation of -hydride morphology in Zr and the development of quantitative PF model. Therefore, it is imperative to explore and comprehend the influences of these factors on -hydride morphology and growth behavior in Zr.
This work aims to investigate the influence of temperature and interfacial effects on the -hydride morphology and growth kinetics. To achieve this objective, we adopt a PF model based on the Kim-Kim-Suzuki (KKS) assumptionkim1999phase . Using CALPHAD method, temperature-dependent bulk free energy curves are constructed to describe the contribution of bulk free energy to the total free energy within the service temperature range of zirconium alloys. Therefore, we can capture the morphological changes of hydrides at different temperatures. In addition, the effects of interfacial energy and the loss of interfacial coherency on the morphology, stress and growth kinetics of hydrides are studied, and a reorientation behavior influenced by the loss of interfacial coherency is found. Meanwhile, we reveal the underlying mechanism of these factors affecting the hydride morphology and growth kinetics based on the diffusion interfacial velocity theory.
The contents of the article are organized as follows. In Section 2, we presents this PF model coupled with varying temperature in detail, including the governing equations of the PF model and the free energies of the system and the interface moving velocity. In Section 3, the results and their implications are presented. Finally, Section 4 includes the paper by summarizing the key results and contributions of this study.
II PHASE-FIELD MODEL
II.1 Governing equation
The PF method is widely used to study the evolution of microstructures with heterogeneity in composition and structure. Specifically, in the Zr-H system, the structural order parameter is used to describe the phase transformation from matrix to hydride precipitate and the variation of hydrogen concentration is used to describe diffusion during the phase transformation. In this PF model, the Zr-H system’s total free energy is consist of the bulk free energy , the interface gradient energy , and the elastic strain energy , which is given by:
| (1) |
where is the bulk free energy density as a function of temperature , composition and structural order parameter , is the interface gradient energy density because of diffuse interface, is the elastic strain energy density associated with displacement and order parameter .
To ensure the reduction of the free energy during the evolution of microstructures, the PF governing equation could be derived by minimizing the total free energy via variational differentiation as follows:
| (2) | |||
| (3) |
where is the kinetic coefficient; is the time; is the mobility similar to one defined by Steinbach and Apel as followssteinbach2006multi : ), where is the diffusion coefficient.
II.2 Bulk free energy density
The bulk free energy density can be constructed by KKS assumption. In the KKS assumption, each material point is regarded as a mixture of two phases, and a local equilibrium of chemical potential is always satisfied between the two phases. In this PF model, these assumptions could be expressed as follows:
| (4) | |||
| (5) |
where and are the mole fraction of hydrogen in the Zr matrix and hydride precipitate respectively; and are the free energy densities of the Zr matrix and hydride precipitate at temperature respectively. Additionally, is the interpolation function that increases monotonically from to . The bulk free energy density of the system is defined by a method similar to the concentration assumption as follows:
| (6) | ||||
| (7) | ||||
| (8) |
where is the double potential well function and is the height of the double potential well, and are the molar Gibbs free energies of the Zr matrix and hydride precipitate respectively; is the molar volume of the system.
The molar Gibbs free energies and can be obtained by CALPHAD method through the sublattice modeldupin1999thermodynamic ; zhong2012thermodynamics . In the sublattice model, Zr fills the first sublattice and hydrogen and vacancies fill the second sublattice. Considering the matrix with an hcp structure and precipitate with an fcc structure, is used to describe the matrix and is used to describe precipitate. The molar free energies for and is expressed by the following formula:
| (9) | |||
| (10) | |||
| (11) | |||
| (12) | |||
| (13) | |||
| (14) | |||
| (15) |
where and are the reference free energy of mixing of the end members in the matrix and precipitate respectively; and are the free energy of mixing for an ideal soluation in the matrix and precipitate respectively. Significantly, the free energy formula of precipitate compared with the matrix includes the excess free energy of mixing. The parameters for , , , , , are supplied by Ref dupin1999thermodynamic ; zhong2012thermodynamics . and are the mole fractions of hydrogen and vacancy atom related to and respectively. These formulas for the matrix can be expressed as follows:
| (16) | |||
| (17) |
These formulas for the precipitate can be expressed as follows:
| (18) | |||
| (19) |
According to the above CALPHA method, the Zr-H phase diagram is drawn in Fig. 1. To improve the numerical stability of the calculation, the molar Gibbs free energies and are approximated by using quadratic polynomials near the equilibrium composition. Based on parabola approximationsheng2022phase ; sheng2023multiphasefield ; bair2017formation , the molar Gibbs free energies and are written as:
| (20) | |||
| (21) | |||
| (22) | |||
| (23) | |||
| (24) | |||
| (25) | |||
| (26) | |||
| (27) |
where the detail determined method of coefficients can be seen in Secton 1 of Supplementary Materials.
The service temperature of the Zr cladding tube is around 623 K. Fig. 2 shows the results of the parabolic approximation for molar Gibbs free energies and from = 613 K to = 653 K.
II.3 Interface gradient energy density
The interface gradient energy density includes two aspects of contribution from inhomogeneous composition and structure across the interfacemai2016phase ; han2019phase . In the PF frame, the interface gradient density could be written as:
| (28) |
where and are the gradient energy coefficients related to the order parameter gradient and the concentration gradient, respectively. Due to the fact that the contribution of order parameter gradient to the interface gradient energy could be sufficient to approximate the energy contribution from the diffuse interface, so it is assumed that mai2016phase ; han2019phase .
The value of gradient energy coefficient and the height of the double potential well could be determined by interfacial energy and interface thickness , as followsyang2021explicit :
| (29) | |||
| (30) |
II.4 Elastic strain energy density
Due to lattice mismatch and volume mismatch of two phases during the phase transformation from matrix to precipitate, the elastic strain energy generated can not be ignored. The elastic strain energy density is expressed as:
| (31) |
where is the elastic strain, is the elastic constant tensor (the Einstein summation convention is used). Because solving the elastic solution of elastic inhomogeneous solid requires a lot of calculations, in our simulation, we assume that the elastic constant of the hydride phase is the same as that of the matrixhan2019phase . According to the classical Khachaturyan micro-elasticity theorymorris2010khachaturyan , the elastic strain can be calculated as follows:
| (32) | |||
| (33) |
where is the microscopic heterogeneous strain relates to the displacement . is the eigenstrain related to the mismatch degree , depicting the degree of lattice mismatch due to the volume expansion during the phase transformation and the loss of interfacial coherency. The mismatch degree describes the loss degree of interfacial coherency. Notably, only elastic strain is taken into account in this PF model, which means that no plastic deformation could take place.
With Lagrangian finite-strain theorylubliner2008plasticity , the eigenstrain is expressed as:
| (34) | |||
| (35) |
where is the total lattice transformation tensor or deformation gradient tensorheo2019phase , the superscript represents the matrix transpose and represents the identity matrix, , and represents the lattice parameters of Zr and . The calculation process of is detailed in Section 2 of Supplementary Materials.
Once the elastic constant tensor and strain are defined, the stress assuming linear elasticity is derived as follows:
| (36) |
The displacement of system is obtained by assuming the use of quasi steady state approximation to solve the mechanical equilibrium equation, as follows
| (37) |
| Parameters | Symbol | Value | Unit |
|---|---|---|---|
| Interface thickness | |||
| Diffusion coefficienthan2019phase | |||
| Gas constant | 8.3145 | ||
| Molar volumejokisaari2015general | 14 | ||
| Kinetic coefficientshan2019phase | |||
| Elastic constantolsson2014ab | 155, 67, 65, 155, 40 | ||
| Eigenstrainhan2019phase | - | ||
| Misfit parameterheo2019phase | 0.8-1.0 | - | |
| Temperature | 613-653 | K | |
| Interfacial energyhan2019phase | 0.28-1.0 |
II.5 Interface moving velocity
In the classical sharp interface kinetics, the normal moving velocity of the interface is proportional to the variation of free energy per unit volume during the nucleation and growth processporter2009phase . For the PF diffuse interface kinetics, Yang et al.yang2021explicit adopted the operator analysis method to analyze the PF kinetics equation, and derived the expression of the interface moving velocity. The specific expression is as follows:
| (38) | |||
| (39) | |||
| (40) | |||
| (41) |
where represents the local curvature, represents the change of free energy during the phase transformation, including two parts: chemical driving force and elastic interaction energy . It can be seen from the above formula that the interface moving velocity is mainly affected by the dynamic coefficient, interfacial energy, chemical driving force, elastic interaction energy and interface curvature. In Eq. 38, the first term promotes the occurrence of the movement of the interface, and the second term inhibits the advancement of the interface, and the smaller the radius of curvature, the more obvious the inhibition effect. When the elastic interaction energy () is negative, it exerts a positive influence on interface pushing. Conversely, when is positive, it exhibits an inhibitory effect on interface pushinghan2019phase .
II.6 Numerical implementation
In this study, the finite element method (FEM)bair2016phase ; sheng2022phase is used to solve the governing equation. To ensure both stability and accuracy in the numerical simulations, a triangular element with a grid size of 2 nm is chosen. Additionally, a local adaptive mesh refinement scheme is applied strategically to avoid unnecessary refinement of finite element meshes throughout the simulation domain, thus enhancing computational efficiency.
For time integration, we adopt the implicit backward difference method, which provides numerical stability when solving the time-dependent governing equation. To further optimize the time stepping process, an adaptive time marching scheme is implemented with a tolerance level set at . This adaptive approach allowed for efficient time stepping while still maintaining the required level of accuracy for the simulation results.
III RESULTS AND DISCUSSION
The initial hydrogen concentration in the matrix is set to 0.05, while the hydride has an initial concentration of 0.6 han2019phase . Nucleation of the hydride occurres at the center of the simulation domain, with a nucleation point having a radius of 2 nm. The presence of hydrogen in the matrix at a supersaturated level serves as a larger driving force for hydride growthhan2019phase , ultimately reaching a two-phase equilibrium. Table 1 provides an overview of all the parameters utilized in this simulation.
To validate the effectiveness of the model, we initially conducted tests under completely coherent conditions with a mismatch degree of = 1, consistent with previous results. These tests confirmed the reliability and accuracy of our model in capturing the growth morphology of hydrides. As illustrated in Fig. 3 (a) - (c) and (e) - (g), the phase transition from the metal matrix to hydride precipitation has been effectively monitored and characterized using variables (concentration) and (order parameter). In Fig. 3 (a) and (e), the system orientation is specified such that the x-axis (horizontal direction) and the y-axis (vertical direction) align with the a-axis ( direction) and c-axis ( direction) of a hcp Zr crystal. Due to the mismatch of the hydride phase being greater along the a-axis direction than along the c-axis direction, hydride growth predominantly occurs in the a-axis direction, resulting in an elliptical shape of the hydride particles.
The energy distribution analysis of the hydride, illustrated in Fig. 3(b), reveals a relatively uniform distribution of the chemical driving force, with slightly lower values observed at the hydride tip. In contrast, the distribution of elastic interaction energy exhibits greater anisotropy compared to the chemical driving force. At the hydride tip, the negative elastic interaction energy favors hydride growth along the a-axis. The positive elastic interaction energy can inhibit hydride growth along the c-axis. These results highlight the important role of elastic interaction energy in shaping hydride morphology. Next, the effects of temperature, interfacial energy and mismatch degree on the kinetic growth of hydride were tested.
III.1 Effect of temperature
Under service conditions at approximately 623 K, hydrogen can exist in solution where it is highly mobile. However, the presence of excess hydrogen or changes in temperature may lead to the precipitate of hydrides steinbruck2010high . In order to investigate the effect of temperature on -hydride, simulations were performed with consistent initial conditions at temperatures of 613 K, 623 K, 633 K, 643 K, and 653 K. The focus was on examining the influence of temperature on hydride shape and size.
Within this temperature range, the diffusion coefficient exhibits variations as a function of temperature, while no significant changes are observed in the elastic constants and eigenstrain. It is assumed that the interfacial energy remains relatively constant. For these reasons, all simulations were conducted using the elastic constants, constitutive strains, and temperature-dependent diffusion coefficients as presented in Table 1.
The simulation results presented in Fig. 4(a) demonstrate the significant impact of temperature on the length and thickness of hydrides. Specifically, the length-to-thickness ratio of hydrides initially increases and then decreases as the temperature rises. The variation in precipitate thickness is likely attributed to changes in the chemical free energy contributions within the system. Under equilibrium conditions, the shape of the precipitate is governed by the interplay between elastic properties and interfacial energy. The observed changes in hydride length and thickness can be primarily attributed to alterations in the chemical free energy resulting from temperature changes.
To further investigate this phenomenon, the evolution of the growth area over time at different temperatures and the average growth rate were explored, as depicted in Fig. 4(b). As the temperature increases, the growth area of hydrides decreases, accompanied by a decrease in the growth rate. This decrease in the growth rate can be attributed to the reduction in the chemical driving force resulting from the increased temperature. According to Equation (38), a decrease in the chemical driving force impedes the movement of the interface during the phase transition. It is important to note that when testing a wider temperature range, the results did not converge. Considering the significant temperature variations, the competition between elastic properties and interfacial energy governs the shape of the precipitate under equilibrium conditions. Therefore, it is likely that adjustments to the elastic strain energy or interfacial energy are required to achieve convergence when considering temperature changes.
III.2 Effect of interfacial energy
The loss of interfacial coherency between the hydride and matrix has a significant effect on the interfacial energy between the and phases. Jokisaari et al. jokisaari2016multiphysics suggest that the interfacial energy can be estimated from the chemical energy of the interface and the energy contributed by the existence of dislocations, resulting in a combined energy. Experimental and theoretical calculations have yielded different estimates for the - interfacial energy, with Jokisaari et al. reporting approximately 0.3 , and Massih et al. massih2009stress estimating it to be 0.28 from the measurement data of nucleation rate. However, the excess energy caused by semi-coherency cannot be ignored. For convenience, this study considers an interfacial energy of 0.28 and investigates the impact of interfacial effects with different interfacial energy values on the length of hydrides. It should be noted that the isotropy assumption of the interface is made due to the lack of data in the literature, but the orientation relationship between different directions may affect the interfacial energy value.
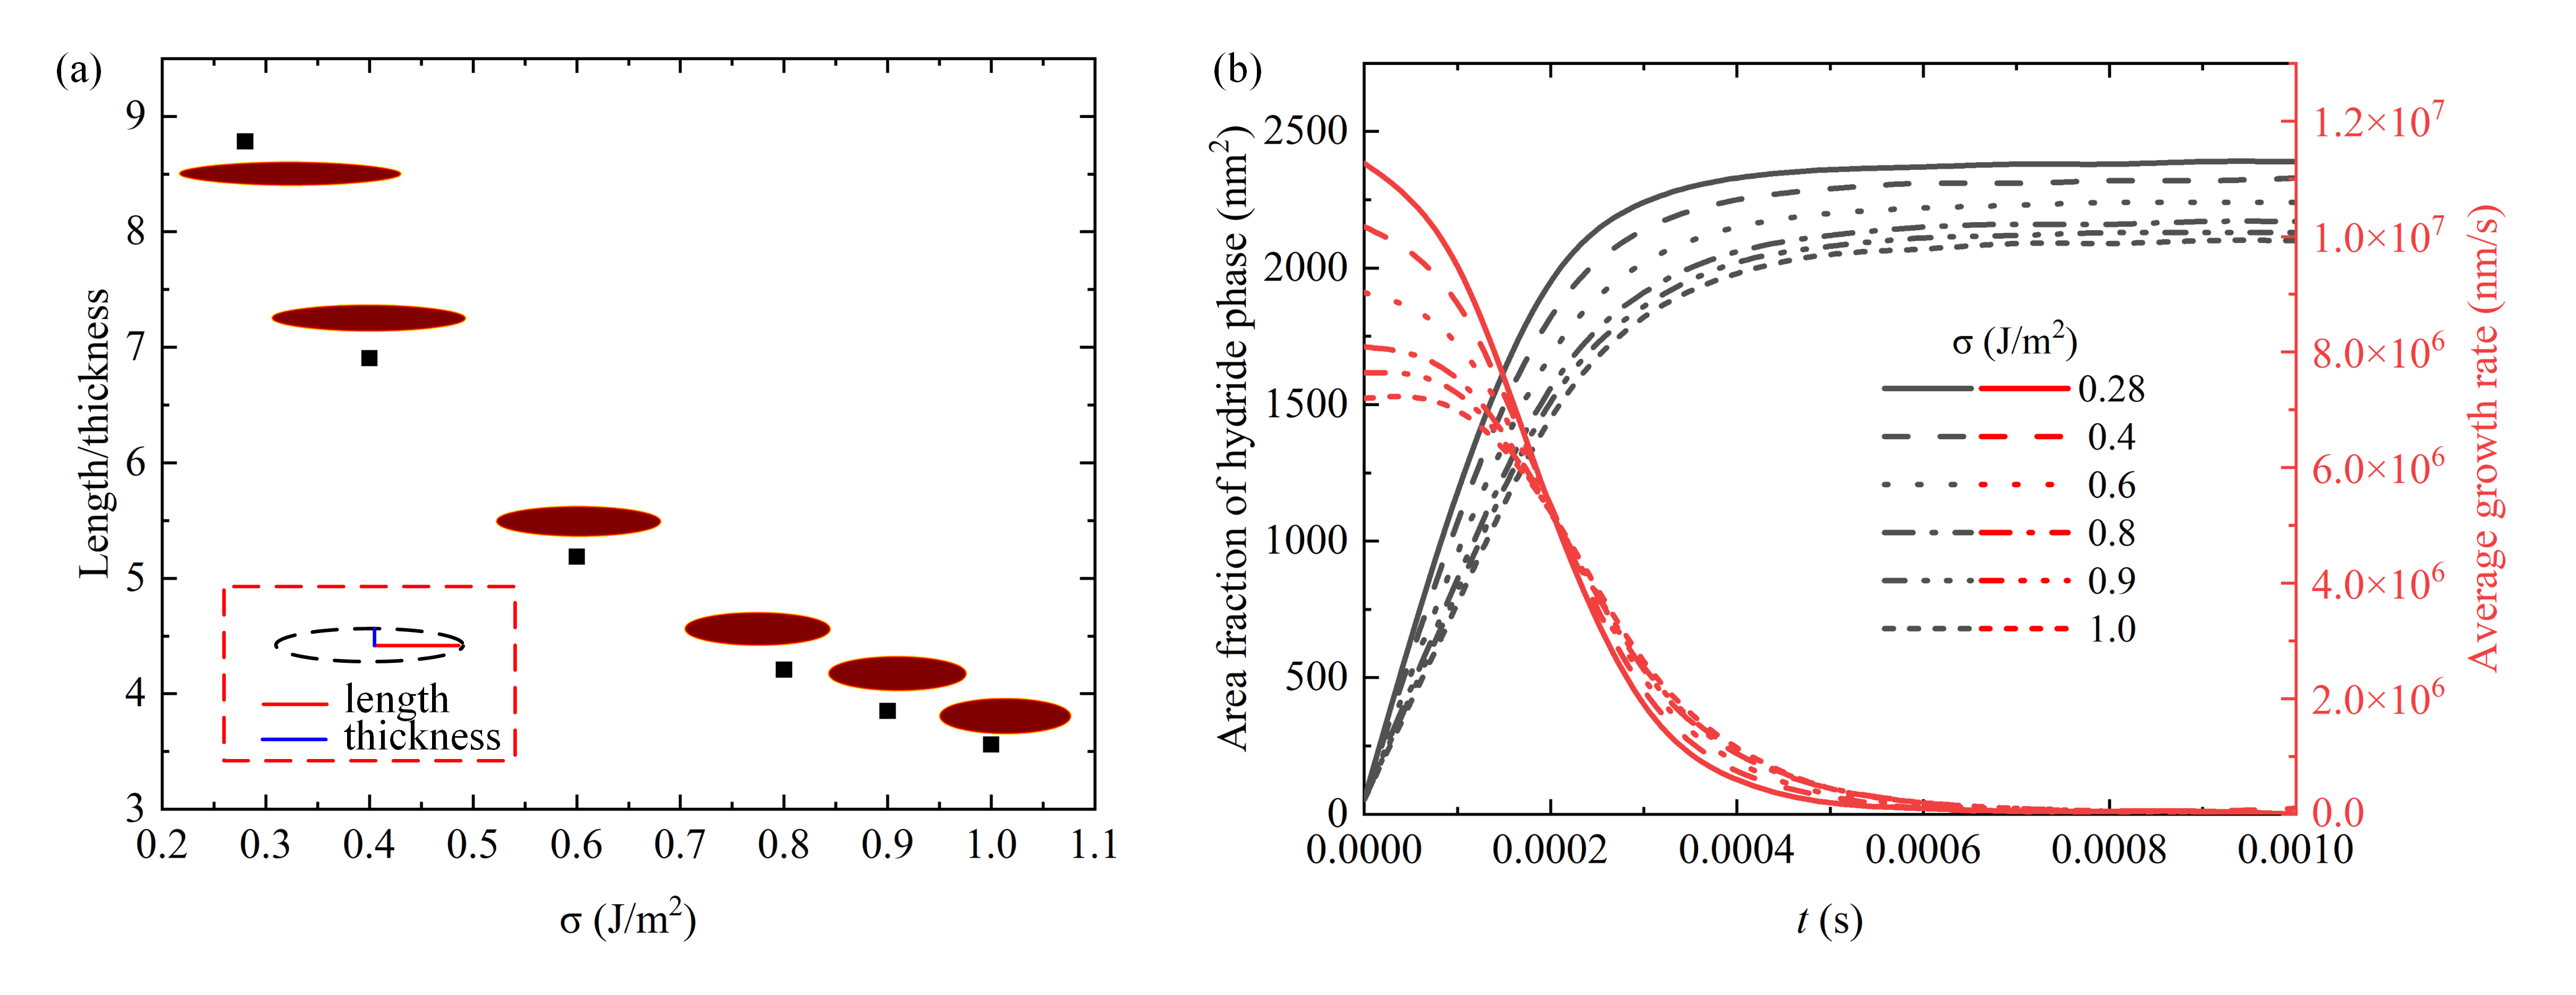
As depicted in Fig. 5(a), the interfacial energy influences the morphology of the hydride particles but does not affect the equilibrium hydrogen composition in the two phases. Higher values of interfacial energy lead to the formation of spherical hydrides rather than the elongated sheet-like hydrides observed in experiments. The growth area changes over time under different interfacial energy conditions are illustrated in Fig. 5(b), indicating that the growth area is larger under low interfacial energy. In terms of the growth rate, higher interfacial energy results in a slower growth rate of hydrides, and hydrides with lower interfacial energy reach equilibrium faster. The interfacial energy affects the gradient energy coefficient in the phase field model and hinders the interface motion, which is consistent with the simulation results based on Equation (38). Due to the difficulty in directly measuring the interfacial energy in experiments, theoretical calculations and the observed hydride morphology often align well with the calculated value of 0.28 . Generally, the interfacial energy can encompass both structural and coherent contributions due to the presence of dislocations at the interface. Considering the uncertainties in the simulation process, it is reasonable to appropriately increase the interfacial energy to obtain the ideal hydride morphology.
III.3 Effect of the loss of interfacial coherency
When considering interface effects, the influence of the loss of interfacial coherency should not be overlooked in addition to the interfacial energy. Liu et al.liu2022dislocation underscored the significant role of dislocations in hydride precipitation in their experiments. Dislocations can impact the lattice matching between two phases, leading to a loss of interfacial coherence. This loss of interfacial coherence, coupled with changes in interfacial energy, plays a pivotal role in shaping interfacial behavior. Due to the different crystal structures between the Zr-based phase and the hydride, the elastic strain energy generated by the precipitate of hydrides in the Zr-based phase cannot be ignored. The formation of hydrides involves significant volume expansion, which typically leads to the loss of interface coherency due to the formation of dislocations that accommodate the volume change. Different degrees of interface coherency loss result in varying degrees of lattice mismatch between the two phases. Here, by considering the mismatch degree introduced by Heo et al.heo2019phase , which acts on the transformation of the matrix phase to the hydride phase, the variation of mismatch degree primarily affects the magnitude of the eigenstrain. The calculation process for the mismatch degree can be found in Section 2 of Supplementary Materials. Nonetheless, current research has omitted the consideration of shear strain, as the path with the lowest energy for hydride phase transition is devoid of shear strainet al.zhang2016homogeneous ; louchez2017microscopic , a similar method also adopted by Simonsimon2021investigation .
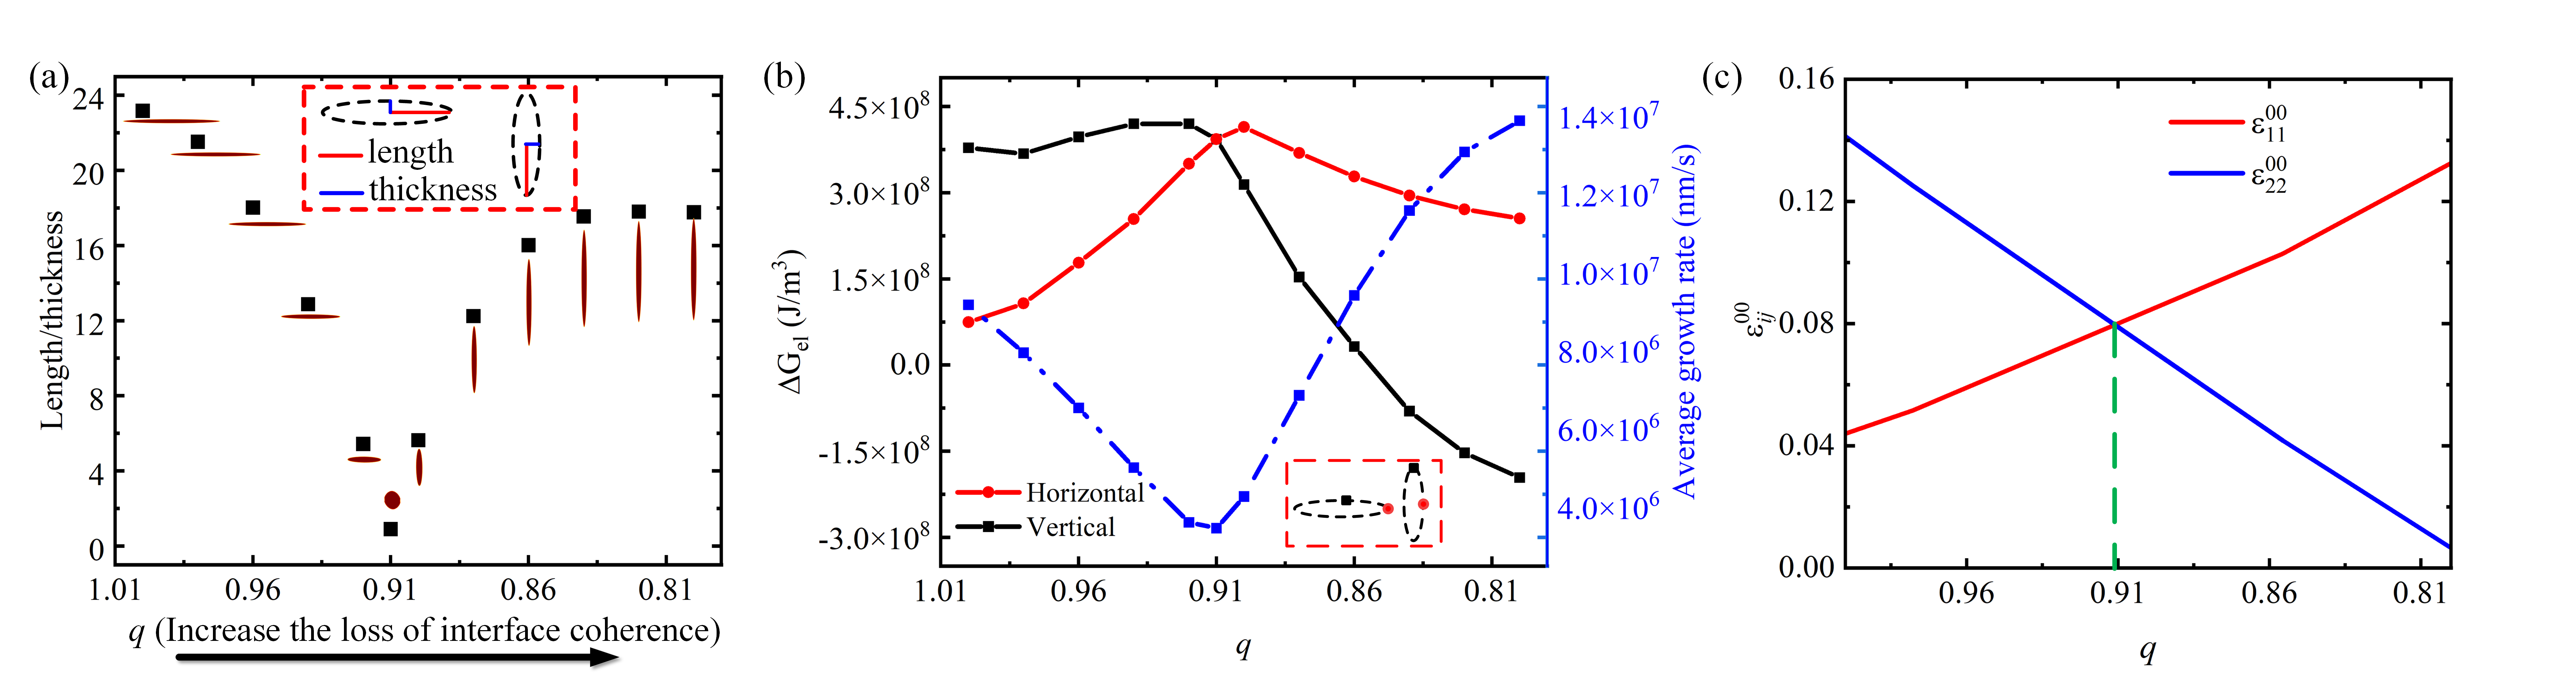
The morphology of hydrides was simulated within the range of mismatch degrees from 0.8 (incompletely coherent interface) to 1 (fully coherent interface), as shown in Fig. 6(a). The aspect ratio of hydrides initially exhibits a decrease, followed by an increase as interfacial coherence loss escalates. When exceeds , hydrides undergo redirection behavior and we designate this threshold as the critical mismatch degree . This phenomenon can be elucidated by considering the anisotropic effect induced by the loss of interfacial coherence in the distribution of elastic interaction energy within hydrides. As depicted in Fig. 6(b), with a decreasing value, the elastic interaction energy initially exhibits an increase, followed by a decrease. When exceeds , the elastic interaction energy in both horizontal and vertical directions is positive, which hinders hydride growth. Nevertheless, the elastic interaction energy in the horizontal direction is lower than that in the vertical direction, indicating that the inhibitory effect in the horizontal direction is comparatively less pronounced than in the vertical direction. Consequently, hydrides tend to grow horizontally. Conversely, when is below , the horizontal elastic interaction energy exceeds the vertical elastic interaction force, while the vertical elastic interaction energy exhibits a negative value when is below 0.86, which favors the growth of hydrides. Additionally, as the degree of mismatch increases, the average growth rate initially increases and then slows down, reaching its maximum value at , corresponding to the minimum aspect ratio of hydride morphology. The average growth rate of hydrides decreases with an increase in elastic interaction energy, reflecting the inhibitory effect of elastic interaction energy on the hydride growth rate, consistent with the inhibition of interface migration velocity by elastic interaction energy in Equation (38). From Fig. 6(c) , we can visually observe the changes in the principal strain as the mismatch parameter decreases. When the value is greater than , the strain in the 22 direction is larger than that in the 11 direction. However, when the value is less than , the strain in the 22 direction becomes smaller than that in the 11 direction. When the strain in the 11 direction exceeds that in the 22 direction, hydrides exhibit a propensity to grow in the 11 direction. This provides a model-based explanation for the occurrence of reorientation and the above analysis can provide trends of morphological evolution for the growing phase before reaching equilibrium.
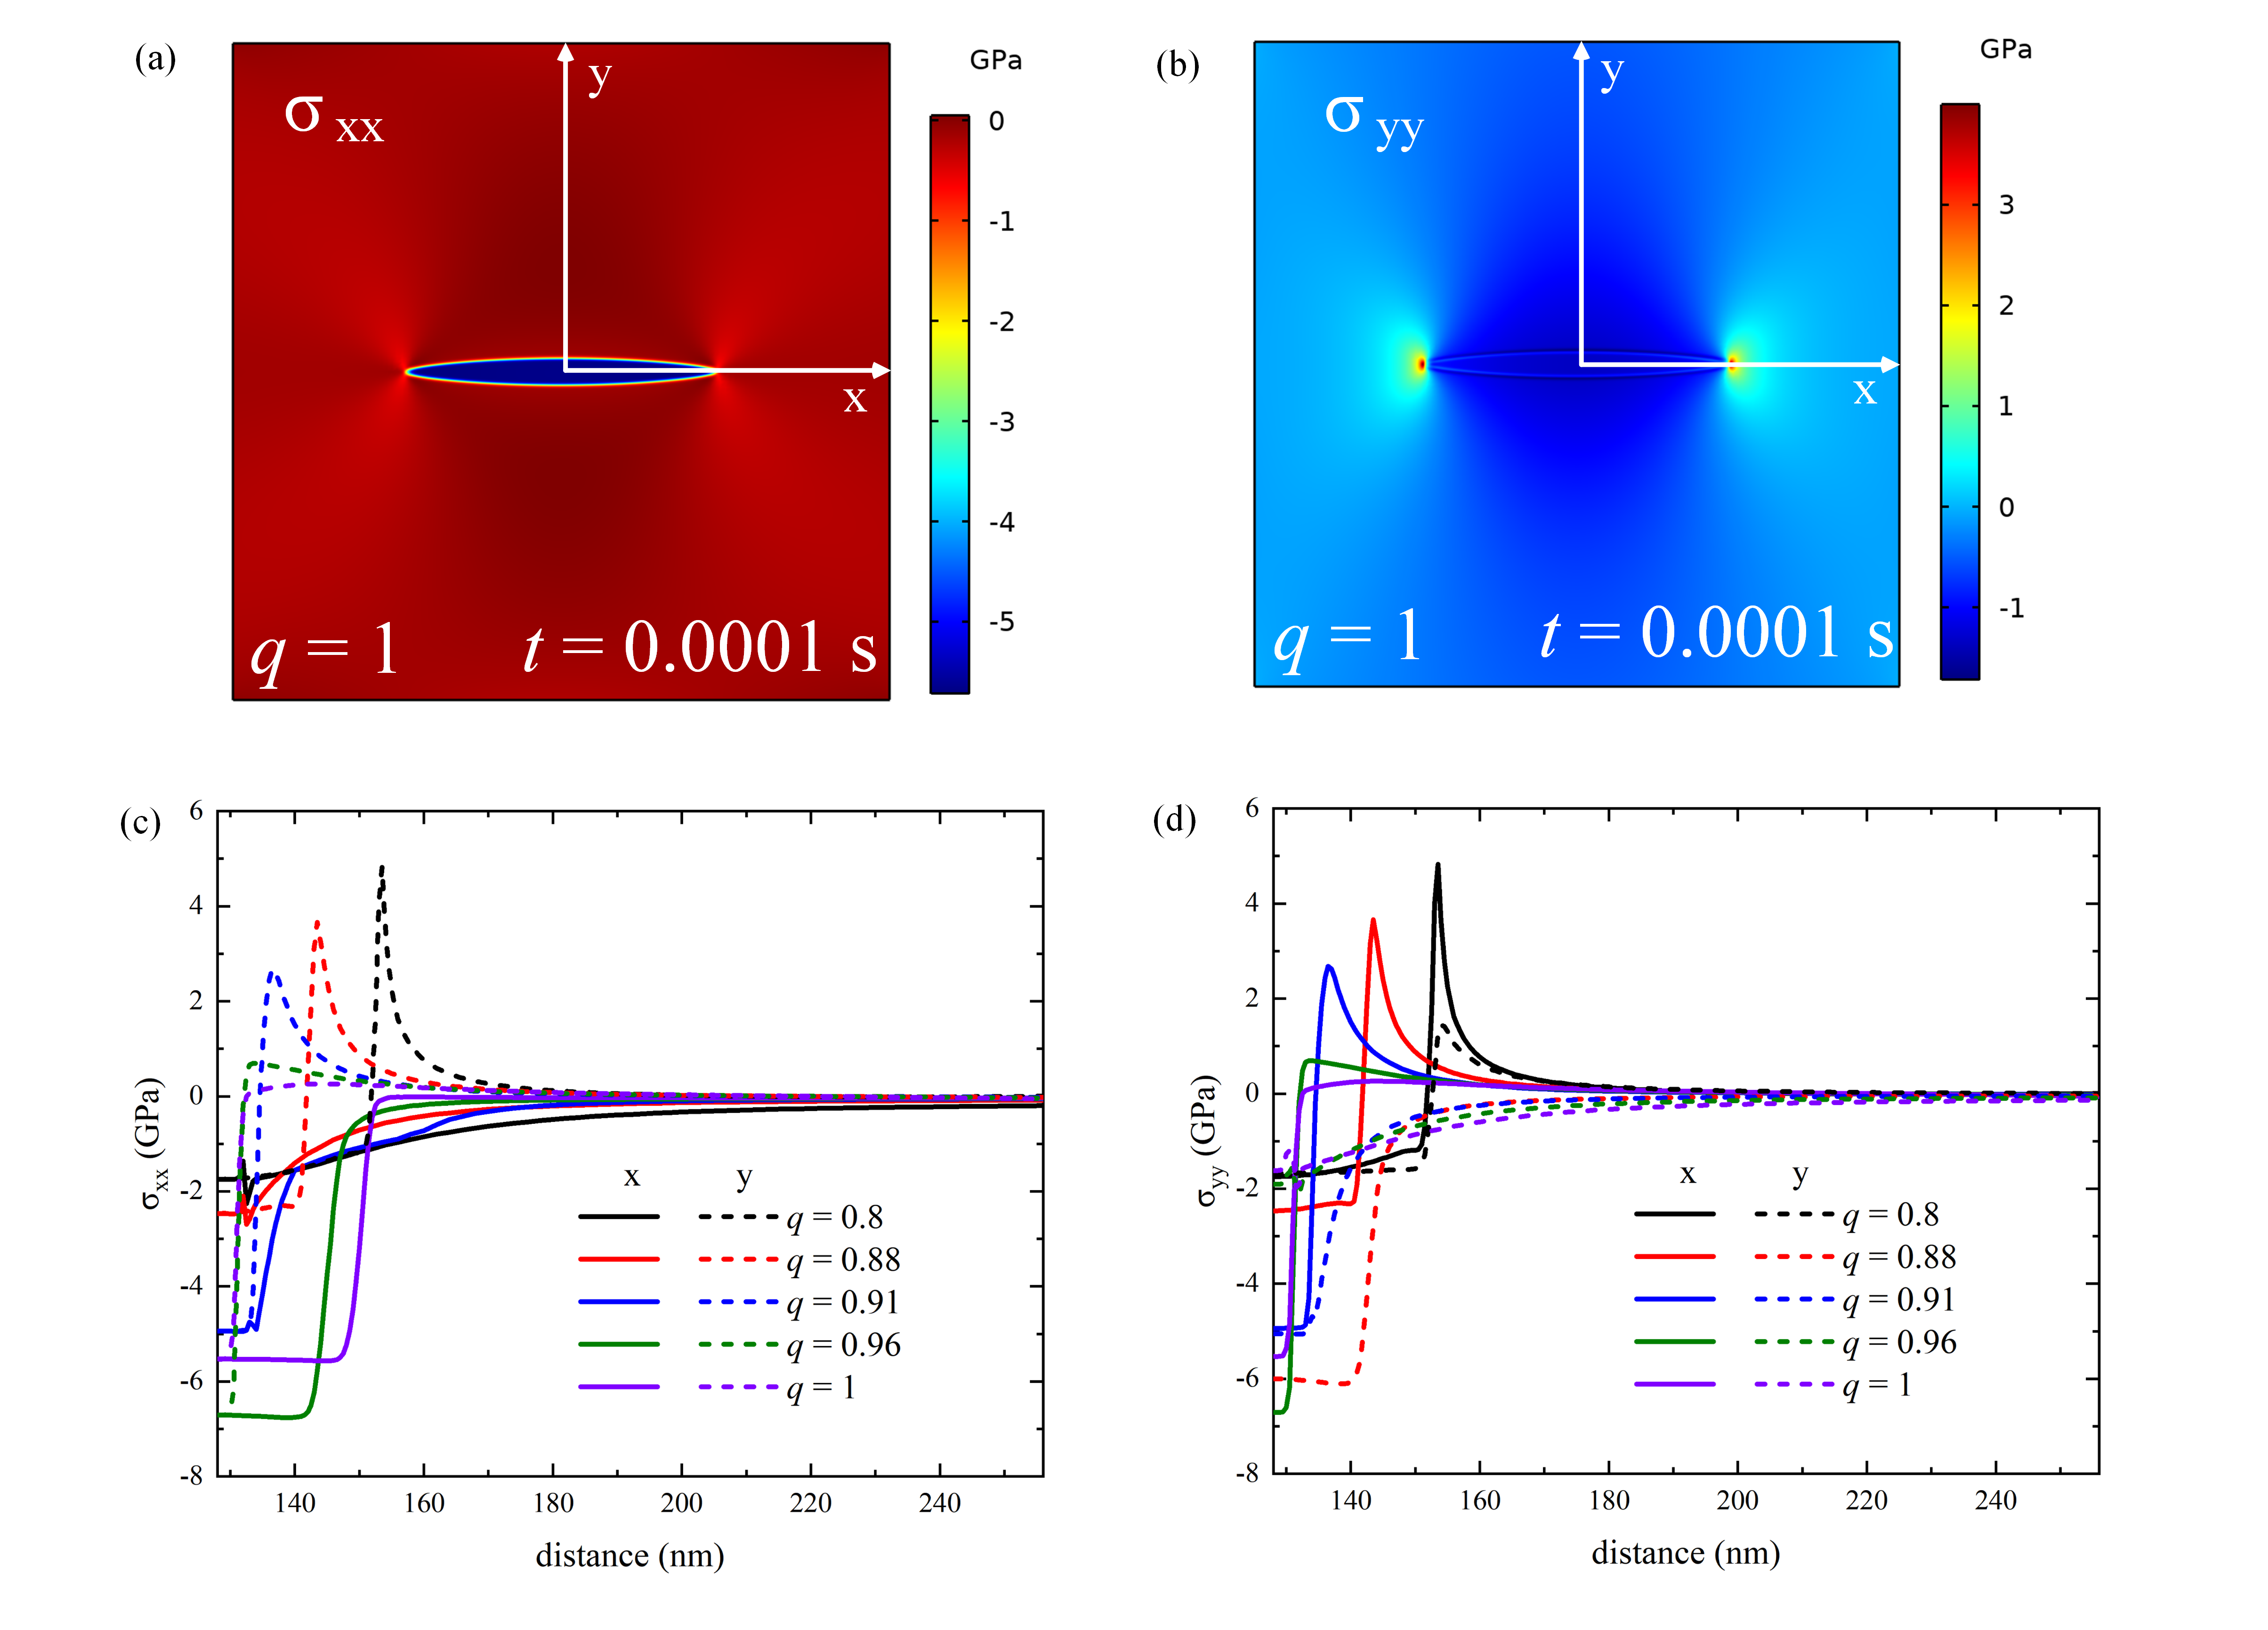
From the perspective of stress distribution, the principal stresses and exhibit negative values within the interior of the hydrogen precipitates, reaching maximum values at the tips in Fig. 7(a) and (b). As depicted in Fig. 7(c) and (d), a reduction in the mismatch value results in an increase in the maximum stress value. Initially, increases along the x-direction with an increase in distance and subsequently stabilizes, while follows an initial increase along the y-direction and subsequently decreases with distance. In contrast to , the curve is reversed, which is attributed to the redirection phenomenon. In general, redirection induces alterations in stress and corresponding stress maxima. Through our stress analysis, we posit that redirection behavior, stemming from the loss of interfacial coherence, may lead to changes in the crack propagation direction at the hydride tip.
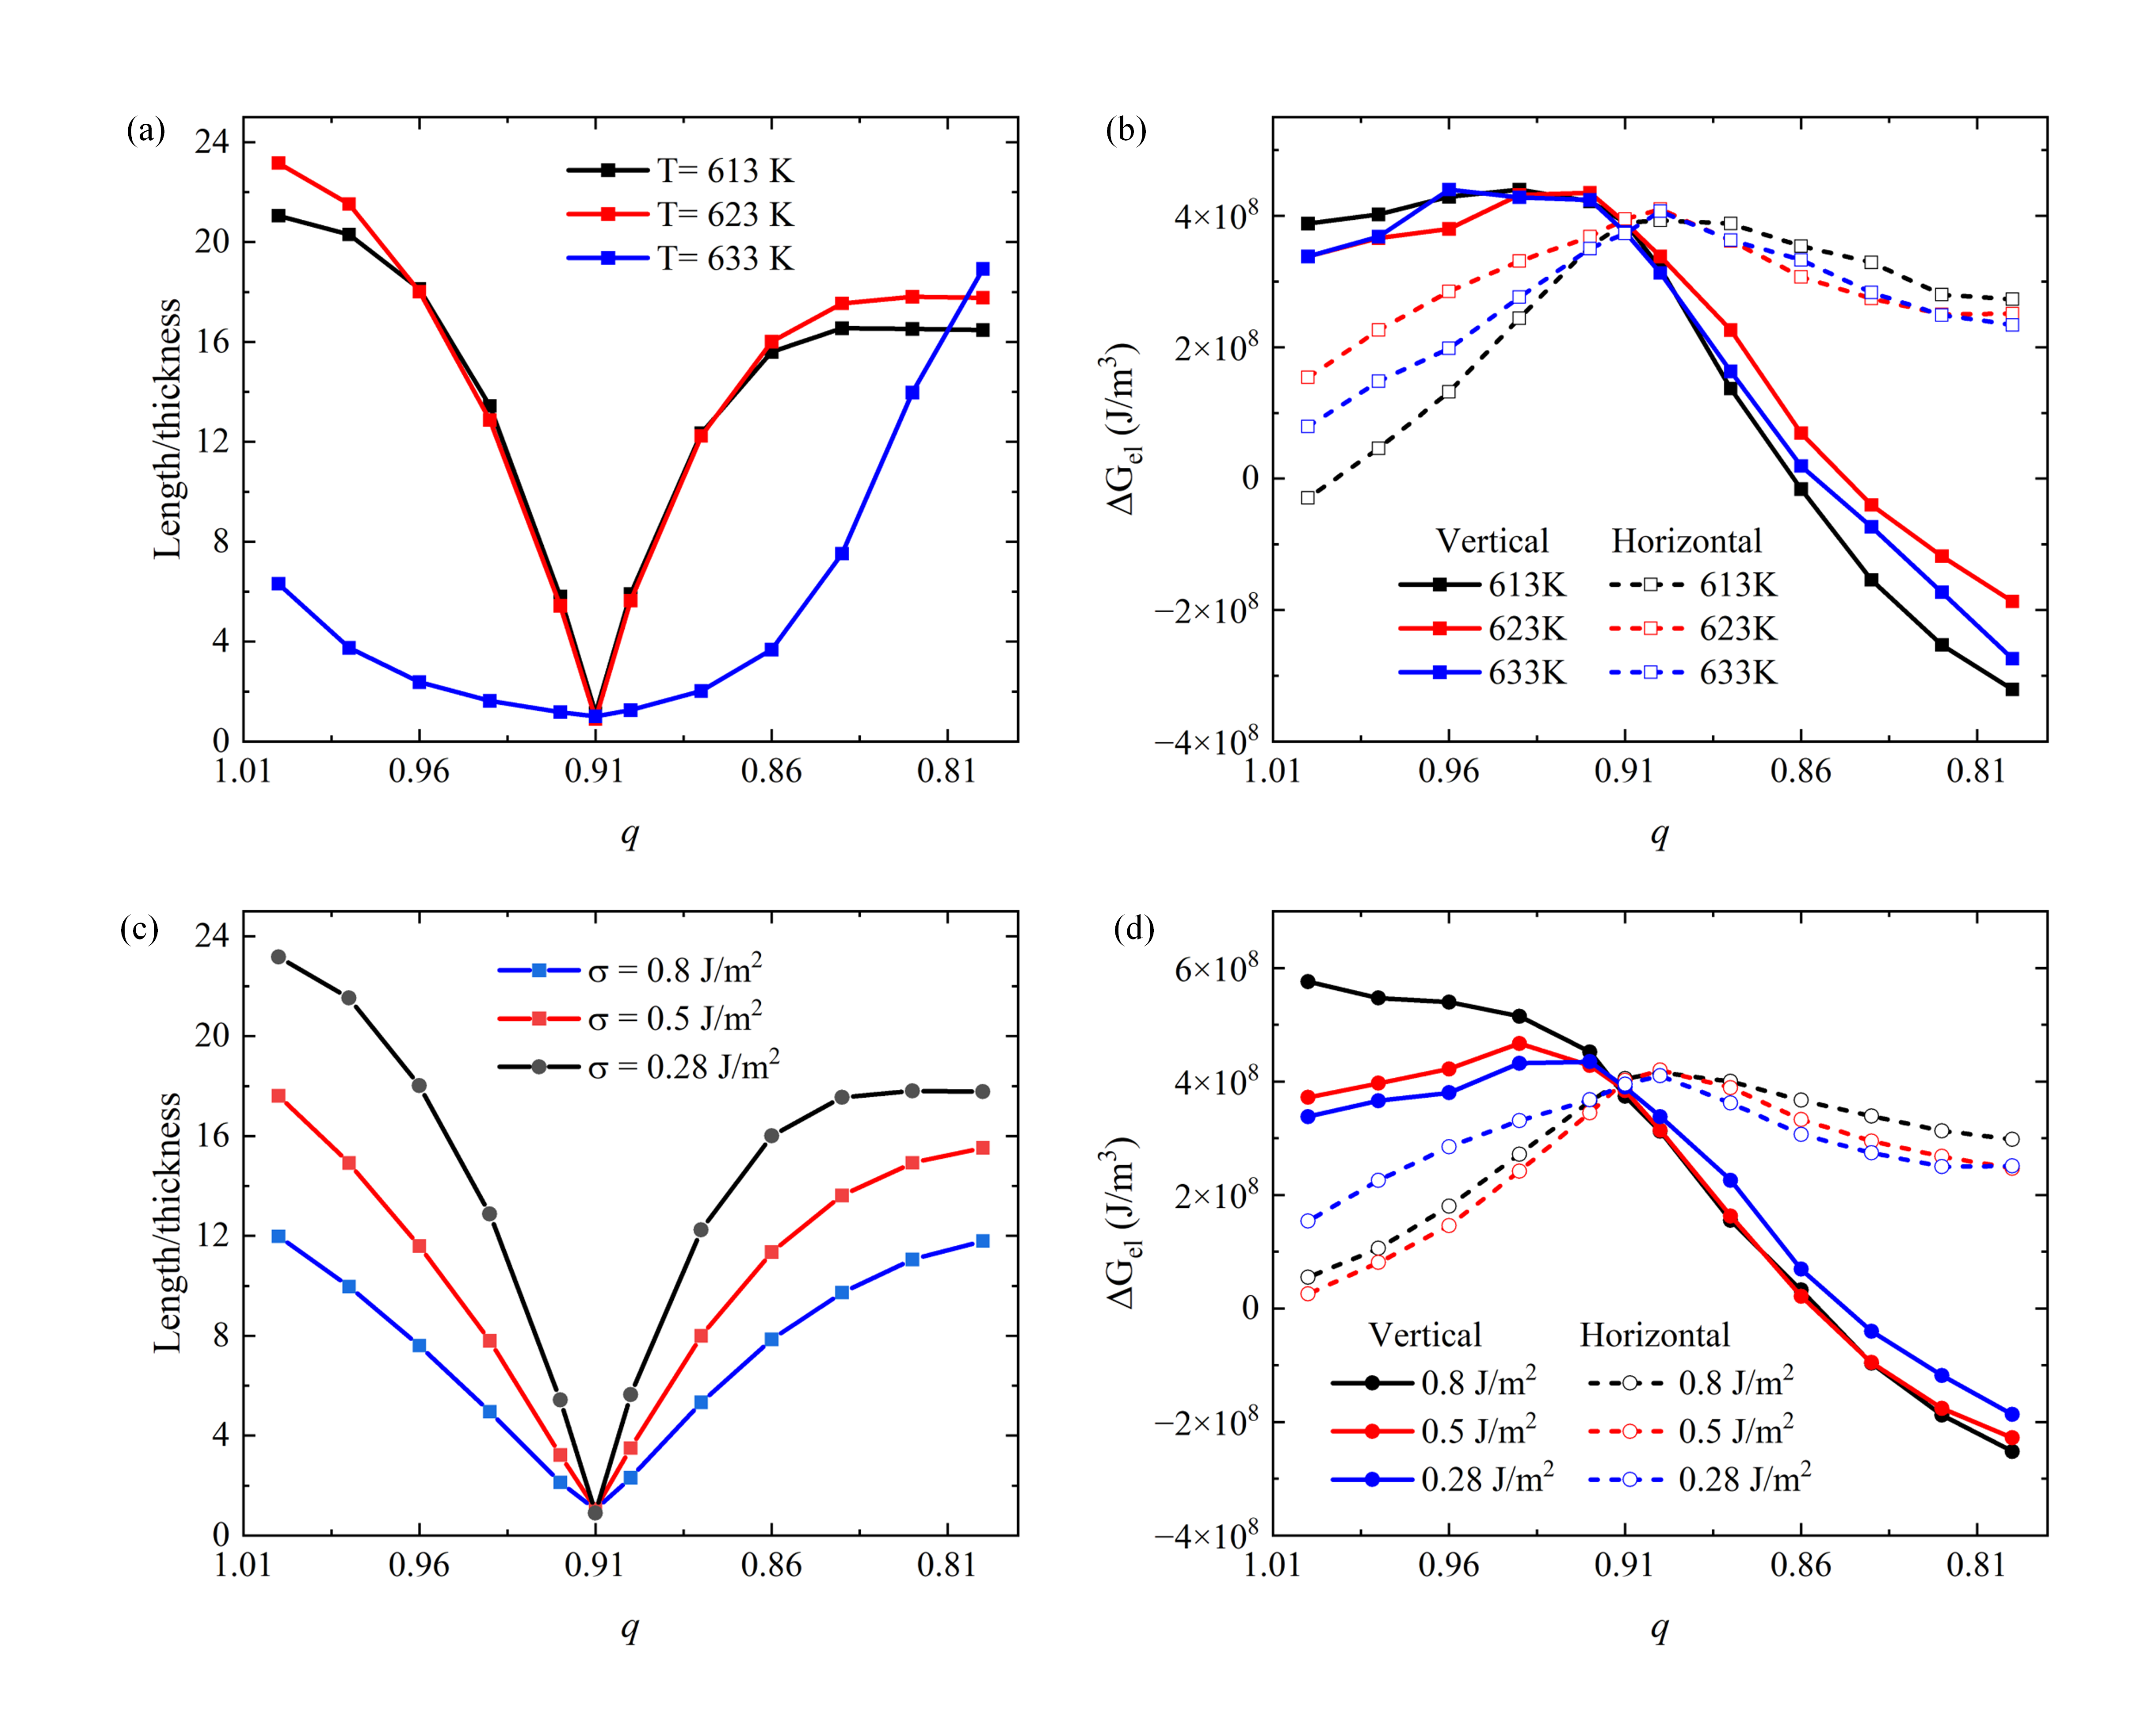
To further examine the impact of temperature and interfacial energy on the mismatch degree in interface effects, we investigate the changes in the aspect ratio and elastic interaction energy distribution of hydrides at different mismatch degrees and temperatures (613K, 623K, and 633K). Additionally, we analyze the aspect ratio and elastic interaction energy distribution of hydrides under an interfacial energy value of 0.8 . The results from Fig. 8(a) and (b) illustrate that temperature influences the length-to-diameter ratio of hydrides at various mismatch degrees, while the overall trend of the length-to-diameter ratio remains consistent. Notably, the smallest aspect ratio of hydrides is consistently observed at a mismatch degree of . Furthermore, irrespective of temperature variations, the change trend in elastic interaction energy remains consistent. At , the elastic interaction energy values in the two directions become the closest, resulting in the formation of round-shaped hydrides. Similarly, the analysis from Fig. 8(c) and (d) reveals that interfacial energy does not significantly impact the redirection of hydrides or the distribution trend of elastic interaction energy at .
In summary, our research encompasses a comprehensive investigation of hydrides, incorporating the concept of interfacial coherence loss. This leads to the identification of the phenomenon of hydride redirection, primarily attributed to alterations in the distribution of elastic energy. Redirection behavior is found to be associated with stress reversal, and within the interplay of temperature, interfacial energy, and interfacial coherence, the latter emerges as a prominent influencing factor. These insights provide valuable contributions to our understanding of how interfacial coherence loss impacts the morphology and behavior of Zr hydrides.
IV CONSLUSION
In this study, the phase-field (PF) method was used to investigate the influence of temperature and interfacial effects on the kinetic process of hydride formation. By constructing two-phase free energy curves at different temperatures using the CALPHAD thermodynamic approach, the following main results were observed:
1) Within a specific temperature range, temperature and interface conditions can indeed impact the length-to-thickness ratio and growth rate, while they do not appear to exert any influence on the redirection behavior. The aspect ratio of hydrides first increase and then decrease as the temperature rises. The increase of interfacial energy results in the decrease of the length-thickness ratio of the hydride. Additionally, the growth rate of hydrides demonstrates a linear decrease with an increase in temperature and interfacial energy.
2) The loss of interfacial coherence has a dual effect, affecting not only the aspect ratio and average growth rate of the hydrides, but also leading to redirection behaviour and an increase in the maximum stress value at the hydride tip. As interfacial coherence loss increases, the hydride length-to-thickness ratio initially decreases ( ) and subsequently increases ( ), accompanied by an initial decrease and subsequent increase in the average growth rate. his phenomenon can be attributed to the anisotropic distribution of elastic interactions caused by the loss of interfacial coherence. Interestingly, the reorientation of hydrides at the mismatch degree remains unaffected by temperature and changes in interfacial energy.
By presenting these results, this investigation enhances our comprehension of the growth patterns and dynamic development of Zr hydrides, influenced by temperature and interfacial effects. Nevertheless, it is important to acknowledge that the above-mentioned deductions are based on theoretical assumptions of elastic energy, not accounting for plasticity. Therefore, the impact of plasticity on the outcomes calls for further inquiry.
V CRediT authorship contribution statement
Zi-Hang Chen and Jie Sheng contributed equally to this work. Zi-Hang Chen and Jie Sheng: Writing-Original draft preparation, Writing-Reviewing and Editing, Methodology, Investigation, Validation, Formal Analysis. Yu Liu: Conceptualization, Supervision, Writing-Original draft preparation, Formal Analysis, Writing-Reviewing and Editing. Xiaoming Shi: Investigation, Writing-Original draft preparation, Writing-Reviewing and Editing, Formal Analysis. Houbing Huang: Conceptualization, Supervision, Writing-Reviewing and Editing. Ke Xu: Investigation, Visualization, Investigation. Yue-Chao Wang: Investigation, Formal Analysis. Shuai Wu: Investigation, Formal Analysis. Bo Sun: Investigation, Formal Analysis. Hai-Feng Liu: Formal Analysis, Writing-Reviewing and Editing. Hai-Feng Song: Conceptualization, Supervision, Formal Analysis, Writing-Original draft preparation and Editing.
VI Data availability
Data will be made availiable on request.
VII Acknowledgement
We thank Yuan-Ji Xu, Bei-Lei Liu, Jin-Xiang Wang, Kai-Le Chen, Bo-Hao Zhao, Yu Song and Jing Wang for helpful discussions. The work was supported by the National Natural Science Foundation of China (GrantsU2230401, U1930401, 12004048, and 11971066), the National Key R&D Program of China (Grant 2021YFB3S01S03), the Science Challenge Project (NO. TZ2018002), and the Foundation of LCP. We thank the Tianhe platforms at the National Supercomputer Center in Tianjin.
VIII Appendix A: Supplementary data
Supplementary material related to this article can be found online at…
References
- [1] Afshin Hedayat. Developing and analyzing long-term fuel management strategies for an advanced small modular pwr. Nuclear Engineering and Design, 313:190–213, 2017.
- [2] Jacob Bair, Mohsen Asle Zaeem, and Michael Tonks. A review on hydride precipitation in zirconium alloys. Journal of Nuclear Materials, 466:12–20, 2015.
- [3] Arthur T Motta, Laurent Capolungo, Long-Qing Chen, Mahmut Nedim Cinbiz, Mark R Daymond, Donald A Koss, Evrard Lacroix, Giovanni Pastore, Pierre-Clément A Simon, Michael R Tonks, et al. Hydrogen in zirconium alloys: A review. Journal of Nuclear Materials, 518:440–460, 2019.
- [4] B Ensor, AM Lucente, MJ Frederick, J Sutliff, and AT Motta. The role of hydrogen in zirconium alloy corrosion. Journal of Nuclear Materials, 496:301–312, 2017.
- [5] SK Ghosal, GC Palit, and PK De. Corrosion of zirconium alloys in nuclear applications-a review. Mineral Procesing and Extractive Metallurgy Review, 22(2):519–546, 2001.
- [6] Sangbum Kim, Joo-Hee Kang, and Youho Lee. Hydride embrittlement resistance of zircaloy-4 and zr-nb alloy cladding tubes and its implications on spent fuel management. Journal of Nuclear Materials, 559:153393, 2022.
- [7] E Zuzek, JP Abriata, A San-Martin, and FD Manchester. The H-Zr (hydrogen-zirconium) system. Bulletin of alloy phase diagrams, 11(4):385–395, 1990.
- [8] RS Daum, YS Chu, and AT Motta. Identification and quantification of hydride phases in zircaloy-4 cladding using synchrotron x-ray diffraction. Journal of Nuclear Materials, 392(3):453–463, 2009.
- [9] Manfred P Puls. The effect of hydrogen and hydrides on the integrity of zirconium alloy components: delayed hydride cracking. Springer Science & Business Media, 2012.
- [10] GM Han, YF Zhao, CB Zhou, De-Ye Lin, XY Zhu, J Zhang, SY Hu, and HF Song. Phase-field modeling of stacking structure formation and transition of -hydride precipitates in zirconium. Acta Materialia, 165:528–546, 2019.
- [11] Tae Wook Heo, Kimberly B Colas, Arthur T Motta, and Long-Qing Chen. A phase-field model for hydride formation in polycrystalline metals: Application to -hydride in zirconium alloys. Acta Materialia, 181:262–277, 2019.
- [12] KB Colas, AT Motta, JD Almer, MR Daymond, M Kerr, AD Banchik, P Vizcaino, and Javier Roberto Santisteban. In situ study of hydride precipitation kinetics and re-orientation in zircaloy using synchrotron radiation. Acta Materialia, 58(20):6575–6583, 2010.
- [13] Kimberly Colas, Arthur Motta, Mark Daymond, Matthew Kerr, and Jonathan Almer. Hydride platelet reorientation in zircaloy studied with synchrotron radiation diffraction. Journal of ASTM International, 8(1):1–17, 2010.
- [14] Kimberly B Colas, Arthur T Motta, Mark R Daymond, and Jonathan D Almer. Effect of thermo-mechanical cycling on zirconium hydride reorientation studied in situ with synchrotron x-ray diffraction. Journal of Nuclear Materials, 440(1-3):586–595, 2013.
- [15] Yongwoo Kwon, Katsuyo Thornton, and Peter W Voorhees. Coarsening of bicontinuous structures via nonconserved and conserved dynamics. Physical Review E, 75(2):021120, 2007.
- [16] DJ Seol, SY Hu, YL Li, J Shen, KH Oh, and LQ Chen. Three-dimensional phase-field modeling of spinodal decomposition in constrained films. Metals and Materials International, 9(1):61–66, 2003.
- [17] Y Kwon, K Thornton, and PW Voorhees. The topology and morphology of bicontinuous interfaces during coarsening. EPL (Europhysics Letters), 86(4):46005, 2009.
- [18] R Mendoza, I Savin, K Thornton, and PW Voorhees. Topological complexity and the dynamics of coarsening. Nature materials, 3(6):385–388, 2004.
- [19] William J Boettinger, James A Warren, Christoph Beckermann, and Alain Karma. Phase-field simulation of solidification. Annual review of materials research, 32(1):163–194, 2002.
- [20] Chao Yang, Shilei Li, Xitao Wang, Junsheng Wang, and Houbing Huang. Phase-field simulation of multi-phase interactions in fe-c peritectic solidification. Computational Materials Science, 171:109220, 2020.
- [21] Chao Yang, Yu Liu, Houbing Huang, Shuai Wu, Jie Sheng, Xiaoming Shi, Jing Wang, Guomin Han, and Haifeng Song. Hydride corrosion kinetics on metallic surface: a multiphase-field modeling. Materials Research Express, 8(10):106518, 2021.
- [22] Yu U Wang, Yongmei M Jin, and Armen G Khachaturyan. Phase field microelasticity modeling of surface instability of heteroepitaxial thin films. Acta materialia, 52(1):81–92, 2004.
- [23] Xiaoming Shi, Jing Wang, Jiwen Xu, Xingwang Cheng, and Houbing Huang. Quantitative investigation of polar nanoregion size effects in relaxor ferroelectrics. Acta Materialia, 237:118147, 2022.
- [24] Xiaoming Shi, Jing Wang, Xingwang Cheng, and Houbing Huang. Ultrafast ferroelectric domain switching induced by nano-second strain-pulse. Advanced Theory and Simulations, 5(3):2100345, 2022.
- [25] Xiaoming Shi, Jing Wang, Xingwang Cheng, and Houbing Huang. Phase diagram of sub-ghz electric-field-induced polarization oscillation. physica status solidi (RRL)–Rapid Research Letters, 16(1):2100416, 2022.
- [26] Z Zhao, M Blat-Yrieix, JP Morniroli, A Legris, L Thuinet, Y Kihn, A Ambard, L Legras, M Limback, B Kammenzind, et al. Characterization of zirconium hydrides and phase field approach to a mesoscopic-scale modeling of their precipitation. ASTM International, 2008.
- [27] Ludovic Thuinet, Andrée De Backer, and Alexandre Legris. Phase-field modeling of precipitate evolution dynamics in elastically inhomogeneous low-symmetry systems: Application to hydride precipitation in zr. Acta Materialia, 60(13-14):5311–5321, 2012.
- [28] Ludovic Thuinet, Alexandre Legris, Lingfei Zhang, and Antoine Ambard. Mesoscale modeling of coherent zirconium hydride precipitation under an applied stress. Journal of nuclear materials, 438(1-3):32–40, 2013.
- [29] XQ Ma, San-Qiang Shi, CH Woo, and LQ Chen. Phase-field simulation of hydride precipitation in bi-crystalline zirconium. Scripta Materialia, 47(4):237–241, 2002.
- [30] XQ Ma, San-Qiang Shi, CH Woo, and LQ Chen. Simulation of -hydride precipitation in bi-crystalline zirconium under uniformly applied load. Materials Science and Engineering: A, 334(1-2):6–10, 2002.
- [31] XQ Ma, San-Qiang Shi, CH Woo, and LQ Chen. Effect of applied load on nucleation and growth of -hydrides in zirconium. Computational materials science, 23(1-4):283–290, 2002.
- [32] XQ Ma, San-Qiang Shi, CH Woo, and LQ Chen. The phase field model for hydrogen diffusion and -hydride precipitation in zirconium under non-uniformly applied stress. Mechanics of Materials, 38(1-2):3–10, 2006.
- [33] San-Qiang Shi and Zhihua Xiao. A quantitative phase field model for hydride precipitation in zirconium alloys: Part i. development of quantitative free energy functional. Journal of Nuclear Materials, 459:323–329, 2015.
- [34] Jacob Bair, Mohsen Asle Zaeem, and Michael Tonks. A phase-field model to study the effects of temperature change on shape evolution of -hydrides in zirconium. Journal of Physics D: Applied Physics, 49(40):405302, 2016.
- [35] AM Jokisaari and K Thornton. General method for incorporating calphad free energies of mixing into phase field models: Application to the -zirconium/-hydride system. Calphad, 51:334–343, 2015.
- [36] Jacob Bair, Mohsen Asle Zaeem, and Daniel Schwen. Formation path of hydrides in zirconium by multiphase field modeling. Acta Materialia, 123:235–244, 2017.
- [37] Jun-li Lin and Brent J Heuser. Modeling hydrogen solvus in zirconium solution by the mesoscale phase-field modeling code hyrax. Computational Materials Science, 156:224–231, 2019.
- [38] Wooseob Shin and Kunok Chang. Phase-field modeling of hydride reorientation in zirconium cladding materials under applied stress. Computational Materials Science, 182:109775, 2020.
- [39] P-CA Simon, Larry K Aagesen, Andrea M Jokisaari, Long-Qing Chen, Mark R Daymond, Arthur T Motta, and Michael R Tonks. Investigation of zirconium hydride morphology in a single crystal using quantitative phase field simulations supported by experiments. Journal of Nuclear Materials, 557:153303, 2021.
- [40] Shuai Wu, Jie Sheng, Chao Yang, Xiaoming Shi, Houbing Huang, Yu Liu, and Haifeng Song. Phase-field model of hydride blister growth kinetics on zirconium surface. Frontiers in Materials, 9:916593, 2022.
- [41] Seong Gyoon Kim, Won Tae Kim, and Toshio Suzuki. Phase-field model for binary alloys. Physical review e, 60(6):7186, 1999.
- [42] Ingo Steinbach and Markus Apel. Multi phase field model for solid state transformation with elastic strain. Physica D: Nonlinear Phenomena, 217(2):153–160, 2006.
- [43] N Dupin, I Ansara, C Servant, C Toffolon, C Lemaignan, and JC Brachet. A thermodynamic database for zirconium alloys. Journal of nuclear materials, 275(3):287–295, 1999.
- [44] Yu Zhong and Digby D Macdonald. Thermodynamics of the zr–h binary system related to nuclear fuel sheathing and pressure tube hydriding. Journal of nuclear materials, 423(1-3):87–92, 2012.
- [45] Jie Sheng, Yu Liu, Yue-Chao Wang, Shuai Wu, Ke Xu, Zi-Hang Chen, Bo Sun, Hai-Feng Liu, and Hai-Feng Song. A phase-field model for simulating hydrogen-induced pitting corrosion with solid-solid phase transformation in the metal. arXiv preprint arXiv:2203.07289, 2022.
- [46] Jie Sheng, Yu Liu, Xiao-Ming Shi, Yue-Chao Wang, Zi-Hang Chen, Ke Xu, Shuai Wu, Hou-Bing Huang, Bo Sun, Hai-Feng Liu, and Hai-Feng Song. A multiphase-field model for simulating the hydrogen-induced multi-spot corrosion on the surface of polycrystalline metals: Application to uranium metal, 2023.
- [47] Weijie Mai, Soheil Soghrati, and Rudolph G Buchheit. A phase field model for simulating the pitting corrosion. Corrosion Science, 110:157–166, 2016.
- [48] Chao Yang, Houbing Huang, Wenbo Liu, Junsheng Wang, Jing Wang, Hasnain Mehdi Jafri, Yu Liu, Guomin Han, Haifeng Song, and Long-Qing Chen. Explicit dynamics of diffuse interface in phase-field model. Advanced Theory and Simulations, 4(1):2000162, 2021.
- [49] JW Morris Jr. The khachaturyan theory of elastic inclusions: Recollections and results. Philosophical Magazine, 90(1-4):3–35, 2010.
- [50] J Lubliner. Plasticity theory, revised ed. ed, 2008.
- [51] PAT Olsson, AR Massih, Jakob Blomqvist, A-M Alvarez Holston, and Christina Bjerkén. Ab initio thermodynamics of zirconium hydrides and deuterides. Computational materials science, 86:211–222, 2014.
- [52] David A Porter and Kenneth E Easterling. Phase transformations in metals and alloys (revised reprint). CRC press, 2009.
- [53] M Steinbrück, J Birchley, AV Boldyrev, AV Goryachev, M Grosse, TJ Haste, Z Hózer, AE Kisselev, VI Nalivaev, VP Semishkin, et al. High-temperature oxidation and quench behaviour of zircaloy-4 and e110 cladding alloys. Progress in Nuclear Energy, 52(1):19–36, 2010.
- [54] Andrea M Jokisaari. Multiphysics Phase Field Modeling of Hydrogen Diffusion and -Hydride Precipitation in -Zirconium. PhD thesis, 2016.
- [55] Ali R Massih and Lars Olof Jernkvist. Stress orientation of second-phase in alloys: Hydrides in zirconium alloys. Computational materials science, 46(4):1091–1097, 2009.
- [56] Si-Mian Liu, Akio Ishii, Shao-Bo Mi, Shigenobu Ogata, Ju Li, and Wei-Zhong Han. Dislocation-mediated hydride precipitation in zirconium. Small, 18(9):2105881, 2022.
- [57] Yongfeng Zhang, Xian-Ming Bai, Jianguo Yu, Michael R Tonks, Mark J Noordhoek, and Simon R Phillpot. Homogeneous hydride formation path in -zr: Molecular dynamics simulations with the charge-optimized many-body potential. Acta Materialia, 111:357–365, 2016.
- [58] M-A Louchez, Ludovic Thuinet, Rémy Besson, and Alexandre Legris. Microscopic phase-field modeling of hcp— fcc interfaces. Computational Materials Science, 132:62–73, 2017.