![[Uncaptioned image]](/html/2311.02875/assets/x2.png)
![]()
|
|
Shear zones in granular mixtures of hard and soft particles with high and low friction |
| Aditya Pratap Singh, Vasileios Angelidakis, Thorsten Pöschel, and Sudeshna Roy† | |
|
|
Granular materials show inhomogeneous flows characterized by strain localization. When strain is localized in a sheared granular material, rigid regions of a nearly undeformed state are separated by shear bands, where the material yields and flows. The characteristics of the shear bands are determined by the geometry of the system, the micromechanical material properties, and the kinematics at the particle level. For a split-bottom shear cell, recent experimental work has shown that mixtures of hard, frictional and soft, nearly frictionless particles exhibit wider shear zones than samples with only one of the two components. To explain this finding, we investigate the shear zone properties and the stress response of granular mixtures using discrete element simulations. We show that both interparticle friction and elastic modulus determine the shear-band properties of granular mixtures of various mixing ratios, but their stress response depends strongly on the interparticle friction. Our study provides a fundamental understanding of the micromechanics of shear band formation in granular mixtures. |
1 Introduction
Strain localization is a characteristic effect of sheared granular matter, which is not observed in the flow of other materials, such as liquids. Once strain localizes within a narrow shear zone (also referred to as the shear band), the stress, strain, and strain rate of the material assume high values within that zone. On the contrary, outside of it, the material remains nearly undeformed. The knowledge of the properties of shear zones and the factors that influence them is crucial for understanding the intrinsic properties of granular materials under shear.
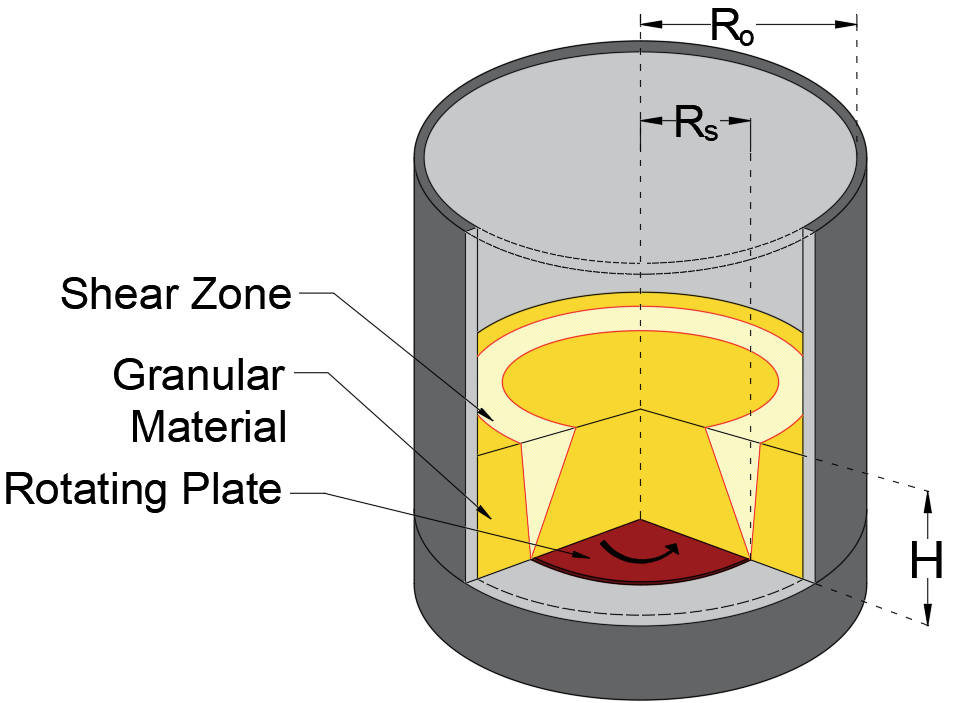
In many systems where particles come into contact with boundaries, narrow shear zones appear at the interface because of particle-boundary interactions. These shear zones are triggered by boundary effects, which hinder the accurate characterization of bulk material properties based on the shear zone characteristics. In our work, we present a unique setup called a split-bottom shear cell, which is a modified version of a Couette cell. This setup involves splitting the cell’s bottom at a specific radius (), resulting in two parts consisting of the inner disk and outer cylinder components (see Figure 1). After loading the cell with grains to a certain height (), the inner disk is set to rotational motion. This design allows granular materials to be sheared to develop wide shear zones inside the bulk of the materials, far away from the rigid boundaries, which allows for a comprehensive characterization of their yielding properties and flow behavior at a macromechanical level. This is quite different from the usual narrow shear bands that we observe close to the boundary, which are formed due to particle-boundary interactions. This shear cell setup has been used in experiments 1 and simulations 2 to explore the bulk properties of granular systems.
The universal geometrical properties of shear bands in the split-bottom shear cell have been studied extensively in the literature 3, 4, 5. The absolute value of the macroscopic normalized angular velocity of the granular material was measured as a function of the radial position, and it has been found to follow closely the shape of an error function, which is characterized by two parameters: the width and the center position of the shear zone 5, 4. The width of the shear band increases with increasing height within the bulk of the material, while the distance of its central position from the center of rotation decreases (that is, the shear band moves inward with increasing height). The width of the shear band is affected by the size, shape, and interaction properties of the particles, such as friction between the particles, cohesion, and the shear rate 6, 7, 8, 9. The position of the shear band, , at the surface of the granular material in the shear cell, depends on two geometrical parameters, the filling height and split radius 10. The bulk profile of the shear band as a function of height, , can be linked to a variational problem. The solution of the function that minimizes the integral representing the dissipation rate, is related to the minimal mechanical torque and thus depends on the material properties. Therefore, the shape of the shear band within the bulk is not only influenced by geometric factors such as the split position () and the filling height () but is also closely connected to the material properties, e.g., the shear stress, and the packing fraction of the material, as highlighted in previous studies 10, 5.
Interparticle friction and particle softness play a key role in influencing material bulk flows, which have been widely studied. Wang et al. 11 experimentally characterized the shear zones of binary mixtures made of hard, frictional and soft, slippery particles. Their study identified distinct shear band characteristics specific to the mixture, distinguishing them from those in pure-species systems. Luding 8 explored the impact of interparticle friction on shear zones in split-bottom shear cells through numerical simulations. Increasing friction resulted in narrower shear bands that shifted towards the center. Ashour et al. 12 found that particle softness adds qualitatively new features to the dynamics and the packing characteristics of silo flows. Soft, deformable particles, such as hydrogel particles, can adapt to local stress conditions, leading to alterations in pressure profiles and flow fields. Hong et al. 13 highlighted the importance of particle softness in hopper flows, where gravitational forces must be less than repulsive forces from particle stiffness to induce clogging. Harth et al. 14 observed longer time scales for internal rearrangement in soft hydrogel particles during silo orifice flow compared to hard grain systems, where shorter time scales have been reported by Unac et al. 15. This was attributed to mass flow rate differences, roundness, and increased viscous damping of hydrogel grains. The rate-dependent frictional regimes observed in hydrogel particle suspensions have been attributed to their high deformability and low friction 16. Wang et al. 17 observed experimentally that, unlike granular materials with hard particles, soft slippery particles in a silo flow do not follow Beverloo’s 18 law, according to which the flow rate is independent of the overburden pressure. Adding just hard particles to soft silo flows restored this behavior and significantly altered system flow properties. Based on the micromechanical observations, Saitoh et al. 19 highlighted that the evolution of the system behavior in soft particle packings extends beyond just particle contacts. Inter-particle gaps between nearest neighbors are also crucial and affect the stochastic evolution of the probability distribution function of forces. Recently, Luding et al. 20 studied the contact and force networks of frictionless soft granular materials, revealing that the evolution of the pressure in the system was correlated with the existence of loops formed in the force network during particle rearrangements. Götz et al. 21 observed that soft particles with larger deformations and increased contact areas result in larger frictional forces and improved holding capacity of a granular gripper. In summary, both particle friction and softness are crucial factors influencing bulk flow behavior, and the intricate interplay between these properties and their combined effects on bulk behavior remains a subject of ongoing investigation.
The findings of Wang et al. 11 established that mixtures of hard and soft particles exhibit wider shear zones than assemblies made of only one of the individual materials (only hard or only soft particles). However, the underlying reason for this behavior remains unclear. Our objective here is to gain insight into the combined effect of microscopic parameters, namely particle stiffness and inter-particle friction, on the macroscopic shear zone characteristics for ensembles of soft, slippery particles and hard, frictional particles sheared in a split-bottom shear cell.
2 Numerical setup and materials
We use an open-source Discrete Element Method (DEM) code MercuryDPM 22 to simulate sheared systems of hard and soft particles. The numerical setup used for this study is a split-bottom shear cell, as shown in Figure 1, where the inner bottom plate rotates around a central axis at a constant angular velocity, rad/s, while the outer boundary of the cell remains stationary. The granular material located in the outer parts remains static, while the material near the center of the cell rotates with the bottom disk. The shear in this system is localized in an intermediate region, defining a wide shear band. The position and the width of the shear zone depend on the ratio , where is the filling height and is the split radius of the rotating bottom plate 23, 4. For small and moderate filling height , the shear zone starts from the bottom split position, evolves through the entire height of the granular layer, and ends up at the surface 3, as shown in Figure 1, while the inner part of the granular material co-rotates synchronously with the bottom plate. In our numerical setup, the filling height is mm and , which is considered a moderate filling height. This numerical setup is similar to that employed in the experimental work by Wang et al. 11, with the difference that the experimental configuration incorporates an additional small rod in the center of the cell, where the shear load was imposed.
2.1 Material parameters
We consider a mixture of soft low-frictional particles and hard frictional particles. In this Section, we describe the generation of binary granular mixtures of such particles. We take the properties of hydrogel spheres as the soft, low-frictional material component, and mustard seeds represent hard, frictional particles. A reference sample of pure soft hydrogel particles consists of polydisperse particles of species A with mean diameter, mm. Starting from this baseline sample volume, we create mixtures by substituting particles of species A with particles of species B of diameter mm, such that the same volume of material A is replaced by B, i.e. . For both species A and B, we use particles of homogeneous size distribution of mean particle diameter and , respectively, with polydispersity of . To characterize the mixtures with different ratios of species B, we define the mixing ratio
| (1) |
We analyze systems with . Table 1 presents the number of particles of the two species in each sample. Figure 2 shows some examples of different mixtures.
The properties of soft particles of species A correspond to that of hydrogel spheres with friction coefficient and elastic modulus kPa. The frictional properties of hard particles correspond to mustard seeds with friction coefficient and the elastic modulus kPa. All relevant material and interaction properties of the two species are given in Table 2.
| Species A | |||||||
|---|---|---|---|---|---|---|---|
| Species B |
| Properties | Species A | Species B |
|---|---|---|
| Mean particle diameter | mm | mm |
| Density | kg/m-3 | kg/m-3 |
| Elastic modulus | kPa | kPa |
| Poisson’s ratio | ||
| Friction coefficient |

2.2 Contact model
In the soft-particle DEM, the evolution of particle positions and velocities is calculated by integrating Newton’s equation of motion. When two particles and interact, they can slightly overlap. Only viscoelastic interactions are considered, i.e., after separating the contacting particles, they recover their initial shape. The compression of contacting particles is written as:
| (2) |
where , are the particle radii and , are the particle positions. The normal force is calculated as in 24, where an elastic Hertzian normal force is considered in conjunction with a viscous damper of velocity-dependent coefficient of restitution.
| (3) |
with
| (4) |
where is the effective elastic modulus, is the effective radius, is the normal unit vector, and s is the normal dissipative parameter, calculated as in 25, considering a coefficient of restitution of for the tangential translational velocity of the rotating bottom plate at the split radius. The effective elastic modulus is given by
| (5) |
where , and , are the elastic moduli and Poisson ratios of particles , , respectively.
We model the tangential viscoelastic forces considering a path-dependent calculation, following the no-slip solution of Mindlin 26 for the elastic part and Parteli and Pöschel 27 for the tangential dissipative parameter , which are capped by the static friction force between two particles. The tangential force is thereby given by
| (6) |
where is the friction coefficient, is the unit vector in the tangential contact direction and the effective shear modulus, given by
| (7) |
The shear modulus is calculated assuming isotropic material. For the interaction between different species, the effective friction coefficient is considered as . It is typical for many DEM formulations to consider the minimum coefficient of friction when two particles of different materials come into contact. Since the harmonic average of two values favors the smaller one, considering this calculation of the friction coefficient for contacts between high and low friction coefficients gives values close to considering the minimum value. This assumption is chosen as a milder approach to simply assuming the minimum friction coefficient of the two, and more experimental evidence is required to understand the friction between hard and soft particles. Considering the harmonic average here, we have three scenarios of possible contacts between frictional-frictional, slippery-slippery and frictional-slippery (with friction very close to slippery-slippery) particles.
3 Segregation effects
When granular mixtures with particles differing in size and/or density are subjected to external forces such as shaking, stirring, or shearing, they often segregate to form complex patterns. These patterns of segregation can lead to different and inhomogeneous macroscopic behavior. In many applications where a homogeneous packing is sought, this is undesirable, and significant effort is often invested in attempts to avoid or control segregation during processing and handling of granular materials. Shear-induced percolation segregation that occurs due to kinetic sieving and squeeze expulsion is the dominant mechanism in dense granular flows. In this study, we study a bi-disperse mixture of two species that differ slightly in terms of particle size. Therefore, in this section, we examine the extent to which particles segregate in this system of hard frictional and soft slippery particles, sheared in the split-bottom shear cell.
First, we analyze the probability distribution of the particles of each species in the radial and vertical directions for a given snapshot after s of simulation time, as shown in Figure 3(a) and (b), respectively. The distribution increases in the radial direction for both species due to the increased measuring volume (the probability is calculated using co-centric cylinders of increasing radius, aligned with the center of the cell). Note that the distribution of the two species overlaps with each other in the radial direction, indicating that there is no segregation effect of the two species horizontally. The distribution in the vertical direction for species B is nearly constant. However, the distribution of species A decreases in vertical direction from to , indicating a higher probability of species A near the bottom of the shear cell than near the free surface. This is a signature of the segregation of species A in the vertical direction due to kinetic sieving, and is attributed to the smaller particle size compared to species B. To further analyze this effect, Figure 4(a) and (b) illustrate the mean radial positions and perpendicular positions of the two species as a function of shear displacement . Here, it is to be noted that the mean position of Species A is about mm less in the direction and mm less in the direction than that of Species B. However, the differences are negligibly small and of less than one particle diameter.
4 Micro-macro transition
The current work aims to derive appropriate macroscopic fields commensurate with the shear band features and macromechanical stress analysis, e.g., strain rate, velocity profile, and stress, based on the given micromechanical properties. The flow that rapidly relaxed to a steady state is purely azimuthal and is proportional to the driving rate of the shear cell, . The averaging is thus performed in toroidal volumes over many snapshots of time, leading to generic continuum fields as a function of the radial and vertical positions. We choose the representative elementary volume according to the 28 as equal to the minimum particle diameter mm.
Shearing of a granular system leads to volume dilation and build-up of shear stress and anisotropy in fabric. Since we are interested in the steady-state flow profile, we probe for the minimum strain required to reach the steady-state flow regime. We define the shear displacement through which the system rotates (where is the simulation time) as the shear control parameter. As reported by Singh et al. 29, both the global quantities of kinetic energy and average number of contacts reach a steady state very fast (). We analyze the relaxation of local quantities, specifically the local velocity profiles, and conclude that is the amount of shear displacement required to form a stable shear band, which is in agreement with Ries et al. 30. The data depicting the initial, transient evolution of local shear band properties is not presented here, as our focus is solely on the steady-state characteristics of the shear band. Consequently, we perform the local averaging over almost snapshots distributed over to .
The consistency of the local averaged quantities also depends on the accumulated local shear strain during the averaging time. We concentrate our interest in the region where the system can be considered to reach a critical state. The critical state is a unique steady state reached after extensive shear, where the material deforms with applied strain without any further change in normal stress, shear stress, and volume fraction. This is a state where the system forgets its loading, packing, or other sample-preparation history 31. In accordance with previous experimental and numerical results in the same setup 32, 33, the criterion of large strain rate identifies the shear band region, e.g., higher than a critical strain rate of s-1. Here, the shear band center region is defined by strain rates higher than 80% of the maximum strain rate for different heights in the shear cell. Therefore, the critical strain rate here is a function of height in the shear cell and is denoted as .
5 Flow profile of granular mixtures
Once the flow of the mixtures relaxes to steady state shearing, the azimuthal velocity is proportional to the driving rate . Figure 5(a) shows the scaled angular velocity profile . Within the limits of assumptions in our simulations, we do not see a clear difference in the flow profiles of the three cases of pure particles and mixtures for , and . However, we observe that the shear zone of the mixture is slightly more diffused compared to the pure case simulations involving only soft or only hard particles . This indicates a wider shear band for the mixture, although it is not clearly concluded from this figure. A closer and more precise introspection on the shear band properties is therefore essential to conclude the shear zone properties of the mixture. On this ground, we analyze the dimensionless ratio of the measured angular velocity as a function of the radial coordinate . The dimensionless velocity profile in a split bottom shear cell is well approximated by an error function 5, 10
| (8) |
where and are the position and width of the shear band developed above the split at , respectively. Both the position and the width of the shear band depend on the height in the system. Therefore, we extract the position and the width of the shear band at layers of varying height along the filling height in the shear cell by fitting the scaled against the radial position data. With the goal to extract quantitative data for the shear band features, Figure 5(b) shows values of non-dimensional angular velocity at different heights in the bulk of granular materials against the radial distance.
A quantitative study of the velocity gradient leads to the strain rate , which is calculated from the shear-free sheet strain tensor components and 34. The shear intensity in the shear plane is thus expressed in terms of velocity gradients and as:
| (9) |
Figure 6(a) shows the strain rate evaluated from Equation 9 and plotted as a function of radial and vertical position for the sample with . The dashed lines overlaid on top of the contour graph indicate the center and the edges and of the shear band, indicated in the figure, as obtained from the fit function in Equation 8.
An important objective of this present study is to characterize the shear zone profiles of granular materials for ensembles of soft slippery and hard frictional materials. Figure 6(b) shows the shear band profiles for samples with and . As observed from the figure, the width of shear band corresponding to a mixture sample is wider than that of the pure mixtures, corresponding to and . Also, the position of the shear band corresponding to a mixture sample is shifted closer to the center than the pure mixtures. Note that the profile for the scaled width as a function of shown in Figure 6(c) does not follow a quadrant shape, as described by the analysis of Ries et al. 30, for any of the samples. The reason behind this deviation needs further exploration. However, a possible reason for this deviation can be due to the low and ratios, where is the mean particle diameter. The normalized position of the shear band for the different mixtures as a function of bulk height is shown in Figure 6(d), and the trends agree with that shown by Unger et al. 10. From both Figure 6(c) and (d), we observe a marked deviation in the trend for compared to the pure samples with and . Next, we analyze the width and position of the shear band for a horizontal slice through the axis of the shear cell at mm, as represented by the dashed line in Figure 6(b), for all samples of different fraction of hard particles and show them in Figure 6(e) and (f), respectively. Here, we find that the shear band gets wider as well as moves inwards in a mixture of soft and hard spheres up to a fraction , which corresponds to an intermediate mixture of % soft - % hard particles. With a further increase of , the shear band narrows and moves outwards in the shear cell. The non-monotonic trend of the width of the shear band with increasing was also observed by Wang et al. 11.
From the above observations, we conclude that the ratio of hard spheres in a mixture of hard frictional and soft slippery particles significantly affects the flow profiles at the bulk scale. For up to intermediate ratios of hard particles, the shear band gets wider by up to , and also the center shifts inwards by up to , compared to the values for pure soft particles. Both of these features are influenced by the effect of inter-particle friction and stiffness, which are dominant for frictional hard particles 8.
Wang et al. 11 observed experimentally a notable difference in the shear band properties between samples made of pure materials and mixtures. It was observed that the shear zones of the mixtures are wider than those of the pure materials. Unlike the experimental observations, which show a significant widening of the shear zone for mixtures, our simulations show a rather small effect of widening the shear zone. However, the distinct non-monotonic trend of the shear band width as a function of the mixing ratio is the feature observed in experiments, which is also captured in our simulations. In addition, we observe the shift in shear band position for the mixtures, which were not reported in the experimental work. It is important to note that the capillary bridges resulting from small amounts of liquid between hydrogel particles potentially have an impact on experiments, despite not being taken into consideration in this numerical study. For larger quantities of liquid in the mixtures, beyond the capillary regime, the material would exhibit a more dispersed shear behavior.
6 Simplified cases to explore the role of inter-particle friction and elastic modulus
| Cases | Elastic modulus () | Friction coefficient () |
|---|---|---|
| kPa for both species | ||
| kPa for both species | ||
| kPa kPa | for both species | |
| kPa kPa | for both species |
Following the findings of this study and the qualitative agreement of our results with the observations noted by Wang et al. 11, it becomes evident that mixtures of soft, slippery and hard frictional grains demonstrate shear bands of variable width for increasing mixing ratio, which evolves non-monotonically with increasing values of the ratio. Since the materials of interest have two independent material parameters differing distinctly, namely friction and elastic modulus, it is interesting to look into their individual effects on the shear band characteristics. Hence, to explore the role of inter-particle friction and elastic modulus on the flow profile of the granular mixture systematically and independently of each other, we vary one parameter at a time in additional discrete element simulations of a parametric nature, while keeping the other parameter constant. Therefore, we conducted four case studies, as outlined in Table 3. In these studies, our primary focus is on analyzing the shear band characteristics at a specific height, denoted as in Figure 6(b) as a function of mixing ratio . We then proceed to compare the obtained results with those from the real simulations.
6.1 Shear band characteristics of granular mixtures
Luding 8 examined the effects of friction on shear bands via simulations of a split-bottom shear cell. He showed that the presence of inter-particle friction does not affect the qualitative behavior of the shear band. However, the shear band moves inwards and gets narrower in the presence of friction. This is justified by the fact that with increasing friction, there is less relative displacement between the particles, particles tend to move more as a rigid block, and hence, the shear band width decreases. Here, we vary the inter-particle friction of the mixture by varying the fraction of hard particles , keeping the elastic modulus constant in cases and as implied by the red and blue curves, respectively, in Figure 7. For both the cases, we observe that the shear band width decreases with increasing in Figure 7(a). Also, the shear band position moves inwards with increasing as shown in Figure 7(b). Our results agree with the findings of Luding on the effects of friction on shear band characteristics.
On the contrary, varying the elastic modulus and considering same friction coefficient for the two materials leads to a wider shear band formation with increasing fraction of hard particles , as demonstrated by cases and . This is implied by the green and orange curves in Figure 7(c). However, for the same friction between the two species, varying only the elastic modulus of the species has only a small effect on the position of the shear band as a function of as shown by the green and orange trends in Figure 7(d).
Overall, there is a dual effect of friction and elastic modulus that influences the shear band properties. While increasing friction tends to reduce the width of the shear band with increasing , increasing elastic modulus plays the opposite role in increasing the width for increasing . For smaller values of , the friction of soft particles is smaller and hence is less dominant, i.e., it is easier for inter-particle contacts to slide. With increasing , there are more contacts between hard frictional particles, and hence friction dominates over the effect of elastic modulus.
6.2 Macroscopic friction coefficient of granular mixtures
The local shear stress plotted against the local normal stress is shown in Figure 8(a). Since the system is inhomogeneous in nature, for a given pressure, we observe a wide range of local strain rate values , and we find that shear stress is higher for increasing strain rate . However, for values above the critical strain rate, i.e., , becomes almost independent of the local strain. This means that is nearly constant for all data points with strain rate . A linear trend is observed for the shear stress as a function of the normal stress, which is fitted well by:
| (10) |
where is the macroscopic friction coefficient obtained from linear fitting of the local shear stress and normal stress values.
We further analyze the macroscopic friction coefficient for different mixtures as a function of for the real simulations and the simplified cases and show the results in Figure 8(b). The macroscopic friction coefficient increases as a quadratic function with for the simplified cases of and , i.e., same elastic modulus for both materials and varying inter-particle friction coefficient. On the contrary, increases linearly with for cases and , i.e. varying elastic modulus and same inter-particle friction coefficient for both materials. Furthermore, the macroscopic friction coefficient for the real simulations also increases as a quadratic function with , which suggests that for the real simulations is strongly dominated by the varying inter-particle friction coefficient between the two species. The elastic modulus does not play a significant role in influencing the of the bulk behavior. Focusing on the functional form of the quadratic function vs for the real simulations, the black solid line represents the quadratic fitting equation , where is the macroscopic friction coefficient corresponding to the pure soft particle mixtures and here depends on the inter-particle friction coefficient values of pure soft and hard species.
7 Conclusions
This work investigated the shear zone characteristics in binary mixtures of soft low frictional and hard frictional particles, via discrete element simulations of mixtures inside a split-bottom shear cell. The ratio of the volume of hard particles to the soft particles was varied parametrically to observe its effects on measures of interest, including the shear band width , shear band position and the macroscopic friction coefficient .
By comparing the width and position of the shear zone for samples of pure soft low frictional and for samples of pure hard frictional particles, it becomes evident that both systems show somewhat similar shear band features. However, mixtures of the two materials exhibit broader shear bands and a shifting of the shear band position towards the center of the shear cell. Both these effects demonstrate non-monotonicity for increasing fraction of hard particles. Although the changes in shear band characteristics for different mixtures are small, the non-monotonic trend of the shear band features as a function of mixing ratio is an interesting effect of the shear behavior of binary mixtures of this nature. We attribute the effects of shear band widening in these mixtures to an interplay of the role of inter-particle friction and particle stiffness.
Contrary to the shear band characteristics, the macroscopic friction coefficient shows a monotonically increasing trend as a quadratic function with an increasing fraction of hard particles in the mixtures. The macroscopic friction coefficient is strongly influenced by the inter-particle friction coefficient of the species present in the mixture, and the elastic modulus seems to play a less significant role.
This work captures critical features of shear band formation in soft-hard particle mixtures of low-high inter-particle friction, such as the non-monotonic evolution of the shear band width and position for increasing mixing ratios. However, the sensitivity of these features in our simulations is minor as compared to that observed in the experiments by Wang et al. 11. Some of the additional factors that might play a role in the experiments but are not captured in our simulations include the following: (i) our simulations only consider spherical particles and do not account for non-spherical shapes or the actual particle size distribution, (ii) the real stiffness of the mustard seeds is not taken into account; a sufficiently stiffer material is chosen for the mustard seeds instead, and (iii) capillary bridges due to small amounts of liquid between hydrogel particles might play a role in experiments which are not considered here. The material would exhibit a more dispersed shear behavior for larger quantities of water in the mixtures beyond the pendular regime. Even with these discrepancies, our work captures the shear band behavior observed experimentally and the evolution of its characteristics for varying mixing ratios of soft and hard particles.
Author Contributions
SR and VA designed the research and planned the parametric DEM simulations which APS carried out. SR and VA wrote the first draft of the manuscript, and TP reviewed and wrote with SR and VA the second draft. All authors reviewed the results and approved the final version of the manuscript. SR secured the research funding.
Conflicts of interest
There are no conflicts to declare.
Acknowledgements
We acknowledge Stefan Luding for providing the code for micro-macro data transition and carefully reviewing this work. We thank Joshua Dijksman for stimulating discussion on this work. Financial support through the Emerging Talents Initiative (ETI Project No. ETI-Antrag_2022-1_Tech_13_Roy) and the DFG grant for Granular Weissenberg Effect (Project No. PO472/40-1) are acknowledged by SR and TP, respectively.
Notes and references
- Wortel et al. 2015 G. Wortel, T. Börzsönyi, E. Somfai, S. Wegner, B. Szabó, R. Stannarius and M. van Hecke, Soft Matter, 2015, 11, 2570–2576.
- Fischer et al. 2016 D. Fischer, T. Börzsönyi, D. S. Nasato, T. Pöschel and R. Stannarius, New Journal of Physics, 2016, 18, 113006.
- Fenistein and Van Hecke 2003 D. Fenistein and M. Van Hecke, Nature, 2003, 425, 256–256.
- Fenistein et al. 2004 D. Fenistein, J. W. van de Meent and M. van Hecke, Physical Review Letters, 2004, 92, 094301.
- Dijksman and Van Hecke 2010 J. A. Dijksman and M. Van Hecke, Soft Matter, 2010, 6, 2901–2907.
- Henann and Kamrin 2013 D. L. Henann and K. Kamrin, Proceedings of the National Academy of Sciences, 2013, 110, 6730–6735.
- Singh et al. 2014 A. Singh, V. Magnanimo, K. Saitoh and S. Luding, Physical Review E, 2014, 90, 022202.
- Luding 2007 S. Luding, Particulate Science and Technology, 2007, 26, 33–42.
- Faroux et al. 2022 D. Faroux, K. Washino, T. Tsuji and T. Tanaka, Physical Review Fluids, 2022, 7, 084306.
- Unger et al. 2004 T. Unger, J. Török, J. Kertész and D. E. Wolf, Physical Review Letters, 2004, 92, 214301.
- Wang et al. 2022 J. Wang, Z. Farmani, J. A. Dijksman, C. Lübeck, O. Speck and R. Stannarius, Granular Matter, 2022, 24, 103.
- Ashour et al. 2017 A. Ashour, T. Trittel, T. Börzsönyi and R. Stannarius, Physical Review Fluids, 2017, 2, 123302.
- Hong et al. 2017 X. Hong, M. Kohne, M. Morrell, H. Wang and E. R. Weeks, Physical Review E, 2017, 96, 062605.
- Harth et al. 2020 K. Harth, J. Wang, T. Börzsönyi and R. Stannarius, Soft Matter, 2020, 16, 8013–8023.
- Uñac et al. 2012 R. O. Uñac, A. M. Vidales, O. Benegas and I. Ippolito, Powder technology, 2012, 225, 214–220.
- Rudge et al. 2020 R. E. Rudge, J. P. Van De Sande, J. A. Dijksman and E. Scholten, Soft Matter, 2020, 16, 3821–3831.
- Wang et al. 2021 J. Wang, B. Fan, T. Pongó, K. Harth, T. Trittel, R. Stannarius, M. Illig, T. Börzsönyi and R. C. Hidalgo, Soft Matter, 2021, 17, 4282–4295.
- Beverloo et al. 1961 W. A. Beverloo, H. A. Leniger and J. Van de Velde, Chemical Engineering Science, 1961, 15, 260–269.
- Saitoh et al. 2015 K. Saitoh, V. Magnanimo and S. Luding, Soft Matter, 2015, 11, 1253–1258.
- Luding et al. 2022 S. Luding, K. Taghizadeh, C. Cheng and L. Kondic, Soft Matter, 2022, 18, 1868–1884.
- Götz et al. 2022 H. Götz, A. Santarossa, A. Sack, T. Pöschel and P. Müller, Granular Matter, 2022, 24, 1–9.
- Weinhart et al. 2020 T. Weinhart, L. Orefice, M. Post, M. P. van Schrojenstein Lantman, I. F. Denissen, D. R. Tunuguntla, J. Tsang, H. Cheng, M. Y. Shaheen, H. Shi et al., Computer Physics Communications, 2020, 249, 107129.
- Sakaie et al. 2008 K. Sakaie, D. Fenistein, T. J. Carroll, M. van Hecke and P. Umbanhowar, Europhysics Letters, 2008, 84, 38001.
- Brilliantov et al. 1996 N. V. Brilliantov, F. Spahn, J.-M. Hertzsch and T. Pöschel, Physical Review E, 1996, 53, 5382.
- Müller and Pöschel 2011 P. Müller and T. Pöschel, Physical Review E, 2011, 84, 021302.
- Mindlin 1949 R. D. Mindlin, Journal of Applied Mechanics, 1949, 16, 259–268.
- Parteli and Pöschel 2016 E. J. Parteli and T. Pöschel, Powder Technology, 2016, 288, 96–102.
- Lätzel et al. 2000 M. Lätzel, S. Luding and H. J. Herrmann, Granular Matter, 2000, 2, 123–135.
- Singh et al. 2015 A. Singh, V. Magnanimo and S. Luding, New Journal of Physics, 2015, 17, 043028.
- Ries et al. 2007 A. Ries, D. E. Wolf and T. Unger, Physical Review E, 2007, 76, 051301.
- Wood 1990 D. M. Wood, Soil behaviour and critical state soil mechanics, Cambridge University Press, 1990.
- Luding 2008 S. Luding, Particuology, 2008, 6, 501–505.
- Szabó et al. 2014 B. Szabó, J. Török, E. Somfai, S. Wegner, R. Stannarius, A. Böse, G. Rose, F. Angenstein and T. Börzsönyi, Physical Review E, 2014, 90, 032205.
- Depken et al. 2006 M. Depken, W. van Saarloos and M. van Hecke, Physical Review E, 2006, 73, 031302.