QualEval: Qualitative Evaluation for Model Improvement
Abstract
Quantitative evaluation metrics have traditionally been pivotal in gauging the advancements of artificial intelligence systems, including large language models (LLMs). However, these metrics have inherent limitations. Given the intricate nature of real-world tasks, a single scalar to quantify and compare is insufficient to capture the fine-grained nuances of model behavior. Metrics serve only as a way to compare and benchmark models, and do not yield actionable diagnostics, thus making the model improvement process challenging. Model developers find themselves amid extensive manual efforts involving sifting through vast datasets and attempting hit-or-miss adjustments to training data or setups. In this work, we address the shortcomings of quantitative metrics by proposing QualEval, which augments quantitative scalar metrics with automated qualitative evaluation as a vehicle for model improvement. QualEval uses a powerful LLM reasoner and our novel flexible linear programming solver to generate human-readable insights that when applied, accelerate model improvement. The insights are backed by a comprehensive dashboard with fine-grained visualizations and human-interpretable analyses. We corroborate the faithfulness of QualEval by demonstrating that leveraging its insights, for example, improves the absolute performance of the Llama 2 model by up to 15% points relative on a challenging dialogue task (DialogSum) when compared to baselines. QualEval successfully increases the pace of model development, thus in essence serving as a data-scientist-in-a-box. Given the focus on critiquing and improving current evaluation metrics, our method serves as a refreshingly new technique for both model evaluation and improvement.
1 Introduction
The recent success of large language models (LLMs) while can be attributed to data and compute scaling, has also been the result of evaluation metrics that allow benchmarking and comparison of models. This surge in the development of LLMs and associated tasks has reignited the need for innovative evaluation methods, aiming to provide more effective guidance throughout the model development process. Traditional scalar quantitative metrics like perplexity, BLEU, and ROUGE play an important role in objectively measuring improvements in model performance. However, these scalar metrics cannot capture the nuances of model behavior and therefore are unable to provide model developers actionable directions and diagnostics for model improvement. In practice, this deficiency often necessitates model developers to collaborate with an army of data scientists and engineers, requiring extended and extensive iterations across a diverse array of models and tasks, especially in rapidly evolving real-world settings.
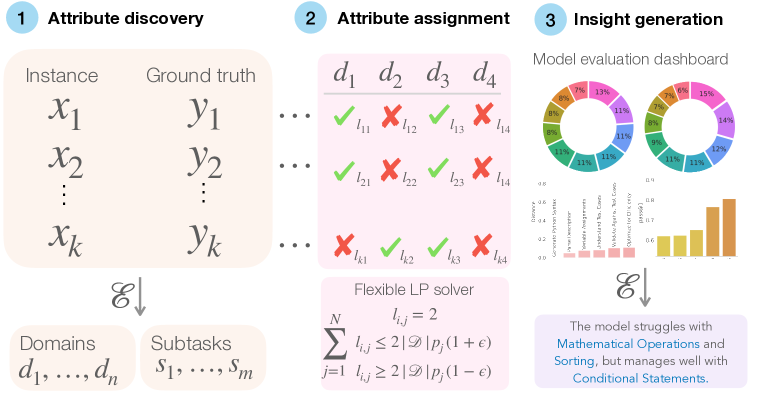
In this work, we use “quality over quantity” as a guiding principle to propose our model and task agnostic method QualEval, that uses qualitative evaluation to address the issues with quantitative metrics. Given a model that is being developed for a task, QualEval serves as an automated data scientist by analyzing the dataset and the model’s predictions to generate actionable directions supported by a comprehensive dashboard containing fine-grained analysis of the model’s behavior (Figure 1). The directions identified by QualEval improve the model, thus significantly expediting the model development lifecycle. Note that qualitative evaluation does not reject the use of metrics, but uses them as just one of the parts for more holistic and useful evaluation.
QualEval’s algorithm for facilitating model improvement can be broken down into three steps (Figure 2): (1) Attribute discovery: Automatic discovery of domains and sub-tasks in the dataset, to help identify issues at a fine-grained level. (2) Attribute assignment: Utilize a novel flexible linear programming solver to assign attributes to instances in the dataset and analyze the performance of the model on different attributes to create a human-readable dashboard. (3) Insight generation: Parse the generated dashboard to provide natural language insights that improve the model. QualEval’s end-to-end pipeline is completely automated and requires no human intervention.
We demonstrate QualEval’s potency on a wide range of tasks including code generation, dialogue summarization, and multiple-choice question answering. We harness these insights provided by QualEval to precisely and significantly improve the performance of the open-source Llama 2 model on a dialog summarization task. In a demonstration of efficacy, QualEval’s insights allow a model practitioner to make changes to the fine-tuning procedure by augmenting with the right instances, thus leading to an overall ROUGE-L score improvement of up to 15%. QualEval’s insights also allow targeted improvement in sub-domains more critical to performance, with absolute improvements of up to points.
Our contributions are as follows: (1) We propose the first qualitative evaluation framework for LLMs. (2) We introduce a novel and faithful flexible linear programming-based algorithm to automatically and accurately assign attributes to input instances, which are consequently used to generate faithful and actionable insights. (3) We demonstrate that the generated insights can be effectively leveraged for model improvement, leading to accelerated model development.
2 Methodology
2.1 Formulation
Quantitative evaluation
Quantitative evaluation, which is the standard approach to evaluating models, is typically based on averaging the value obtained by using a metric to evaluate instances of the dataset independently. Formally, given a dataset comprising of instances containing inputs () and ground truth outputs (), a performance (proficiency) metric , and a model , then:
| Quantitative evaluation |
Qualitative evaluation
Qualitative evaluation (QualEval) is based on holistically evaluating the model’s performance in a fine-grained manner rather than relying on a single scalar value. QualEval outputs a detailed dashboard that describes the intricate nature of the model’s performance with the direct goal of improving it by providing actionable insights. QualEval backs up the insights with relevant evidence like visualizations and human-readable reasoning. Formally, let be the vocabulary of the language of the dashboard (here, English) and be the set of all possible visualizations. Let be an evaluator system which generates the dashboard, where the system includes LLMs to reason and provide insights and image generation models to generate plots for example. Then, the output of QualEval is given by:
| Qualitative evaluation |
Qualitative evaluation does not reject the use of metrics, but uses them as one of the parts of a more actionable evaluation. In essence, quantitative evaluation is just a small subset of QualEval.
2.2 QualEval: Qualitative evaluation
QualEval consists of multiple steps that help provide interpretable and actionable insights and we break them down below.
Attribute discovery
Given the dataset , QualEval uses an evaluator LLM () to automatically discover relevant domains and sub-tasks, and in the dataset. We refer to these domains and sub-tasks as attributes. Specifically, we prompt with the dataset and a task instruction signifying how to solve the dataset () to generate the attributes (see 8 for the exact prompt). Given that datasets can have a large number of instances and LLMs have context length limits, we iteratively sample instances from the dataset and repeat the prompting process times to generate a large list of attributes (, ). To ensure that we choose high-quality attributes, we prune the list of candidates in an iterative process by reducing the size by a factor of in each turn and repeating the process until we have attributes. In each step, we prompt to shrink the list by choosing the best attributes from the previous list of candidates. Therefore, this iterative scalable procedure allows QualEval to discover attributes in arbitrarily large data across a wide range of tasks, notwithstanding the context window limitations of .
Attribute assignment
QualEval performs attribute assignment ( and ) by scoring the “affinity” or relevance of each instance with different attributes. Let and denote the domain and sub-task affinity scores, where and denotes the number of attributes ().
We use a novel flexible linear programming solver to perform the attribute assignment by ensuring the following properties: (1) An instance is assigned domains and sub-tasks each so that we can give concrete insights. (2) The number of assignments to an attribute is proportional to the prior probability of the attribute. This ensures that rare attributes are not ignored. (3) Choose the assignments with maximum affinity for each instance. We achieve the above wish-list by formulating the attribute assignment as a linear programming (LP) problem.
Given the affinity scores and the prior probabilities, , we assign every sample to 2 domains and 2 sub-tasks. However, we want the assignments to respect the prior probabilities i.e. ratio of the number of assignments to all the attributes should be equal to the ratio between the prior probabilities. We enforce this by constraining the number of assignments to an attribute to be .
Let be the assignment matrix, where indicates that the sample is assigned to the attribute and indicates otherwise. Let be the prior probability of the attribute. To accommodate for the noisiness in an automated method, we make the prior probability constraint flexible by adding some slack, (), so that QualEval has some wriggle room to change the attribute probability distribution in favor of better assignments. Therefore, to enforce the prior probability constraint, we sum across the columns of and constrain the sum to be between and . To ensure we assign each sample to 2 attributes, we sum across the rows of and constrain the sum to be . We formalize the LP as:
We perform an expert verification of the attribute assignments by sampling 100 samples from the dataset and asking three machine learning practitioners if both the domain and sub-task assignments are correct and find that they are indeed correct on average 84% and 90% of the time.
Once we have the assignments, we evaluate each instance using the proficiency metric for each domain and sub-task to get . We use the assignments to breakdown the proficiency metric by domains and sub-tasks and automatically generate visualizations that help understand the model’s fine-grained performance.
Measuring sub-task skill alignment
For several datasets, predicting the right answer is not good enough, and producing an answer that uses the same sub-tasks as the ground truth is important. We call this skill alignment and compute it by measuring the correlation between the sub-task affinity scores of the ground truth and the model prediction (higher values implying higher skill alignment).
Insight generation
QualEval then leverages the visualizations from previous stages to generate useful and actionable insights as a natural language output. We prompt with the data from the prior probability, proficiency breakdown, and skill alignment visualizations to generate useful insights (See 8 for exact prompt). We integrate all the visualizations and insights into a human-readable dashboard depicted in Figure 1.
3 Experimental Setup
Datasets
We evalaute QualEval on three datasets: MBPP (Austin et al., 2021) (sanitized), DialogSum (Chen et al., 2021), and MMLU (Hendrycks et al., 2020) (clinical knowledge split). MBPP and DialogSum involve generative tasks and involve generating a Python program from a prompt and summarizing a conversation respectively. MMLU contains a wide range of multiple-choice questions from different domains and we pick the clinical knowledge split to evaluate our model on knowledge-intensive tasks. We use the same evaluation splits as the original papers and use the test splits for MBPP and MMLU and the validation split for DialogSum. We use the pass@1, ROUGE-L, and accuracy as proficiency metrics for MBPP, DialogSum, and MMLU respectively.
Models
We use both closed and open-sourced models: curie, davinci-2, and davinci-3 models from OpenAI and Llama 2 (7 billion chat models (Touvron et al., 2023)). We use a temperature of for all models and use two randomly sampled in-context samples for prompting models unless mentioned otherwise. We instantiate with the gpt-3.5-turbo model (OpenAI, 2023).
Llama fine-tuning
We use LoRA Hu et al. (2021) to efficiently fine-tune the Llama 2 7 billion parameter model and train with bit precision. We sweep over five learning rates (, , , , ) and pick the checkpoint with the best validation performance. We train for up to steps and we use a constant learning rate schedule.
Attribute generation
We set N (the initial number of generated categories) to 15, p (the pruning factor) to 4, and k (the number of few-shot examples during category generation) to 5 in our experiments.
4 Results
We systematically present different aspects of our dashboard. Firstly, we show that attribute discovery (domains and sub-tasks) of QualEval is well-grounded and faithful to the dataset. Secondly, we show that QualEval’s flexible LP solver correctly assigns attributes to instances of the dataset, allowing it to perform meta-reasoning over different domains and sub-tasks. Finally, we validate that the concise natural language insight generated leads to improvement in the model’s performance.
4.1 Discovering Domains and Sub-tasks
Discovering the latent domains and sub-tasks in a dataset and understanding their prominence through the prior probability of their occurrence is a critical step for QualEval. QualEval performs both the discovery and prior-probability computation automatically and faithfully.
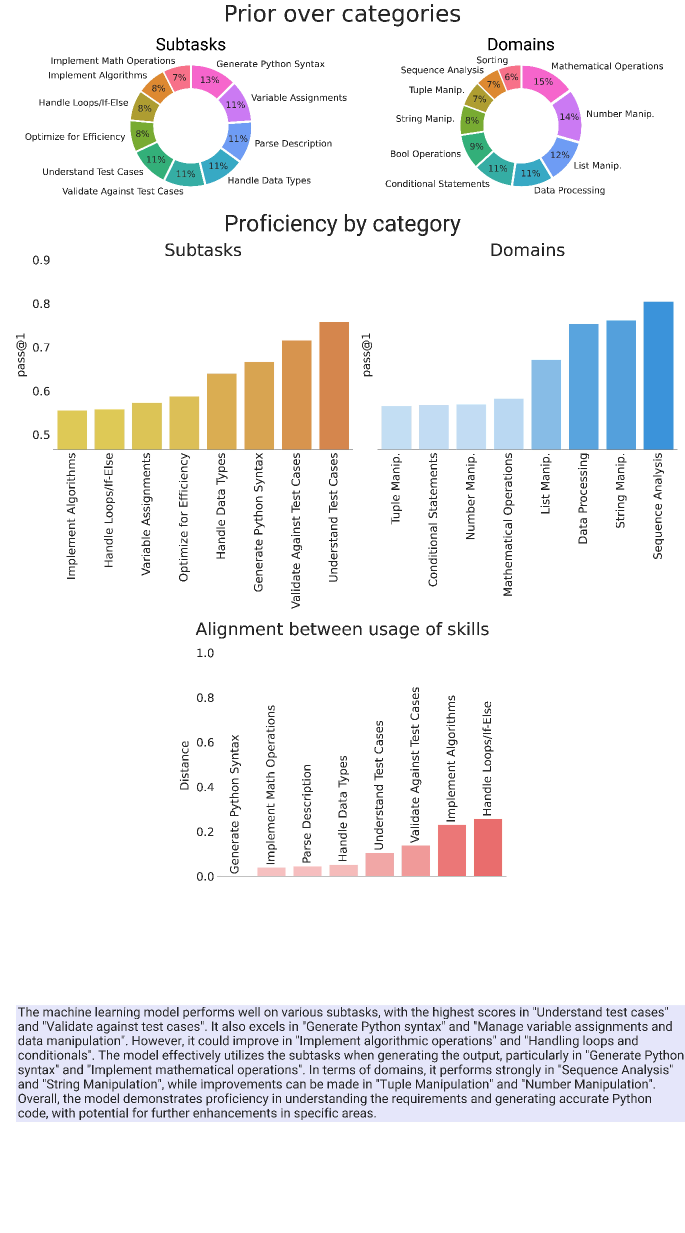
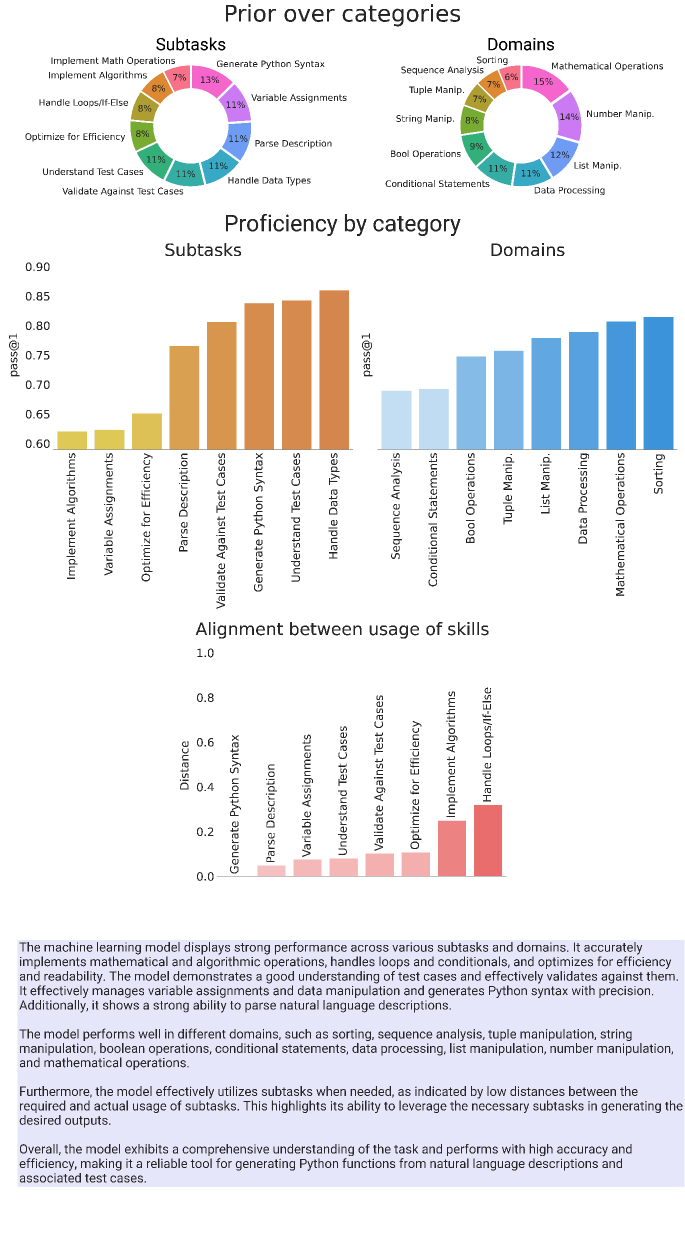
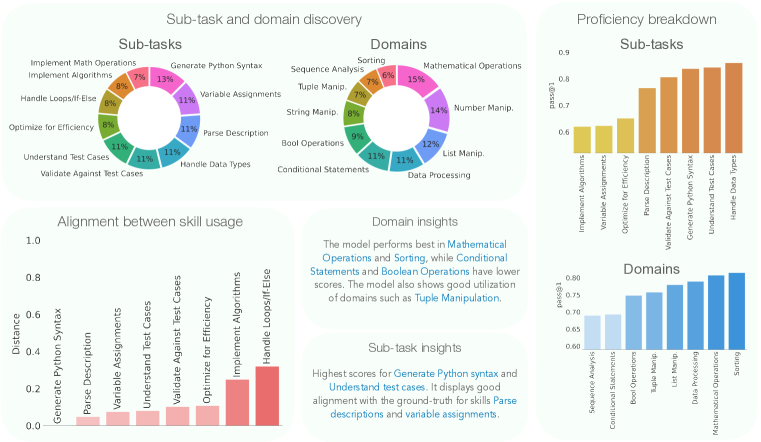
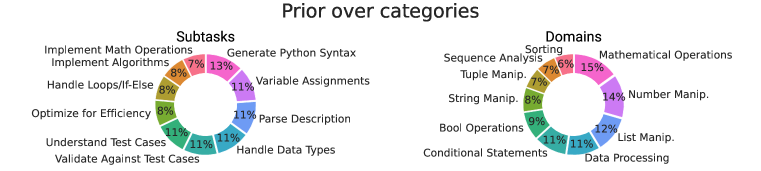
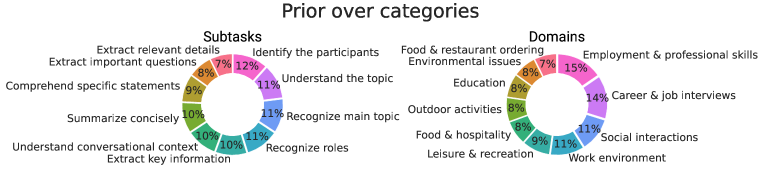
As an example, Figure 3 presents the prior probabilities of the domains and sub-tasks in the MBPP and DialogSum datasets. We find that the MBPP dataset comprises of a large set of samples that involve domains like mathematical/numerical operations () and list manipulation () while domains like sorting () and tuple manipulation () are less prevalent. Interestingly, QualEval captures fine-grained nuances by including closely related yet different sub-tasks like “Implement mathematical operations” and “Implement algorithmic operations”, giving practitioners a nuanced understanding of their evaluation data.
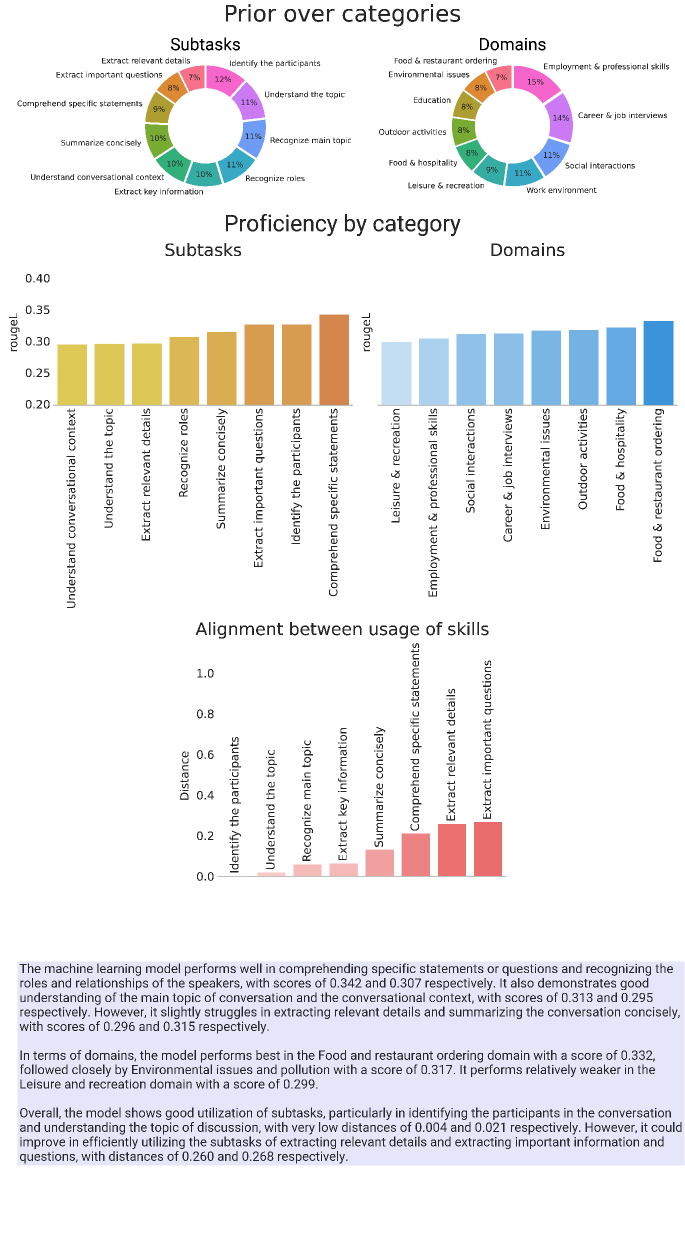
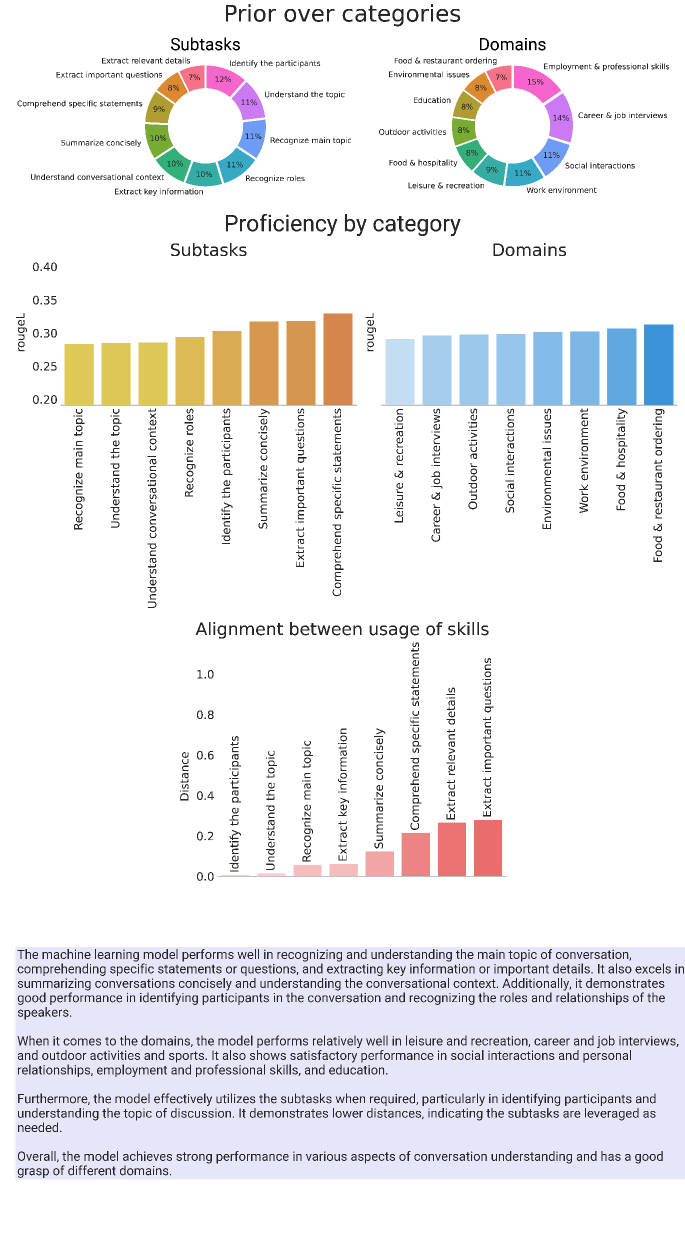
As another illustration (Figure 3 bottom), the DialogSum dataset is dominated by samples involving domains like employment and professional skills () and career and job interviews (), while domains like education and outdoor activities are less prevalent ( and respectively). Though the overall food domain is also frequent, it is listed under two fine-grained domains, “Food and restaurant ordering” () and “Food and hospitality” (), which further highlights QualEval’s ability to capture fine-grained nuances. The evaluation also suggests the dominance of sub-tasks that involve identifying the participants (), understanding and recognizing the main topic ( ), and recognizing the roles in the conversation (), which are conceptually important sub-tasks for accurately summarizing a conversation between two people.
Faithfulness of priors
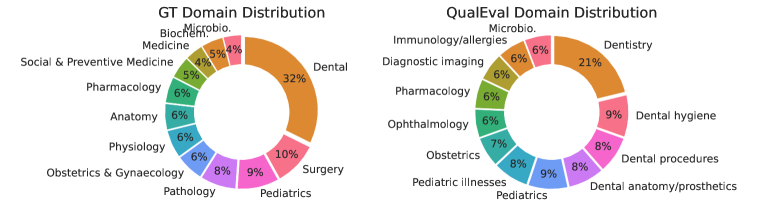
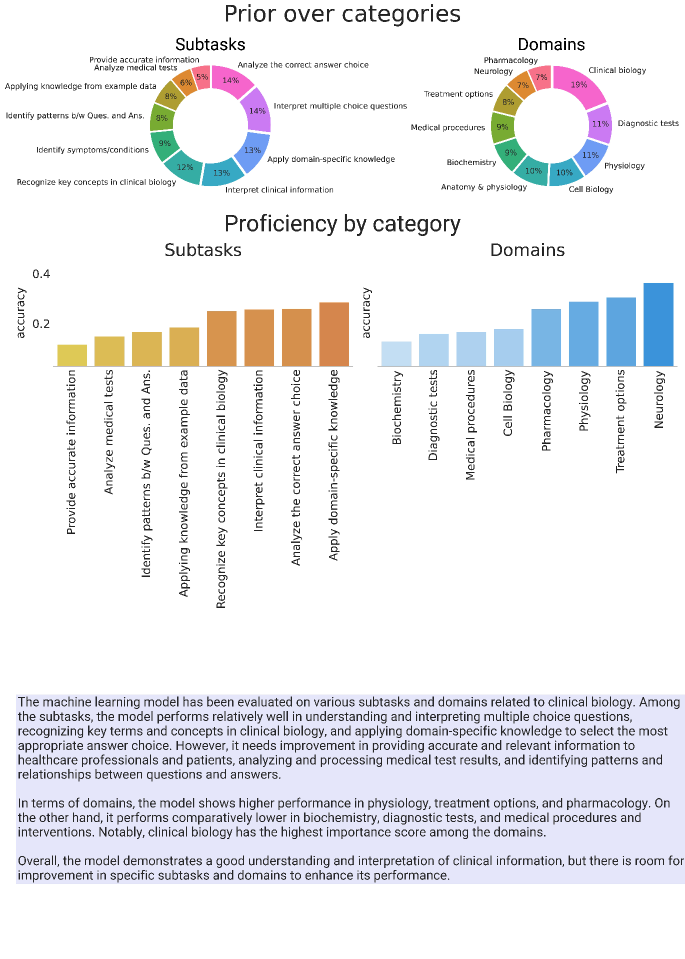
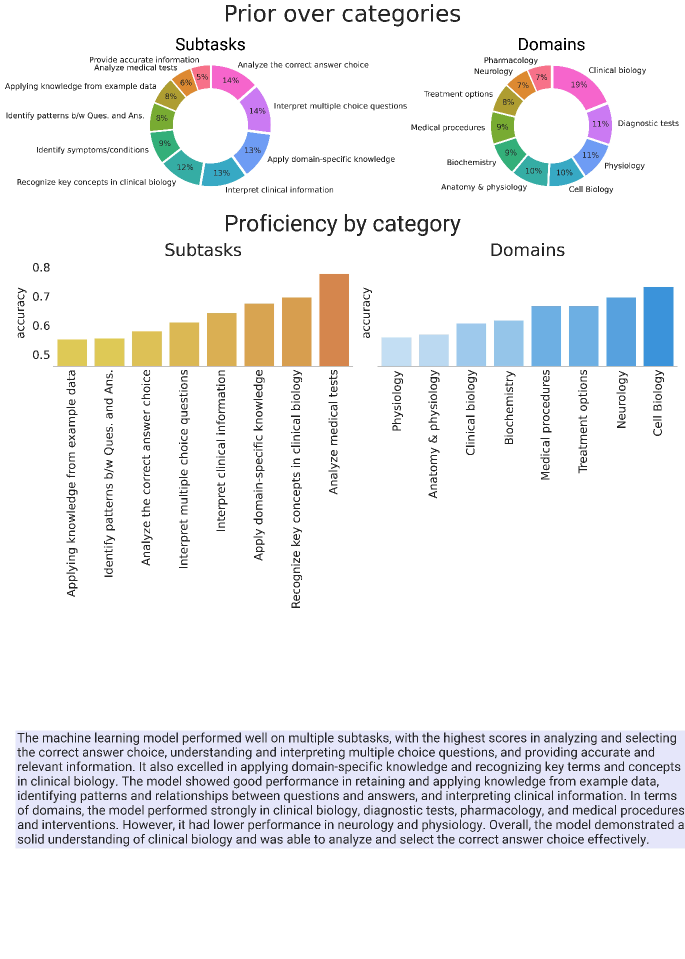
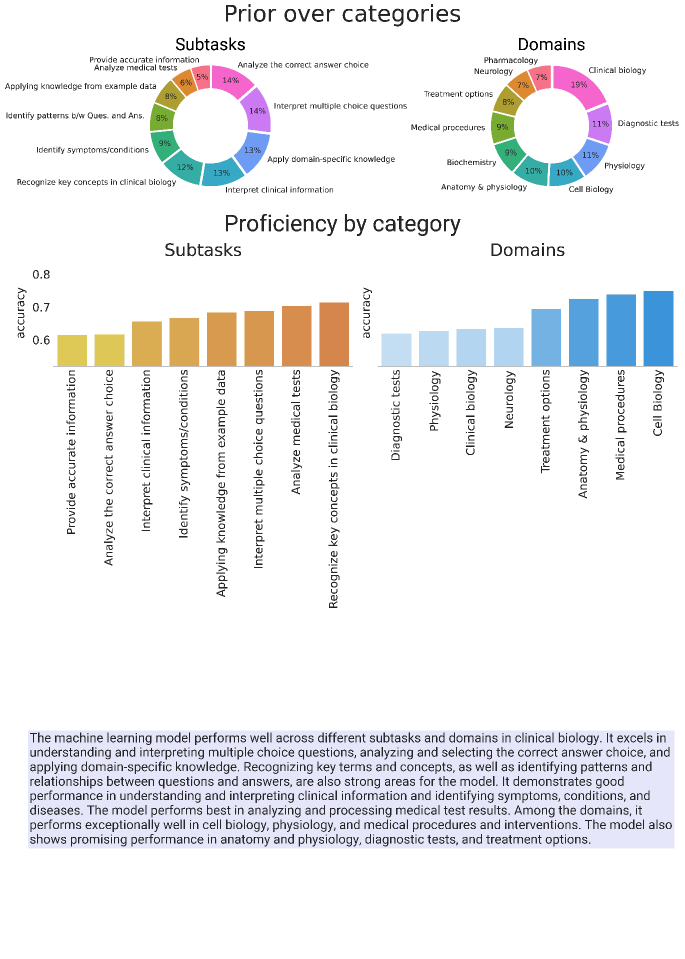
We show that the attributes discovered and prior probabilities assigned are faithful to the dataset. While most datasets do not have ground truth annotations for the domains and sub-tasks, Pal et al. (2022) introduces a multiple-choice question answering dataset, MedMCQA, collected from real-world medical exam questions, and includes domain annotations. We randomly sample questions from the MedMCQA dataset and leverage QualEval to discover domains and find the prior probabilities. We compare the prior probabilities from QualEval with the ground truth domain annotations from MedMCQA in Figure 4. We find that the domain priors from QualEval are highly aligned with the ground truth annotations (“Pediatrics” ( vs ), “Obstetrics and Gynecology”( vs ), and “Pharmacology” ( vs ) and “Microbiology” ( vs )). Interestingly, QualEval splits the “Dental” domain into more precise domains such “Dentistry”, “Dental Hygiene”, “Dental procedures”, and “Dental anatomy”, further highlighting QualEval’s ability to capture hierarchies and nuances in the data.
4.2 Proficiency categorized by Domains and sub-tasks
To generate useful insights, one needs a clear understanding of the model’s proficiency in the various domains and sub-tasks, and we demonstrate that QualEval provides exactly this. QualEval leverages the domain and sub-tasks assignments generated from our flexible LP solver to get a precise breakdown of the proficiency of a model for different domains and sub-tasks.
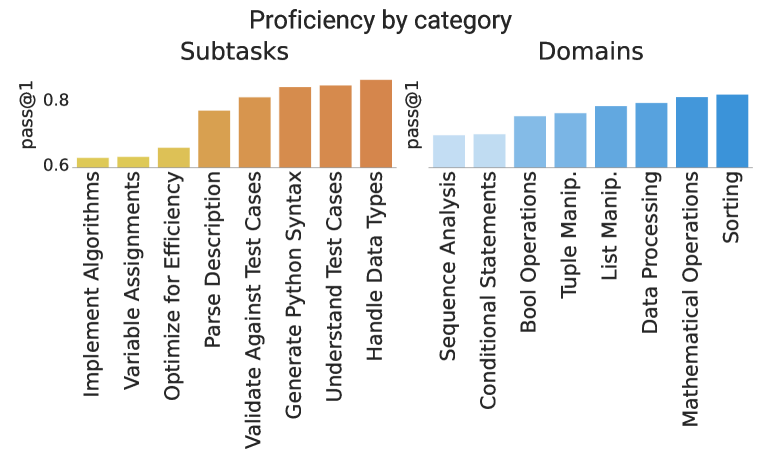
Figure 5 highlights the proficiency of the davinci-3 model on domains like sorting, mathematical operations, and data processing and on sub-tasks like handling data types, understanding test cases, and generating Python syntax. We find that QualEval’s categorization and proficiency judgement is faithful and aligned, as corroborated by analysis from Austin et al. (2021) that also suggests that models on MBPP perform well on “coding interview” type questions which generally involve data structures, sorting, list manipulation, and data processing.
Austin et al. (2021) also suggests that models struggle with samples related to advanced math problems and samples with multiple sub-problems. This conforms with QualEval’s proficiency breakdown which reveals that the model struggles with samples involving the “Implement algorithms” and “Variable assignments” sub-tasks and the “Conditional statements” and “Sequence Analysis” domains, which are often leveraged to solve math problems and samples with multiple sub-problems. These findings serve to reinforce the distinctive capability of QualEval in offering a precise and nuanced comprehension of model proficiency, made possible by our flexible LP solver.
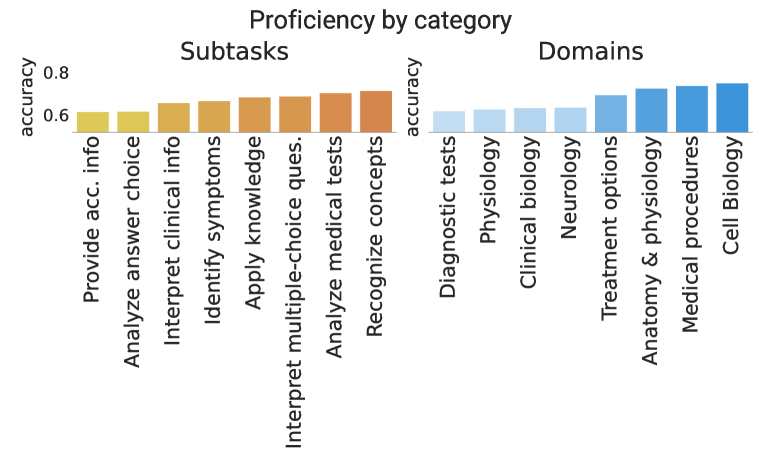
QualEval is task-agnostic, with our flexible LP solver making it potent even in niche domains such as clinical data. Figure 5 demonstrates high proficiency of the davinci-3 model on the cell biology and medical procedures domains and sub-tasks related to analyzing and processing medical test data and recognizing key terms/concepts in clinical biology. However, the model struggles with sub-tasks related to providing accurate information and analyzing the correct answer choice.
4.3 Interpretable and Actionable natural language insights
To aid model developers in understanding the dense fine-grained analysis in the prior sections, we present interpretable and actionable natural language insights grounded in the prior analysis. To generate these insights, we convert the analysis charts depicted in the prior sections into structured text and query our evaluator LLM to highlight important and actionable trends and insights. Figure 11 illustrates insights generated by QualEval for predictions from davinci-3 model on MBPP, which adeptly highlights model deficiencies for both domains and sub-tasks. For instance, the insights faithfully point out that improvements can be made to the “Tuple Manipulation” and “Number Manipulation” domains as well as the “Algorithmic operations” and “Handling loops and conditionals” sub-tasks. In the next section, we demonstrate how these insights can be leveraged towards precise and targeted model improvement, further validating the efficacy of QualEval.
| Domain sets | Rand. aug. | QualEval aug. | = (QualEval aug. – Rand. aug.) | |||||||||
|---|---|---|---|---|---|---|---|---|---|---|---|---|
| Dom 1 | Dom 2 | Dom 3 | Dom 1 | Dom 2 | Dom 3 | Dom 1 | Dom 2 | Dom 3 | Dom 1 | Dom 2 | Dom 3 | Overall |
| Social | ✗ | ✗ | ✗ | ✗ | ✗ | ✗ | ✗ | ✗ | ||||
| \cdashline1-13 Leisure | Outdoor | ✗ | ✗ | ✗ | ✗ | |||||||
| \cdashline1-13 Food ordering | Hospitality | ✗ | ✗ | ✗ | ✗ | |||||||
| \cdashline1-13 Leisure | Food Ordering | Hospitality | ||||||||||
4.4 Model Improvement via Qualitative Evaluation
We show that QualEval’s actionable insights are useful by improving models on a variety of settings on the DialogSum dataset. We leverage insights from QualEval to precisely and consistently improve the proficiency of a 7 billion parameter Llama 2 model.
Consider a real-world scenario where certain sub-domains are more important. For example, in a toxicity detection dataset, you would expect sub-domains relating to racial abuse to have better accuracy than say politics. In such a case, a practitioner would want to identify if there are critical sub-domains where the model under-performs, and fix those issues. We consider this scenario for the Llama model where the practitioner is allowed to augment a certain number of instances of their choice to the training set based on the insights. This simulates the scenario where only a certain number of annotated examples can be obtained because of data paucity and cost reasons.
Assume there is a set of sub-domains that the model is underperforming in, as identified by QualEval. QualEval’s flexible LP solver finds a set of unsupervised examples belonging to these domains that are then annotated and added to the training instances. We compare with a baseline (Rand. Aug.) that randomly annotates and augments the same number of instances from the unsupervised store. We experiment with different sets of under-performing domains in Table 4.3 (pertaining to different rows) by fine-tuning the Llama 2 model on the two augmented dataset settings. Additional details are presented in Appendix A.2.
Across different sets of domains (rows), QualEval consistently and significantly increases the proficiency of the selected domains and the overall performance (Table 4.3). For instance, augmenting with the “Leisure”, “Food ordering”, and “Hospitality” domains (last row) leads to an improvement of , , and on ROUGE-L on the respective domains and an overall improvement of on ROUGE-L, when compared to Rand. Aug. Taken together, QualEval empowers practitioners to improve model proficiency with a high degree of precision and control.
5 Analysis
5.1 Skill usage calibration between ground truth and model answers
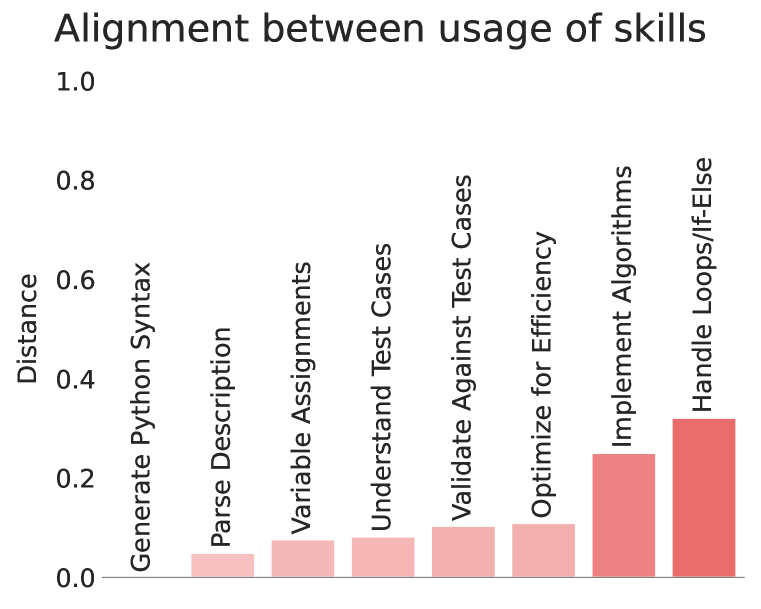
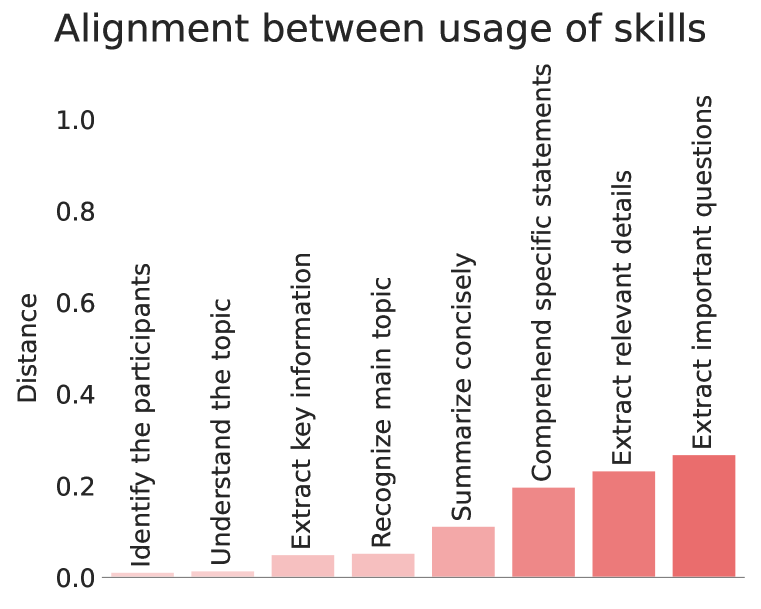
While proficiency metrics like pass@k, BLEU, and ROUGE are able to judge the proficiency of a model, they do not provide insights about skill usage calibration, i.e., whether the model is leveraging the expected subtasks when generating responses. Skill usage calibration is a unique lens to understand model performance, as practitioners can understand if the model generates answers with the expected and intended reasoning.
We quantify the calibration by first identifying the affinity of the ground truth and model generated answer to different sub-tasks discovered. We then measure the distance between the affinity scores. A smaller distance implies that the model generated answer is using sub-tasks similar to the ground truth answer, this exhibiting high skill usage calibration. We explain the exact distance metric used in Appendix A.3.
Figure 6 highlights the correlation between model generations and ground truth responses for the davinci-3 model on the MBPP and DialogSum datasets. A model practitioner can utilize this to understand what sub-tasks are not being used in an intended way, and perform an intervention to fix it. For example, on the MBPP dataset, the subtasks about implementing algorithms and handling loops and conditionals have low alignment.
5.2 Qualitative Samples
QualEval also allows model developers to extract prominent qualitative examples that can aid in the modeling lifecycle. Given that both in an academic and industry setting, understanding representative instances of ground truth and model generated answer is important, QualEval automates that process. It automatically yields revealing and interesting qualitative samples by identifing samples where the affinity scores of the ground truth response and model generation are not aligned.
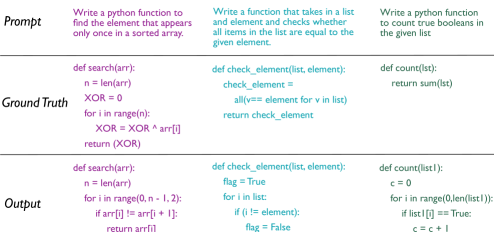
Figure 7 shows qualitative samples from the MBPP dataset generated by the davinci-3 (left and center) and davinci-2 (right) models. In the first example (left), the ground truth program uses XOR to test for uniqueness, while the generation uses a loop to check for uniqueness. In the second example (center), the ground truth program uses an in-built Python function to check equality whereas the model loops through the input to check the condition. Therefore, these examples further validate the finding in the prior section which suggests that the model is not calibrated for handling loops and conditionals.
Interestingly, the generated output in the final example (right) is a more robust solution than the ground truth. The ground truth solution assumes that the input is a list of booleans, while the model generation can accept any list with any data type. The test cases for this sample do not test for edge cases and therefore the ground truth program is technically correct.
6 Related Work
Model Debugging/Improvement
Prior work has attempted to address the problem of model debugging and improvement. Zhang et al. (2018) propose to evaluate different pairs of models on separate evaluation splits to understand model behavior. They also generate feature-level importance scores from “symptom” instances provided by humans. Graliński et al. (2019) introduce a model-agnostic method to find global features that “influence” the model evaluation score, allowing practitioners to exclude problematic features. Lertvittayakumjorn & Toni (2021) develop a framework to generate explanations for model predictions to allow humans to give feedback and debug models. Ribeiro et al. (2020) presents a framework to generate test cases at scale to evaluate model robustness, but constrains the test cases to be generated from simple templates and lexical transformations. Abid et al. (2022) propose a framework to generate counterfactual explanations for model errors to enable a better understanding of model behavior. Chen et al. (2023) introduce Self-Debugging, a method to enable a large language model to debug the predicted computer program through few-shot demonstrations. Some other works attempt to find error-prone slices of the data to improve the model He et al. (2021); Tornede et al. (2023); Paranjape et al. (2022). While these works provide limited insights into model behavior, they often require significant human intervention to understand model behavior and do not provide precise actionable insights for model improvement. Finally, these works are constrained to simple classification and regression tasks or single domains like code generation and do not provide a broad, task-agnostic, fully automated framework for model interpretation and improvement for real-world tasks.
Automatic Evaluation of Machine Learning Models
Automatic evaluation metrics, based on lexical overlap, such as BLEU Papineni et al. (2002), ROUGE Lin (2004), METEOR Banerjee & Lavie (2005) have helped researchers evaluate and compare models on a variety of language tasks. Recent work has proposed to use machine learning models to evaluate other machine learning models. Methods like Zhang et al. (2019); Fu et al. (2023); Zhou et al. (2023) use pre-trained language models to evaluate the quality of generated text and therefore rely more or semantics than lexical overlap. While these automated metrics have expedited research progress by eliminating human effort from evaluation, they have limited evaluation to a single scalar metric and therefore fail to provide a holistic and comprehensive understanding of model performance.
Issues with quantitative metrics
Multiple studies have pointed out that quantitative metrics are not sufficient to understand the behavior of LLMs and that they are not a good proxy for real-world performance Liu & Liu (2008); Novikova et al. (2017); Reiter & Belz (2009); Liu et al. (2016). While these studies advocate better quantitative metrics, the focus of our study is to propose a new framework based on qualitative evaluation.
7 Conclusion
We propose QualEval, a qualitative evaluation framework that provides a comprehensive way of evaluating models with a keen eye on model improvement. Rather than rely on scalar quantitative metrics that ignore the nuanced behavior of the model, QualEval augments quantitative metrics to test the model thoroughly and provides actionable insights through an interpretable dashboard to improve the model iteratively. We demonstrate that these insights are faithful and lead to up to 15% relative improvement. Our work is the first step towards building a data-scientist in a box.
Ethical Considerations
Our work provides a potent way to ensure that certain tasks performed by data scientists can be automated. While this reduces the burden on them, it is also possible that it reduces the need to have a very large group of them on a certain project. This might have workforce implications. But the intention of the study is to show that with the current LLMs, we can improve evaluation by making it comprehensive.
References
- Abid et al. (2022) Abubakar Abid, Mert Yuksekgonul, and James Zou. Meaningfully debugging model mistakes using conceptual counterfactual explanations. In Kamalika Chaudhuri, Stefanie Jegelka, Le Song, Csaba Szepesvari, Gang Niu, and Sivan Sabato (eds.), Proceedings of the 39th International Conference on Machine Learning, volume 162 of Proceedings of Machine Learning Research, pp. 66–88. PMLR, 17–23 Jul 2022. URL https://proceedings.mlr.press/v162/abid22a.html.
- Austin et al. (2021) Jacob Austin, Augustus Odena, Maxwell Nye, Maarten Bosma, Henryk Michalewski, David Dohan, Ellen Jiang, Carrie Cai, Michael Terry, Quoc Le, et al. Program synthesis with large language models. arXiv preprint arXiv:2108.07732, 2021.
- Banerjee & Lavie (2005) Satanjeev Banerjee and Alon Lavie. METEOR: An automatic metric for MT evaluation with improved correlation with human judgments. In Proceedings of the ACL Workshop on Intrinsic and Extrinsic Evaluation Measures for Machine Translation and/or Summarization, pp. 65–72, Ann Arbor, Michigan, June 2005. Association for Computational Linguistics. URL https://aclanthology.org/W05-0909.
- Chen et al. (2023) Xinyun Chen, Maxwell Lin, Nathanael Schärli, and Denny Zhou. Teaching large language models to self-debug. arXiv preprint arXiv:2304.05128, 2023.
- Chen et al. (2021) Yulong Chen, Yang Liu, Liang Chen, and Yue Zhang. Dialogsum: A real-life scenario dialogue summarization dataset. In Findings of the Association for Computational Linguistics: ACL-IJCNLP 2021, pp. 5062–5074, 2021.
- Fu et al. (2023) Jinlan Fu, See-Kiong Ng, Zhengbao Jiang, and Pengfei Liu. Gptscore: Evaluate as you desire. arXiv preprint arXiv:2302.04166, 2023.
- Graliński et al. (2019) Filip Graliński, Anna Wróblewska, Tomasz Stanisławek, Kamil Grabowski, and Tomasz Górecki. GEval: Tool for debugging NLP datasets and models. In Proceedings of the 2019 ACL Workshop BlackboxNLP: Analyzing and Interpreting Neural Networks for NLP, pp. 254–262, Florence, Italy, August 2019. Association for Computational Linguistics. doi: 10.18653/v1/W19-4826. URL https://aclanthology.org/W19-4826.
- He et al. (2021) Xin He, Kaiyong Zhao, and Xiaowen Chu. Automl: A survey of the state-of-the-art. Knowledge-Based Systems, 212:106622, 2021.
- Hendrycks et al. (2020) Dan Hendrycks, Collin Burns, Steven Basart, Andy Zou, Mantas Mazeika, Dawn Song, and Jacob Steinhardt. Measuring massive multitask language understanding. In International Conference on Learning Representations, 2020.
- Hu et al. (2021) Edward J Hu, Phillip Wallis, Zeyuan Allen-Zhu, Yuanzhi Li, Shean Wang, Lu Wang, Weizhu Chen, et al. Lora: Low-rank adaptation of large language models. In International Conference on Learning Representations, 2021.
- Lertvittayakumjorn & Toni (2021) Piyawat Lertvittayakumjorn and Francesca Toni. Explanation-based human debugging of NLP models: A survey. Transactions of the Association for Computational Linguistics, 9:1508–1528, 2021. doi: 10.1162/tacl˙a˙00440. URL https://aclanthology.org/2021.tacl-1.90.
- Lin (2004) Chin-Yew Lin. ROUGE: A package for automatic evaluation of summaries. In Text Summarization Branches Out, pp. 74–81, Barcelona, Spain, July 2004. Association for Computational Linguistics. URL https://aclanthology.org/W04-1013.
- Liu et al. (2016) Chia-Wei Liu, Ryan Lowe, Iulian V Serban, Michael Noseworthy, Laurent Charlin, and Joelle Pineau. How not to evaluate your dialogue system: An empirical study of unsupervised evaluation metrics for dialogue response generation. arXiv preprint arXiv:1603.08023, 2016.
- Liu & Liu (2008) Feifan Liu and Yang Liu. Correlation between rouge and human evaluation of extractive meeting summaries. In Proceedings of ACL-08: HLT, short papers, pp. 201–204, 2008.
- Novikova et al. (2017) Jekaterina Novikova, Ondrej Dusek, Amanda Cercas Curry, and Verena Rieser. Why we need new evaluation metrics for NLG. In Martha Palmer, Rebecca Hwa, and Sebastian Riedel (eds.), Proceedings of the 2017 Conference on Empirical Methods in Natural Language Processing, EMNLP 2017, Copenhagen, Denmark, September 9-11, 2017, pp. 2241–2252. Association for Computational Linguistics, 2017. doi: 10.18653/v1/d17-1238. URL https://doi.org/10.18653/v1/d17-1238.
- OpenAI (2023) OpenAI. Introducing chatgpt, 2023. URL https://openai.com/blog/chatgpt.
- Pal et al. (2022) Ankit Pal, Logesh Kumar Umapathi, and Malaikannan Sankarasubbu. Medmcqa: A large-scale multi-subject multi-choice dataset for medical domain question answering. In Gerardo Flores, George H Chen, Tom Pollard, Joyce C Ho, and Tristan Naumann (eds.), Proceedings of the Conference on Health, Inference, and Learning, volume 174 of Proceedings of Machine Learning Research, pp. 248–260. PMLR, 07–08 Apr 2022. URL https://proceedings.mlr.press/v174/pal22a.html.
- Papineni et al. (2002) Kishore Papineni, Salim Roukos, Todd Ward, and Wei-Jing Zhu. Bleu: a method for automatic evaluation of machine translation. In Proceedings of the 40th Annual Meeting of the Association for Computational Linguistics, pp. 311–318, Philadelphia, Pennsylvania, USA, July 2002. Association for Computational Linguistics. doi: 10.3115/1073083.1073135. URL https://aclanthology.org/P02-1040.
- Paranjape et al. (2022) Bhargavi Paranjape, Pradeep Dasigi, Vivek Srikumar, Luke Zettlemoyer, and Hannaneh Hajishirzi. Agro: Adversarial discovery of error-prone groups for robust optimization. arXiv preprint arXiv:2212.00921, 2022.
- Reiter & Belz (2009) Ehud Reiter and Anja Belz. An investigation into the validity of some metrics for automatically evaluating natural language generation systems. Computational Linguistics, 35(4):529–558, 2009.
- Ribeiro et al. (2020) Marco Tulio Ribeiro, Tongshuang Wu, Carlos Guestrin, and Sameer Singh. Beyond accuracy: Behavioral testing of nlp models with checklist. In Proceedings of the 58th Annual Meeting of the Association for Computational Linguistics, pp. 4902–4912, 2020.
- Tornede et al. (2023) Alexander Tornede, Difan Deng, Theresa Eimer, Joseph Giovanelli, Aditya Mohan, Tim Ruhkopf, Sarah Segel, Daphne Theodorakopoulos, Tanja Tornede, Henning Wachsmuth, et al. Automl in the age of large language models: Current challenges, future opportunities and risks. arXiv preprint arXiv:2306.08107, 2023.
- Touvron et al. (2023) Hugo Touvron, Louis Martin, Kevin Stone, Peter Albert, Amjad Almahairi, Yasmine Babaei, Nikolay Bashlykov, Soumya Batra, Prajjwal Bhargava, Shruti Bhosale, et al. Llama 2: Open foundation and fine-tuned chat models. arXiv preprint arXiv:2307.09288, 2023.
- Zhang et al. (2018) Jiawei Zhang, Yang Wang, Piero Molino, Lezhi Li, and David S Ebert. Manifold: A model-agnostic framework for interpretation and diagnosis of machine learning models. IEEE transactions on visualization and computer graphics, 25(1):364–373, 2018.
- Zhang et al. (2019) Tianyi Zhang, Varsha Kishore, Felix Wu, Kilian Q Weinberger, and Yoav Artzi. Bertscore: Evaluating text generation with bert. In International Conference on Learning Representations, 2019.
- Zhou et al. (2023) Shuyan Zhou, Uri Alon, Sumit Agarwal, and Graham Neubig. Codebertscore: Evaluating code generation with pretrained models of code. arXiv preprint arXiv:2302.05527, 2023.
Appendix A Appendix
A.1 Prompts used in QualEval
A.2 Model improvement
We first leverage QualEval’s flexible LP solver to generate domain assignments for training samples. We then choose a base set of training samples and leverage the domain assignments to augment the training set by adding additional samples from the training set from up to different domains. Therefore we randomly sample samples from the selected domains, where is the number of selected domains (). We experiment with different sets of domains in Table 4.3. We then train the off-the-shelf Llama 2 model on these augmented datasets and present both the ROUGE-L scores of the model on the selected domains (refer to “QualEval Aug.” columns) and the overall improvement of the ROUGE-L score of the model on the evaluation set (refer to “ – Overall” column). For the baseline, we use the same training set but randomly augment the training set with samples (refer to “No Aug.” columns).
A.3 Distance metric for skill usage calibration
We measure the distance between the affinity scores by measuring the fraction of samples where the difference between the affinity scores of the generation and the ground truth is greater than 1.
A.4 Example natural language insight
A.5 Dashboards