Laser-induced fluorescence detection of the 4d5p transition of Kr II in a hollow cathode discharge
Abstract
Electric propulsion requires exhaustive ground test campaigns to obtain an accurate characterization of the propulsion devices, or thrusters, used by the spacecraft. Among the many plasma parameters, accurately measured during the tests, that of the ion velocity is key, and can be measured using non-intrusive tools such as Laser-Induced Fluorescence (LIF) diagnostics. The ion velocity is inferred by Doppler shift measurements that presupposes a precise and accurate knowledge of the wavelength of excitation of the ions at rest. Today electric propulsion is moving towards the use of Krypton as a propellant, due to the dramatic increase in cost of the more advantageous Xenon gas propellant, commonly used until now. In this work the 4d5p transition of Kr II is used for LIF diagnostic in hollow cathode discharge.
I Introduction
Traditionally, Xenon has been the favorite propellant gas for electric propulsion applications as it provides an optimal compromise between performance and ease of handling. Although Xenon has numerous technical advantages, its relative scarcity and resulting increase in price are now posing considerable budgetary constraints for its use, especially for deep space exploration Tirila_2023 ; Nakles_2011 . Therefore, a number of alternative propellants are being examined intensively for use in electrostatic spacecraft propulsion thrusters Duchemin_2009 . A more economic alternative to Xe needs to be identified, while maintaining thruster performance levels, and without overlooking performance optimization aspects. Among various types of electric thrusters, the Hall Effect Thruster (HET) is one of the most widely used owing to its simple structure, high reliability, and long life Mazouffre_2016 ; Levchenko_2018 .
Like Xenon, Krypton is a noble gas and can be integrated easily into existing spacecraft propellant management systems with minimal modifications. As this gas has similar ionization potential it should not dramatically affect thruster efficiency, and the lower atomic mass could possibly produce a 25% increase in specific impulse due to the increased propellant exit velocity of lighter ions Linnell_2007 ; Hargus_2012 . The higher specific impulse also provides advantages in space missions such as maintaining spacecraft orbit Kurzyna_2018 ; Lim2019 . A lower anode efficiency of approximately 5-15 is expected with respect to Xenon propellant at the same operating conditions Hargus_2012 ; Kurzyna_2018 ; Jorns_2022 . Krypton is also about ten times more common in the atmosphere than Xenon, and hence less expensive. Currently, Krypton is the most widely-used alternative propellant in HET both for space applications (for example the Starlink constellation), as well as ground testing Tirila_2023 . Table 1 summarizes the properties of Xenon and Krypton specifically relevant to electrostatic spacecraft propulsion.
| Property | Xe | Kr |
|---|---|---|
| Atomic mass | 131.293 amu | 83.798 amu |
| First ionization energy | 12.1 eV | 14.0 eV |
| Atmospheric | ||
| concentration | 87 ppb | 1000 ppb |
| Stable isotopes | 9 | 6 |
| Odd isotopes | 2 | 1 |
| Critical pressure | 57.65 atm | 54.3 atm |
| Critical temperature | 290 K | 209 K |
| Boiling point (1 atm) | 161 K | 120 K |
The characterization and qualification of ion thrusters require extensive, long-duration test campaigns in space simulators. A valuable tool for characterizing thruster performance and comparing this with already-developed models is Light-Induced Fluorescence (LIF) spectroscopy, which measures the velocity of ions employing the Doppler effect. Many excellent works on LIF characterization of ion thrusters are available in the literature, but only few of them consider thrusters operating with Kr propellant. Advantageous transitions for LIF diagnostics are characterized by large intensity and narrow intrinsic width (transitions involving long-living levels). The Xe ion transition at 834 nm (5d6p) is used for LIF diagnostics by the majority of the electric propulsion research community. As to Kr ion, such favoured transitions are at 820 nm (the 4d5p transition) Lejeune_2012 and at 729 nm (the 4d5p transition) Hargus_2011 ; Buorgeois_2011 . An accurate knowledge of the features of the transition used for LIF spectroscopy is required for better determination of the ion velocity. The first task to solve is to find a suitable source of Kr ions with null drift velocity. One possible Kr+ source is a hollow cathode plasma source, as the one used in this work, operated normally as a neutralizer in the electric propulsion.
LIF diagnostic has been previously applied for characterization of ions emitted from a hollow cathode in the plume region (see for example Potrivitu_2019 ; Dodson_2018 and reference therein). It has been shown Potrivitu_2019 that when operating in the so-called diode configuration (with an external anode that closes the electrical circuit) the ion velocity, measured starting from the exit plane of the cathode to the near field, can be modified. Axial velocity components with opposite signs have been measured. It has been shown that the anode acts as a physical boundary for the cathode plasma discharge and drives the discharge current balance through its collection surface. The electric field topology in consequence can be influenced in order to fulfill stable discharge condition. Moreover, the shape of the anode modifies the "view factor" from the cathode orifice, which influences the electron and ion fluxes, and hence the plasma properties in the cathode-anode gap. Similar results have been observed in the exit plane of hollow cathode assemblies developed at the University of Michigan Dodson_2018 , where it has been shown that the presence of high-energy ions is consistent with a potential-hill model. It should be pointed out that the axial velocity drift value strongly depends on many parameters among which the hollow cathode design and operational power, the anode shape and the distance to it, the cathode regime of operation, etc.
The air wavelength of the Kr II 4d5p transition has been previously measured to be 728.982 nm with an accuracy of 0.7 pm (about 400 MHz) Dzierżęga_2001 ; Saloman_2007 . Such accuracy would introduce an error of about 300 m/s in the determination of the Kr ion velocity. In this work an attempt is performed to better determine the vacuum/air wavelength of the Kr II transition 5d5p. For this purpose, the LIF spectroscopy is applied a hollow cathode discharge, namely behind the keeper plate in the plasma region next to the cathode orifice. Further investigation is necessary to verify whether the region selected is free of ion velocity drift.
II Set-up
The LIF is a particularly powerful optical-diagnostic tool providing valuable, species selective information with excellent spatial resolution. A highly coherent, single-frequency, laser source that can be tuned over a broad spectral interval permits to establish a versatile laser-plasma interaction tool. Given its remote detection nature, LIF diagnostic is minimally invasive. The plasma is interrogated locally with an electromagnetic tool: all the optical devices used to illuminate the plasma and to detect its fluorescence are placed far from the interaction point, can have dimensions in the mm scale, and the interaction volume can have sizes as small as few millimeters. The ion velocity distribution function (IVDF) can be measured along different directions with excellent spatial and time resolution. The measurement procedure is based on detecting the intensity of the fluorescence emitted by the plasma in the interaction point, in response to the illumination by means of narrow-band radiation characterized by an accurately and precisely known frequency that can be scanned within an opportune interval.
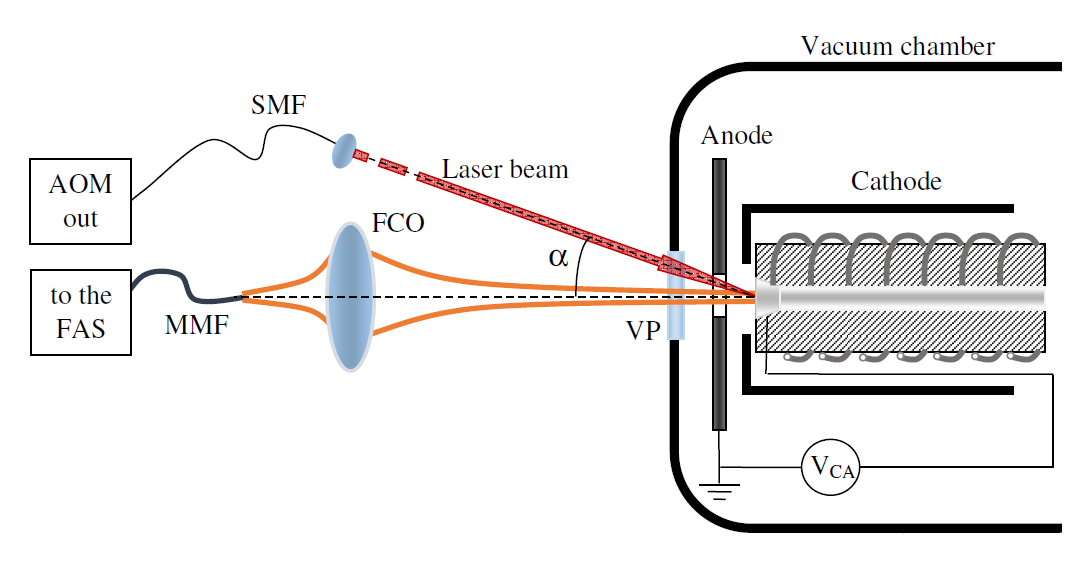
II.1 The test facility
The measurements shown in this work are conducted in a non-magnetic stainless steel vacuum chamber. Vacuum is obtained by a single stage cryogenic panel. The base pressure of the vacuum chamber is as low as mbar and increases up to about mbar during the cathode operation. The hollow cathode is operated in diode regime (see Fig.1) at currents of about 3 A with an anode positioned 20 mm away from it. The measurements are performed positioning the LIF equipment outside the vacuum chamber illuminating the detection region and detecting the emitted fluorescence through an optical access (view port).
II.2 The LIF set-up
The light source used to excite the 4d5p Kr II transition is a tunable diode laser in a primary-and-secondary configuration (the primary laser is an extended-cavity diode laser and the secondary laser is a tapered amplifier) with a linewidth better than 1 MHz.
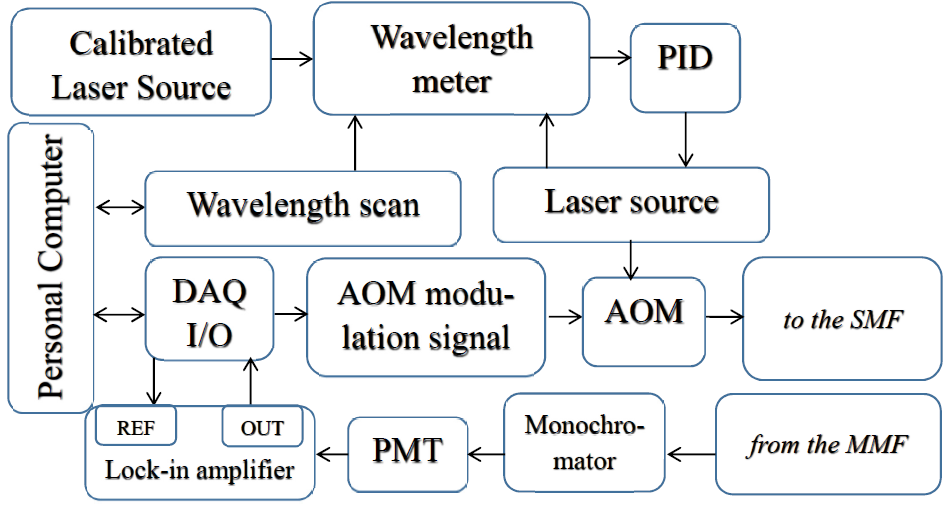
A schematic of the LIF set-up is given in Fig.2 (a more detailed description can be found in Refs.Dancheva_2022 ; Dancheva_2023 ). The laser wavelength is locked and scanned with the help of a high accuracy (MHz) wavelength meter and a proportional-integral-derivative (PID) controller. The wavelength meter is calibrated periodically using a diode laser that is frequency stabilized to the absorption profile of the Caesium D2 line and typically drifts below 2 MHz/day.
The detection region is near to the cathode exit plane at the cathode tip center, where the laser beam and the fluorescence collection objective (FCO) view regions are crossing (see Fig.1). The laser beam is aligned at a small angle with respect to the normal to cathode exit plane. The laser intensity is amplitude modulated at 3 kHz by a fibre-coupled, acousto-optical modulator (AOM). The AOM output is coupled to a single-mode optical fiber (see Fig.2) that provides a laser beam with waist diameter of 0.3 mm using a fiber collimator positioned at 0.6 m away from the cathode.
The view spot of the FCO is about 2.5 mm in diameter at the region of detection. The fluorescence signal at air wavelength of 473.9 nm (corresponding to the transition 5p5s) is selected using a grating monochromator. Subsequently, the signal at 473.9 nm is detected using a photo-multiplier tube (PMT). The LIF signal demodulation is performed by a lock-in amplifier, whose input is the PMT current, converted to voltage by a trans-impedance amplifier. The poor signal-to-noise ratio of the LIF spectra is counteracted by using a long lock-in integration time, implying a slow scan of the laser wavelength and averaging over many measurements. Indeed, the lock-in amplifier integration time is 300 ms, which with a third order low-pass filter at the output determines a bandwidth of about 0.3 Hz .
The laser vacuum wavelength is locked and scanned by the wavelength meter using a PID control (the schematics of the set-up are shown in Fig.2). A scan of 20 pm (about 11 GHz) is performed backwards and forwards using the wavelength meter in an overall time of 100 s. The bidirectional scanning permits to account for possible shifts of the spectral line due to integration time.
The wavelength meter used in this work is temperature and pressure stabilized. A variation less than 50 MHz is expected for temperature variations of about 10∘C, which are well compensated for rates lower than that is higher than the typical temperature excursion in the laboratory.
III The Kr II 4d4D5p4P line.
In this analysis the Kr isotopes with concentration higher than 0.3 are considered and listed in Table 2. A theoretical line-shape is calculated and used to fit the experimental data.
| Relative shift | ||
| Isotope | with respect to | Abundance |
| 84Kr (MHz) | () | |
| 78 | 1185.7 | 0.35 |
| 80 | 768.0 | 2.27 |
| 82 | 372.6 | 11.56 |
| 83 | 175.0 | 11.55 |
| 84 | 0 | 56.9 |
| 86 | -365.2 | 17.37 |
| Electronic | A coefficient | B coefficient |
| state | (MHz) | (MHz) |
| 4d4D7/2 | -43.513 | -294.921 |
| 5p4P5/2 | -167.2 | +91 |
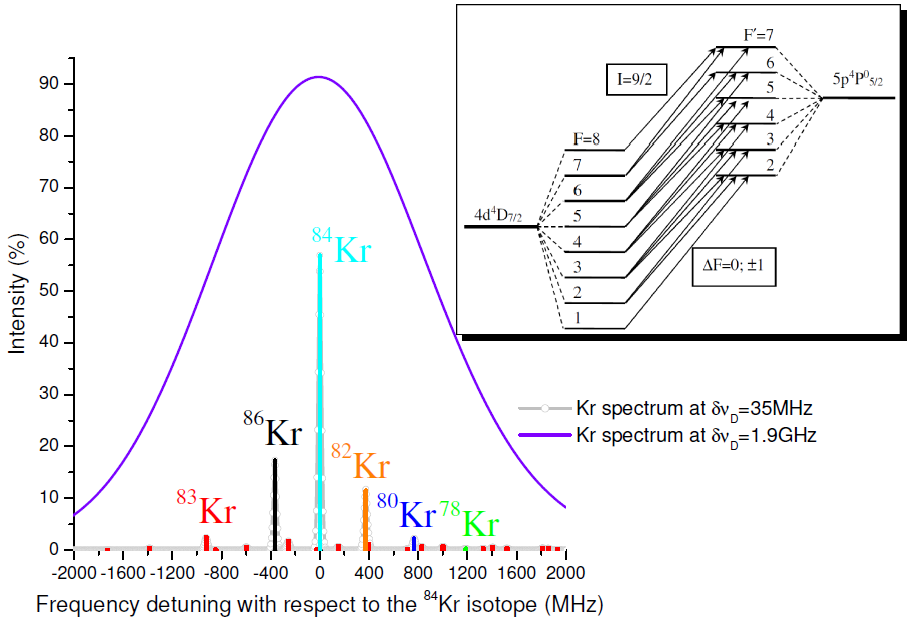
Only one isotope (83Kr) has a non zero nuclear spin (I=9/2) and thus its hyperfine structure should be included in the line-shape analysis. The hyperfine constants of both the states of the 83Kr II transition have been measured previously Scholl_1986 ; Schuessler_1992 and are given in Table 2.
| Relative | Relative | |||
| shift | shift | Intensity | ||
| F | F′ | (with respect | (with respect | () |
| to JJ′) (MHz) | to 84Kr) (MHz) | |||
| 8 | 7 | -1099.2 | -924.2 | 0.21 |
| 7 | 7 | -1559.6 | -1384.6 | 0.034 |
| 7 | 6 | -431.7 | -256.7 | 0.15 |
| 6 | 7 | -1901.1 | -1726.1 | 0.0031 |
| 6 | 6 | -773.2 | -598.2 | 0.055 |
| 6 | 5 | 223.2 | 398.2 | 0.10 |
| 5 | 6 | -1020.2 | -845.2 | 0.0083 |
| 5 | 5 | -23.8 | 151.2 | 0.064 |
| 5 | 4 | 827.3 | 1002.3 | 0.065 |
| 4 | 5 | -197.5 | -22.5 | 0.015 |
| 4 | 4 | 653.7 | 828.7 | 0.063 |
| 3 | 4 | 535.8 | 710.8 | 0.022 |
| 3 | 3 | 1230.4 | 1405.4 | 0.052 |
| 3 | 2 | 1759.3 | 1934.3 | 0.013 |
| 2 | 3 | 1154.3 | 1329.3 | 0.03 |
| 2 | 2 | 1683.2 | 1858.2 | 0.033 |
| 1 | 2 | 1638.3 | 1813.3 | 0.038 |
As can be seen from Fig.3 the lower 83Kr II state splits in 8 hyperfine sublevels and the upper one in 6 with total angular momenta as denoted on the energy schematic. The electric-dipole allowed 18 transitions are shown in the plot. A detailed description about the hyperfine structure and the relevant selection rules can be found elsewhere Arimondo_1977 ; Hargus_2010 ; Hargus_2001 . The spectrum of the 4d5p transition at Doppler linewidth of 35 MHz (to highlight the line structure) and 1900 MHz (to show the line-shape at ion temperatures near to the measured one) are reported in Fig.3.
IV Results
Fig.4 shows the spectrum of the 4d5p recorded when scanning the laser frequency in both directions. Each trace is obtained as an average over 36 laser wavelength scans and the cathode is kept at constant operational parameters during all the measurements.
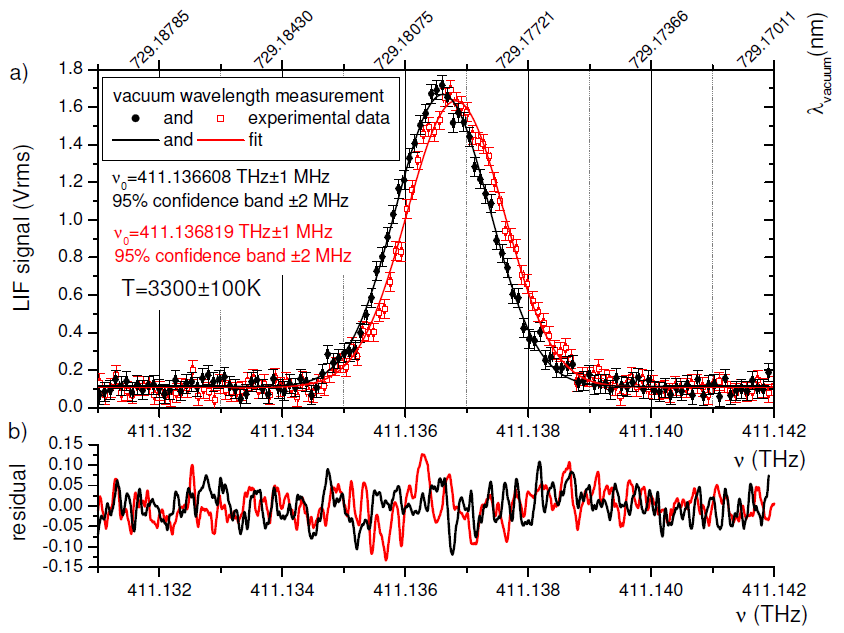
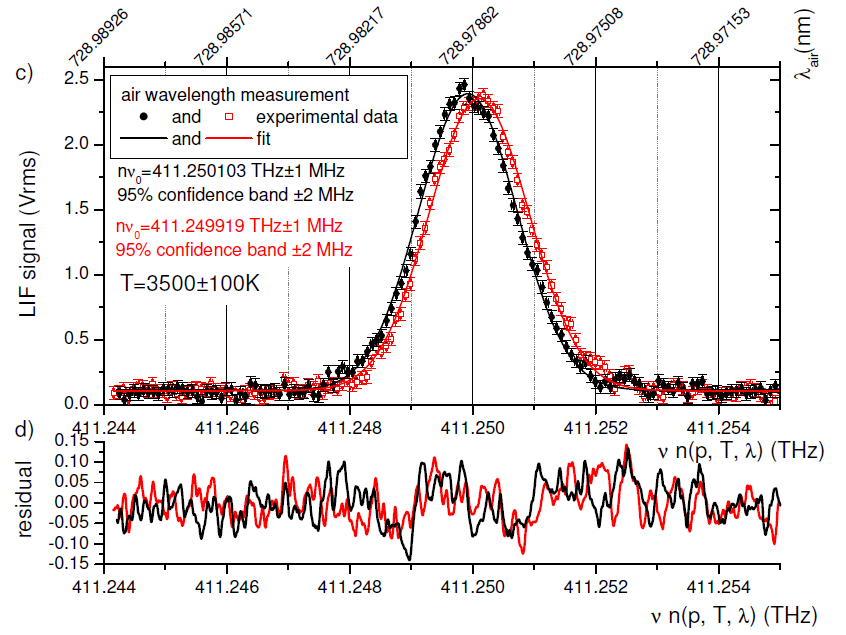
The spectrum is registered measuring both the vacuum and the air wavelength (at standard dry air: T=15∘C and p=760 mmHg). The experimental data are fitted using an orthogonal distance regression algorithm Pallavi_2022 considering the wavelength meter accuracy and the LIF signal noise outside the spectral line as errors.
The fitting function is given by Demtroeder_2013 :
| (1) |
where the is the relative shift for each spectral component (given in Table 2 and 3), are the relative intensities (=), is the Boltzmann constant, is the ion temperature, is the ion mass, is a scaling factor, is the speed of light, and accounts for possible data offset (see Fig.4). Among the four fitting parameters (, , , and ) the line central frequency and the ion temperature are of interest. The residuals, given in Fig.4, are indicative for the fit goodness.
Figure 4 shows the measured when scanning the laser wavelength in both directions. A shift, occurring due to the finite lock-in settling time of about 100 MHz is estimated from the fitted values. As this instrumental shift occurs symmetrically in both cases, the exact value of the has to be estimated as the average of the two results.
The value is temperature dependent through the hyperfine and isotope structure contribution. A negative systematic error in the determination of is introduced at different Doppler widths (ion temperatures). The calculated shift is given in Fig.5.
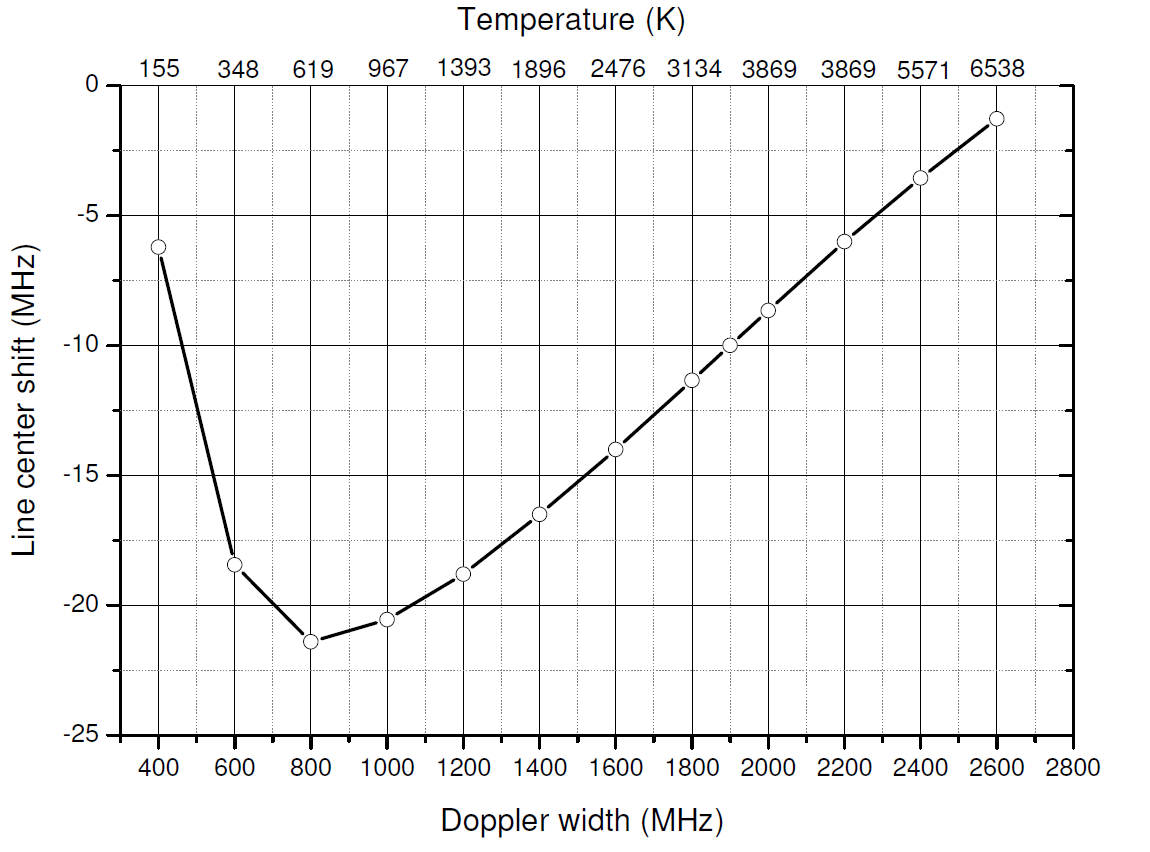
Considering a coverage factor of 2, for a confidence level of approximately 95, the measured central wavelength and frequency are given in Table 4. Taking into account a Doppler width of 1900 MHz the corrected values are also provided in Table 4.
| Condition: | (nm) | Uncertainty (fm) |
| vacuum | 729.179487 | 34 |
| air | 728.978602 | 34 |
| Condition: | (THz) | Uncertainty (MHz) |
| vacuum/air | 411.136714 | 20 |
| Condition: | (nm) | Uncertainty(fm) |
| vacuum (corrected for | ||
| HFS and isotope shift) | 729.179504 | 34 |
| air (corrected for | ||
| HFS and isotope shifts) | 728.978619 | 34 |
The fitted ion temperature results in the range from 3300 K to 3500 K and can be related to the cathode wall temperature, which is about 1.5 times lower.
V Conclusions
LIF diagnostic is performed in the plasma of a hollow cathode using the the Kr II 4d5p transition. By performing long-lasting measurements an improved signal to noise is obtained as to make the residual noise contribute negligibly to the error of the measurements. The theoretical spectrum of the transition is calculated and used to fit the experimental data. Both the frequency and the vacuum/air wavelength centers are given. Further investigation is necessary to verify whether a null drift velocity can be expected in the orifice region of a hollow cathode operating in diode mode. In fact, work is in progress to evaluate a possible non-zero average Kr ion velocity by applying a counter-propagating laser excitation scheme in a proper Kr ion source.
The systematic error due to the presence of hyperfine and isotope structure in determination of the line centre is calculated and taken into account as well as its variation with the ion temperature.
VI Acknowledgements
This work has received funding from the European Union’s Horizon 2020 research and innovation programme under grant agreement No 101004140. The authors would like to thank Patricia Nugent for revising the English of the manuscript.
References
References
- (1) V.-G. Tirila, A. Demairé, and C. N. Ryan, “Review of alternative propellants in Hall thrusters,” Acta Astronautica, vol. 212, pp. 284–306, 2023.
- (2) M. R. Nakles, W. A. Hargus Jr., J. J. Delgadoz, and R. L. Coreyx, “A performance comparison of Xenon and Krypton propellant on an SPT-100 Hall thruster,” International Electric Propulsion Conference, Weisbaden, Germany, IEPC-2011-003, 2011.
- (3) O. Duchemin, D. Valentian, and N. Cornu, “Cryostorage of propellants for electric propulsion,” 45th AIAA/ASME/SAE/ASEE Joint Propulsion Conference & Exhibit, AIAA 2009-4912, 2009.
- (4) S.Mazouffre, “Electric propulsion for satellites and spacecraft: established technologies and novel approaches,” Plasma Sources Sci. Technol., vol. 25, p. 033002, 2016.
- (5) I. Levchenko, K. Bazaka, Y. Ding, Y. Raitses, S. Mazouffre, T. Henning, P. J. Klar, S. Shinohara, J. Schein, L. Garrigues, M. Kim, D. Lev, F. Taccogna, R. W. Boswell, C. Charles, H. Koizumi, Y. Shen, C. Scharlemann, M. Keidar, and S. Xu, “Space micropropulsion systems for Cubesats and small satellites: From proximate targets to furthermost frontiers,” Applied Physics Reviews, vol. 5, p. 011104, 02 2018.
- (6) J. A. Linnell, “An evaluation of Krypton propellant in Hall thrusters,” Ph. D. Thesis, University of Michigan, 2007.
- (7) W. A. Hargus Jr., G. M. Azarnia, and M. R. Nakles, “Kr II laser-induced fluorescence for measuring plasma acceleration,” Review of Scientific Instruments, vol. 83, p. 103111, 10 2012.
- (8) J. Kurzyna, M. Jakubczak, A. Szelecka, and K. Dannenmayer, “Performance tests of IPPLM’s Krypton Hall thruster,” Laser and Particle Beams, vol. 36, pp. 105–114, 2018.
- (9) J. Lim, I. Levchenko, S. Huang, L. Xu, R. Sim, J. Yee, G. Potrivitu, Y. Sun, K. Bazaka, X. Wen, et al., “Plasma parameters and discharge characteristics of lab-based Krypton-propelled miniaturized Hall thruster,” Plasma Sources Science and Technology, vol. 28, no. 6, p. 064003, 2019.
- (10) L.Su, R.Marks, and B.Jorns, “Investigation into the efficiency gap between Krypton and Xenon operation on a magnetically shielded Hall thruster,” International Electric Propulsion Conference 2022, June 19-23, 2022, Boston, MA, 2022.
- (11) A. Lejeune, G. Bourgeois, and S. Mazouffre, “Kr II and Xe II axial velocity distribution functions in a cross-field ion source,” Physics of Plasmas, vol. 19, no. 7, p. 073501, 2012.
- (12) W. Hargus JR., G. Azarnia, and M. Nakles, “Demonstration of laser-induced fluorescence on a Krypton Hall effect thruster,” IEPC - Electric Rocket Society, 2011-018, 2011.
- (13) G. Bourgeois, A. Lejune, and S. Mazouffre, “Ion velocity evolution with channel width, magnetic topology and propellant in a 200 W Hall thruster,” IEPC - Electric Rocket Society, 2011-123, 2010.
- (14) G.-C. Potrivitu, S. Mazouffre, L. Grimaud, and R. Joussot, “Anode geometry influence on LaB6 cathode discharge characteristics,” Physics of Plasmas, vol. 26, p. 113506, 11 2019.
- (15) C. A. Dodson, D. Perez-Grande, B. A. Jorns, D. M. Goebel, and R. E. Wirz, “Ion heating measurements on the centerline of a high-current hollow cathode plume,” Journal of Propulsion and Power, vol. 34, no. 5, pp. 1225–1234, 2018.
- (16) K. Dzierżęga, U. Griesmann, G. Nave, and Łukasz Bratasz, “Absolute transition rates for transitions from 5p levels in Kr II,” Physica Scripta, vol. 63, no. 3, p. 209, 2001.
- (17) E. B. Saloman, “Energy Levels and Observed Spectral Lines of Krypton, Kr I through Kr XXXVI,” Journal of Physical and Chemical Reference Data, vol. 36, pp. 215–386, 02 2007.
- (18) Y. Dancheva, D. Pagano, S. Scaranzin, R. Mercatelli, M. Presi, F. Scortecci, and G. Castellini, “Non-intrusive tools for electric propulsion diagnostics,” CEAS Space Journal, vol. 14, pp. 19–30, 2022.
- (19) Y. Dancheva, P. Coniglio, M. Da Valle, and F. Scortecci, “Ion dynamic characterization using phase-resolved laser-induced fluorescence spectroscopy in a Hall effect thruster,” Review of Scientific Instruments, vol. 94, p. 073503, 2023.
- (20) T. J. Scholl, T. D. Gaily, R. A. Holt, and S. D. Rosner, “Fast-ion-beam laser and laser-rf double-resonance measurements of hyperfine structure in 83KrII,” Phys. Rev. A, vol. 33, pp. 2396–2400, 1986.
- (21) H. A. Schuessler, A. Alousi, M. Idrees, Y. F. Li, F. Buchinger, R. M. Evans, and C. F. Fischer, “Isotope shifts and hyperfine-structure-splitting constants of the 4d-5p transition of Kr II at =729 nm,” Phys. Rev. A, vol. 45, pp. 6459–6467, 1992.
- (22) E. Arimondo, M. Inguscio, and P. Violino, “Experimental determinations of the hyperfine structure in the alkali atoms,” Rev. Mod. Phys., vol. 49, pp. 31–75, 1977.
- (23) W. Hargus, “A preliminary study of Krypton laser-induced fluorescence,” 46th AIAA/ASME/SAE/ASEE Joint Propulsion Conference and Exhibit, 25-28 July 2010, Nashvill TN, 2010-6524, 2010.
- (24) W.A.Hargus and M.A.Cappelli, “Laser-induced fluorescence measurements of velocity within a Hall discharge,” Appl. Phys. B, vol. 72, pp. 961–9, 2001.
- (25) P. Pallavi, S. Joshi, D. Singh, M. Kaur, and H. Lee, “Comprehensive review of orthogonal regression and its applications in different domains,” Archives of Computational Methods in Engineering, vol. 29, p. 4027–4047, 2022.
- (26) W. Demtröder and M. Roach, Laser Spectroscopy: Basic Concepts and Instrumentation. Advanced Texts in Physics, Springer Berlin Heidelberg, 2013.