Phase and contrast moiré signatures in two-dimensional cone beam interferometry
Abstract
Neutron interferometry has played a distinctive role in fundamental science and characterization of materials. Moiré neutron interferometers are candidate next-generation instruments: they offer microscopy-like magnification of the signal, enabling direct camera recording of interference patterns across the full neutron wavelength spectrum. Here we demonstrate the extension of phase-grating moiré interferometry to two-dimensional geometries. Our fork-dislocation phase gratings reveal phase singularities in the moiré pattern, and we explore orthogonal moiré patterns with two-dimensional phase-gratings. Our measurements of phase topologies and gravitationally induced phase shifts are in good agreement with theory. These techniques can be implemented in existing neutron instruments to advance interferometric analyses of emerging materials and precision measurements of fundamental constants.
pacs:
Valid PACS appear hereI Introduction
Perfect-crystal neutron interferometry possesses a prestigious record of high impact fundamental science experiments such as the observation of gravitationally induced quantum interference Colella et al. (1975), 4 symmetry of spinor rotation Rauch et al. (1975), neutron triply-entangled GHZ states and quantum discord Hasegawa et al. (2010); Wood et al. (2014), matter-wave orbital angular momentum Clark et al. (2015); Sarenac et al. (2016), and the probing of dark energy and fifth forces Lemmel et al. (2015); Li et al. (2016). This is in-part due to the unique properties of the neutron such as it’s electrical neutrality, relatively large mass, and angstrom sized wavelengths Klein and Werner (1983); Abele (2008); Willis and Carlile (2017). Such properties also make the neutron a convenient and indispensable probe of modern materials as they are capable of characterizing bulk properties and nanometer-sized spin textures Fuhrman et al. (2015); Qian et al. (2018); Dewhurst et al. (2015); Henderson et al. (2023).
A recent focus in neutron interferometry has been in grating-based setups that circumvent the stringent environmental isolating requirements associated with perfect-crystal neutron interferometry Rauch and Werner (2015); Saggu et al. (2016) and are capable of working in the full field of the neutron beam Clauser and Li (1994); Pfeiffer et al. (2006); Cronin and McMorran (2006); David et al. (2002); Cronin et al. (2009); Chapman et al. (1995); Busi et al. (2023). The backbone of these setups is the near-field phenomena of self-imaging known as the “Talbot effect” Talbot (1836). Further developments introduced phase-grating moiré interferometers (PGMIs) that are composed of exclusively phase-gratings and manifest interference patterns that are directly detectable via typical neutron camera Miao et al. (2016); Pushin et al. (2017); Hussey et al. (2016); Sarenac et al. (2018); Brooks et al. (2018, 2017).
Here we take the next step in the development of the neutron PGMI toolbox by expanding to two-dimensional (2D) moiré interference. We explore the role of phase singularities that materials possessing helical structures are expected to induce in the moiré pattern and we describe the additional metrics for quantification. Furthermore, we also demonstrate 2D moiré interference with orthogonal directionality. The addition of an interference pattern serving as in-situ reference enables novel approaches for high precision measurements of fundamental forces such as the Newtonian constant of gravitation.
II Methods
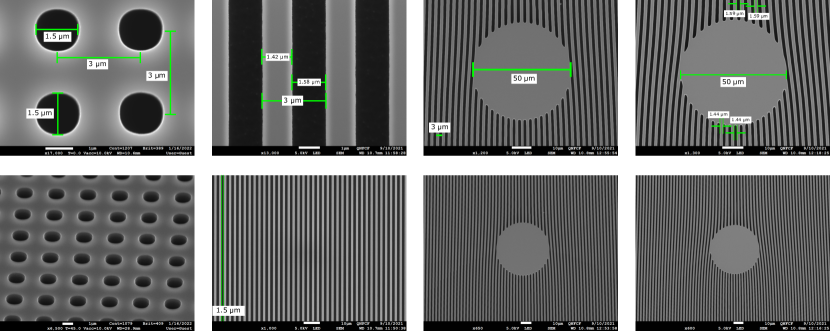
We fabricated four types of phase-gratings: 2D phase-gratings, and fork-dislocation phase-gratings with topological charge of . Note that the is a typical 1D phase-grating. The detailed nanofabrication procedure and scanning electron microscopy (SEM) images of all four cases can be found in Appendix A. All phase-gratings were fabricated out of silicon and had a target period of and height of . The height of was chosen so that the grating imparts an optimal phase shift for Å neutrons.
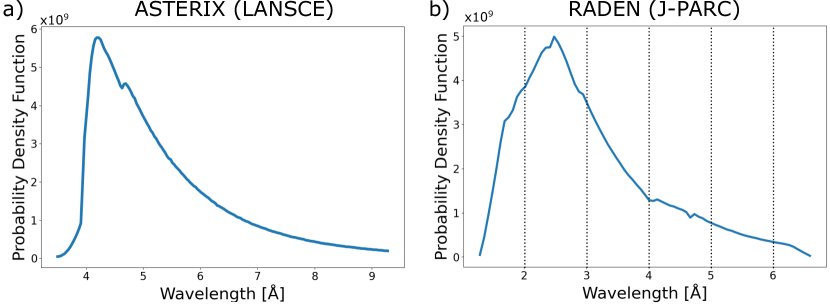
The experiments with fork-dislocation phase-gratings were performed at the ASTERIX facility at the Los Alamos Neutron Science Center (LANSCE) Nelson et al. (2018). The wavelength distribution is shown in Appendix B. The slit was by in size and the distance from the slit to the first phase-grating (camera) was . The camera pixel size was by . The data acquisition time was min at each grating separation distance. A detector normalization image was obtained by summing phase stepping measurements.
The experiments with the 2D phase-gratings were performed at the the RADEN facility at the Japan Proton Accelerator Research Complex (J-PARC) Shinohara et al. (2020). The wavelength distribution is shown in Appendix B. The 2D slit was composed of a sequence of two perpendicular 1D slits each made by bringing two cadmium pieces together with the target gap of . Two experimental setups were used, one for polychromatic measurements and the other with a neutron camera with lower dark counts () for time-of-flight resolved measurements. For the first configuration the distance from the slit to the first phase-grating (camera) was , the camera pixel size was by , and the image acquisition time was 4 h at each grating separation distance. For the second configuration the distance from the slit to the first phase-grating (camera) was , the camera pixel size was by , and the data acquisition time was 5 h. For each setup configuration a detector normalization image was obtained from a measurement at a setup configuration that results in zero contrast. Furthermore, due to the presence of significant salt and pepper noise a median filter of 5 x 5 pixels was applied to the final images.
III Results and Discussion
III.1 Fork-dislocation phase-gratings
Here we explore the effect of helical structures that manifest phase singularities in the moiré pattern by introducing a topological charge onto the phase-gratings themselves. A fork-dislocation phase-grating with period , height , and topological charge has the profile:
| (1) |
where is the grating wave vector, is the Cartesian (azimuthal) coordinate, is the scattering length density of the grating material, and is the neutron wavelength. Using the recently introduced k-space model Sarenac et al. (2023) we can simulate the intensity and contrast behaviour using the phase-grating profile of Eq. 1.
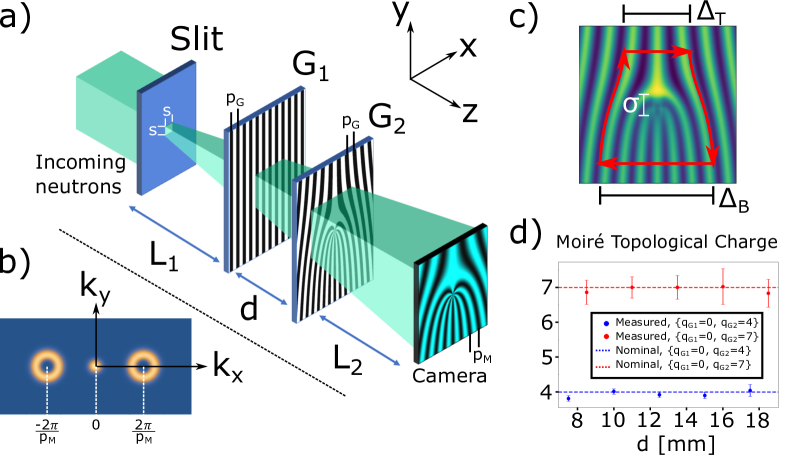
An experimental demonstration was performed with the two-PGMI configurations of and . The first configuration is depicted on Fig. 1a. The moiré pattern at the camera possesses a topological charge of with moiré period of , where is the distance from the slit to camera, is the period of the phase-gratings, and is the distance between the two phase-gratings. The Fourier transform of the intensity profile is shown in Fig. 1b where the doughnut profiles are indicative of helical structures with phase singularities Sarenac et al. (2022).
Whereas contrast is the figure of merit for a 1D two-PGMI, an additional metric is needed for identifying and characterizing phase singularities. In this particular setup the topology in the moiré pattern can be determined by where is the number of periods in a segment below (above) the origin where the connecting vertical lines between the two segments follow a trajectory of constant intensity Nye and Berry (1974), see Fig. 1c. Using this method we can calculate the measured moiré topology using a fit procedure for the two experimental configurations as shown in Fig. 1d. This method becomes increasingly useful as the smear centered on the phase-singularity increases with slit size.
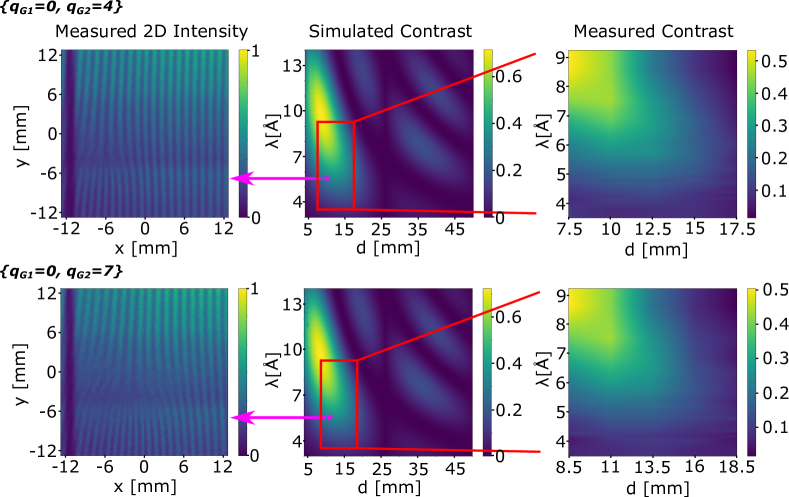
Examples of the measured moiré pattern at the camera are shown in the first column of Fig. 2 for both and . Note that the vertical stripe on the left is an upstream optical effect due to the guide geometry, and unrelated to the moiré interference. The simulated (measured) contrast as a function of phase-grating separation and wavelength is shown in the second (third) column of Fig. 2. The experimentally accessible parameters were not centered around the optimal contrast parameters as the phase-gratings were initially designed for a Å neutrons. Good agreement is found between the predicted and measured contrast.
III.2 2D phase-gratings
Here we aim to explore the 2D moiré pattern that possesses a periodicity along two orthogonal directions. There are many variations possible for 2D phase-grating profiles. For our experiments we chose a profile of:
| (2) |
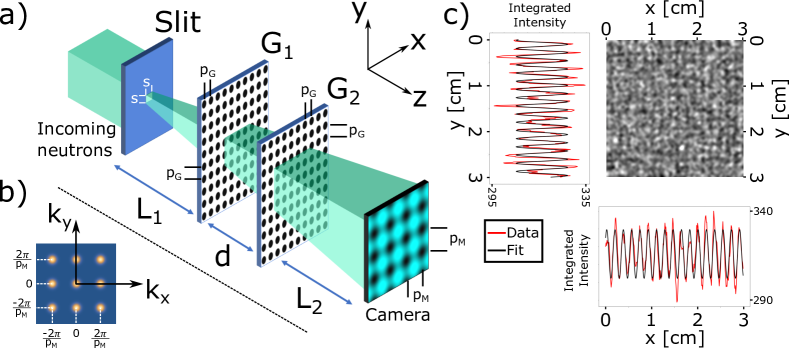
which is essentially a 2D array of circular holes as shown in the SEM images of Appendix A. The setup schematic is depicted on Fig. 3a. The 2D moiré pattern at the camera possesses a sinusoidal pattern in both the x and y directions. Therefore, its Fourier transform shows 2D diffraction orders as depicted in Fig. 3b. The 2D moiré pattern can be integrated along either Cartesian direction as shown in Fig. 3c where we consider the y-axis to be along Earth’s gravity and the x-axis along the perpendicular direction. The shown profile is obtained by considering the phase-grating separation of and Å Å wavelength distribution, and the observed intensity profile at the camera has been rotated by (corresponding to the maximum contrast location in a contrast vs plot).
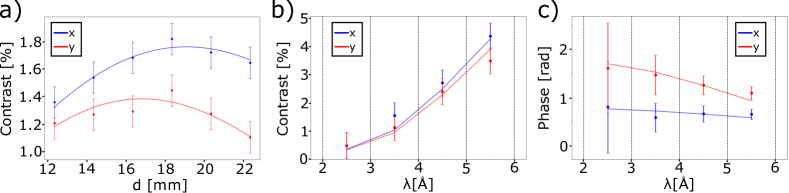
The measured contrast as a function of phase-grating separation () for a polychromatic wavelength distribution is shown on Fig. 4a, and Fig. 4b shows wavelength-dependent contrast for a particular . See Appendix B for the wavelength distribution profile. Using the k-space model of Ref. Sarenac et al. (2023) it can be confirmed that even when accounting for gravity the difference between the contrasts along the two directions should have been negligible for the given experimental parameters, and that the observed difference is most likely due to the difference in slit sizes. The 2D slit was composed of a sequence of two perpendicular 1D slits each made by bringing two cadmium pieces together with the target gap of . Performing a least squares fit to the two slit sizes we find good agreement with m m for slit along x and m m for slit along y. These values are well within the expected experimental uncertainties.
Fig. 4c shows the wavelength-dependent phase shift that can be used to quantify the effect of gravity. In a two-PGMI the main contribution to the gravitationally induced phase shifts is the neutron fall between the second phase-grating and the neutron camera:
| (3) |
where is the angle between the moiré vector and the gravitational force vector, is the acceleration due to Earth’s gravity, is the mass of the neutron, is the Plank’s constant, and is an arbitrary offset. We find good agreement between the expected and observed wavelength-dependent phase shifts.
IV Conclusion
We have expanded neutron phase-grating moiré interferometry to 2D and enabled the use of new degrees of freedom for material characterization studies and high precision measurements of fundamental constants. We examined the manifestation and characterization of phase singularities in the moiré pattern by incorporating fork-dislocation phase-gratings. Future studies will look at the interference between multiple phase singularities and the effects that would be introduced by samples with phase singularities such as skyrmions Milde et al. (2013); Yu et al. (2020). We also characterized two-PGMI setups that simultaneously manifest moiré interference along two orthogonal directions. The orthogonal interference pattern enables the presence of an in-situ reference signal that can greatly reduce systematic errors. Furthermore, future studies will also examine the use of 2D phase-linear gratings with three-PGMI where it is possible to substantially increase the distance between the phase-gratings. Whereas Eq. 3 is considering the neutron gravitation fall relative to the moiré period at the camera, a three-PGMI has the capability to consider the neutron gravitation fall relative to the phase-grating period: . This can provide an amplification to phase sensitivity by several orders of magnitude.
Acknowledgements
This work was supported by the Canadian Excellence Research Chairs (CERC) program, the Natural Sciences and Engineering Research Council of Canada (NSERC) Discovery program, Collaborative Research and Training Experience (CREATE) program, the Canada First Research Excellence Fund (CFREF), and the National Institute of Standards and Technology (NIST) and the US Department of Energy, Office of Nuclear Physics, under Interagency Agreement 89243019SSC000025. The pulsed neutron experiment at J-PARC MLF was performed under a user program (Proposal No. 2022A0104).
References
- Colella et al. (1975) Roberto Colella, Albert W Overhauser, and Samuel A Werner, “Observation of gravitationally induced quantum interference,” Physical Review Letters 34, 1472 (1975).
- Rauch et al. (1975) Helmut Rauch, Anton Zeilinger, Gerald Badurek, A Wilfing, W Bauspiess, and U Bonse, “Verification of coherent spinor rotation of fermions,” Physics Letters A 54, 425–427 (1975).
- Hasegawa et al. (2010) Yuji Hasegawa, Rudolf Loidl, Gerald Badurek, Katharina Durstberger-Rennhofer, Stephan Sponar, and Helmut Rauch, “Engineering of triply entangled states in a single-neutron system,” Physical Review A 81, 032121 (2010).
- Wood et al. (2014) Christopher J Wood, Mohamed O Abutaleb, Michael G Huber, Muhammad Arif, David G Cory, and Dmitry A Pushin, “Quantum correlations in a noisy neutron interferometer,” Physical Review A 90, 032315 (2014).
- Clark et al. (2015) Charles W Clark, Roman Barankov, Michael G Huber, Muhammad Arif, David G Cory, and Dmitry A Pushin, “Controlling neutron orbital angular momentum,” Nature 525, 504–506 (2015).
- Sarenac et al. (2016) Dusan Sarenac, Michael G Huber, Benjamin Heacock, Muhammad Arif, Charles W Clark, David G Cory, Chandra B Shahi, and Dmitry A Pushin, “Holography with a neutron interferometer,” Optics Express 24, 22528–22535 (2016).
- Lemmel et al. (2015) Hartmut Lemmel, Ph Brax, AN Ivanov, Tobias Jenke, Guillaume Pignol, Mario Pitschmann, Thomas Potocar, Markus Wellenzohn, Michael Zawisky, and Hartmut Abele, “Neutron interferometry constrains dark energy chameleon fields,” Physics Letters B 743, 310–314 (2015).
- Li et al. (2016) Ke Li, Muhammad Arif, David G Cory, Robert Haun, Benjamin Heacock, Michael G Huber, Joachim Nsofini, Dimitry A Pushin, Parminder Saggu, Dusan Sarenac, et al., “Neutron limit on the strongly-coupled chameleon field,” Physical Review D 93, 062001 (2016).
- Klein and Werner (1983) AG Klein and SA Werner, “Neutron optics,” Reports on Progress in Physics 46, 259 (1983).
- Abele (2008) Hartmut Abele, “The neutron. its properties and basic interactions,” Progress in Particle and Nuclear Physics 60, 1–81 (2008).
- Willis and Carlile (2017) Bertram Terence Martin Willis and Colin J Carlile, Experimental neutron scattering (Oxford University Press, 2017).
- Fuhrman et al. (2015) WT Fuhrman, J Leiner, P Nikolić, L DeBeer-Schmitt, J-M Mignot, SM Koohpayeh, et al., “Interaction driven subgap spin exciton in the kondo insulator smb 6,” Physical review letters 114, 036401 (2015).
- Qian et al. (2018) Fengjiao Qian, Lars J Bannenberg, Heribert Wilhelm, Grégory Chaboussant, Lisa M Debeer-Schmitt, Marcus P Schmidt, Aisha Aqeel, Thomas TM Palstra, Ekkes Brück, Anton JE Lefering, et al., “New magnetic phase of the chiral skyrmion material cu2oseo3,” Science Advances 4, eaat7323 (2018).
- Dewhurst et al. (2015) CD Dewhurst, M Mochizuki, K Yanai, et al., “Néel-type skyrmion lattice with confined orientation in the polar magnetic semiconductor gav4s8,” Nature materials 14, 1116–1122 (2015).
- Henderson et al. (2023) ME Henderson, B Heacock, M Bleuel, DG Cory, C Heikes, MG Huber, J Krzywon, O Nahman-Levesqué, GM Luke, M Pula, et al., “Three-dimensional neutron far-field tomography of a bulk skyrmion lattice,” Nature Physics , 1–7 (2023).
- Rauch and Werner (2015) Helmut Rauch and Samuel A Werner, Neutron interferometry: lessons in experimental quantum mechanics (Oxford University Press, New York, 2015).
- Saggu et al. (2016) Parminder Saggu, Taisiya Mineeva, Muhammad Arif, DG Cory, Robert Haun, Ben Heacock, MG Huber, Ke Li, Joachim Nsofini, Dusan Sarenac, et al., “Decoupling of a neutron interferometer from temperature gradients,” Review of Scientific Instruments 87, 123507 (2016).
- Clauser and Li (1994) John F. Clauser and Shifang Li, “Talbot-vonLau atom interferometry with cold slow potassium,” Physical Review A 49, R2213–R2216 (1994).
- Pfeiffer et al. (2006) F Pfeiffer, C Grünzweig, O Bunk, G Frei, E Lehmann, and C David, “Neutron Phase Imaging and Tomography,” Physical Review Letters 96, 215505 (2006).
- Cronin and McMorran (2006) Alexander D Cronin and Ben McMorran, “Electron interferometry with nanogratings,” Physical Review A 74, 061602 (2006).
- David et al. (2002) C David, B Nöhammer, H H Solak, and E Ziegler, “Differential x-ray phase contrast imaging using a shearing interferometer,” Applied Physics Letters 81, 3287–3289 (2002).
- Cronin et al. (2009) Alexander D. Cronin, Jörg Schmiedmayer, and David E. Pritchard, “Optics and interferometry with atoms and molecules,” Reviews of Modern Physics 81, 1051–1129 (2009).
- Chapman et al. (1995) Michael S Chapman, Christopher R Ekstrom, Troy D Hammond, Jörg Schmiedmayer, Bridget E Tannian, Stefan Wehinger, and David E Pritchard, “Near-field imaging of atom diffraction gratings: The atomic talbot effect,” Physical Review A 51, R14 (1995).
- Busi et al. (2023) Matteo Busi, Jiazhou Shen, Michael Bacak, Marie Christine Zdora, Jan Čapek, Jacopo Valsecchi, and Markus Strobl, “Multi-directional neutron dark-field imaging with single absorption grating,” Scientific Reports 13, 15274 (2023).
- Talbot (1836) H.F. Talbot, “Lxxvi. facts relating to optical science. no. iv,” Philosophical Magazine Series 3 9, 401–407 (1836).
- Miao et al. (2016) Houxun Miao, Alireza Panna, Andrew A Gomella, Eric E Bennett, Sami Znati, Lei Chen, and Han Wen, “A universal moire effect and application in x-ray phase-contrast imaging,” Nature Physics (2016).
- Pushin et al. (2017) Dmitry A Pushin, Dusan Sarenac, Daniel S Hussey, Haixing Miao, Muhammad Arif, David G Cory, Michael G Huber, David L Jacobson, Jacob M LaManna, Joseph D Parker, et al., “Far-field interference of a neutron white beam and the applications to noninvasive phase-contrast imaging,” Physical Review A 95, 043637 (2017).
- Hussey et al. (2016) Daniel S Hussey, Houxun Miao, Guangcui Yuan, Dmitry Pushin, Dusan Sarenac, Michael G Huber, David L Jacobson, Jacob M LaManna, and Han Wen, “Demonstration of a white beam far-field neutron interferometer for spatially resolved small angle neutron scattering,” arXiv preprint arXiv:1606.03054 (2016).
- Sarenac et al. (2018) Dusan Sarenac, Dimitry A Pushin, Michael G Huber, Daniel S Hussey, Haixing Miao, Muhammad Arif, David G Cory, Alexander D Cronin, Benjamin Heacock, David L Jacobson, et al., “Three phase-grating moiré neutron interferometer for large interferometer area applications,” Physical Review Letters 120, 113201 (2018).
- Brooks et al. (2018) Adam J Brooks, Daniel S Hussey, Hong Yao, Ali Haghshenas, Jumao Yuan, Jacob M LaManna, David L Jacobson, Caroline G Lowery, Nikolay Kardjilov, Shengmin Guo, et al., “Neutron interferometry detection of early crack formation caused by bending fatigue in additively manufactured ss316 dogbones,” Materials & Design 140, 420–430 (2018).
- Brooks et al. (2017) Adam J Brooks, Gerald L Knapp, Jumao Yuan, Caroline G Lowery, Max Pan, Bridget E Cadigan, Shengmin Guo, Daniel S Hussey, and Leslie G Butler, “Neutron imaging of laser melted ss316 test objects with spatially resolved small angle neutron scattering,” Journal of Imaging 3, 58 (2017).
- Sarenac et al. (2022) Dusan Sarenac, Melissa E Henderson, Huseyin Ekinci, Charles W Clark, David G Cory, Lisa DeBeer-Schmitt, Michael G Huber, Connor Kapahi, and Dmitry A Pushin, “Experimental realization of neutron helical waves,” Science Advances 8, eadd2002 (2022).
- Nye and Berry (1974) John Frederick Nye and Michael Victor Berry, “Dislocations in wave trains,” Proceedings of the Royal Society of London. A. Mathematical and Physical Sciences 336, 165–190 (1974).
- Nelson et al. (2018) Ronald O Nelson, Sven C Vogel, James F Hunter, Erik B Watkins, Adrian S Losko, Anton S Tremsin, Nicholas P Borges, Theresa E Cutler, Lee T Dickman, Michelle A Espy, et al., “Neutron imaging at lansce—from cold to ultrafast,” Journal of Imaging 4, 45 (2018).
- Shinohara et al. (2020) Takenao Shinohara, Tetsuya Kai, Kenichi Oikawa, Takeshi Nakatani, Mariko Segawa, Kosuke Hiroi, Yuhua Su, Motoki Ooi, Masahide Harada, Hiroshi Iikura, et al., “The energy-resolved neutron imaging system, raden,” Review of Scientific Instruments 91 (2020).
- Sarenac et al. (2023) D Sarenac, G Gorbet, C Kapahi, Charles W Clark, DG Cory, H Ekinci, S Fangzhou, ME Henderson, MG Huber, D Hussey, et al., “Cone beam neutron interferometry: from modeling to applications,” arXiv preprint arXiv:2309.01787 (2023).
- Milde et al. (2013) Peter Milde, Denny Köhler, Joachim Seidel, LM Eng, Andreas Bauer, Alfonso Chacon, Jonas Kindervater, Sebastian Mühlbauer, Christian Pfleiderer, Stefan Buhrandt, et al., “Unwinding of a skyrmion lattice by magnetic monopoles,” Science 340, 1076–1080 (2013).
- Yu et al. (2020) X. Yu, J. Masell, F. S. Yasin, K. Karube, N. Kanazawa, K. Nakajima, T. Nagai, K. Kimoto, W. Koshibae, Y. Taguchi, N. Nagaosa, and Y. Tokura, “Real-space observation of topological defects in extended skyrmion-strings,” Nano Letters 20, 7313–7320 (2020).
- (39) Certain trade names and company products are mentioned in the text or identified in an illustration in order to adequately specify the experimental procedure and equipment used. In no case does such identification imply recommendation or endorsement by the National Institute of Standards and Technology, nor does it imply that the products are necessarily the best available for the purpose.
Appendix
IV.1 Phase-grating fabrication
Double-side polished 10.16 cm diameter (100) silicon wafers were used to fabricate these gratings. A bilayer resist (PMGI/S1805 NIS ) was patterned via a maskless aligner (MLA 150, Heidelberg Instrument). As a hard mask for the plasma etching, Cr metal (60 nm) was e-beam evaporated and lifted-off in heated PG Remover. A Bosch recipe was adopted to achieve a vertical sidewall etch profile. The samples were etched in an Oxford PlasmaLab ICP-380 inductively coupled plasma reactive ion etching (ICP-RIE) system, which provides high-density plasma with independently controlled system parameters. In our Bosch recipe, the passivation half cycle comprises the RF chuck power: 5 W, ICP coil power: 1000 W, C4F8: 160 sccm, pressure: 2.67 Pa, temperature: 15 C for 5 s while the etch half cycle comprises the RF chuck power: 100 W, ICP coil power: 1000 W, SF6: 160 sccm, pressure: 3.33 Pa, temperature: 15 C for 4 s. After fabricating the gratings, the remaining Cr mask was removed via plasma etching. Fig. 5 shows the SEM images of the four types of phase-gratings that were fabricated.
IV.2 Wavelength Distributions