Monitoring Inactivity of Single Older Adults at Home
Abstract
A new application for real-time monitoring of the lack of movement in older adults’ own homes is proposed, aiming to support people’s lives and independence in their later years. A lightweight camera monitoring system, based on an RGB-D camera and a compact computer processor, was developed and piloted in community homes to observe the daily behavior of older adults. Instances of body inactivity were detected in everyday scenarios anonymously and unobtrusively. These events can be explained at a higher level, such as a loss of consciousness or physiological deterioration. The accuracy of the inactivity monitoring system is assessed, and statistics of inactivity events related to the daily behavior of the older adults are provided. The results demonstrate that our method performs accurately in inactivity detection across various environments, including low room lighting, TV flickering, and different camera views.
Anonymously monitoring, Inactivity, Older adults, Computer Vision, Aging in place
1 Introduction
The proportion of older adults living alone is increasing globally as the aging population grows [9, 10]. According to the Office for National Statistics in 2019, more than 3 million people over the age of 70 lived alone in the UK [2]. In Japan, 15.5% of older adults lived alone in 2015 and most of them were likely to face a lonely death [1]. Furthermore, approximately 28% (14.7 million) of US adults aged 60 and older lived alone, a higher percentage compared to 16% in other 130 countries and territories included in the study [3, 4]. Moreover, the percentage of the population living alone increases with age, with approximately 44% of women over the age of 75 living alone in the US.
Even if they are living alone, more than 90% of older adults express a strong desire to remain independent – they predominantly prefer to continue living in their own homes rather than relocating to nursing homes or other care facilities [3, 6]. However, lonely living older adults face more difficulties in daily life and have higher medical needs. Compared to those older adults who live with families or others, they may experience social isolation, poverty, and poorer physical and mental health [9], e.g., higher anxiety and depression rates [6], more frequent visits to their GP or A&E [9], and other types of health risks [5]. Meanwhile, new or worsening symptoms related to health problems or sensory impairments may not be noticed without a caregiver around [3], and sudden medically dangerous situations may also occur, such as falls, asthma, heart disease, stroke, etc., which can lead to loss of life. A flexible solution could be domiciliary care, with the assistance of a live-in or visiting caregiver. For example, they can be visited regularly or irregularly by professional caregivers, family members, or friends. But this is not always required when the older adult person is still healthy enough to cope with their daily routines, and it often needs a lot of physical and mental effort, plus time, from the carers. As the cost of care is high (NHS 2022 [7]), carers may be part-time. But, when the human caregiver is not present, older adults can still face sudden medical conditions.
Mobility problems, including mobility failure or immobility syndrome, are conditions that can occur when a person is unable to move for an extended period of time. They are commonly seen in older people and can lead to functional decline, increased risk of nursing home placement after discharge, and medical complications such as deep venous thrombosis, urinary incontinence, pressure sores, joint contractures, cardiac deconditioning, muscle weakness, and falls [8].
Smart technologies and AI solutions are accelerating the pace of change in healthcare in many areas, such as clinical decision support, patient monitoring, and healthcare intervention [11], fall detection [12], monitoring patients in hospitals [13], or in-home care scenarios [14]. Unobtrusive sensors can work 24/7 in the long term, providing faster, more accurate analysis in a user-focused manner, providing alerts when dangerous situations are detected, saving lives and saving labor. This will effectively reduce the manpower, time, and cost demands of healthcare applications, which will bring great benefits to the aging society in the near future. In recent years, many studies have been conducted to monitor older adults in their homes using cameras, Stone et al. [12] detect falls using the person’s vertical state and motion features. Using a depth imagery sensor (Kinect) can largely eliminate the interference of lighting and shadows for visual perception. A patient monitoring system is used to lessen the workload of the nurses: two RGB cameras were placed for monitoring patients, one for bed view and the other for room view, to detect bed occupancy, self-extubation, and falls [13]. The above systems have achieved good accuracy in detecting events, meanwhile, video surveillance systems are often unobtrusive and preferred by older adults over wearable measurement devices [16]. However, one of the major concerns with camera-based systems is the privacy [15]. This issue must be addressed when convincing people to use such a camera-based system. Other challenges of real-world home camera monitoring include effectiveness and adaptation. That means accurate detection of anomalous human events in backgrounds for different scenarios, moving objects and pets in the house, and changing lighting conditions, such as sunlight, low light, and TV lighting.
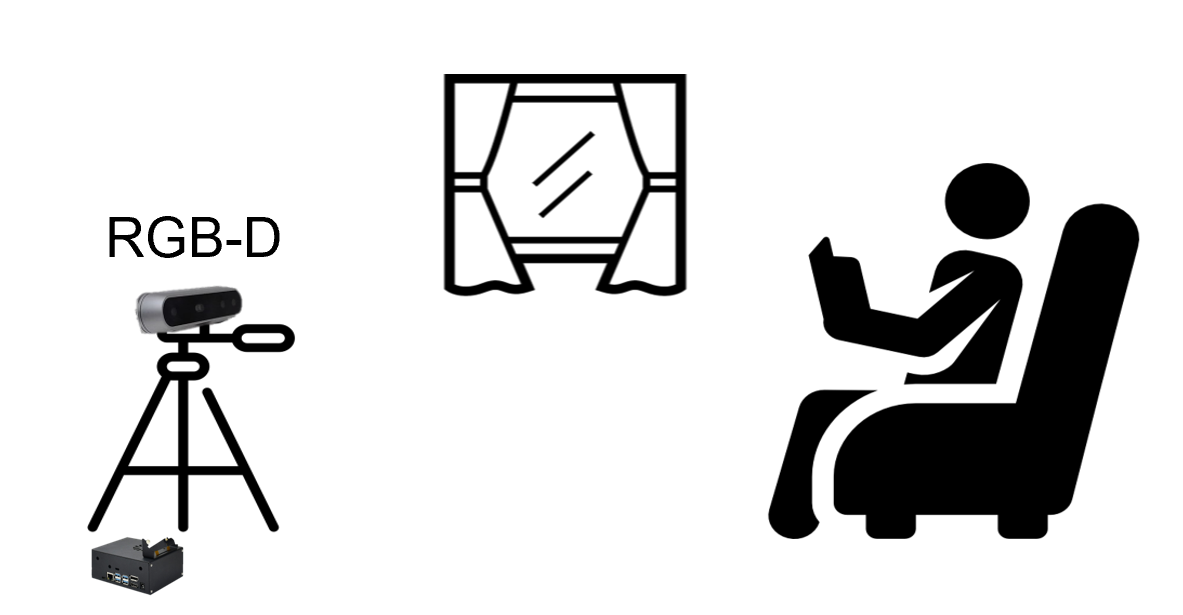
In this study, a new application of real-time monitoring of older adult people in common home scenarios is presented. The goal is to anonymously and reliably monitor their common behavior patterns and detect abnormal situations in time to intervene in potentially dangerous medical situations. Specifically, the application detects the prolonged inactivity of a person sitting in a standard location (e.g., favorite chair). A compact system consisting of an RGB-D camera and a small computer was deployed, which monitors a person at a specific location. The abnormal inactivity events can be related to medical conditions, such as lost consciousness, or long-term decreased physical ability. An example is shown in Fig. 1.
The application was designed for homes where a single aging adult lives, so that was the test scenario that was evaluated. The results show that the system has good accuracy, sensitivity, and robustness in different environmental settings, enabling long-term anonymous monitoring of older adults in their own homes. This paper introduces the new visual monitoring system that has the following advantages:
(1) A camera-based, unobtrusive, anonymous, fully automatic, and real-time system for monitoring behaviors of older adults in home scenarios;
(2) The system is lightweight, cost-effective, and reliable for long-term use. The detection algorithm is robust to changing human poses, varying backgrounds and lighting conditions, including low-light environments;
(3) Analysis of the recorded anonymous data can reveal the behavior patterns of older adults, such as their daily routines and motion habits, for abnormal or deterioration detection.
2 Related Work
Many sensors have been investigated for detecting human behavior in indoor scenarios [17]. Individual inactivity is closely associated with hospitalisation in older adults [38, 8]. However, there are few works that specifically focus on detecting inactivity of the human body.
Wearable sensors offer high accuracy in human motion detection. For example, a belt-worn kinematic sensor demonstrated 100% recall in detecting human motionless events, such as several seconds of walking, standing, sitting, or lying, in a lab environment [30]. However, wearable sensors can be intrusive and may require users to wear them continuously, which might not always be acceptable for older adults. Ambient sensors are non-intrusive and capable of detecting various indoor human movements, including whole-body motions, limb movements, and even chest breathing movements, even in complete darkness. For instance, Wi-Fi-based human motion sensing [32] can accurately recognize five typical human activities with a 96.6% accuracy; and subtle motions, such as simulated hand tremors, with 95.7% accuracy [33]. Passive Infrared (PIR) sensors [31] have achieved an accuracy of 93% in predicting human relative locations, including stationary individuals. Radar-based sensors [34] have achieved a classification accuracy of over 95% for four basic types of human motion. However, ambient sensors can be triggered by household pets, leading to an increase in data noise and a decrease in the overall predictability of human mobility [35]. Camera-based systems are widely used due to their cost-effectiveness and non-redundant nature in modern buildings. Cameras are less intrusive for long-term monitoring compared to wearable sensors and provide multifunctional and semantically explainable capabilities. They can efficiently identify and track humans, pets, and various objects. For instance, Kinect-based body motion signals have shown moderate to excellent accuracy, with root mean square errors (RMSE) ranging from 20 mm to 89 mm [36]. In video-based pose estimation, mean absolute errors for gait analysis are as low as 0.02 seconds for temporal gait parameters and 0.04 meters for step lengths compared to motion capture technologies [37].
In human inactivity detection, accurately detecting the person is typically the initial step in monitoring behaviors. Xia et al. [18] proposed a model-based approach for indoor person detection using a Kinect sensor to capture a side view of the person. Initially, all 2D circular shapes are localized as head candidates, and then these candidate regions are fitted to a learned 3D human head shape. Most deep learning-based detectors are designed for oblique or front views, but Cho et al. [19] trained convolutional neural networks to segment heads using top-view depth data.A side view of the person can be more intrusive, as individuals are aware of the camera’s presence. Depth-imaging-based methods are recognized for their superior performance and robustness in detecting humans across various poses, rotations, and lighting conditions. However, they often come with higher computational costs, which can be a limitation in applications requiring real-time processing, such as healthcare applications.
To monitor a person’s inactivity while sitting in a preferred location, camera-based motion detection methods can be applied. There exists a range of motion detection algorithms designed to address various real-world challenges [20]. One fundamental method is background subtraction [22], which creates a background model and identifies foreground objects by comparing the current frame to this model. Another technique, frame differencing [28], involves comparing the current frame with a reference frame to track the number of differing pixels. However, these methods are sensitive to noise and environmental changes, such as variations in lighting, the presence of shadows, and moving objects. Parametric-based methods, like the Gaussian Mixture model [25], tend to be more robust in the face of noise and artifacts [23]. Non-parametric methods [24], fitting a smooth probability density function to pixel values over a temporal window, considering both self-similarity and similarity to neighboring pixels. This enhances robustness against camera jitter or minor background movements [20]. When compared to other traditional motion detection methods, non-parametric techniques have shown superior performance in eliminating minor background movements [29]. Common challenges for cameras in achieving accurate human inactivity detection include dealing with complex background noise, coping with fluctuating lighting conditions (including low environmental lighting and abrupt changes, such as TV light flickering), meeting high sensitivity requirements for detecting small body movements (e.g., finger movements), and distinguishing human movements from non-human movements (e.g., pets).
3 Unobtrusive Monitoring Methodology
The goal is to detect the lack of movement accurately and sensitively in a home location where the monitored person spends a lot of time. For example, this could be a location for reading, resting, or watching television. Depth-based foreground extraction and color-based motion detection are used to detect if the person has stopped moving.
(i) Foreground detection
When monitoring people sitting in a room, the background can be complex, and the subjects can be in the region actively or inactively for long periods. A robust foreground detection method is applied.
A background model is first constructed from a series of depth frames for the first few seconds when no one is present in the view. Each depth frame is smoothed by a median filter. Then, for each new depth frame, foreground pixels are detected by comparing them with the background model using a non-parametric method [21]. The non-parametric method fits a probability density function to the depth values at each pixel over a time window and detects changes. For every pixel at time t, the probability density function that this pixel has a depth value is calculated relative to previous background depth values at the same locations in recent frames, as:
| (1) |
where is a 1d Gaussian function. The pixel is considered as a foreground pixel if the probability is less than the threshold. Each pixel is compared with several pixels at the same location in several recent background frames to enhance the robustness of foreground detection to small noise or vibrations in the background (e.g., leaf motion [21] or depth estimation errors). To speed up the calculation on the small computer by avoiding the exponent computation for each pixel, we define a quadratic function to approximate (1) as:
| (2) |
The foreground (matrix) is derived as
| (3) |
In the implementation, is set to , and is set to [21], where is set as the mean of the absolute value of pixel differences from successive depth frames in the background model. Once the foreground pixels are detected, the traditional post-processing procedures (size filter, tracking, and open processing) are applied to the foreground mask to remove noisy areas. The two most recent foreground regions are also saved (as a binary mask for privacy) for the reference of the following misdetection suppression process.
Background frame pixels are selectively updated, excluding foreground pixels, since some observed body parts may not have any motion for a long time and should not be updated to the background for inactivity detection purposes. The latest background frame is updated and added to the background model sequence, and the oldest frame is removed. For the latest background frame at time t, the foreground area is not updated, it is directly copied from the background frame at time t-1, whereas the previous background area is updated with the corresponding pixels from the current depth frame , as:
| (4) |
where is the background update ratio.
(ii) Motion detection
Motion is detected using a color difference method, by subtracting the color of each pixel in the current frame from the color of the corresponding pixel in the previous frame, taking the absolute value, and comparing it to a threshold.
This basic method is sensitive to detect small true motions of the human body (e.g., fingers) and insensitive to slow changes in natural light; however, it is susceptible to small image artifacts and noise. For example, sudden lighting changes when watching TV at home, especially at night when the room light is dim. Sudden changes in TV light reflected on the human body can be mistaken for movement.
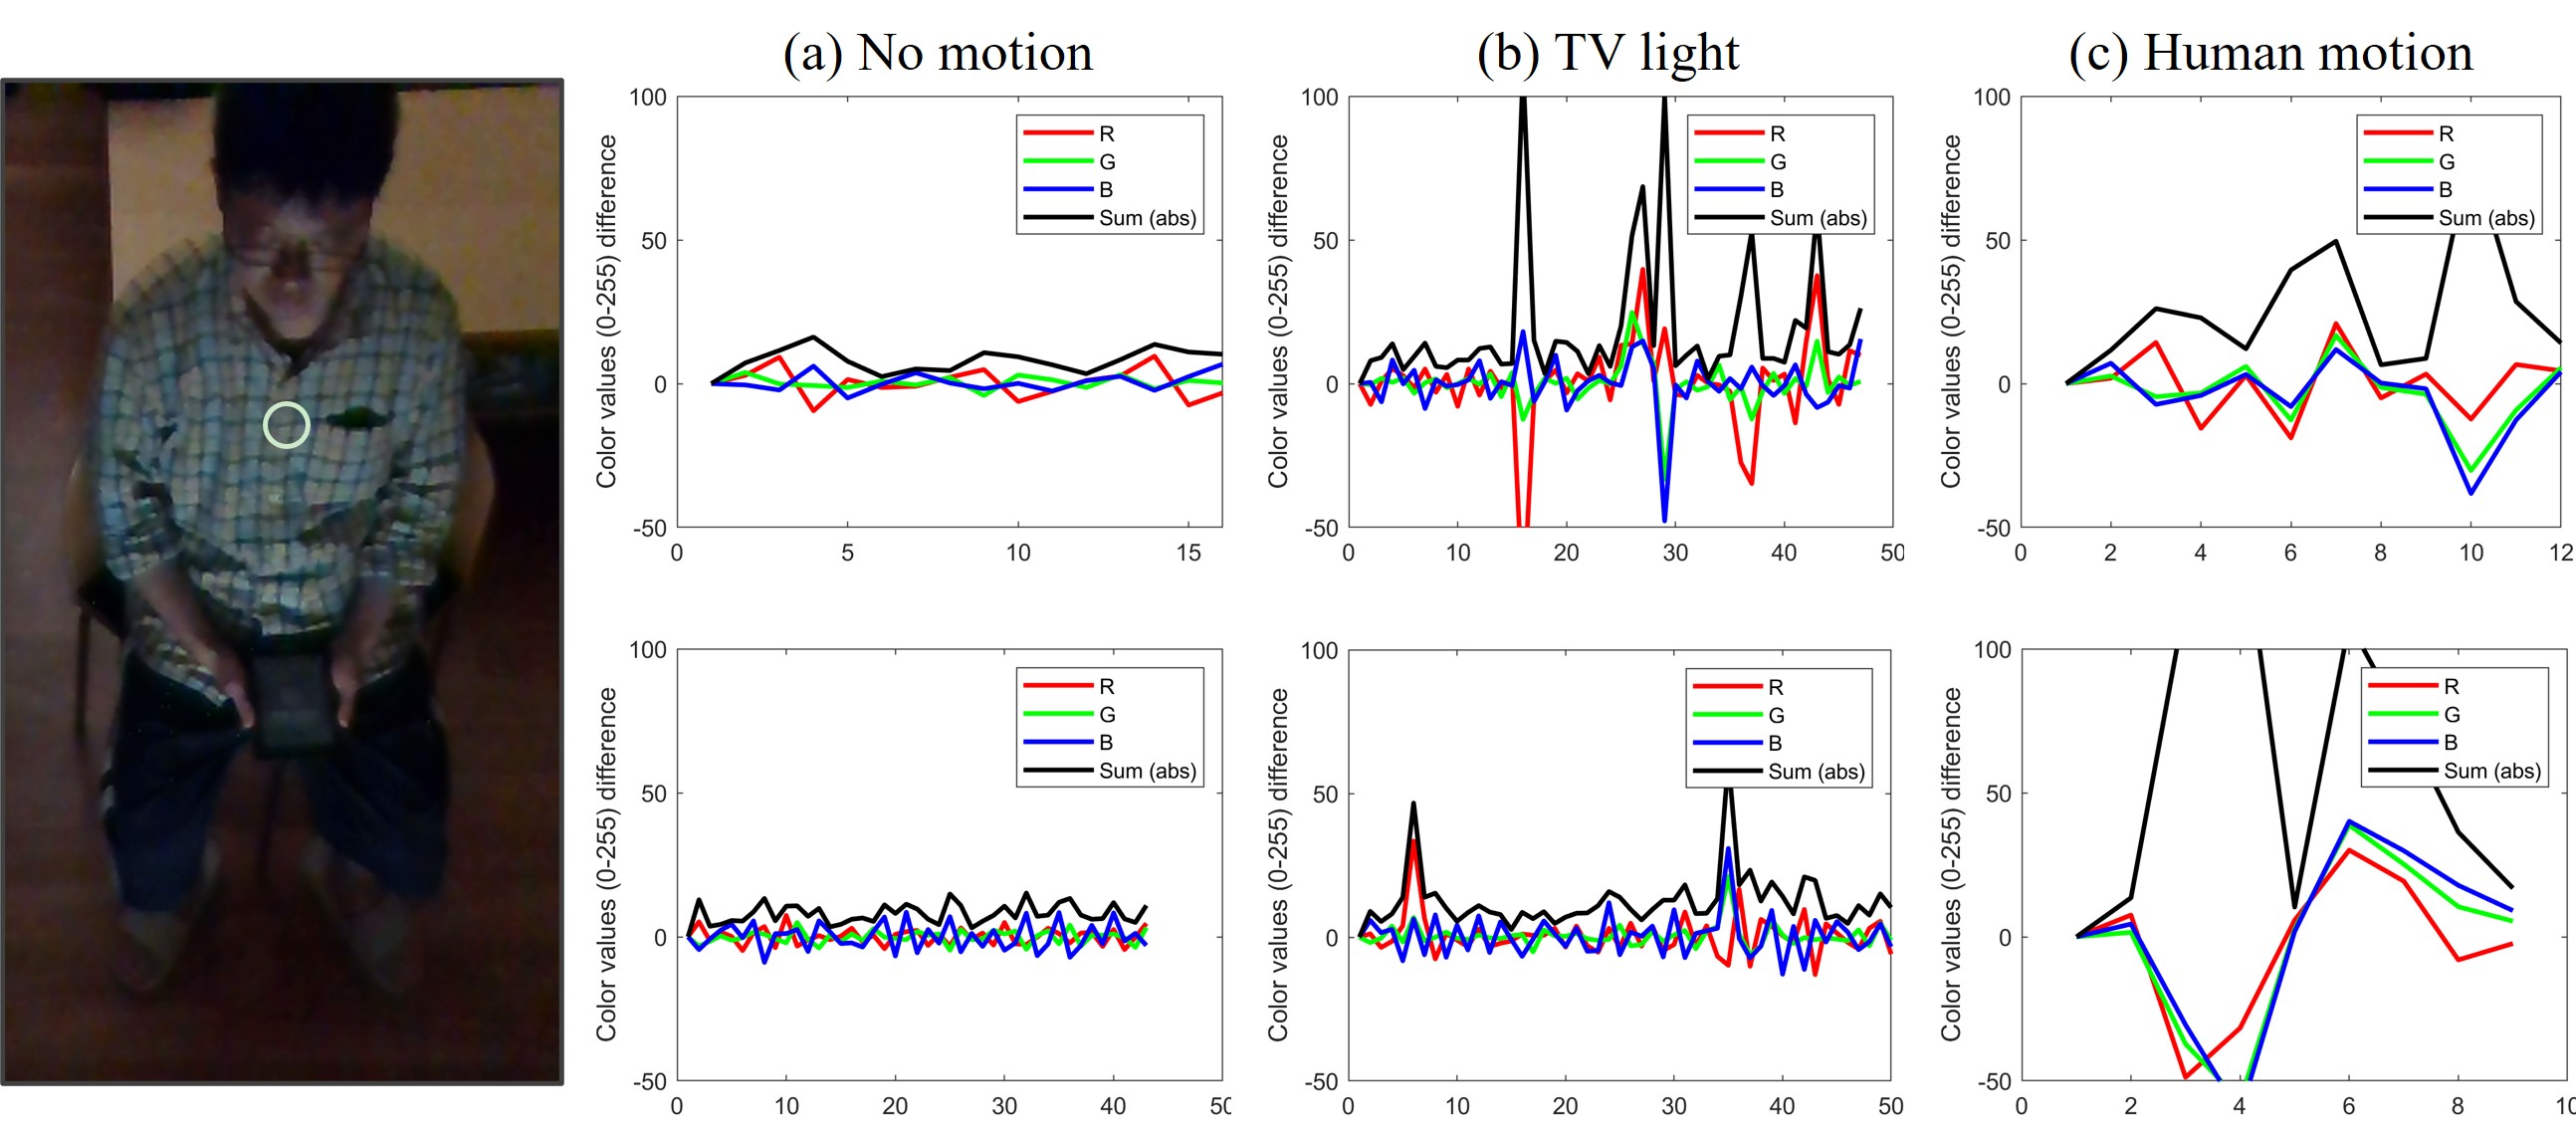
Fig. 2 shows an example of color value changes of a pixel in a video that was recorded under the low light condition of a person in the living room watching TV. In the absence of human motion under constant lighting, pixels at the same image location have very small differences in color values between frames. In this sort of environment, when the TV light changes, peaks of the pixel color difference in one color channel often appear and disappear in a short period. However, when it was true human motion, the pixel difference usually showed large peaks in all color channels and lasted longer. Therefore, to enhance robustness when classifying the changes as human motion, the change of intensities in all channels of the color pixels should be above a threshold, as:
| (5) |
In our experiments, the threshold is set to 20 for RGB pixels (range 0 to 255), where is the movement pixels and is the foreground region, is the difference of pixel values between consecutive frames.
Considering the spatial and temporal size of the true motion of the human body (i.e., larger than a square centimeter, usually more than 0.5 seconds), a 2d spatial median filter (55 pixels) and a temporal median filter (size 5) are applied to the detection regions to further eliminate tiny camera noise and sudden illumination changes.
(iii) Misdetection suppression
The human motion regions detected using the above method is often disconnected when the person adopts some poses, such as reclining or lying on a couch.
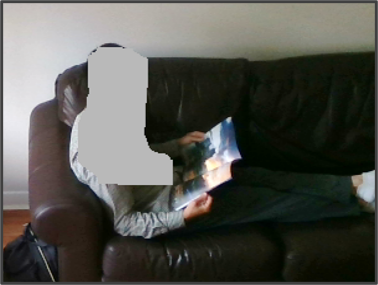
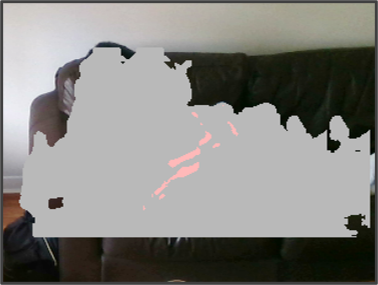
This is because, in these poses, the depth values of the background (e.g., couch) are very close to the depth values of the body parts, and most detection methods that calculate the difference between foreground and background may not be able to distinguish the small differences given inaccurate camera measurements ( depth error at 2 meters). An example is shown in Fig. 3.
To deal with this incomplete foreground, the detected foreground is grown by referencing its depth and spatial locations on the image. An enlarged bounding box (10% of image width) is set around the foreground area to grow within. The mean () and standard deviation () of foreground depth values are calculated as growth reference values. For any pixel in the enlarged bounding box, if its depth value is close to the foreground, as:
| (6) |
then this pixel is treated as a foreground inlier and will grow into the foreground. If the nearby background regions are not close to the foreground, there will be no region grown. If multiple foreground regions are detected, only the regions that are close to the most recent foregrounds in size and depth are grown.
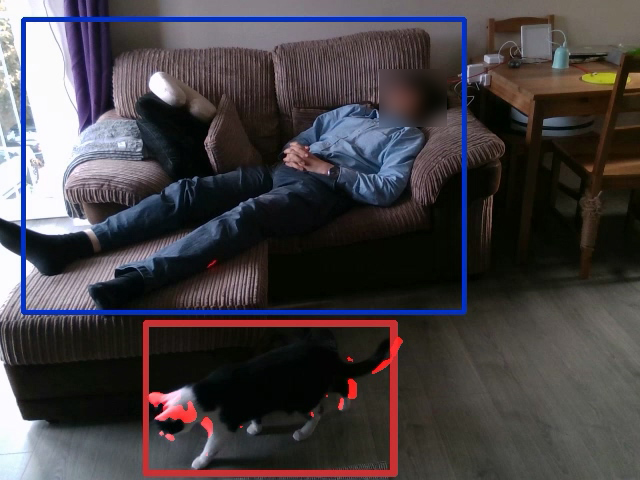
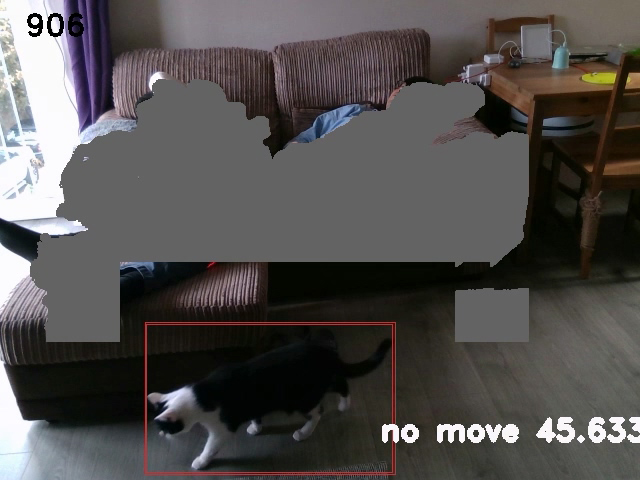
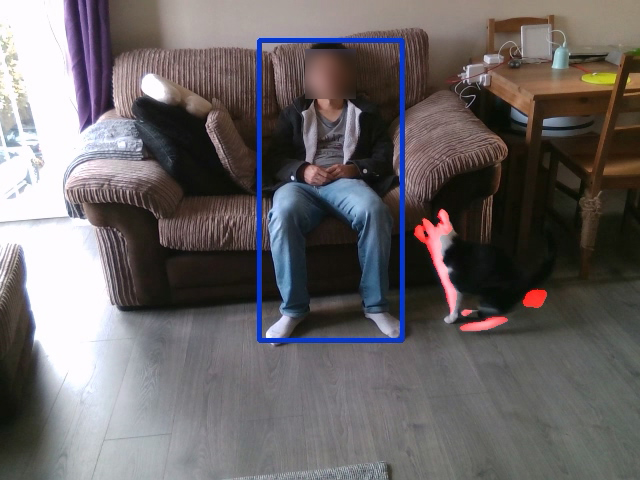
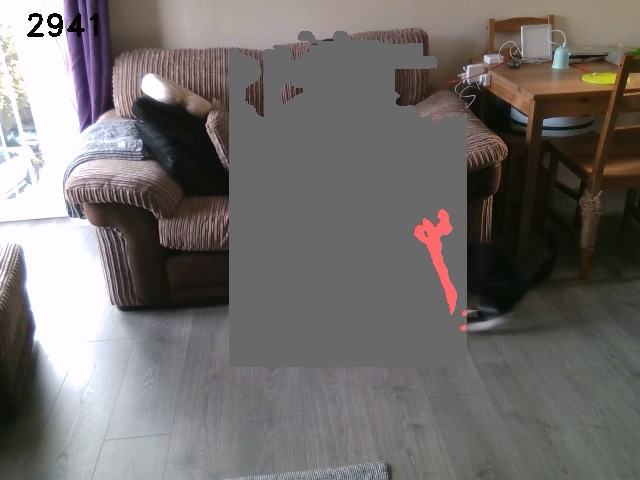
Human/Pet detector: Large objects in the background, such as chairs or tables that may shift when a person leaves their seat, are sometimes detected during monitoring and remain in the foreground. These objects cannot be eliminated through selective background updates. To address this, an object detector (pre-trained YOLOv5, including humans and pets) is employed. Since object detectors are computationally expensive for real-time processing and may not always perform reliably in complex backgrounds and with various human poses, the detection occurs every 10 seconds. The system aggregates multiple observations and votes for human or non-human. After a minute, if the vote result () indicates ’not human,’ the system updates the foreground region to the background. Pets, which are often present in the homes of single older adults, may move around humans even when the human is motionless, and this can introduce unwanted motion in inactivity detection. When both humans and pets are present, the detector runs frame by frame, subtracting the detected pet region (bounding box) from the foreground region. Motion is then detected only within the remaining foreground region, effectively excluding pet motion, as shown in Fig. 10.
3.1 Behavior Statistics and Models
For the inactivity detection, once no motion of the human is detected, a timer will start counting the inactivity period. Once motion is detected or the foreground is recognized as non-human, the timer will reset. Periods of inactivity ( second) and their occurrence times are saved in a log. Median, maximum, and minimum inactivity periods, by time of the day, are extracted from the log data.
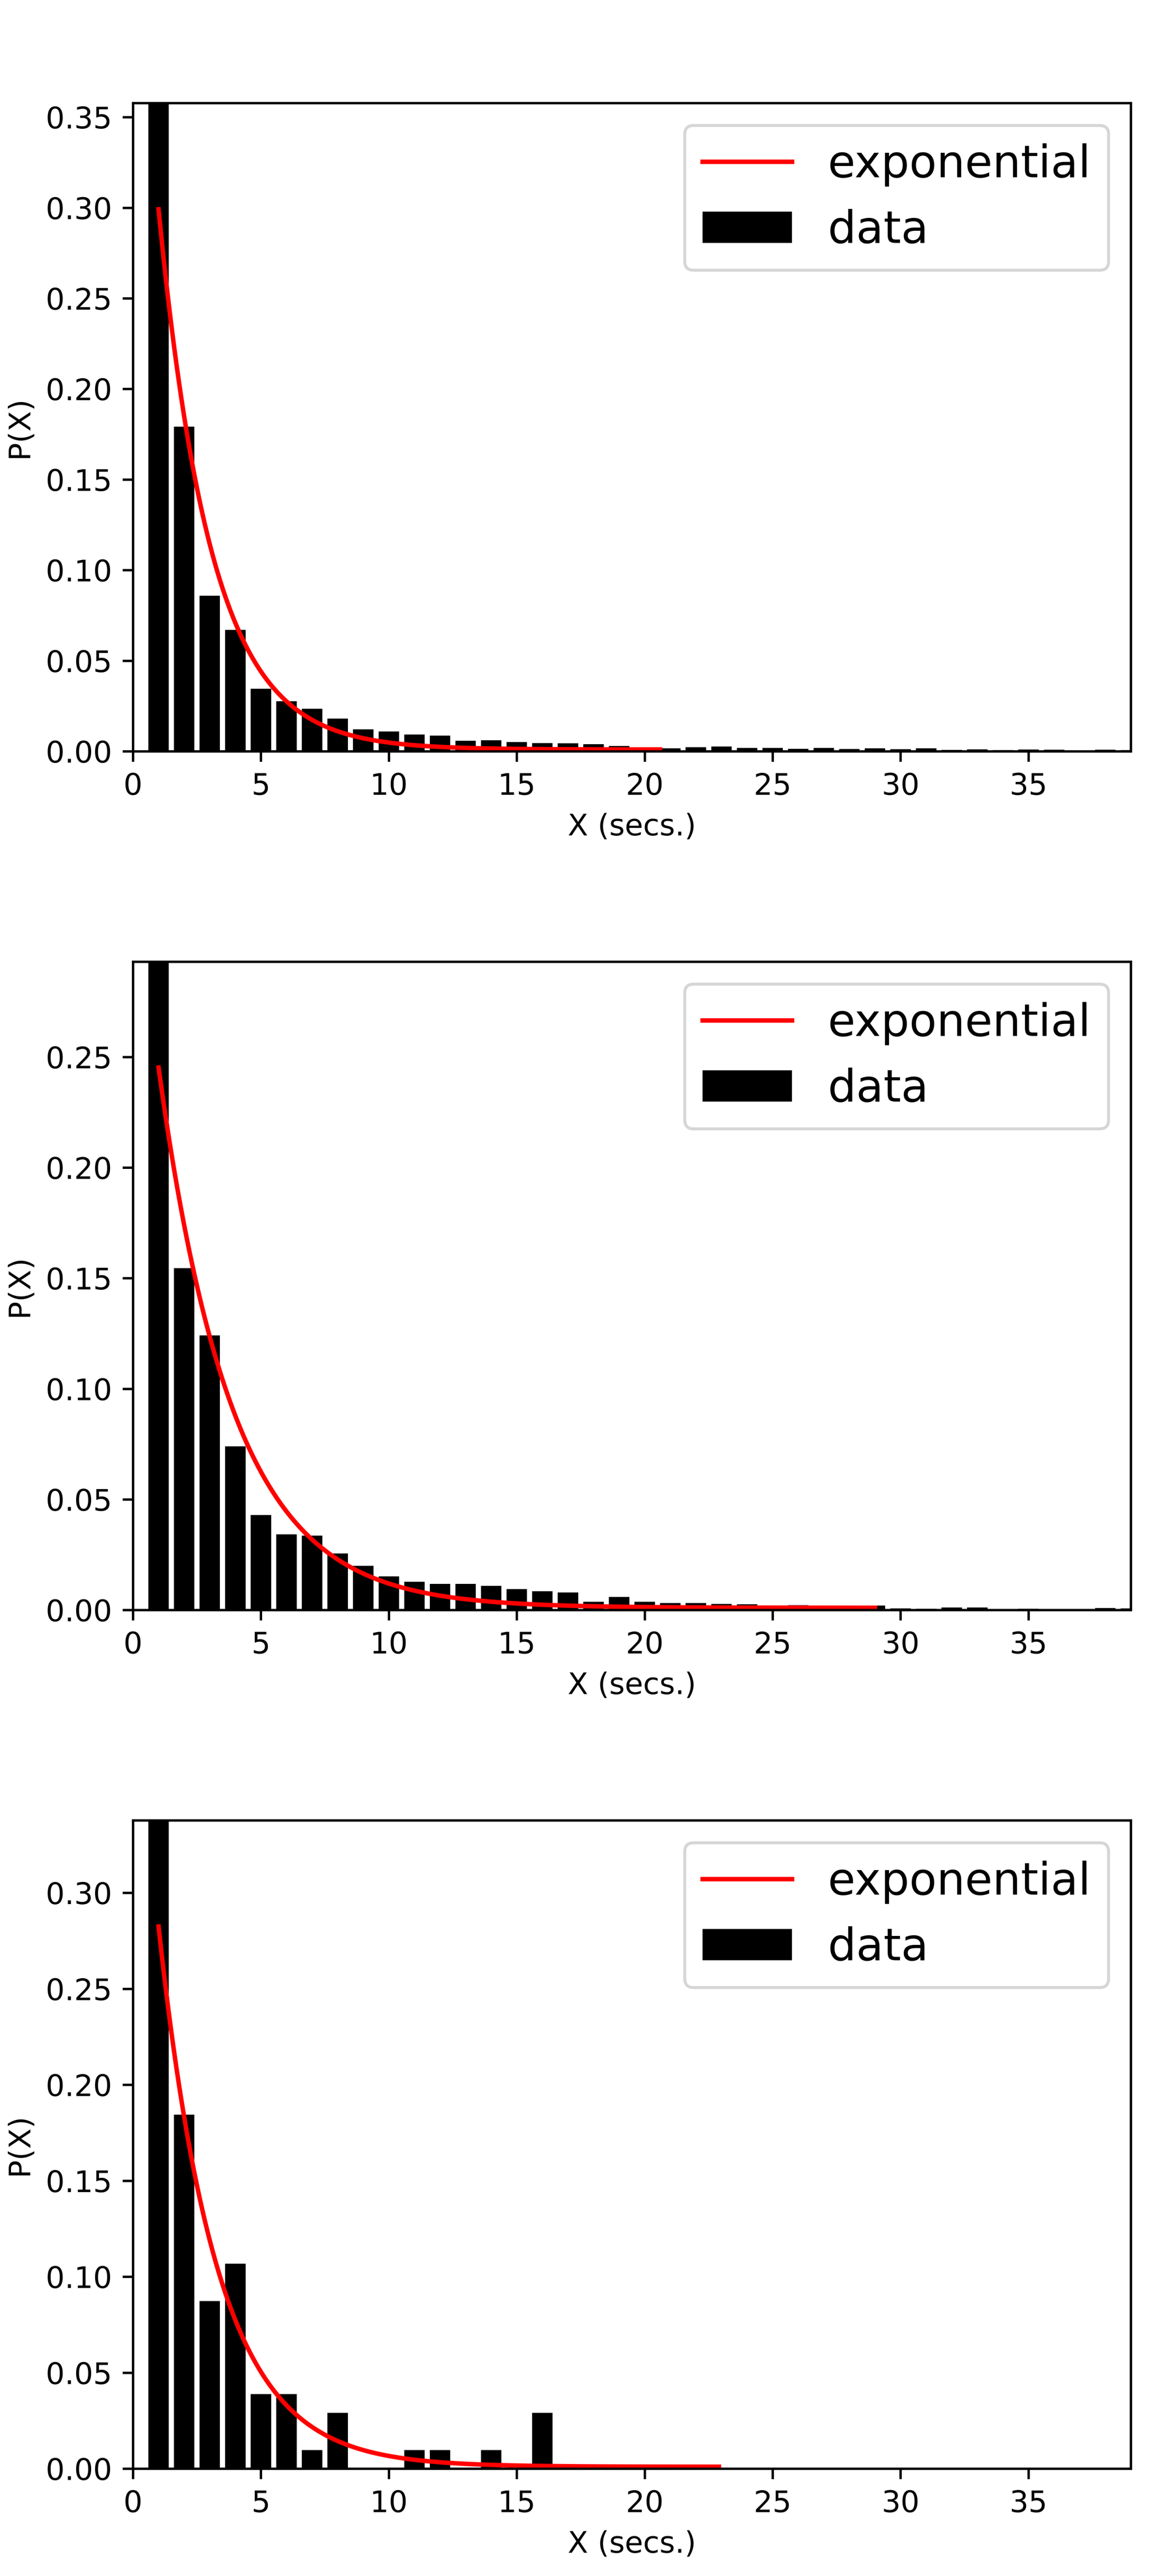
We investigated fitting distributions to the data to enable long-term comparison within the same subjects or among multiple subjects. The number of movement occurrences over a period of time (e.g., 1 minute, 1 hour) can be modeled with a Poisson distribution if we assume that movements occur independently. Then the inactivity period between any consecutive movement events can be modeled with an exponential distribution as:
| (7) |
where the maximum likelihood estimate of the parameter is the inverse of the mean of the data as .
4 Evaluation
4.1 Data Capture
The monitoring system was deployed in four households in the older adult community as an ethically approved human subject study. Residents ranged in age from 65 to 80 years old. For each participant house, the system captured data over a period of approximately three days. For the inactivity detection, all cameras were in the living room on a tripod, two observed a couch, one observed a chair, and the last one viewed both a chair and a couch. The RGB-D camera is an Intel RealSense D415 [26]; the processor is a Jetson Nano [27]. The overall dimensions of the system are less than 20 cm 10 cm 15 cm (excluding cables).
The camera captures color and depth imagery at a resolution of 640480. The images are processed by the processor, extracting the foreground and its features (e.g., human centroid, motion), and then the image is deleted. For the detection task, both depth and color images are used. 5 fps was observed when no one was present, and 3.5 fps was observed when someone was in view.
The monitors are camera-based, but the video frames are only temporally saved in the RAM for one second for analysis and then deleted. No images or videos are stored. Currently, the device has no internet connection, so there is no risk of hacking or people viewing the subject, not even researchers. All that is stored about the recorded events are when someone is seen at the monitored location, and how often they move. All detected events are stored anonymously in the form of text event logs. Each participant’s data was tagged with a unique participant ID. In total, 23,393 log events of inactivity (1s) were recorded.
4.2 Detection Accuracy
As the data is from anonymous monitoring in older adults’ homes, obtaining the ground truth of inactivity events is considered challenging. Therefore, the researchers conducted controlled experiments to evaluate the accuracy of the system.
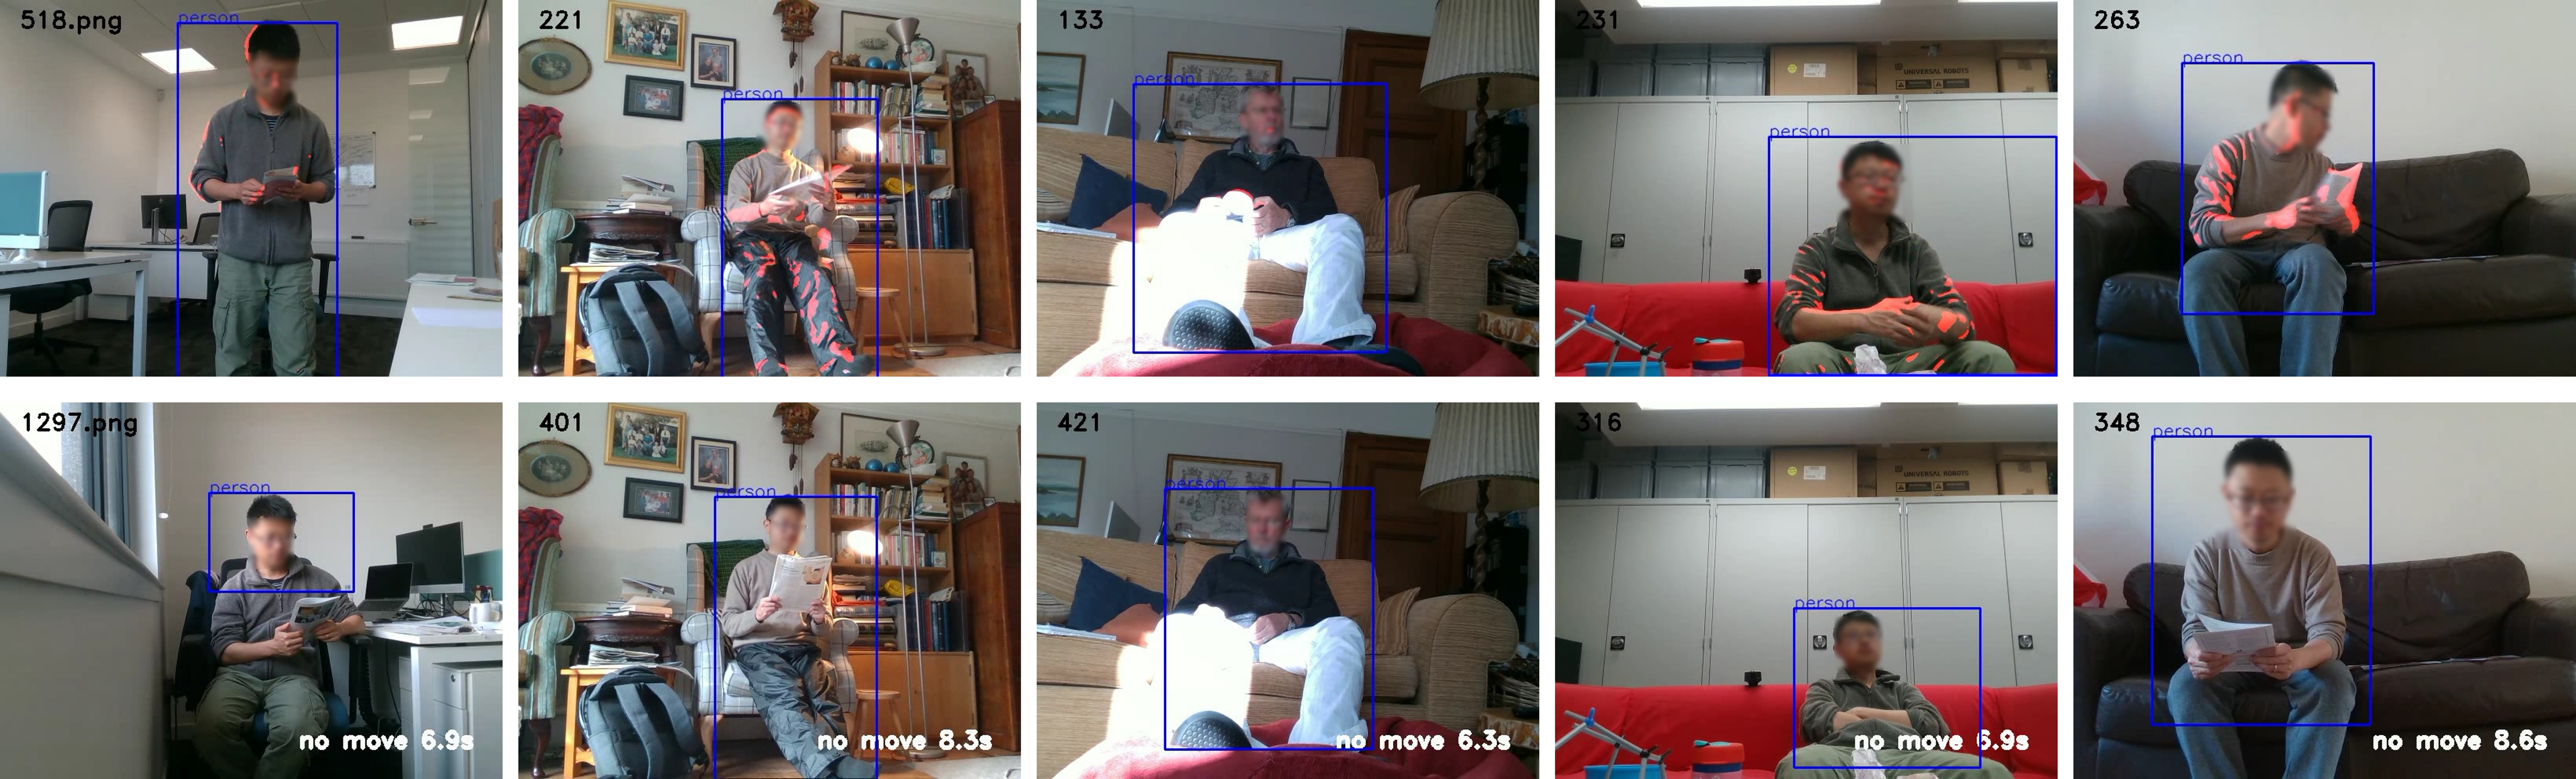
To evaluate the accuracy of the inactivity detection, video capture sessions with controlled motion and no-motion behaviors were conducted in laboratory, office, and homes, with five different background scenarios, as shown in Fig. 4. A person started with continuous movement (about 30 seconds), then went to no movement at all (about 10 seconds), and then started continuous movement again (about 20 seconds). This process was repeated 70 times and 70 short videos were recorded. The ground truth for these events, i.e., humans appear/disappear, movement starts/ends) is labeled manually as frame numbers in the videos.
| Tolerance | HuFP | HuFN | MoFP | MoFN |
|---|---|---|---|---|
| (frames) | () | () | () | () |
| 0 | 1.46 | 3.59 | 4.8 | 4.31 |
| 1 | 1.31 | 3.47 | 1.7 | 4.10 |
| 3 | 1.15 | 3.31 | 0 | 3.82 |
| 5 | 0.97 | 3.23 | 0 | 3.66 |
Four types of errors are evaluated frame-wise. Human detection false positives (HuFP) and false negatives (HuFN), and motion detection false positives (MoFP) and false negatives (MoFN), are shown in Table 1. 111From seventy video recordings with controlled motion/no-motion behaviors. To calculate the motion FN, we simply assume that during continuous movement periods, all frames are motion positive, although there are sometimes short pauses (1s) in transitions of body movement. During periods of complete motionlessness, all frames are labeled as motion-negative.
The results show that MoFP has a low error rate in all scenarios - from to when the temporal matching tolerance increases from 0 to 5 frames for the beginning/end moment of the completely no motion periods. This shows that, although a few frames of mismatch are tolerated at the beginning/end of the inactivity period, every no-motion frame is correctly detected in periods of inactivity, where the detection is insensitive to noise, i.e., the detection method can filter out all types of background noise or fake motion caused by lighting changes. MoFN is at 4.31% to 3.66% (0 to 5), indicating that several frames of true motion during continuous motion periods were missed. HuFP is 1.46% to 0.97% (0 to 5) in all frames and HuFN is 3.59% to 3.23% (0 to 5), which shows that the human detector (pre-trained YOLOv5) is more likely to miss real people than detecting background regions as humans in these experimental environments.
Temporal sensitivity. Another ground-truth recording session was conducted in the lab to evaluate the temporal accuracy of the inactivity detection task. The researchers collected 30 video clips of inactivity events (), subjectively noted the beginning and end moment of each event, and then compared these with the detected log. The temporal accuracy of the inactivity detection is 1.4 frames (at 3 to 5 fps).
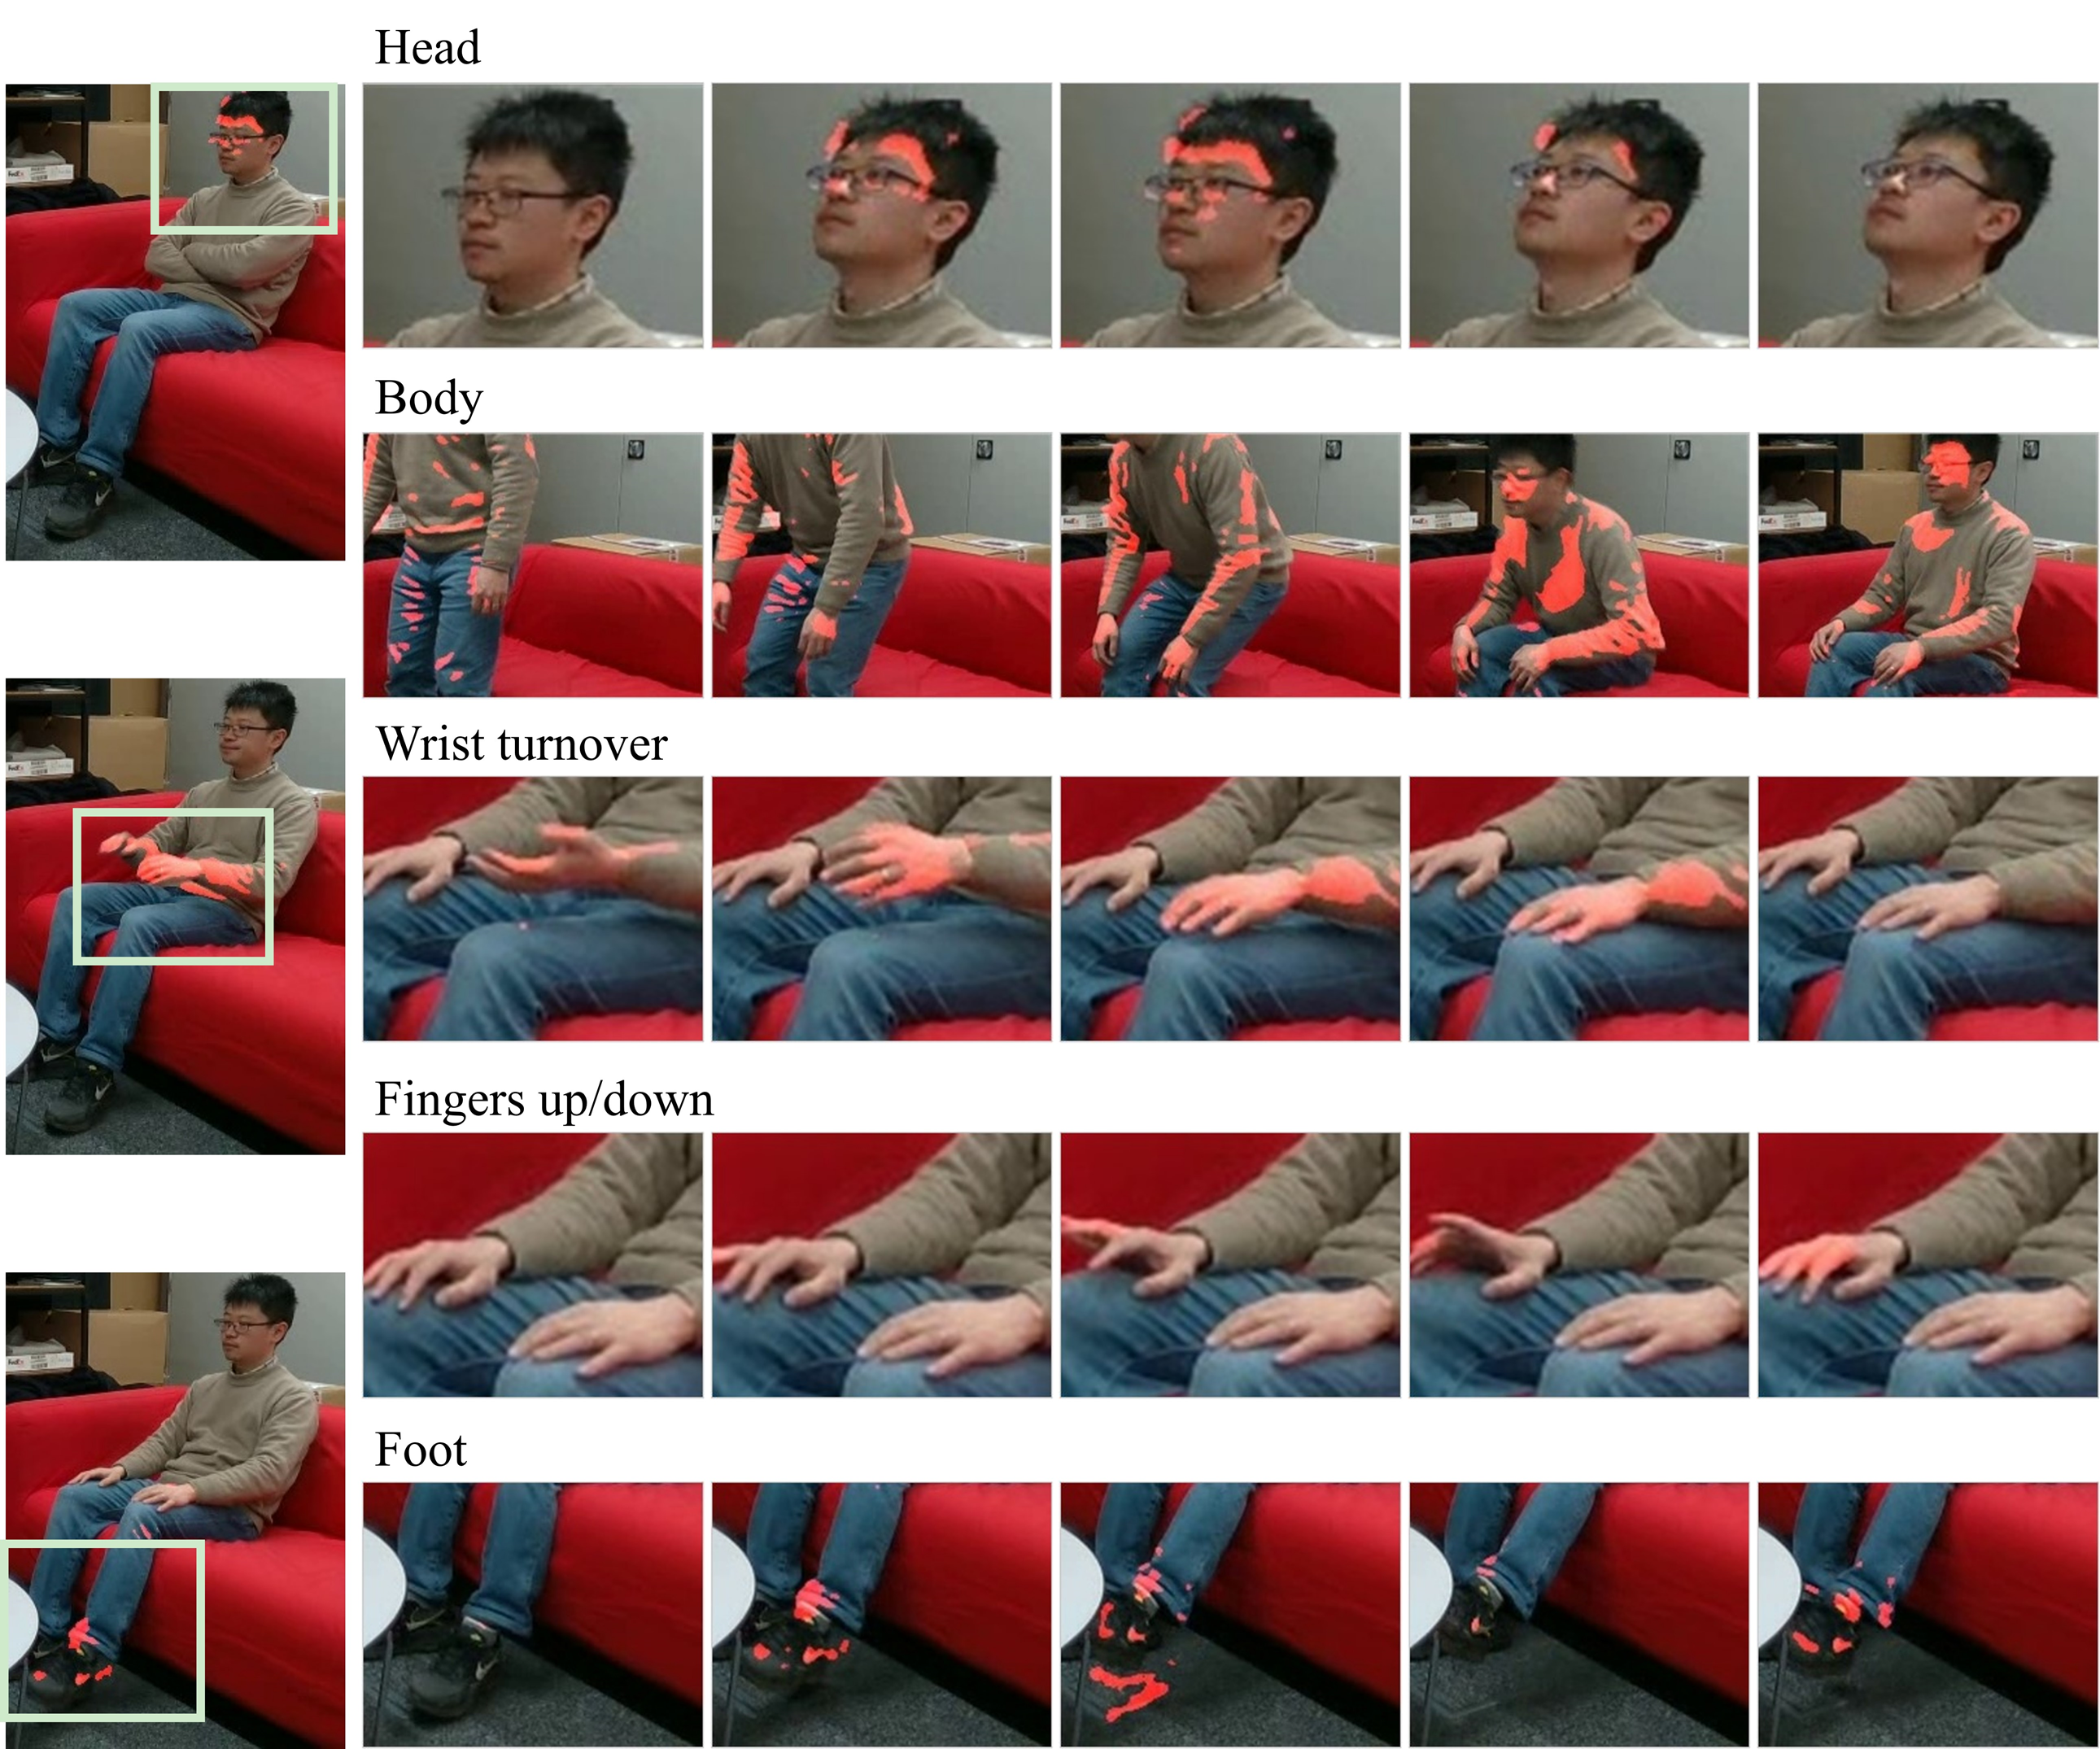
Spatial sensitivity. In a well-lit laboratory, subjects performed 5 physical movements monitored by a side-view camera 2.6 meters away. Movements evaluated were: body, wrist, finger, foot, each repeated 20 times (10 to the left, 10 to the right), and 40 head movements (20° each in four directions). The results demonstrate that the motion detection method has good sensitivity in a well-lit environment, with a true positive rate of 1.0 for detecting all five motion types, including both large movements (such as sitting) and small movements (such as finger lifting and head rotation). Fig. 5 illustrates the sensitivity of detecting human movements under different motion patterns.
| Lab (107) | ViTPose[39] | RAFT[40] | Ours | |||
|---|---|---|---|---|---|---|
| R | P | R | P | R | P | |
| body | 20/20 | 20/20 | 20/20 | 20/20 | 20/20 | 20/20 |
| head | 25/40 | 25/25 | 40/40 | 40/40 | 40/40 | 40/40 |
| wrist | 20/20 | 20/20 | 20/20 | 20/20 | 20/20 | 20/20 |
| finger | 0/20 | 0/0 | 19/20 | 19/19 | 20/20 | 20/20 |
| foot | 20/20 | 20/20 | 20/20 | 20/20 | 20/20 | 20/20 |
Robustness in low light conditions. Motion detection assessments were then performed under varying lighting conditions. The lighting condition has 5 levels from high to low, as daylight (Rec. 601 Luma 97), night light ( 75), low light ( 36), dim light ( 24), and dark ( 4). The cameras recorded the subjects’ activities with an oblique view at 1.5 meters. The detection performance is then evaluated by the number of motions missed given 20 ground-truth movements under each lighting condition. The results show that under the first four lighting conditions ( 24 to 97), 1 to 2 out of the 20 movements were not detected (error rate 5% to 10%); whereas in the darkest environment (), misdetection rate of true motions was 40% (8 out of 20 events were not detected), see Table 3. This indicates the limitation of the motion detection method under extremely low-lighting environments.
| Room Lighting | ViTPose[39] | RAFT[40] | Ours | |||
|---|---|---|---|---|---|---|
| R | P | R | P | R | P | |
| day (’97) | 16/20 | 16/17 | 16/20 | 16/17 | 19/20 | 19/19 |
| night (’75) | 19/20 | 19/21 | 17/20 | 17/17 | 18/20 | 18/18 |
| low (’36) | 20/20 | 20/200* | 19/20 | 19/39 | 19/20 | 19/19 |
| dim (’24) | nan^ | 15/20 | 15/210* | 18/20 | 18/18 | |
| dark (’4) | nan^ | nan^ | 12/20 | 12/12 | ||
| ^ : Excessive noise led to many false positives. | ||||||
| * : Approximated by the average ratio of the number of FP instances to | ||||||
| each TP instance. | ||||||
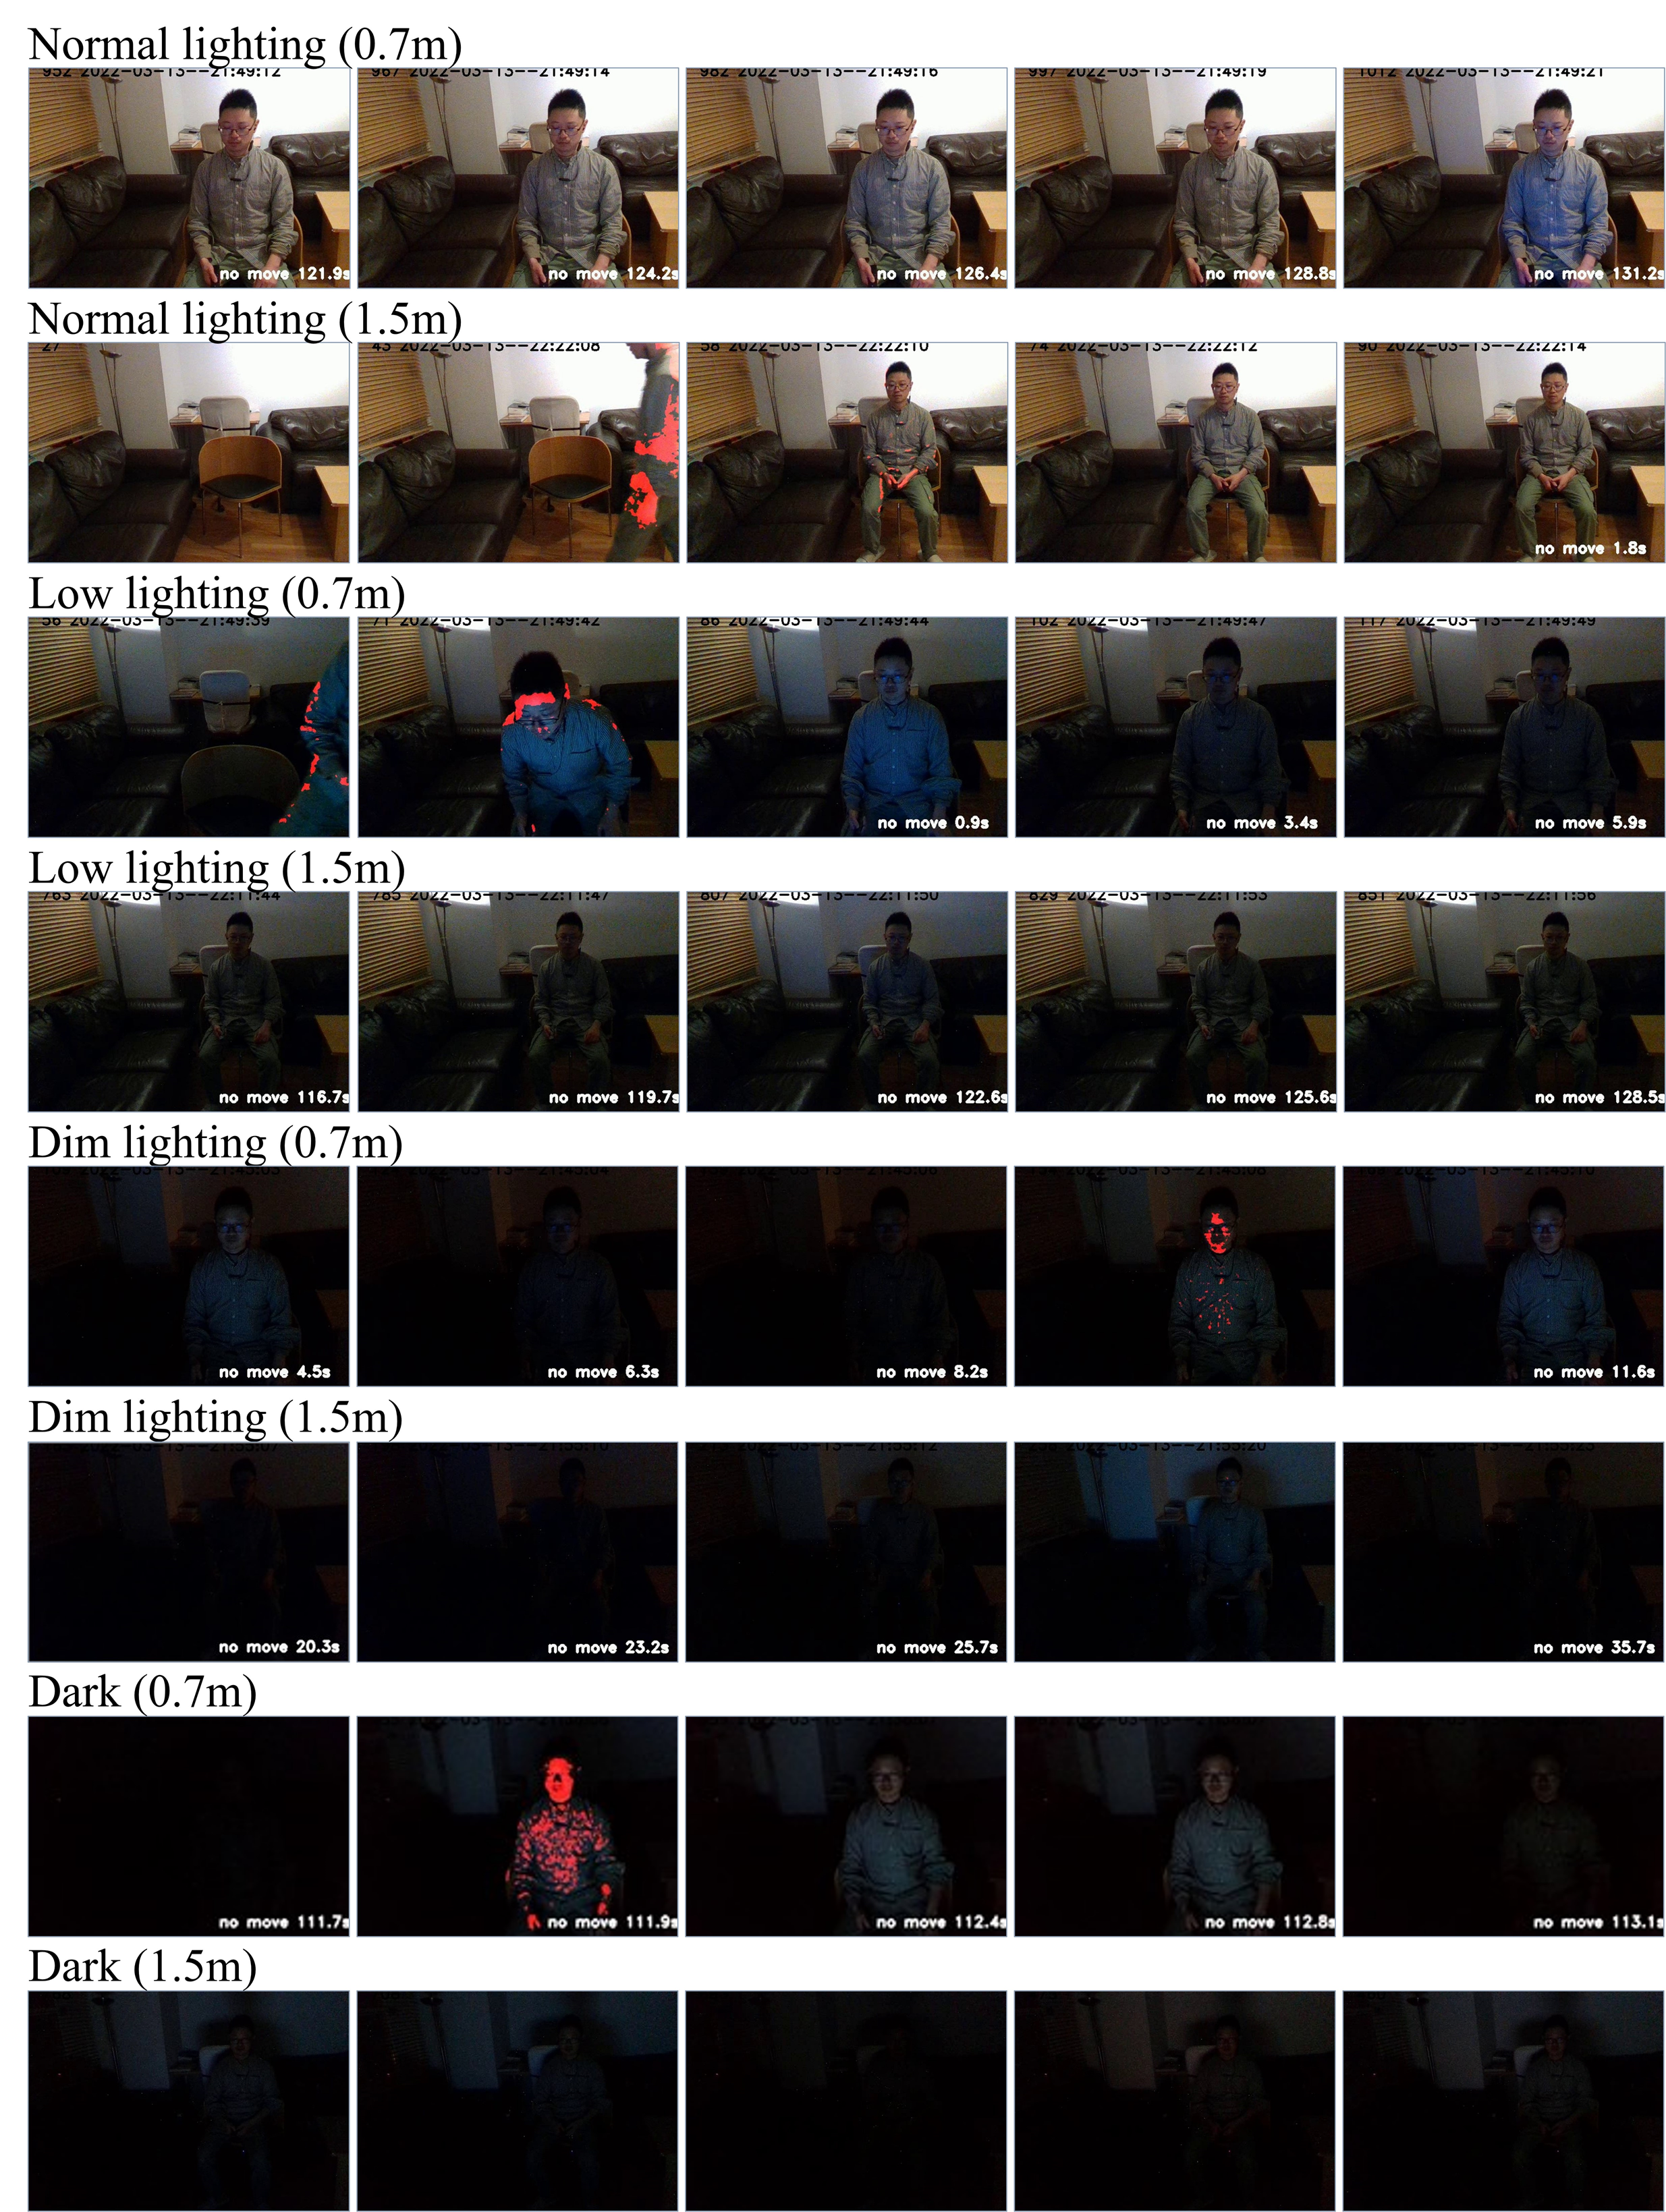
Robustness against TV light. As mentioned previously, watching TV is a common activity for older adults, especially in dimly lit rooms, where the light from the TV can easily scatter colors onto people to affect the chromatic-based detection methods. To test the robustness of the motion detection against changes in TV lighting, an experiment was conducted, under different room lights and at different distances from the TV. Subjects sat at 0.7 meters and 1.5 meters from the TV under 4 different room lighting conditions and then changed the TV light by changing the TV channel, 20 times at each environment setting. Examples are shown in Fig. 6. Detection accuracy is represented by the false positive rate. False positives occur when the TV light reflected onto the body is classified as motion. The results in Table 4 show that the false positive rates are 0% in all settings, except in the darkest and furthest condition (1.5 m, Luma ), where the person detector often failed to identify a person sitting in the scene. Although some changes in TV global illumination were detected (see Fig. 6), they were not classified as true motion by our method, as these changes only occurred shortly for 1 to 2 frames (less than 0.5 s and thus removed by the temporal filter).
| Lighting | TV Dis. | ViTPose[39] | RAFT[40] | Ours |
|---|---|---|---|---|
| FP | FP | FP | ||
| ’90 | 0.7m | 0/20 | 3/20 | 0/20 |
| 1.5m | 0/20 | 5/20 | 0/20 | |
| ’41 | 0.7m | 3/20 | 6/20 | 0/20 |
| 1.5m | 0/20 | 8/20 | 0/20 | |
| ’14 | 0.7m | 14/20 | nan^ | 0/20 |
| 1.5m | 19/20 | nan^ | 0/20 | |
| ’4 | 0.7m | 15/20 | nan^ | 0/20 |
| 1.5m | nan^ | nan^ | nan* | |
| ^ : Excessive noise led to many false positives. | ||||
| * : The human detector failed in the dark environment. | ||||
Robustness against pet motion. Two subjects participated in three inactivity trials in a home scenario with a cat present (Fig. 10). Each inactivity trial lasted approximately 10 continuous minutes, resulting in a total inactivity duration of about 30 minutes (10,898 frames). The object detector runs frame by frame to detect the cat’s region. The recall rate for the true human inactivity duration, both without and with the removal of the pet region by the object detector, is presented in Table 7. This rate is calculated as the ratio of recalled inactivity seconds to the total inactivity seconds.
Without removing the pet region, an average of 63.7% of the true human inactivity duration was recalled. With the removal of the pet region during inactivity detection, the recall rate for the true human inactivity duration improved to 82.4%.
When the pet moved around, it introduced random motions that significantly affected the accuracy of human inactivity detection. We can see that even with pet detection to mitigate its influence, the accuracy remained around 0.8. The primary reason for this limitation was the pre-trained object detector’s failure to detect the pet under certain conditions, such as specific poses or when the pet was moving quickly (resulting in motion blur), as illustrated in Fig. 10 (c) and (d). Enhancing the pet detector can help address this problem, but this falls outside the scope of the current study.
| Trail | Ours (without | Ours (with | ViTPose[39] | RAFT[40] |
|---|---|---|---|---|
| pet removal) | pet removal) | |||
| T1 | 59.8% | 74.6% | 94.30% | 52.60% |
| T2 | 69.4% | 85.5% | 97.70% | 47.90% |
| T3 | 60.3% | 85.8% | 60.5% | 68.10% |
| Avg. | 63.7% | 82.4% | 83.3% | 56.30% |
SOTA comparison. Two state-of-the-art motion detection methods are compared. One is a kinetic-based pose estimation method, ViTPose [39]; the other is an optical flow-based method, RAFT [40]. Both methods are pre-trained on transformer-based deep neural networks. We use the pre-trained coefficients of the networks and tune both methods to small motion sensitivity levels while keeping the upper bound of the noise threshold to remove as much noise as possible. The results are illustrated in Tables 2 – 5.
The Kinect-based model missed all the finger motion and 25% of the head motion since it only estimated the main body joints, not as fine-grained as the optical-flow-based and our methods to detect the body motion (Table 2). With the pre-trained models, both compared methods performed worse in low light and TV flickering conditions compared to our method (Table 3 and 4). As illustrated in Fig. 9, the optical flow-based method exhibited significant noise in non-human regions in low lighting conditions, whereas the pose-based method could detect human joints but exhibited substantial jitters, even when the person was remained inactive. For the pet motion test, flow-based methods were easily affected by both pet and background tree movement, whereas kinetic-based methods detected only human joints and achieved comparable performance with our method (Table 5). The results show that compared to SOTA pre-trained models, our method excelled in accurately detecting small body motion, demonstrated robustness in low-light conditions, as well as resistance to environmental factors such as TV light flickering and the presence of pets.
4.3 Statistical Results
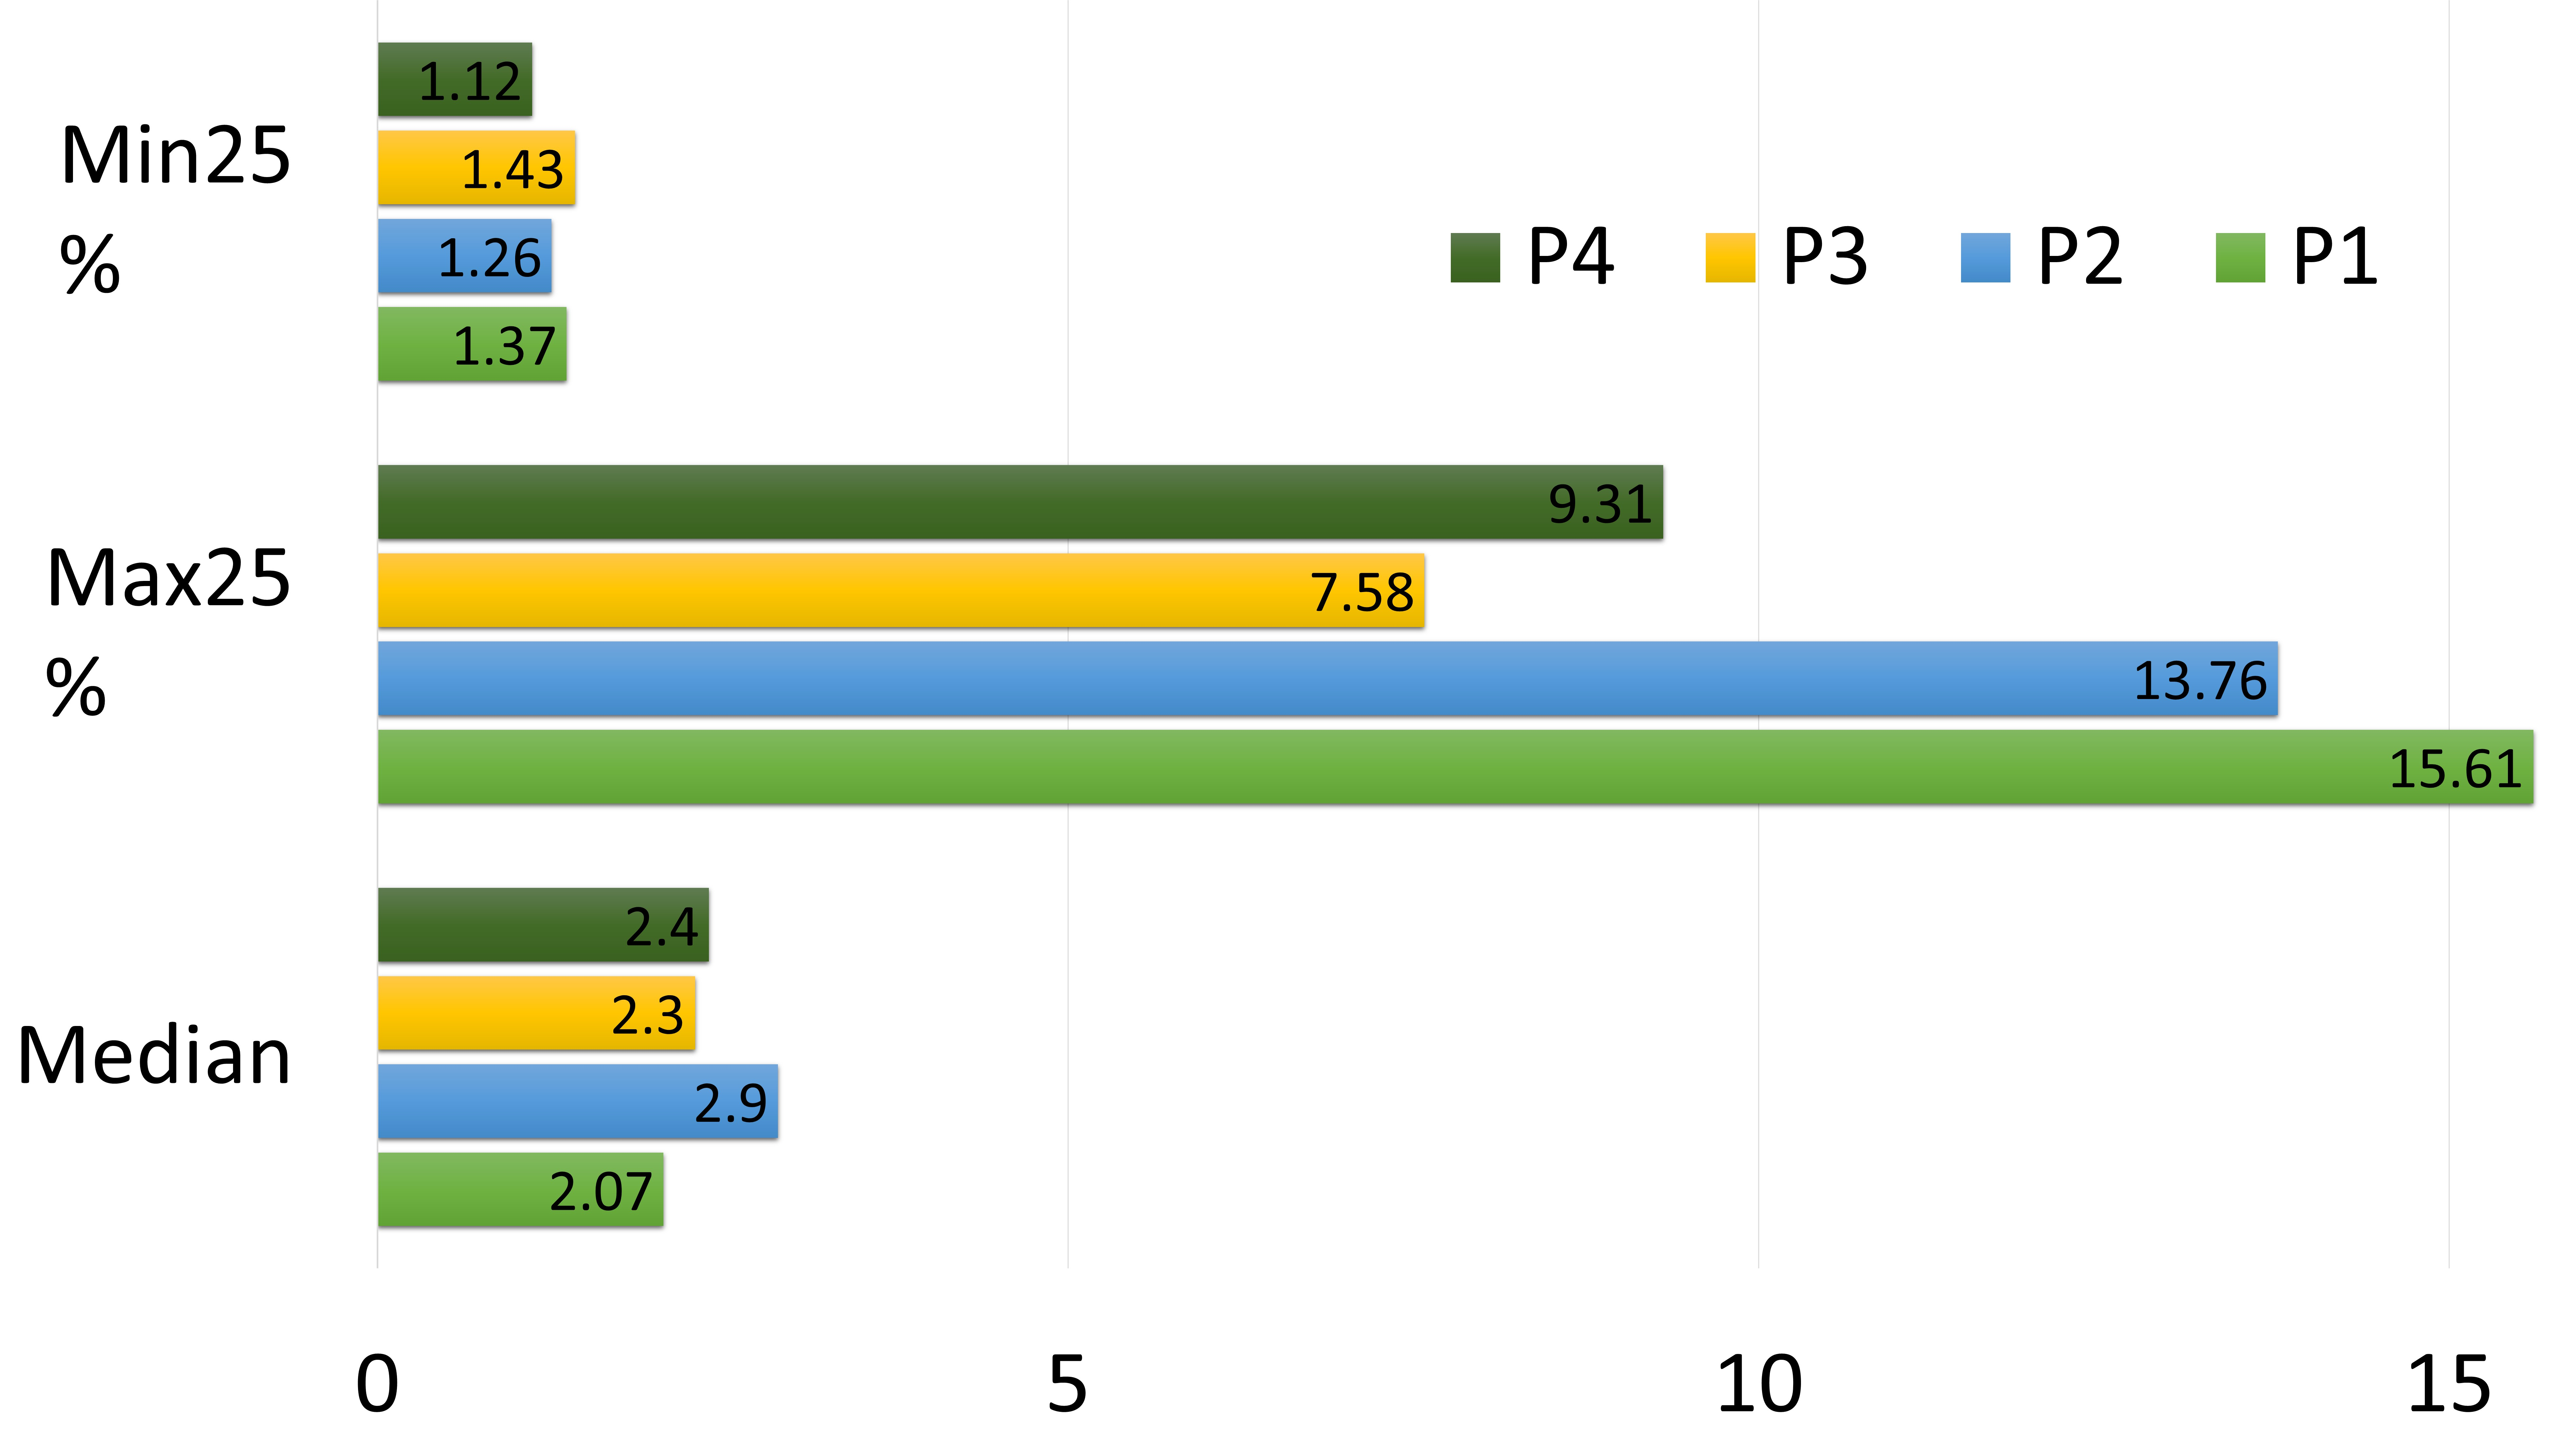
Fig. 7 shows inactivity statistics of four older adult participants on a chair or couch in the living room. A median of 2.0 to 2.9 seconds for periods of non-movement was detected across all participants, with the minimum 25% intervals of 1.0 to 1.5 seconds. When the maximum 25% periods of inactivity periods are considered, the durations varied between participants, ranging from 7.5 seconds to 15.6 seconds. This demonstrated that a person tends to remain completely still for only very short periods of time when they are awake. Table 6 summarizes these statistics.
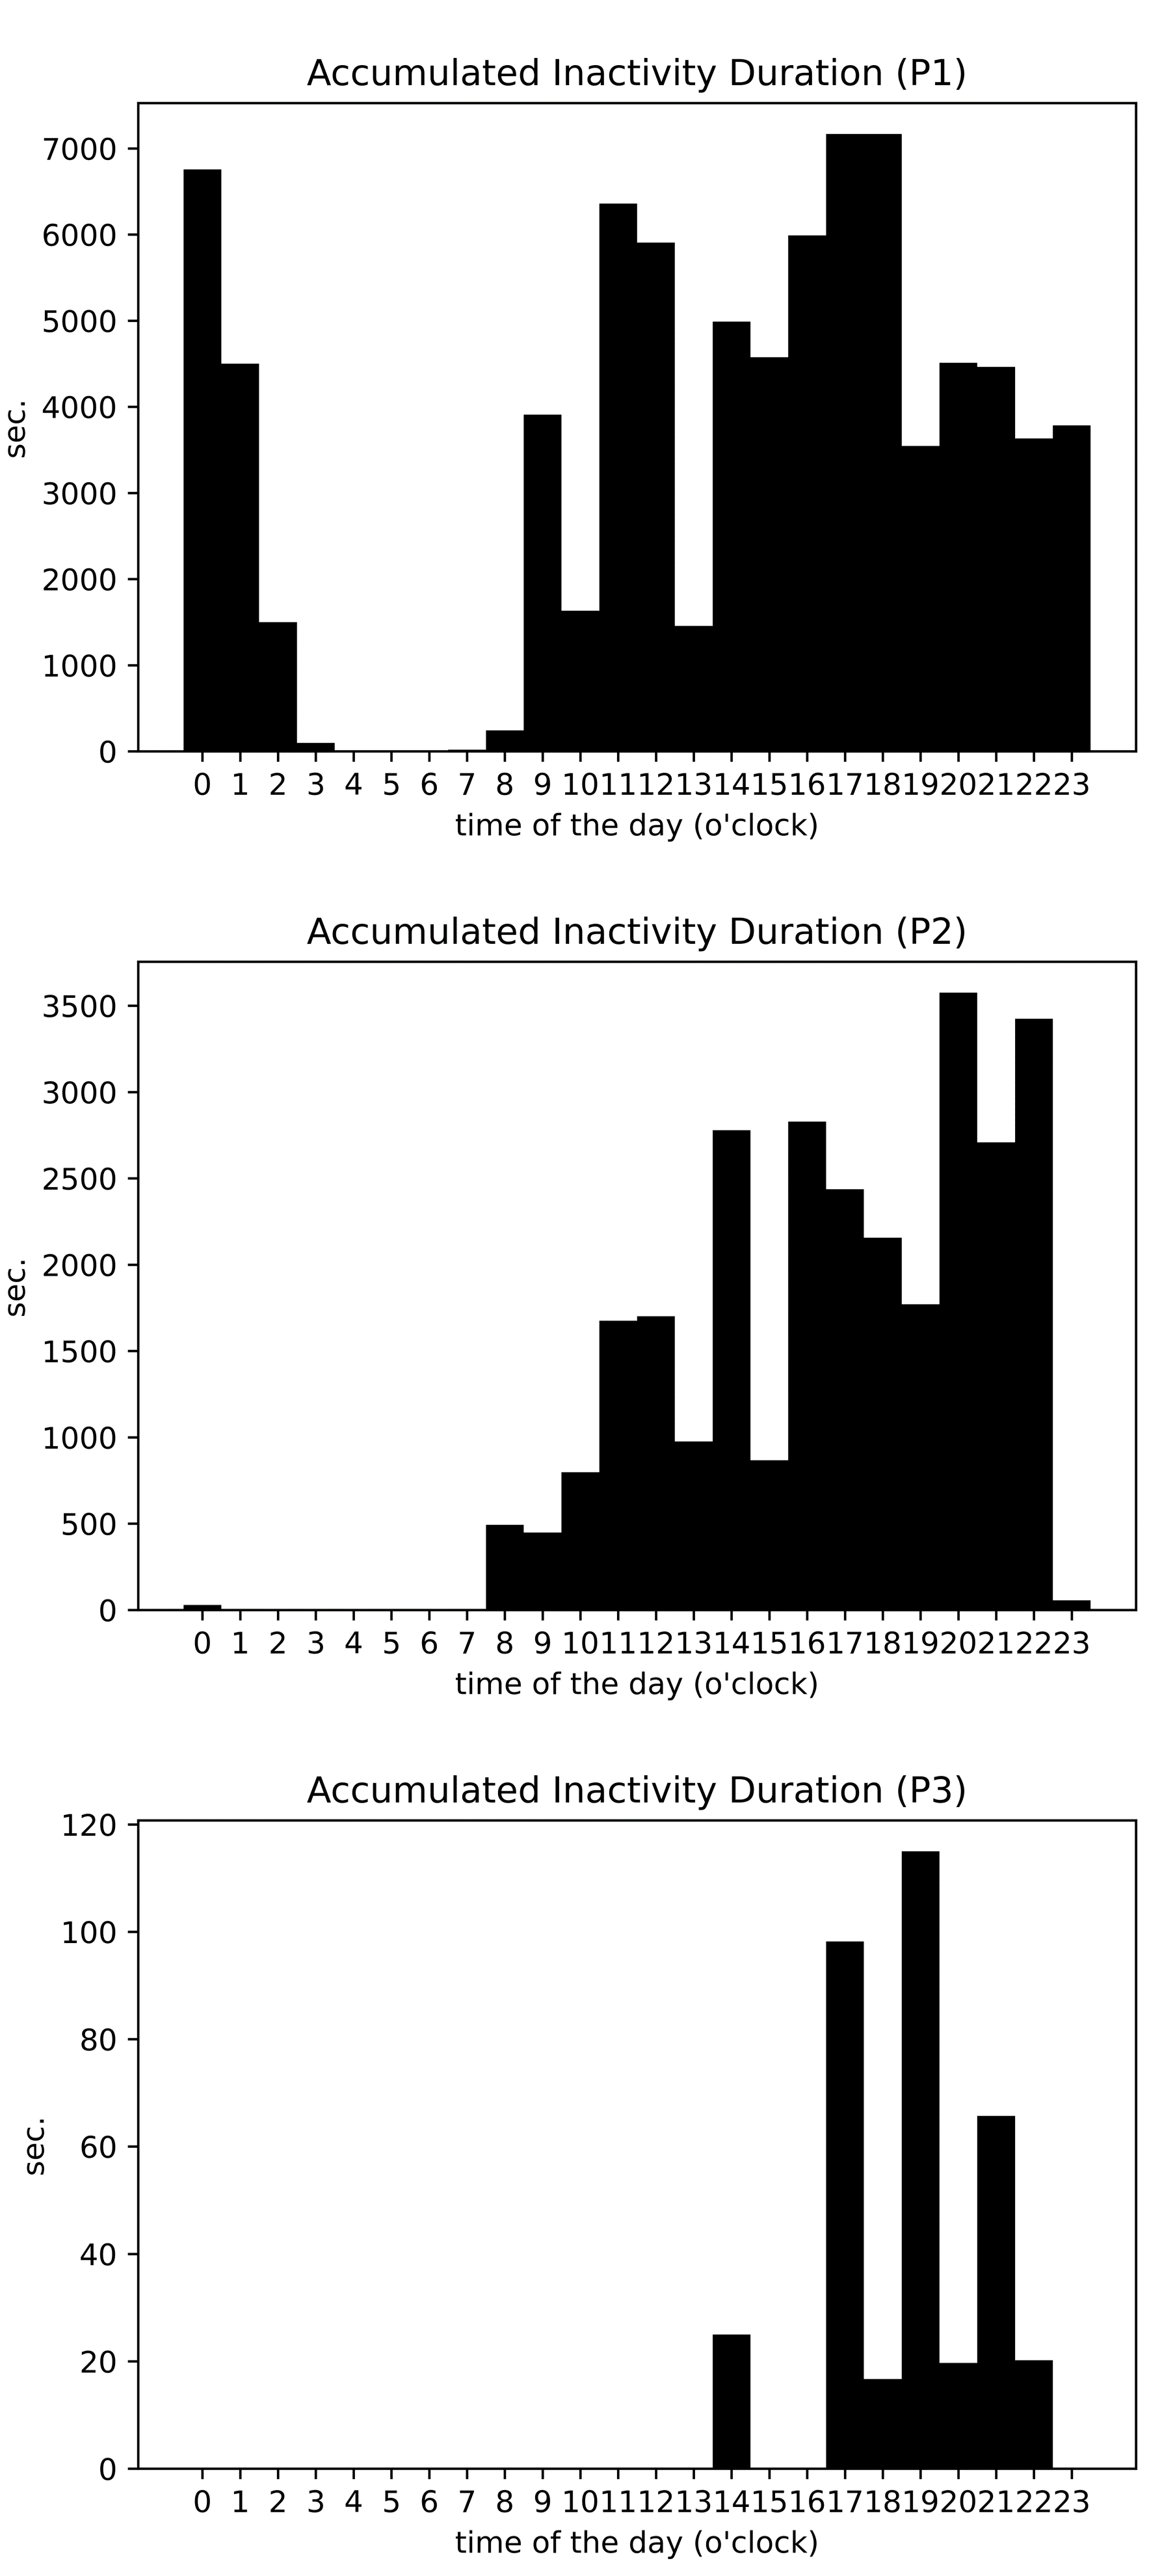
Table 7 depicts the overall percentages of inactivity periods in different time ranges among all participants, showing that more than 90% of the inactivity instances were under 10 seconds, and approximately 99% of the instances were under 30 seconds. On the other hand, several periods of inactivity over 100 seconds and one over 800 seconds were observed from Participant 1, who was napping on the couch at the time. Fig. 8 shows an example of monitoring data for Participant 4, where the participant’s presence was between 10 am and 22 pm, with a peak inactivity duration at 19 pm. Meanwhile, the exponential distribution fits all the inactivity data well (see also Fig. 11 for Participants 1-3).
| Median | Max25% | Min25% | |
|---|---|---|---|
| P1 | 2.07 | 15.61 | 1.37 |
| P2 | 2.90 | 13.76 | 1.26 |
| P3 | 2.30 | 7.58 | 1.43 |
| P4 | 2.40 | 9.31 | 1.12 |
| Time range (s) | [1,2) | [2,5) | [5,10) | [10,30) | [30,60) | [60,200) | [200,500) | 500+ |
|---|---|---|---|---|---|---|---|---|
| P1 | 44.74% | 33.22% | 11.60% | 8.08% | 1.75% | 0.55% | 0.03% | 0.03% |
| P2 | 35.46% | 35.28% | 15.64% | 12.33% | 1.15% | 0.13% | 0.02% | 0.00% |
| P3 | 44.66% | 37.86% | 11.65% | 5.83% | 0.00% | 0.00% | 0.00% | 0.00% |
| P4 | 39.33% | 38.80% | 14.02% | 7.45% | 0.35% | 0.04% | 0.00% | 0.00% |
| Avg. | 41.05% | 36.29% | 13.23% | 8.42% | 0.81% | 0.18% | 0.01% | 0.01% |
| Cumulative | 41.05% | 77.34% | 90.57% | 98.99% | 99.80% | 99.98% | 99.99% | 100% |
5 Conclusion
A system for inactivity detection in older adult residents’ homes using an RGB-D camera and a small computer processor is presented. Collecting several days of data from each local household characterized the device’s performance under real-home conditions. The method is tested in different living environments and various lighting conditions. Data processing for analysis is carried out in real time. The system runs the inactivity detection task at 3–5 frames per second. The devices are small, anonymous, unobtrusive, and low-cost, which can be distributed well at homes for long-term use. A lack of motion is unlikely to be missed (a 0% false positive rate with 3 frames temporal tolerance), and a 3% false negative rate of missing true body motion on controlled short-term experiments. True lack of motion is likely to be long-term and this will be noticed. The recorded anonymized data can reveal the activity characteristics of older adults, such as daily habits of body movement patterns while staying at their favorite home places.
The main limitation of the described method is its performance in extremely dark environments, where the object detector often fails to detect a person or a pet. Additionally, the study faces constraints related to the small dataset and the lack of ground truth for real-life data.
Future work should focus on enhancing detection methods, capturing long-term personalized behavioral profiles of individual older adults to identify slowly deteriorating conditions, and designing decision rules based on historical patterns to provide warnings about potentially dangerous medical situations.
References
- [1] Narimasa KUMAGAI, ”Care Preferences of Elderly People Living Alone in Japan,” Health Education and Public Health, 1(2): 101 – 109, 2018.
- [2] Office for National Statistics, ”People living alone aged 65 years old and over, by specific age group and sex, UK, 1996 to 2019” [Online]. Available: Link, Accessed on: March. 2022
- [3] Ausubel Jacob, ”Older people are more likely to live alone in the US than elsewhere in the world,” Pew Research Center, 2020. [Online]. Available: Link
- [4] Acl.gov, ”2020 PROFILE OF OLDER AMERICANS,” 5, 2021. [Online]. Available: Link
- [5] Cacioppo John T., and Stephanie Cacioppo. ”Older adults reporting social isolation or loneliness show poorer cognitive function 4 years later,” Evidence-based nursing 17.2: 59-60, 2014.
- [6] Juntapim, S. ”Mental Health Problem in Older Adults Living Alone: Challenges Issues,” Am J Nurs Stud 1.1 (2020): 1007.
- [7] NHS, ”Help at home from a paid carer,” [Online]. Available: Link, Accessed on: March.2022
- [8] Mariñansky C I, Jauregui J R. Immobility Syndrome[J]. Frailty and Kidney Disease: A Practical Guide to Clinical Management, 2021: 37-45.
- [9] Dreyer K, Steventon A, Fisher R, et al, ”The association between living alone and health care utilization in older adults: a retrospective cohort study of electronic health records from a London general practice,” BMC geriatrics, 18(1): 1-7, 2018.
- [10] Pleschberger S, Reitinger E, Trukeschitz B, et al, ”Older people living alone (OPLA)–non-kin-carers’ support towards the end of life: qualitative longitudinal study protocol,” BMC geriatrics, 19(1): 1-8, 2019.
- [11] Reddy, Sandeep, John Fox, and Maulik P. Purohit, ”Artificial intelligence-enabled healthcare delivery,” Journal of the Royal Society of Medicine, 112.1: 22-28, 2019.
- [12] Stone E E, Skubic M, ”Fall detection in homes of older adults using the Microsoft Kinect,” IEEE journal of biomedical and health informatics, 19(1): 290-301, 2014.
- [13] Kittipanya-Ngam, Panachit, Ong Soh Guat, and Eng How Lung, ”Computer vision applications for patients monitoring system,” 15th International Conference on Information Fusion, IEEE, 2012.
- [14] Tsukiyama Toshifumi, ”In-home health monitoring system for solitary elderly,” Procedia Computer Science, 63: 229-235, 2015.
- [15] Demiris G, Oliver D P, Giger J, et al, ”Older adults’ privacy considerations for vision based recognition methods of eldercare applications, Technology and Health Care,” 17(1): 41-48, 2009.
- [16] Demiris G, Rantz M J, Aud M A, et al, ”Older adults’ attitudes towards and perceptions of ‘smart home’ technologies: a pilot study,” Medical informatics and the Internet in medicine, 29(2): 87-94, 2004.
- [17] Trivedi D, Badarla V, ”Occupancy detection systems for indoor environments: A survey of approaches and methods,” Indoor and Built Environment, 29(8): 1053-1069, 2020.
- [18] Xia L, Chen C C, Aggarwal J K, ”Human detection using depth information by Kinect,” CVPR 2011 workshops, IEEE, 15-22, 2011.
- [19] Cho S I, Kang S J, ”Real-time people counting system for customer movement analysis,” IEEE Access, 6: 55264-55272, 2018.
- [20] Jodoin P M, Pierard S, Wang Y, et al, ”Overview and benchmarking of motion detection methods, Background Modeling and Foreground Detection for Video Surveillance,” 2014.
- [21] Elgammal A, Harwood D, Davis L. ”Non-parametric model for background subtraction,” European conference on computer vision, Springer, 751-767, 2000.
- [22] Benezeth Y, Jodoin P M, Emile B, et al, ”Comparative study of background subtraction algorithms,” Journal of Electronic Imaging, 19(3): 033003, 2010.
- [23] Wren C, ”Real-time tracking of the human body,” Photonics East, SPIE, 2615, 1995.
- [24] Elgammal A, Duraiswami R, Harwood D, et al, ”Background and foreground modeling using nonparametric kernel density estimation for visual surveillance,” Proceedings of the IEEE, 90(7): 1151-1163, 2002.
- [25] Stauffer C, Grimson W E L, ”Learning patterns of activity using real-time tracking,” IEEE Transactions on pattern analysis and machine intelligence, 22(8): 747-757, 2000.
- [26] Intel RealSense D415, [Online]. Available: Link, Accessed: March.2022
- [27] Jetson Nano, [Online]. Available: Link, Accessed on: March.2022
- [28] Singla N. Motion detection based on frame difference method[J]. International Journal of Information and Computation Technology, 2014, 4(15): 1559-1565.
- [29] Paul M, Haque S M E, Chakraborty S. Human detection in surveillance videos and its applications-a review[J]. EURASIP Journal on Advances in Signal Processing, 2013, 2013(1): 1-16.
- [30] Zhang S, McCullagh P, Nugent C, et al. A theoretic algorithm for fall and motionless detection[C]//2009 3rd International Conference on Pervasive Computing Technologies for Healthcare. IEEE, 2009: 1-6.
- [31] Andrews J, Kowsika M, Vakil A, et al. A motion induced passive infrared (PIR) sensor for stationary human occupancy detection[C]//2020 IEEE/ION position, location and navigation symposium (PLANS). IEEE, 2020: 1295-1304.
- [32] Li H, He X, Chen X, et al. Wi-motion: A robust human activity recognition using WiFi signals[J]. IEEE Access, 2019, 7: 153287-153299.
- [33] Chen H H, Lin C L, Chang C H. WiFi-Based Detection of Human Subtle Motion for Health Applications[J]. Bioengineering, 2023, 10(2): 228.
- [34] Kang S, Jang M, Lee S. Identification of human motion using radar sensor in an indoor environment[J]. Sensors, 2021, 21(7): 2305.
- [35] Wang T, Cook D J, Fischer T R. The Indoor Predictability of Human Mobility: Estimating Mobility With Smart Home Sensors[J]. IEEE Transactions on Emerging Topics in Computing, 2022, 11(1): 182-193.
- [36] Bertram J, Krüger T, Röhling H M, et al. Accuracy and repeatability of the Microsoft Azure Kinect for clinical measurement of motor function[J]. Plos one, 2023, 18(1): e0279697.
- [37] Stenum J, Rossi C, Roemmich R T. Two-dimensional video-based analysis of human gait using pose estimation[J]. PLoS computational biology, 2021, 17(4): e1008935.
- [38] Zak M, Wasik M, Sikorski T, et al. Rehabilitation in Older Adults Affected by Immobility Syndrome, Aided by Virtual Reality Technology: A Narrative Review[J]. Journal of Clinical Medicine, 2023, 12(17): 5675.
- [39] Xu Y, Zhang J, Zhang Q, et al. Vitpose: Simple vision transformer baselines for human pose estimation[J]. Advances in Neural Information Processing Systems, 2022, 35: 38571-38584.
- [40] Teed Z, Deng J. Raft: Recurrent all-pairs field transforms for optical flow[C]//Computer Vision–ECCV 2020: 16th European Conference, Glasgow, UK, August 23–28, 2020, Proceedings, Part II 16. Springer International Publishing, 2020: 402-419.
[![[Uncaptioned image]](/html/2311.02249/assets/longfei.png) ]Longfei Chen
received a BE (Electrical Engineering, Sichuan Agricultural, 2011),
an MSc (Electrical Engineering, Sichuan, 2014),
and a PhD (Electrical Engineering, Kyoto, 2020).
His research interests encompass visual sensing, human behavior analysis, temporal modeling,
and egocentric vision.
He currently holds the position of research associate at the School of Informatics,
the University of Edinburgh, and previously served as a researcher at Kyoto University
from 2018 to 2021.
]Longfei Chen
received a BE (Electrical Engineering, Sichuan Agricultural, 2011),
an MSc (Electrical Engineering, Sichuan, 2014),
and a PhD (Electrical Engineering, Kyoto, 2020).
His research interests encompass visual sensing, human behavior analysis, temporal modeling,
and egocentric vision.
He currently holds the position of research associate at the School of Informatics,
the University of Edinburgh, and previously served as a researcher at Kyoto University
from 2018 to 2021.
[![[Uncaptioned image]](/html/2311.02249/assets/Bob2small.png) ]
Robert B. Fisher received a BS (Mathematics,
California Institute of Technology, 1974), MS (Computer Science,
Stanford, 1978) and a PhD (Edinburgh, 1987).
Since then, Bob has been an academic at Edinburgh University,
including being College Dean of Research.
He has been the Education Committee and Industrial
Liaison Committee chairs for the Int. Association for Pattern Recognition,
of which he is currently the association Treasurer.
His research covers topics mainly in high level computer vision and 3D
and 3D video analysis,
focussing on reconstructing geometric models from existing
examples, which contributed to a spin-off company, Dimensional Imaging.
The research has led to 5 authored books
and 300+ peer-reviewed scientific articles or book chapters.
He has developed several on-line computer vision resources, with over
1 million hits.
Most recently, he has been the coordinator
of EC projects 1) acquiring and analysing video data of 1.4 billion
fish from over about 20 camera-years of undersea video of tropical coral reefs
and 2) developing a gardening robot (hedge-trimming and rose pruning).
He is a Fellow of the Int. Association for Pattern Recognition (2008)
and the British Machine Vision Association (2010).
]
Robert B. Fisher received a BS (Mathematics,
California Institute of Technology, 1974), MS (Computer Science,
Stanford, 1978) and a PhD (Edinburgh, 1987).
Since then, Bob has been an academic at Edinburgh University,
including being College Dean of Research.
He has been the Education Committee and Industrial
Liaison Committee chairs for the Int. Association for Pattern Recognition,
of which he is currently the association Treasurer.
His research covers topics mainly in high level computer vision and 3D
and 3D video analysis,
focussing on reconstructing geometric models from existing
examples, which contributed to a spin-off company, Dimensional Imaging.
The research has led to 5 authored books
and 300+ peer-reviewed scientific articles or book chapters.
He has developed several on-line computer vision resources, with over
1 million hits.
Most recently, he has been the coordinator
of EC projects 1) acquiring and analysing video data of 1.4 billion
fish from over about 20 camera-years of undersea video of tropical coral reefs
and 2) developing a gardening robot (hedge-trimming and rose pruning).
He is a Fellow of the Int. Association for Pattern Recognition (2008)
and the British Machine Vision Association (2010).