\colorblackThe first ground-based detection of the 752 GHz water line in local ultra-luminous infrared galaxies using APEX-SEPIA
Abstract
We report the first ground-based detection of the water line p-H2O () at 752.033 GHz in three ultra-luminous infrared galaxies (ULIRGs): IRAS 06035-7102, IRAS 17207-0014 and IRAS 09022-3615. Using the Atacama Pathfinder EXperiment (APEX), with its Swedish-ESO PI Instrument for APEX (SEPIA) band-9 receiver, we detect this H2O line with overall signal-to-noise ratios of 8–10 in all three galaxies. Notably, this is the first detection of this line in IRAS 06035-7102. Our new APEX-measured fluxes, between 145 to 705 Jy km s-1, are compared with previous values taken from Herschel SPIRE FTS. We highlight the great capabilities of APEX for resolving the H2O line profiles \colorblackwith high spectral resolutions while also improving by a factor of two the significance of the detection within moderate integration times. While exploring the correlation between the p-H2O(211–202) and the total infrared luminosity, our galaxies are found to follow the trend at the bright end of the local ULIRG’s distribution. The p-H2O(211–202) line spectra are compared to the mid- CO \colorblack and HCN spectra, and dust continuum previously observed with ALMA. In the complex interacting system IRAS 09022-3615, \colorblackthe profile of the water emission line is offset in velocity with respect to the ALMA CO() emission. For IRAS 17207-0014 and IRAS 06035-7102, the profiles between the water line and the CO lines are spectroscopically aligned. This pilot study demonstrates the feasibility of directly conducting ground-based high-frequency observations of this key water line, opening the possibility of detailed follow-up campaigns to tackle its nature.
keywords:
ISM: molecules – galaxies: ISM – infrared: galaxies1 Introduction
Ultra-Luminous InfraRed Galaxies (ULIRGs; with total infrared luminosity between 1012 and 1013 ) are part of the most extreme galaxy populations in the nearby Universe (Sanders et al., 2003). They are characterized to be rich in dust and molecular gas (e.g. Solomon et al., 1997; Genzel et al., 1998; Greve et al., 2005) and \colorblack to have higher gas fractions compared to normal star-forming galaxies (Gao & Solomon, 2004). ULIRGs are mostly late-stage mergers (e.g. Sanders & Mirabel, 1996) understood as a transitional phase in the evolution of galaxies, passing through a brief starburst phase triggered by a major interaction that cause the in-falling of the interstellar medium (ISM) to the innermost regions, likely triggering nuclear starburst and active galactic nuclei (AGN) but with complex evolution links between the two (e.g. Farrah et al., 2001; Lonsdale et al., 2006). After the molecular gas is consumed, they will probably end up as passive galaxies hosting supermassive black holes in their centres. Therefore, ULIRGs offer unique insights into our understanding of galaxy evolution. To describe their nature, it is imperative to understand why they have such intense, compact star formation and what powers the nuclear star formation activity. The majority of the radiation produced in their nuclei, whether by an AGN or by star formation, is absorbed by dust and re-emitted in the far-infrared (far-IR). Because of the intense obscuration, identifying the predominant power source of local ULIRGs is challenging. Using emission lines from \colorblackmolecules such as OH and H2O, whose excitation depend on the far-IR continuum photons, could be a potential diagnostic to distinguish AGN from starburst activity (González-Alfonso et al., 2010; van der Werf et al., 2011; Pensabene et al., 2022; Decarli et al., 2023).
H2O is the third most abundant molecule in the ISM, either in the gas phase in warm regions or in the solid phase on dust mantles (e.g. van Dishoeck et al., 2013), and serves as one of the most important coolants of the cold molecular gas (Neufeld et al., 1995). \colorblack In particular, the thermal para-H2O(211–202) line is emitted at 752.033 GHz rest-frame and has an upper energy level of K. In Galactic star forming regions, this line is predominantly originated by shocks that trace high density and temperature gas (e.g. Mottram et al., 2014; van Dishoeck et al., 2021). On the other hand, surveys of submillimeter (submm) H2O lines with Herschel in local galaxies revealed that this water line is one of the brightest submm H2O lines (Yang et al., 2013; Lu et al., 2017). The modelling of water in galaxies, assuming different phases of the ISM, with different dust temperatures, shows that this line comes predominantly from the warm phase with K (González-Alfonso et al., 2014). The p-H2O () line can be excited via collision in warm dense conditions with a column density of cm-2, sharing a common spatial distribution with those regions traced by mid- CO lines in star-forming galaxies (Liu et al., 2017; González-Alfonso et al., 2014). Additionally, H2O lines can be excited radiatively by far-IR photons. This so-called pumping mechanism of p-H2O () is induced by the 101m continuum, which excites the H2O molecules from the base energy level 111 to 220. This level 220 then cascades down to 211 and later to 202 producing line emission at 1229, 752, and 988 GHz respectively. Furthermore, the combination of far-IR 75 m absorption ortho-H2O () and the 1163 GHz emission enhance the radiative excitation for the submm lines with K, including the 752 GHz one (González-Alfonso et al., 2022). The p-H2O () far-IR pumping makes H2O lines a prominent tracer of the conditions of the far-IR field, especially in highly obscured regions of galaxies (e.g. González-Alfonso et al., 2014). Previous studies have shown that the p-H2O () is well correlated with \colorblackthe total infrared luminosity in both local and high-redshift galaxies (Omont et al., 2013; Yang et al., 2013, 2016; Jarugula et al., 2019; Berta et al., 2023). The nearly linear correlation \colorblackbetween and lines suggest that water can be excited to high energy levels by far infrared pumping and provides another approach for tracing the far infrared field in star-forming galaxies. The correlation can be a natural consequence of far-IR pumping H2O excitation (González-Alfonso et al., 2014).
In dusty star-forming galaxies, H2O lines trace both, the properties of the molecular gas and the dust content, offering a powerful tool to study their physical nature. This becomes especially important in ULIRGs as they present ideal conditions for water emission, intense far-IR radiation fields and warm dense gas content. In fact, the H2O lines can offer unique insights into the innermost dust-obscured regions with very high opacity, providing essential information on the ISM physical conditions of the most extreme ULIRGs (e.g. Falstad et al., 2017; Liu et al., 2017; Yang et al., 2020; González-Alfonso et al., 2021), where often the p-H2O () line becomes optically thick (e.g. González-Alfonso et al., 2014).
Although thermal H2O lines provide powerful line diagnostics, their detection from ground-based observatories is impeded by the presence of water vapour in the Earth’s atmosphere, which significantly reduces atmospheric transmission. From space, the H2O lines have been studied in large samples of far-IR bright galaxies with limited spectral resolutions with Herschel Space Observatory SPIRE-FTS (e.g. Yang et al., 2013; Pearson et al., 2016), despite a \colorblackhandful of sources studied with high-spectral resolution with Herschel HIFI (Liu et al., 2017). \colorblackIt is known that the p-H2O () line is ubiquitous in the spectra of molecular clouds in the Milky Way and local galaxies, but it has also been found to be a prominent emission line amongst the water lines detected in high-redshift infrared bright galaxies, both unlensed (e.g. Gullberg et al., 2016; Riechers et al., 2017; Casey et al., 2019; Lehnert et al., 2020; Li et al., 2020; Stanley et al., 2021; Pensabene et al., 2021) and gravitationally amplified (e.g. Omont et al., 2011; Lis et al., 2011; Bradford et al., 2011; Combes et al., 2012; Omont et al., 2013; Riechers et al., 2013; Bothwell et al., 2013; Yang et al., 2016; Jarugula et al., 2019, 2021; Apostolovski et al., 2019; Yang et al., 2019a, b, 2020; Berta et al., 2021). The similarity found in profiles between water and mid- to high- level CO transitions strongly suggests that water emission originates from regions of active star formation (e.g. see Figure 13 from Yang et al. 2017). Exploring the properties of water lines then becomes a key aspect for characterizing the cosmic star formation history of the Universe.
It is important to highlight that most of the detected submm water lines from local galaxies have been made by Herschel (see Weiß et al. 2010; Yang et al. 2013; Liu et al. 2017), nevertheless as this is \colorblack no longer available, and until the next generation of far-infrared space telescopes, exploiting ground-based submm facilities are the only possibility to explore high-frequencies to measure water lines with high spectral resolution and, in the case of ALMA, unprecedented angular resolution.
In this work, we present high-spectral resolution observations of the p-H2O () \colorblack in three low-redshift ULIRGs (IRAS 06035-7102, IRAS 17208-0014 and IRAS 09022-3615) using the single-dish APEX telescope with the SEPIA receiver in Band-9 (Baryshev et al., 2015; Belitsky et al., 2018). Throughout this work, we assumed a CDM cosmology with , and .
2 Data
2.1 \colorblackSource selection
blackThe three sources were selected from a sample of ULIRGs observed in water lines with Herschel and presented in Yang et al. (2013). From this sample, we selected the sources below declination and, in order to ensure a good atmospheric transmission, we excluded sources whose observed water line p-H2O () (752.033 GHz rest-frame) frequencies are higher than 722 GHz. Eight ULIRGs fulfil the selection criteria. Based on integration time estimates, considering expected line fluxes and atmospheric transmission, as a pilot project, we chose to target three sources, IRAS 17207-0014, IRAS 06035-7102, and IRAS 09022-361. These three sources maximised the detection of the water line within a short integration time.
2.2 Observations
We observed IRAS 06035-7102 (), IRAS 17208-0014 (), and IRAS 09022-3615 () with APEX SEPIA-660 Band 9 receiver (Project: E-0103.B-0471A-2018, PI: C. Yang) operating at the observing frequency range of 690–725 GHz. The APEX beam size at this frequency is . Observations were carried out between May 11-12, June 03, 22-24, and August 21-22, 27-29 in 2019. The ON-OFF observations were performed in the wobbler-switching symmetric mode with an amplitude of 40 arcsecs and a wobbling rate of 1.5 Hz. The Doppler correction to account for the motion of the Earth was applied during the observations. R-Dor and L2-Pup were used for pointing and focus calibration. The focus was checked at the beginning of each observing session, and pointing was checked every approximately 1.5 hours. Spectral setup covers 8 GHz per sideband and a separation of 8 GHz between the upper- and lower-side bands. The observation was centred on the redshifted line frequency of interest, and we requested a line peak-to-rms ratio of S/N5 in velocity channels of 50 km s-1. The precipitable water vapour (PWV) during the observations varied between 0.4 and 0.9 mm, corresponding to typical atmospheric transmission of 60% and 20%, respectively. The total integration times ranged between 4 and 15 hrs per target (Table 1).
2.3 Data reduction
The data were reduced using the Grenoble Image and Line Data Analysis Software (GILDAS)111https://www.iram.fr/IRAMFR/GILDAS/ - Continuum and Line Analysis Single-dish Software (CLASS) package. For each target, we collected all the scans for different observing dates. For each observing date, we checked all the individual scans and discarded those affected by anomalous noise levels or weather conditions as noted by the log-file of the observations. For each scan, we masked a velocity window from 500 to 500 km s-1 centred at the expected line observing frequency to fit a second-order polynomial subtraction, which accounts better for the baseline shapes, to remove the baseline out of the spectra. Then we combined all of the individual spectra, using noise-based weighing and aligning them at the frequency of interest. We have also explored the baseline subtraction using first-order polynomials and did not find any major differences compared with the second-order polynomial fits.
To display the spectra, we use a spectral resolution of 50 km s-1 channel width (see Figure 1). Considering the antenna temperature corrected for the atmospheric attenuation, the forward efficiency and signal band gain, we derive flux densities using a conversion factor of 75 6 Jy K-1 measured during the observations period with SEPIA-660222https://www.apex-telescope.org/telescope/efficiency/. The measured noise root mean squared (RMS), for all three sources, ranges between 77 and 340 mJy beam-1. The final spectra were exported to Python for the remaining analysis. IRAS 17208-0014 became the brightest source, so less integration time was needed to reach the requested signal-to-noise ratios (see Table 1).
2.4 SED photometry
Previous analyses indicate that the p-H2O () is likely to be dominated by far-IR pumping excitation by the photons at 101 m (e.g. González-Alfonso et al., 2022). If this is the case for our sources, we would expect a tight correlation between H2O emission and far-IR dust continuum. \colorblack In order to further explore this, we re-analyzed the Herschel Photodetector Array Camera and Spectrometer (PACS) 100 m emission of IRAS 17208-0014 (Obslist:1342241375, 1342241376) and IRAS 09022-3615 (Obslist:1342233593, 1342233594). These were retrieved from the Herschel Public Archive (program OT1, PI: D. Sanders). Each galaxy was observed in cross-scanning mode at 20 arcsec s-1 and unimap projected maps were considered. Since PACS simultaneously observes at 100 m and at 160 m, we performed aperture photometry at both wavelengths following the pointSourceAperturePhotometry script using the Herschel Interactive Processing Environment (HIPE) version 15.0.1 software (Ott, 2010). We measured the flux at different aperture radii \colorblack (up to 4 full width at half maximum, FWHM) and checked the aperture at which the encircled energy fraction stabilizes. This profile is compared to the point spread function profile finding that both behave similarly, concluding that the two far-IR sources are point-like at the Herschel PACS beam (FWHM 67 69 for 100 m and 106 121 for 160 m). The photometric error is estimated using six equal apertures placed in the background around the source. The results for this aperture photometry are in agreement with those presented by Chu et al. (2017).
Using photometric points from the Wide-field Infrared Survey Explorer (WISE) 22 m, the Infrared Astronomical Satellite (IRAS) 60 m, PACS 70 m and Herschel SPIRE 250, 350, and 500 m, for all three sources we construct the Spectral Energy Distribution (SED) to estimate their total infrared luminosities (see Table 3 for the details).
2.5 Ancillary submm data
Public ALMA observations of CO( = 4–3) and 630 m dust continuum were retrieved for IRAS 09022-3615 and IRAS 17208-0014 (project ID: 2018.1.00994.S, PI: T. Michiyama). For IRAS 06035-7102, we retrieved data from HCN( = 2–1) (project ID:2017.1.00022.S, PI: M. Imanishi) and from CO( = 3–2) and 850 m dust continuum (project ID:2018.1.00503.S, PI: A. Gowardhan). All observations were reduced using the standard pipeline calibration scripts provided by ALMA with the Common Astronomy Software Applications (CASA; CASA Team et al., 2022) for the respective cycles. After obtaining the calibrated measurement sets, the imaging process was done with the task TCLEAN. We created an initial datacube where we identified the line-free channels. For the continuum subtraction, we used the task UVCONTSUB. We ran the cleaning process down to 1 using interactive masks located at the source positions. The spectral resolution of the cubes is set to 50 km s-1, using a natural weighting and a primary-beam corrected map. To better compare the p-H2O () line to the ALMA CO(), CO(), and HCN() observations, the ALMA data cubes were degraded in spatial resolution down to the same APEX beam using the task IMSMOOTH. The final ALMA spectra used for comparison are extracted at the convolved central brightest pixel in Jy beam-1 units (Figure 1).
3 Results and Discussion
| N | Source | RA (J2000) | Dec (J2000) | z | FWHM | v | ||||
|---|---|---|---|---|---|---|---|---|---|---|
| [GHz] | [Mpc] | [km s-1] | [Jy km s-1] | [] | [h] | |||||
| (1) | (2) | (3) | (4) | (5) | (6) | (7) | (8) | (9) | (10) | |
| 1 | IRAS 06035-7102 | 06:02:54.01 | -71:03:10.2 | 0.07946 | 696.7 | 325.0 | 414.8854.01 | 145.7316.32 | 10.331.16 | 12.3 |
| 2 | IRAS 17208-0014 | 17:23:21.96 | -00:17:00.9 | 0.04281 | 721.2 | 175.68 | 515.9068.61 | 704.7783.72 | 15.641.86 | 4.2 |
| 3 | IRAS 09022-3615 | 09:04:12.71 | -36:27:01.0 | 0.05964 | 709.7 | 238.84 | 414.8149.89 | 199.0820.84 | 7.900.83 | 14.3 |
-
•
Note: (1) Source name. (2) Right ascension. (3) Declination. (4) redshift from the NASA/IPAC Extragalactic Database (NED). (5) Central observed frequency. (6) Luminosity distance in Mpc from Yang et al. (2013). (7) The H2O () FWHM. (8) The velocity-integrated flux density. (9) Line luminosity. (10) Total APEX integration time (including overheads).
3.1 Water line measurements
| Source | APEX | HSO-SPIRE | HSO-SPIRE |
|---|---|---|---|
| [Jy km s-1] | [Jy km s-1] | [Jy km s-1] | |
| Yang et al. (2013) | Pearson et al. (2016) | ||
| 1 | 145.73 16.32 | ||
| 2 | |||
| 3 |
Note: ∗ The value is a 3- upper limit, although the original work reports a 3 tentative detection of Jy km s-1 with low significance. ∗∗ The conversion factor from W m-2 to Jy km s-1 is assumed [GHz].
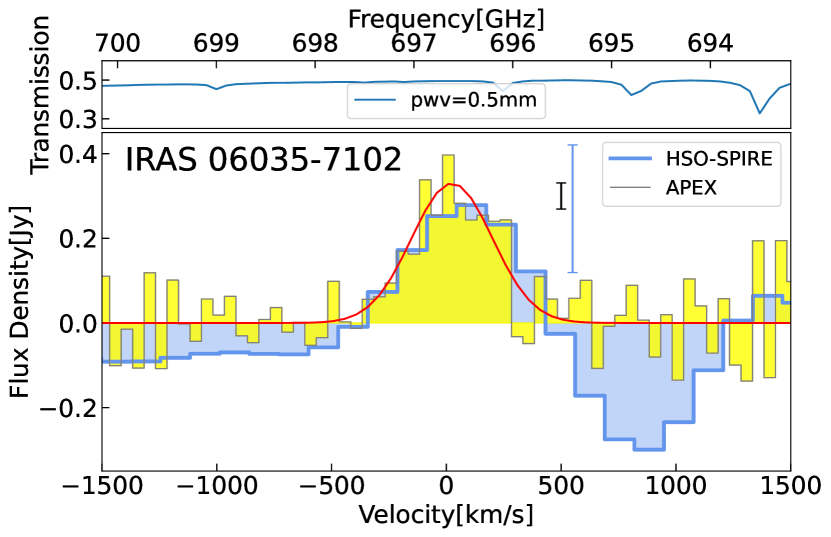
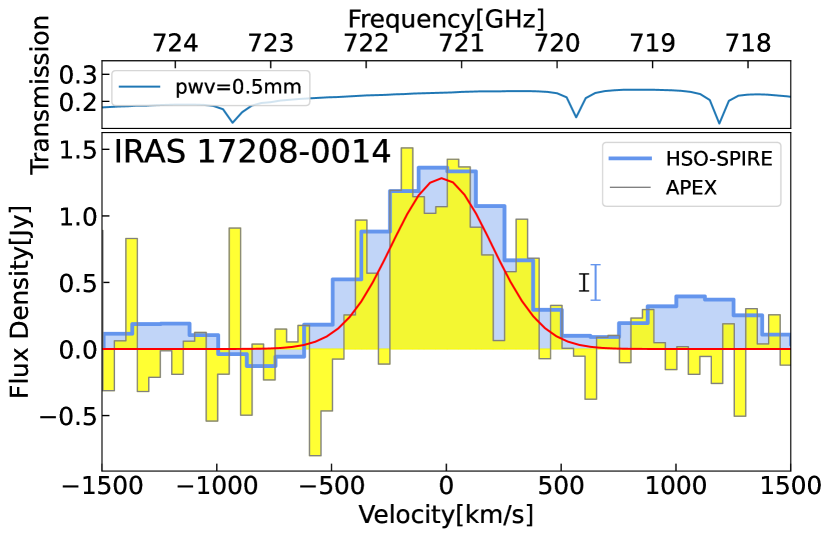
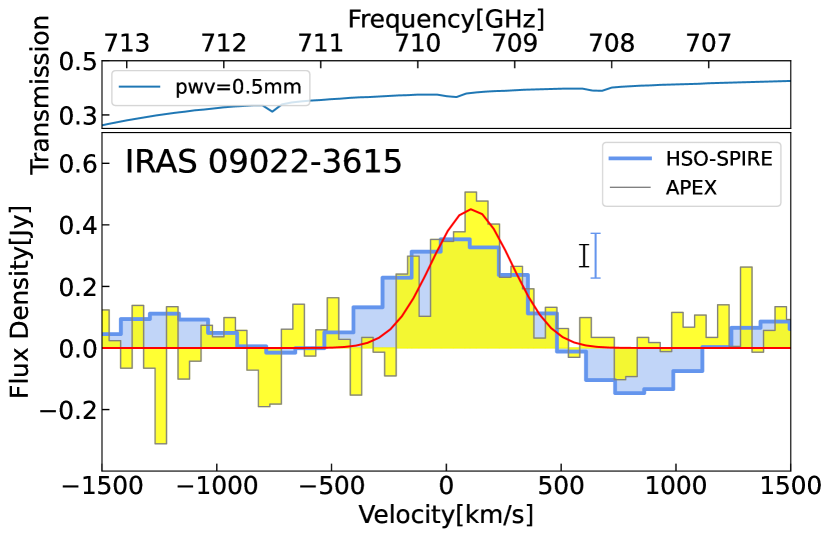
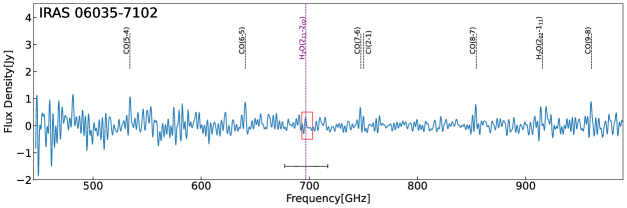
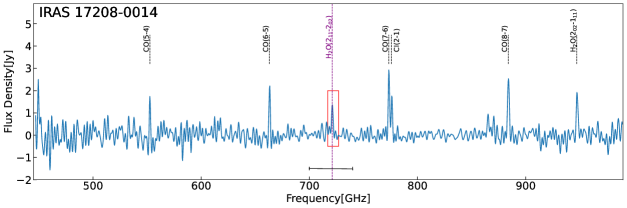
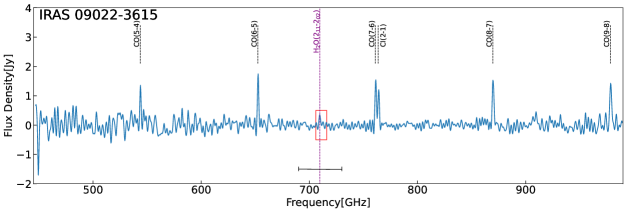
Using APEX SEPIA Band-9 we detected the thermal transition of the water molecule p-H2O () in all three ULIRGs at significance levels. For IRAS 06035-7102, this is the first clear detection of p-H2O (), superseding the tentative detection reported by Yang et al. (2013). The spectra of p-H2O () observed with APEX toward IRAS 06035-7102, IRAS 17208-0014, and IRAS 09022-3615 are shown in Figure 1, \colorblack in comparison with the low resolution Herschel SPIRE-FTS spectra (the full spectra can be seen in Figure 5). \colorblack We note that the zero velocity is defined by the redshift of the source, as indicated in Table 1. We have identified a velocity shift of 100 km/s in the case of IRAS 09022-3615, which will be discussed in detail in Section 3.4. We confirm the line detection at a higher significance (at least a factor of two) and higher spectral resolution. The spectra show that p-H2O () is detected with a peak flux density of Jy beam-1 in IRAS 09022-3615, Jy beam-1 in IRAS 17208-0014 and Jy beam-1 in IRAS 06035-7102. The velocity-integrated flux densities and a comparison with previous values taken from the literature are presented in Table 2. The values agree within the uncertainties, with the line fluxes and tentative limits measured with the Herschel SPIRE-FTS by Yang et al. (2013) and Pearson et al. (2016).
The instrumental line spread function of SPIRE-FTS is a function that redistributes the line flux along the frequency axis (Hopwood et al., 2015), which correlates the channels across the line profiles. On the other hand, as SEPIA is a heterodyne instrument, it does not have this line spread function effect, offering independent channels and demonstrating its power for resolving the line profiles. Thus APEX not only provides an accurate measurement of the line flux but also provides a direct way to recover the true line profiles, revealing further information about the kinematics of the gas.
The high spectral resolution of APEX allows us to resolve the p-H2O () lines \colorblackand determine the full width at half maximum (FWHM) in all three galaxies, which are 415, 516 and 415 km s-1 for IRAS 06035-7102, IRAS 17208-0014 and IRAS 09022-3615, respectively (Table 1). Within the APEX beam and a spectral resolution of 50 km s-1, the line profiles are consistent with a single Gaussian, facilitating clean measurements of their velocity-integrated flux densities.
To compare the spectral noise between the APEX and the previous Herschel SPIRE-FTS measurements, we convolved the APEX spectra with the line spread function profile of SPIRE-FTS and then binned these spectra to match the spectral SPIRE-FTS resolution. The error bars (measured within a 40 GHz bandwidth for both) obtained for the convolved/binned APEX and SPIRE-FTS are shown in Figure 1, demonstrating the higher significance reached by APEX to characterise the p-H2O () line emission.
To compute the H2O luminosities, we follow the equation in Solomon & Vanden Bout (2005):
| (1) |
where is the velocity integrated flux density in units of Jy km s-1, the rest-frame frequency of the line is related to the observed frequency as is in GHz, is the luminosity distance in Mpc and is the redshift. Derived luminosities are presented in Table 1.
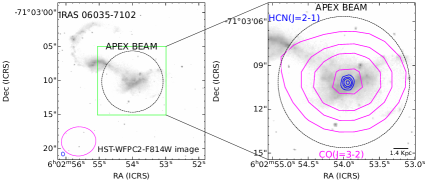
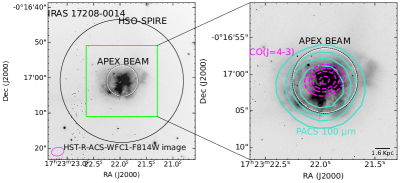
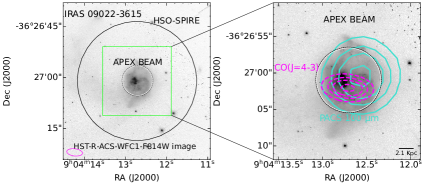
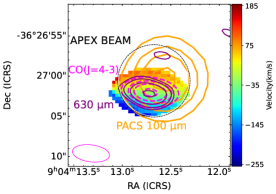
In Figure 2, we present a comparison between the APEX () and Herschel SPIRE-FTS (35″) beam sizes. As both spectra show similar intensities, we suggest that most of the water emission comes from a compact region smaller than the APEX beam. To look at the optical nature of the sources, we present images from the Hubble Space Telescope (HST) with the Advanced Camera for Surveys (ACS), the Wield Field Camera (WFC) and the Wide Field Planetary Camera (WFPC2) from programs 6346 (WFPC2, PI: K. Borne) and 10592 (ACS, PI: A. Evans, see Kim et al. 2013) in the filter (F814W, Å). The -band images of our galaxies have a large field of view () and capture the detailed structure of the galaxies and the full extent of each ULIRG interaction. We can see that IRAS 06035-7102 is an extended interacting double system, separated by a distance of 10′′ (in WFC2 image; Arribas et al. 2008). IRAS 17208-0014 is an advanced merger with two tidal tails toward the southeast and northwest. IRAS 09022-3615 is a late-type merger presenting a tidal tail. While in IRAS 06035-7102 and IRAS 17208-0014, the ALMA mid- CO and HCN(2–1) maps show that the molecular gas is concentrated towards the nuclear region where the far-IR emission peaks, the CO(3–2) emission in IRAS 09022-3615 locates offset from the peak of the HST image and the far-IR dust emission, indicating complex ISM structure and kinematics. Our APEX beams are well aligned with the bulk of the compact molecular gas and dust emissions, which should trace the total H2O emission from our targets.
3.2 \colorblackThe IR luminosities
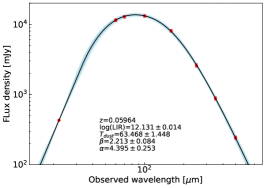
To estimate the total infrared luminosity ( ), we model the SED of galaxies between 8 and 1000 m. We use the Monte Carlo InfraRed SED (MCIRSED; Drew & Casey 2022), which fits the data with a function consisting of a mid-infrared (mid-IR) power law and a far-IR modified blackbody. The model has the form
| (2) |
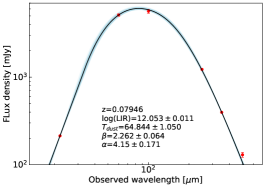
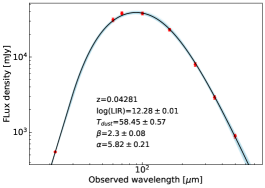
where is the rest-frame wavelength, is the mid-IR power-law slope, and are normalization constants, is the wavelength where the dust opacity equals unity, is the dust emissivity index, is the luminosity-weighted characteristic dust temperature, , and are Planck, Boltzmann and the speed of light constants. The two functions connect at the wavelength where the slope of the modified blackbody is equal to the slope of the power law function. In our model, characterises the hot dust emission and is constrained to be between 0 << 6, while on the other hand, controls the slope in the Rayleigh-Jeans regime and it is constrained to be between 0.5 and 5.0. In Figure 2, we show the SED fitting and the estimated fitted values. The value of for the three galaxies is steep (), consistent with a lack of significant hot dust emission coming from a buried powerful AGN. The value of the emissivity index, less than 2.5, is in agreement with most values in local star-forming galaxies. As expected, the infrared luminosities are higher than , consistent with being ULIRGs.
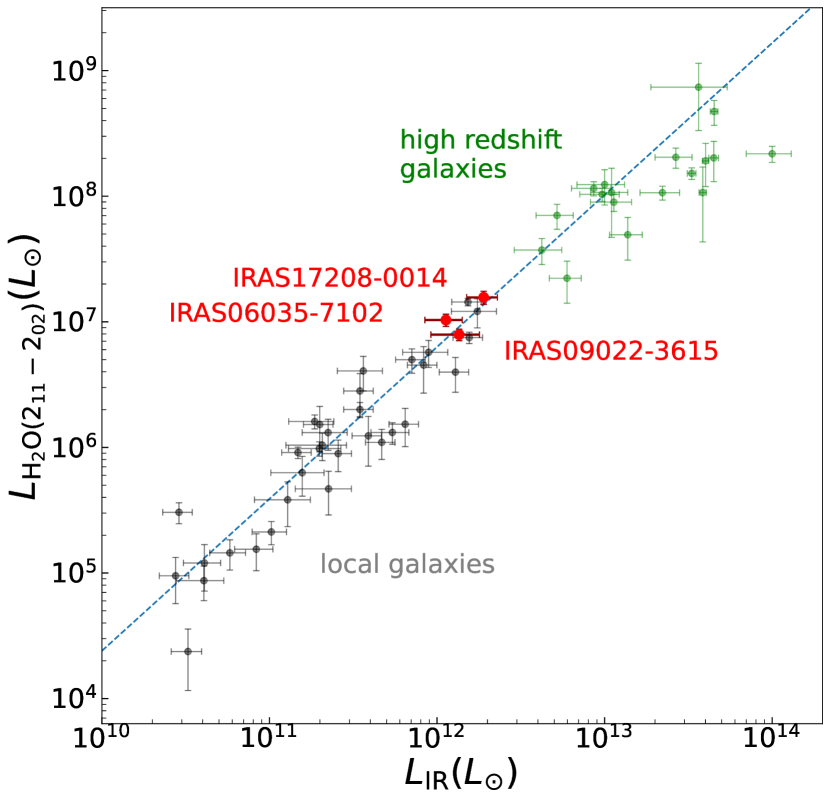
3.3 The correlation
In Figure 3, we present the correlation between and as found in local and high redshift galaxies. Our sample is highlighted in red and is part of the brightest low redshift ULIRGs. Previous studies have shown that the - correlation is slightly superlinear (e.g. Omont et al., 2013; Yang et al., 2013; Jarugula et al., 2019) compared to other water lines with the exception of H2O(211–202), which is also excited by 101 m photons. This correlation opens the possibility of using water as a tracer of the far-IR emission and suggests that the IR pumping mechanism is the main responsible for the excitation of water molecules producing the p-H2O () line at 752GHz. Nevertheless, studies of local galaxies show that the low-J () H2O lines \colorblackcan also be both collisionally and far-IR excited (Liu et al., 2017). One simple approach to hint light on the nature of the exciting mechanism of the p-H2O () is to compare the spatial distribution of the water emission to that of the dust continuum near m, compared to other molecular gas tracers, which are well known to be collisionally excited, such as CO( = 3–2), CO( = 4–3) or HCN( = 2–1). However, given that our APEX observations are only \colorblack consistent with single pointings, we here compare the line profiles as an indication of a common nature, assuming that kinematic structures are associated with similar spatial distributions.
3.4 Spatial and spectral comparison between H2O, CO, HCN and dust
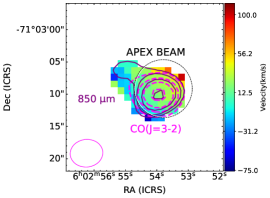
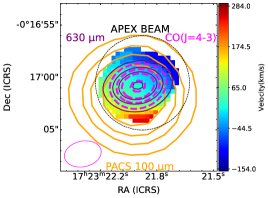
In order to get insights \colorblackon the origin of the excitation mechanisms of the p-H2O () emission, in Figure 2, we present the APEX \colorblackpointing overplotted on the ALMA CO( = 3–2), CO( = 4–3) and HCN( = 2–1) integrated line contours. \colorblackBecause 101m photons are predominantly exciting the H2O 220 level that relates to the p-H2O () line (e.g. Liu et al., 2017; González-Alfonso et al., 2014), we explore the spatial distribution of the 100 m dust continuum using the PACS-100m images in relation to that of the H2O line. We note that the PACS 100 m emission in IRAS 17208-0014 and IRAS 09022-3615 is point-like (at fwhm 14 kpc); hence most of the far-IR photons come from the innermost central regions of these ULIRGs. The interferometric ALMA observations toward IRAS 06035-7102 show the HCN( = 2–1) emission has a deconvolved major axis FWHM of kpc associated with a central region, while the CO( = 3–2) is spatially aligned with HCN( = 2–1) presenting a deconvolved major axis FWHM size of kpc. In IRAS 17208-0014, the APEX pointing is centred on the CO( = 4–3) emission, and \colorblackthe PACS-100 m emission is centred on the same region. However, in IRAS 09022-3615, we see a significant offset between the peak position of the PACS-100 m photometry and the CO( = 4–3) \colorblackemission (Figures 2, 4 6), while at the same time, the APEX pointing is slightly offset with respect to their peaks, located in the redshifted part of the CO emission.
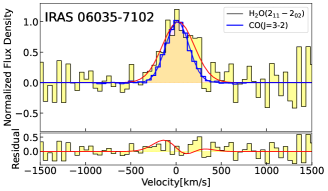
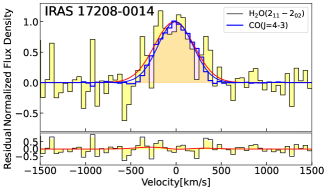
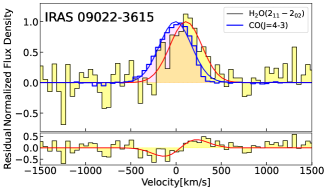
The left panel of Figure 4 shows a normalised spectroscopic comparison between the p-H2O (), CO( = 3–2) and CO( = 4–3) at 50 km s-1 channel width. The velocities from ALMA and APEX spectra are under the same frame LSRK (Doppler correction was already applied during the observations). In IRAS 06035-7102, \colorblackboth CO( = 3–2) and the p-H2O () emission are spectroscopically aligned. The same is seen for IRAS 17208-0014 when comparing CO( = 4–3) and p-H2O (). Nevertheless, in IRAS 09022-3615, we find that the water emission is redshifted compared to the gas traced by CO( = 4–3). This is best illustrated by the Gaussian fits of the p-H2O () (red) and CO( = 4–3) (blue), where we find that H2O has a peak emission at about km s-1 with respect to the systemic velocity defined by the redshift of the sources (see Table 2). This is evident from the residual spectrum, where we can see that there is an excess of water emission in the red part of the spectra at a similar velocity while having a negative peak at the blue part.
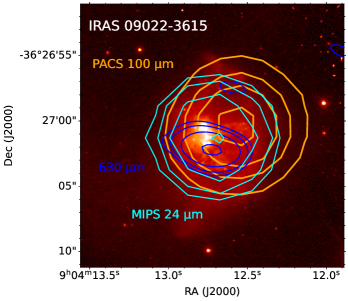
The right panel of Figure 4 shows for IRAS 06035-7102 the intensity and moment 1 map of the CO( = 3–2) together with the contours of the intensity of dust emission at 850 m. We show that the APEX pointing is aligned with the 850 m ALMA dust continuum and with the CO( = 3–2), suggesting that all the different signals come from the same compact region. For IRAS 17208-0014 and IRAS 09022-3615, we present the intensity and moment 1 map of the CO( = 4–3) with respect to the contours of the intensity of dust emission of PACS 100 m and ALMA 630 m. In IRAS 17208-0014, the CO( = 4–3), the 100 m and 630 m dust continuum \colorblackare well aligned each other. This suggests that the different tracers are revealing the same dense gas from the very central part of the galaxy. In IRAS 09022-3615, both CO( = 4–3) and the 630 m dust continuum are spatially aligned, nevertheless the PACS-100 m emission is spatially offset by (2.9 kpc). \colorblack If such a spatial offset is real, we might be finding an explanation for the km s-1 offset between the p-H2O () and CO(4–3) lines, where possibly the water line is excited by infrared pumping, via the m pumping path, at a region different than where the CO line is produced, as the PACS-100 m emission is peaking at the redshifted part of the CO emission. In this case, the offset between m (PACS) and 630 m (ALMA) might be due to temperature/optical-depth variation across the galaxy. After exploring photometric data taken with the Spitzer Space Observatory at 8m and 24m, we confirm a good alignment between ALMA 630 m and Spitzer data. \colorblackConsidering that PACS photometry lies between these two wavelengths, this suggests instead that the observed offset might be attributed to issues with the astrometric calibration of the Herschel-PACS observation. The absolute pointing Herschel error in scan maps can range from to (see Table 5 of Sánchez-Portal et al. 2014), an uncertainty which is not consistent but varies at each specific observing epoch subject to unique conditions. Our observed spatial offset is approximately the upper limit of the astrometric error. If the offset is indeed caused by the astrometric error, nevertheless, the origin of the spectroscopic offset remains unclear. However, in the literature, high spectral resolution observations have indicated the presence of variations in the line profiles of CO( = 3–2) and p-H2O () in Mrk 232 and NGC 6240 (as depicted in Figure 2 from Liu et al. 2017), nevertheless these differences have not been explored in detail. It is worth noting that IRAS 09022-3615 has a complex morphology, as shown in Figure 6, where the peak of MIPS 24 m and ALMA 630 m is not aligned with the R-band HST image.
Due to the limited spatial resolution of APEX, to fully understand the origin and powering source of the submm H2O emission, higher angular resolution observations, such as ALMA Band-9 observations, are needed. These resolved observations need to be integrated into detailed photo-dissociation and radiative transfer modelling to tackle the nature of the p-H2O () emission and provide insights on the usage of this line to describe the warm ISM in galaxies.
black
4 Conclusion
We present the first ground-based detection \colorblackof the p-H2O () emission line at 752.033 GHz in local ULIRGs using APEX SEPIA Band 9 towards IRAS 06035-7102 ( = 0.07946), IRAS 17208-0014 ( = 0.04281) and IRAS 09022-3615 ( = 0.05964). We demonstrate that despite the low transmission of the atmosphere at these high frequencies, \colorblackobserving this thermal water line in local galaxies can be done using ground-based facilities operating at high frequencies, reaching high signal-to-noise in a reasonable integration time ( 5-15 hours per source) \colorblack with high-spectral resolutions. For all three sources, the final APEX spectra are of high quality, improving the previous measurements done by Herschel SPIRE-FTS both in signal-to-noise ratios and spectral resolution, resulting in the first clear detection of this water line in IRAS 06035-7102.
We have spectrally resolved the p-H2O () line and derived their velocity-integrated flux densities and intrinsic luminosities. We find that the H2O emission follows the - correlation. We compared the p-H2O () line emission to the dust continuum at different wavelengths 100 m, 630 m, 850 m and the molecular gas traced by CO( = 3–2), CO( = 4–3) and HCN( = 2–1). \colorblackIn IRAS 06035-7102, the water emission is co-spatial with the dust emission at 850 m and spectrally aligned with the gas traced by CO( = 3–2). In IRAS 17208-0014, a similar behaviour is seen, where the continuum dust emission at 100 m and 630 m are spatially aligned, while in frequency space the gas traced by CO( = 4–3) is spectrally aligned with the p-H2O () line. \colorblack In the case of IRAS 09022-3615, the p-H2O () water emission line is redshifted by 100 km s-1 as compared with the CO( = 4–3) emission line. The origin of this offset is still inconclusive, and higher angular resolution observations are needed to understand the reasons behind this shift.
Our pilot APEX survey opens a new window \colorblackfor studying submm H2O emission lines in local ULIRGs using ground-based facilities, offering better sensitivity and spectral resolution than the past space-based facilities, such as Herschel. Future higher spatial resolution observations, using ALMA Band-9, together with detailed radiative transfer modelling, can help us explore the distribution of the molecular gas and \colorblack dust continuum in local ULIRGs to disentangle the origin of the exciting mechanism of the p-H2O () line by reaching down to the scales of giant molecular clouds.
Acknowledgements
blackWe are thankful to the referee, Pierre Cox, for his valuable suggestions, which have significantly enhanced the quality of this paper. DQ acknowledges support from the National Agency for Research and Development (ANID)/Scholarship Program/Doctorado Nacional/2021-21212222. C.Y. and S.A. acknowledge support from ERC Advanced Grant 789410. E.I. acknowledges funding by ANID FONDECYT Regular 1221846. \colorblackEG-A thanks the Spanish MICINN for support under projects PID2019-105552RB-C41 and PID2022-137779OB-C41. Y.J. acknowledges financial support from ANID BASAL project No. FB210003. This publication is based on data acquired with the Atacama Pathfinder Experiment (APEX), project ID 103.B-0471. APEX is a collaboration between the Max-Planck-Institut fur Radioastronomie, the European Southern Observatory, and the Onsala Space Observatory. This publication makes use of the following ALMA data: ADS/JAO.ALMA#2017.1.00022.S, ADS/JAO.ALMA#2018.1.00994.S ALMA is a partnership of ESO (representing its member states), NSF (USA) and NINS (Japan), together with NRC (Canada), MOST and ASIAA (Taiwan), and KASI (Republic of Korea), in cooperation with the Republic of Chile. The Joint ALMA Observatory is operated by ESO, AUI/NRAO and NAOJ. PACS has been developed by a consortium of institutes led by MPE (Germany) and including UVIE (Austria); KU Leuven, CSL, IMEC (Belgium); CEA, LAM (France); MPIA (Germany); INAF-IFSI/OAA/OAP/OAT, LENS, SISSA (Italy); IAC (Spain). This development has been supported by the funding agencies BMVIT (Austria), ESA-PRODEX (Belgium), CEA/CNES (France), DLR (Germany), ASI/INAF (Italy), and CICYT/MCYT (Spain). SPIRE has been developed by a consortium of institutes led by Cardiff University (UK) and including Univ. Lethbridge (Canada); NAOC (China); CEA, LAM (France); IFSI, Univ. Padua (Italy); IAC (Spain); Stockholm Observatory (Sweden); Imperial College London, RAL, UCL-MSSL, UKATC, Univ. Sussex (UK); and Caltech, JPL, NHSC, Univ. Colorado (USA). This development has been supported by national funding agencies: CSA (Canada); NAOC (China); CEA, CNES, CNRS (France); ASI (Italy); MCINN (Spain); SNSB (Sweden); STFC, UKSA (UK); and NASA (USA). This work is based [in part] on observations made with the Spitzer Space Telescope, which is operated by the Jet Propulsion Laboratory, California Institute of Technology under a contract with NASA.
Data Availability
The data underlying this article are available in the ESO Science Archive at https://archive.eso.org/scienceportal/home, and can be accessed with the Project ID: 103.B-0471
References
- Apostolovski et al. (2019) Apostolovski Y., et al., 2019, A&A, 628, A23
- Arribas et al. (2008) Arribas S., Colina L., Monreal-Ibero A., Alfonso J., García-Marín M., Alonso-Herrero A., 2008, A&A, 479, 687
- Baryshev et al. (2015) Baryshev A. M., et al., 2015, A&A, 577, A129
- Belitsky et al. (2018) Belitsky V., et al., 2018, A&A, 612, A23
- Berta et al. (2021) Berta S., et al., 2021, A&A, 646, A122
- Berta et al. (2023) Berta S., et al., 2023, A&A, 678, A28
- Bothwell et al. (2013) Bothwell M. S., et al., 2013, ApJ, 779, 67
- Bradford et al. (2011) Bradford C. M., et al., 2011, ApJ, 741, L37
- CASA Team et al. (2022) CASA Team et al., 2022, PASP, 134, 114501
- Casey et al. (2019) Casey C. M., et al., 2019, The Astrophysical Journal, 887, 55
- Chu et al. (2017) Chu J. K., et al., 2017, ApJS, 229, 25
- Clements et al. (2018) Clements D. L., et al., 2018, MNRAS, 475, 2097
- Combes et al. (2012) Combes F., et al., 2012, A&A, 538, L4
- Cutri et al. (2021) Cutri R. M., et al., 2021, VizieR Online Data Catalog, p. II/328
- Decarli et al. (2023) Decarli R., et al., 2023, A&A, 673, A157
- Drew & Casey (2022) Drew P. M., Casey C. M., 2022, ApJ, 930, 142
- Falstad et al. (2017) Falstad N., González-Alfonso E., Aalto S., Fischer J., 2017, A&A, 597, A105
- Farrah et al. (2001) Farrah D., et al., 2001, MNRAS, 326, 1333
- Gao & Solomon (2004) Gao Y., Solomon P. M., 2004, ApJ, 606, 271
- Genzel et al. (1998) Genzel R., et al., 1998, ApJ, 498, 579
- González-Alfonso et al. (2010) González-Alfonso E., et al., 2010, A&A, 518, L43
- González-Alfonso et al. (2014) González-Alfonso E., Fischer J., Aalto S., Falstad N., 2014, A&A, 567, A91
- González-Alfonso et al. (2021) González-Alfonso E., et al., 2021, A&A, 645, A49
- González-Alfonso et al. (2022) González-Alfonso E., Fischer J., Goicoechea J. R., Yang C., Pereira-Santaella M., Stewart K. P., 2022, A&A, 666, L3
- Greve et al. (2005) Greve T. R., et al., 2005, MNRAS, 359, 1165
- Gullberg et al. (2016) Gullberg B., et al., 2016, A&A, 591, A73
- Hopwood et al. (2015) Hopwood R., et al., 2015, MNRAS, 449, 2274
- Jarugula et al. (2019) Jarugula S., et al., 2019, ApJ, 880, 92
- Jarugula et al. (2021) Jarugula S., et al., 2021, ApJ, 921, 97
- Kim et al. (2013) Kim D.-C., et al., 2013, The Astrophysical Journal, 768, 102
- Lehnert et al. (2020) Lehnert M. D., Yang C., Emonts B. H. C., Omont A., Falgarone E., Cox P., Guillard P., 2020, A&A, 641, A124
- Li et al. (2020) Li J., et al., 2020, ApJ, 889, 162
- Lis et al. (2011) Lis D. C., Neufeld D. A., Phillips T. G., Gerin M., Neri R., 2011, ApJ, 738, L6
- Liu et al. (2017) Liu L., et al., 2017, ApJ, 846, 5
- Lonsdale et al. (2006) Lonsdale C. J., Farrah D., Smith H. E., 2006, in Mason J. W., ed., , Astrophysics Update 2. p. 285, doi:10.1007/3-540-30313-8_9
- Lu et al. (2017) Lu N., et al., 2017, ApJS, 230, 1
- Mottram et al. (2014) Mottram J. C., et al., 2014, A&A, 572, A21
- Neufeld et al. (1995) Neufeld D. A., Lepp S., Melnick G. J., 1995, ApJS, 100, 132
- Omont et al. (2011) Omont A., et al., 2011, A&A, 530, L3
- Omont et al. (2013) Omont A., et al., 2013, A&A, 551, A115
- Ott (2010) Ott S., 2010, in Mizumoto Y., Morita K. I., Ohishi M., eds, Astronomical Society of the Pacific Conference Series Vol. 434, Astronomical Data Analysis Software and Systems XIX. p. 139 (arXiv:1011.1209), doi:10.48550/arXiv.1011.1209
- Pearson et al. (2016) Pearson C., et al., 2016, ApJS, 227, 9
- Pensabene et al. (2021) Pensabene A., et al., 2021, A&A, 652, A66
- Pensabene et al. (2022) Pensabene A., et al., 2022, A&A, 667, A9
- Riechers et al. (2013) Riechers D. A., et al., 2013, Nature, 496, 329
- Riechers et al. (2017) Riechers D. A., et al., 2017, ApJ, 850, 1
- Sánchez-Portal et al. (2014) Sánchez-Portal M., et al., 2014, Experimental Astronomy, 37, 453
- Sanders & Mirabel (1996) Sanders D. B., Mirabel I. F., 1996, ARA&A, 34, 749
- Sanders et al. (2003) Sanders D. B., Mazzarella J. M., Kim D. C., Surace J. A., Soifer B. T., 2003, AJ, 126, 1607
- Solomon & Vanden Bout (2005) Solomon P. M., Vanden Bout P. A., 2005, ARA&A, 43, 677
- Solomon et al. (1997) Solomon P. M., Downes D., Radford S. J. E., Barrett J. W., 1997, ApJ, 478, 144
- Stanley et al. (2021) Stanley F., Knudsen K. K., Aalto S., Fan L., Falstad N., Humphreys E., 2021, A&A, 646, A178
- Weiß et al. (2010) Weiß A., et al., 2010, A&A, 521, L1
- Yang et al. (2013) Yang C., Gao Y., Omont A., Liu D., Isaak K. G., Downes D., van der Werf P. P., Lu N., 2013, ApJ, 771, L24
- Yang et al. (2016) Yang C., et al., 2016, A&A, 595, A80
- Yang et al. (2017) Yang C., et al., 2017, A&A, 608, A144
- Yang et al. (2019a) Yang C., et al., 2019a, A&A, 624, A138
- Yang et al. (2019b) Yang J., et al., 2019b, ApJ, 880, 153
- Yang et al. (2020) Yang C., González-Alfonso E., Omont A., Pereira-Santaella M., Fischer J., Beelen A., Gavazzi R., 2020, A&A, 634, L3
- van Dishoeck et al. (2013) van Dishoeck E. F., Herbst E., Neufeld D. A., 2013, Chemical Reviews, 113, 9043
- van Dishoeck et al. (2021) van Dishoeck E. F., et al., 2021, A&A, 648, A24
- van der Werf et al. (2011) van der Werf P. P., et al., 2011, ApJ, 741, L38
Appendix A Photometry of the galaxies
The following Table 3 presents the photometric fluxes derived from the PACS analyses at 100 m and 160 m (see Section 2.4). Data is presented together with fluxes taken from the literature.
| N | WISE | IRAS | PACS | IRAS | PACS | PACS | SPIRE | SPIRE | SPIRE |
|---|---|---|---|---|---|---|---|---|---|
| 22m | 60m | 70m | 100m | 100m | 160m | 250m | 350m | 500m | |
| [Jy] | [Jy] | [Jy] | [Jy] | [Jy] | [Jy] | [Jy] | [Jy] | [Jy] | |
| 1 | 0.214 0.001 | 5.13 0.15 | 5.65 0.28 | 1.23 0.02 | 0.397 0.001 | 0.130 0.008 | |||
| 2 | 0.548 0.003 | 31.14 1.87 | 38.09 1.74 | 34.90 2.09 | 38.58 0.02 | 23.31 0.10 | 7.92 0.04 | 2.95 0.01 | 0.954 0.009 |
| 3 | 0.430 0.002 | 11.47 0.57 | 12.81 0.58 | 13.25 0.02 | 8.09 0.08 | 2.449 0.007 | 0.823 0.004 | 0.252 0.005 |
Appendix B Herschel SPIRE-FTS
The following Figure 5 presents the full spectra obtained by Herschel SPIRE-FTS for IRAS6035-7102, IRAS17208-0014 and IRAS09022-3615
Appendix C Dust continuum
The following Figure 6 compares different dust continuum observations towards IRAS 09022-3615. A comparison between the emission PACS 100 m, Spitzer-MIPS 24 m and ALMA 630 m are shown. \colorblack Considering the alignment between the Spitzer-24 m and ALMA-630 m photometry, and that PACS photometry lies between these two wavelengths, the figure suggests the PACS offset (see Figure 4) might be related to a calibration issue with the Herschel astrometry.