Towards Behavioral-aware Crowd Management System
Abstract.
Instances of casualties resulting from large crowds persist, highlighting the existing limitations of current crowd management practices. One notable drawback is the insufficient provision for disadvantaged individuals who may require additional time to evacuate due to their slower running speed. Moreover, the existing escape strategies may fall short of ensuring the safety of all individuals during a crowd surge. To address these pressing concerns, this paper proposes two crowd management methodologies. Firstly, we advocate for the implementation of a fair evacuation strategy following a surge event, which takes into account the diverse needs of all individuals, ensuring inclusivity and mitigating potential risks. Secondly, we propose a preventative approach involving the adjustment of attraction locations and switching between stage performances in large-crowded events to minimize the occurrence of surges and enhance crowd dispersion. To assess the effectiveness of our proposals, we used high-fidelity crowd management simulators. Our findings demonstrate the positive impact of the fair evacuation strategy on safety measures and inclusivity, which increases fairness by on average. Furthermore, the adjustment of attraction locations and stage performances has shown a significant reduction in the incidence of surges by on average, thereby enhancing overall crowd safety.
1. Introduction
Crowd surge incidents, which occur when a large number of people enter or exit a confined space, pose significant risks to public safety (Illiyas et al., 2013). Recent stampede incidents in Itaewon (Sharma et al., 2023) and Astroworld Festival (The New York Times, 2021) highlight the need for improved crowd management methods. In Itaewon, trapped individuals struggled to move or breathe, leading to deaths and injuries. At the Astroworld Festival, deaths and multiple injuries from the crush near the stage. Limited entry points, uneven terrain, and unexpected choke points increase the risk of stampedes. Event organizers must implement strategies, such as careful scheduling, venue planning, sufficient staffing, and clear communication to ensure attendees’ safety and prevent property damage. These tragedies emphasize the importance of effective crowd management at mass gathering events.
“Smart Crowd Management and Control System” (CMS) is tasked with monitoring, directing, and managing large groups of people—with an eye toward safety, efficiency, and satisfaction. CMS requires a diverse range of knowledge, including engineering, technology, and understanding of crowd behavior (Sharma et al., 2018). The goal is to prevent crowd surge incidents through meticulous planning and execution. Effective crowd management involves multiple stages: pre-event planning, event monitoring and control, post-event feedback, and improvement. This holistic approach ensures continuous enhancement in crowd management strategies for future events. However, we believe that each of these approaches has different effects on healthy individuals, people with disabilities, children, pregnant women, and neurodivergent communities. Therefore, while managing the crowd flow, CMS should not only aim to maximize the efficiency, but also ensure fairness in distributing the adverse effect of the CMS control actions among different individuals. This vision is attainable with the advancement in sensor technologies to estimate the human state through wearable devices, and the decision-making algorithms that provide trade-offs between system performance, fairness, and privacy in multi-human environment (Elmalaki, 2021; Taherisadr et al., 2023). This technological leap in human sensing and decision-making algorithms should be exploited in CMS to ensure inclusivity in crowd management algorithms.
In this paper, we advocate for implementing a fair evacuation strategy and prevention approaches that account for the diverse needs of all individuals. By embracing an inclusive approach, we can provide the necessary time and assistance to disadvantaged individuals, helping them to evacuate safely and efficiently. Through thoughtful planning and coordination, we can mitigate potential risks and minimize casualties.
The contribution of this paper is in two aspects, (1) fair evacuation strategy: we investigated the correlation between assigning escape exits and the evacuation efficiency and fairness measured in time-to-escape, particularly after a crowd surge incident; and (2) prevention approach: we performed experiments for timely adjustments to the location of stages in big gathering events to prevent crowd surge incidents. We utilize high-fidelity CMS simulators, including Vadere (Kleinmeier et al., 2019) and NetLogo (Tisue and Wilensky, 2004) to simulate various crowd scenarios.
2. Background & Related Work
Crowd surges pose a significant risk when a large number of individuals attempt to enter or exit a confined area, leading to increased pressure and potential danger. In tightly packed crowds, people lose control of their movements and face difficulties breathing. The lack of space for recovery makes stumbling or falling particularly hazardous, putting individuals at risk of suffocation and injuries from being crushed. The probability of a surge occurring is closely related to crowd density. When there are 4-5 people per square meter, the crowd remains relatively safe, with enough space for individuals to make movement decisions. However, when the number exceeds 6 per square meter, the limited available space forces tight packing and diminishes individual control, significantly increasing the likelihood of a surge (Abuarafah et al., 2012). A single stumble or jolt within the crowd can trigger a chain reaction, creating voids that disrupt the crowd’s equilibrium. Subsequently, more people stumble into these voids, setting off a domino effect and generating additional voids. This interplay of forces can cause abrupt collapses, intensifying pressure and chaos within the crowd, potentially leading to injuries or fatalities if not managed properly (Aalami and Kattan, 2020). Throughout history, large-scale stampedes have taken place worldwide, leading to severe loss of life and property damage. On October 29, 2022, a Halloween event occurred in Seoul, South Korea, attracting tens of thousands of costumed attendees to the Itaewon district. This marked the first unrestricted Halloween celebration in over two years due to COVID-19 lockdowns. The massive crowd in the narrow streets, coupled with limited entry and exit points, created a dangerous situation. Videos from that night show trapped individuals struggling to move or breathe, fueling panic that spiraled out of control. This catastrophe led to one of South Korea’s worst stampede disasters, with 156 deaths and 170 crush injuries (Sharma et al., 2023). Similarly, on April 30, 2021, a devastating crowd surge occurred at Mount Meron, Israel, during an annual pilgrimage on the Jewish holiday of Lag BaOmer. The event attracted around 100,000 attendees and resulted in 45 deaths and approximately 150 injuries, making it Israel’s deadliest civilian disaster. The tragedy unfolded as people exited a mountainside compound, moving through a wet, sloping passageway towards a staircase. Witnesses described attendees tripping and slipping, while others unknowingly continued, causing trampling, crushing, and asphyxiation. Israeli media reported that COVID-19 precautions created unanticipated choke points. Additionally, bonfires were not lit simultaneously, leading to people attending multiple lightings and increasing the number of attendees.
These tragic incidents highlight the importance of crowd management at mass gathering events. The sheer number of people in a confined space can create a dangerous situation that can quickly spiral out of control, resulting in stampedes and crush injuries. Factors such as limited entry and exit points, uneven terrain, and unexpected choke points can exacerbate the risk of a stampede. Therefore, it is crucial for event organizers and authorities to implement effective crowd management strategies to prevent such incidents. This comprises actions such as appropriate scheduling of event timing, meticulous event venue planning and design, sufficient staffing, and unambiguous communication and signage. Effective crowd management not only ensures the safety and well-being of attendees but also helps to prevent damage to property and infrastructure. In light of the recent stampede incidents, it is clear that crowd management should be given the utmost importance in planning and executing mass gathering events.
Crowd management is a multifaceted field that necessitates knowledge of engineering and technology, as well as comprehension of crowd behavior and crowd flow management, encompassing psychological and sociological aspects (Sharma et al., 2018). By meticulous planning and execution, the objective of crowd management is to prevent crowd incidents (Martella et al., 2017). Effective crowd management is a holistic process that includes several stages. It begins with meticulous planning before the event, considering all potential scenarios and preparing for them. During the event, the crowd needs to be closely monitored and controlled to ensure everyone’s safety. After the event, it’s important to gather feedback to understand what worked well and what didn’t. Finally, these insights and lessons learned should be reported and used to improve crowd management strategies for future events. This approach ensures continuous improvement in managing crowds effectively (Sharma et al., 2018).
In the pre-event planning stage, two primary technologies play a crucial role: crowd modeling and simulation, and social and web data mining. Crowd modeling and simulation enable the creation of virtual crowd scenarios, which serve as testing grounds for various crowd management strategies and their effectiveness. On the other hand, social and web data mining provides valuable insights into crowd demographics, behaviors, and trends. These insights help inform decision-making and enable the customization of crowd-management strategies to suit specific audience profiles. By leveraging these technologies in pre-event planning, crowd management can be approached with a greater level of knowledge, strategy, and effectiveness(Sharma et al., 2018).
As for the in-event control period, the acquisition of crowd data during monitoring, decision-making based on data analysis, and the implementation of crowd control measures are three key steps for success(Sharma et al., 2018). The primary goal of crowd control during the event is to detect instances of mass panic and respond quickly to dangerous situations. Various existing research proposed numerous methods for detecting crowd density to prevent surge incidents or to enforce social distancing. For instance, infrared thermal video sequences have been employed to monitor and estimate the density of crowds in real-time during large-scale public events (Abuarafah et al., 2012). In addition, given the widespread Wi-Fi availability, it has been used to monitor crowd behavior and interaction (Zhou et al., 2020; Weppner et al., 2016).
Post-event feedback is crucial for preventing future incidents, and in this regard, social media data plays a pivotal role. The system for situational awareness can be enhanced by integrating feedback from the crowd and information related to the crisis that comes from social media. For example, in a system known as the HADRian, social media data was scrutinized after the Boston Marathon bombing in April 2013 to identify any unexploded or additional bombs(Ulicny et al., 2013). Another example is Ushahidi, which is a versatile data collection, management, and visualization tool that enables data collection from multiple sources such as SMS, email, web, Twitter, and RSS, and offers robust features for post management and triaging through filters and workflows(Ushahidi, [n. d.]). Systems built on Ushahidi have been implemented worldwide in numerous situations, for instance, to oversee disaster relief efforts after the Haiti Earthquake in January 2010(Yuan et al., 2013).
Moreover, the outbreak of COVID-19 needed new real-time approaches for crowd monitoring and management systems for social distancing. Furthermore, Virtual Reality (VR) technology has been applied to replicate the crucial parts of the 2010 Love Parade tragedy. Analyzing the emotional responses and stress levels of participants helps decision-makers gain enhanced insights into crowd management strategies for comparable occurrences (Zhao, 2016). Additionally, some studies have devised crowd management approaches that consider balancing crowd density and movement efficiency. One such study suggested a method that combines Geographic Information Systems and Agent-Based Modeling to simulate the movement of pilgrims during the Hajj days. The study simulated and evaluated five different scheduling plans for pilgrim movement and the results allow hajj authorities to make informed decisions about the most appropriate scheduling plans in terms of safety and effectiveness(Yaagoubi et al., 2023).
3. Evacuation Fairness Experiment
The importance of fairness in evacuating crowds lies in achieving a balanced distribution of evacuees across routes, ensuring equitable waiting times for different groups. Vulnerable groups, such as the elderly or pregnant women, are often overlooked in standard evacuation plans due to their physical limitations (United Nations, 2004). The motivation for this section is to propose evacuation plans that ensure similar evacuation times for all individuals, regardless of their physical condition.
3.1. Modeling and Simulation
Our experimental goal is to explore the design of evacuation routes for different groups of people in various crowd-gathering locations, aiming to achieve both high evacuation efficiency and fairness towards vulnerable populations. In real-life scenarios, the different running speeds of vulnerable groups and normal individuals can influence evacuation times, potentially leading to hazards like pushing or tripping. To address this, we propose a strategy where a dedicated evacuation exit is designated exclusively for vulnerable groups, guided by mobile notifications or other means, while other individuals can use the nearest exit. We hypothesize that this design can reduce overall evacuation time, especially for vulnerable groups, ensuring efficiency and fairness simultaneously. To validate our hypothesis, we proposed strategies across multiple crowded event scenarios to assign the evacuation gate:
-
•
Randomly gate assignment(RGA): Individuals evacuate by randomly selecting a gate without any specific guidance.
-
•
Vulnerable people exclusive gate assignment(VEGA): Vulnerable individuals are directed to a designated gate exclusively, while normal people are assigned the closest gate.
-
•
Closest gate assignment(CGA): All individuals are assigned the closest gate regardless of their physical state.
We used Vadere (Kleinmeier et al., 2019) to simulate various crowd event setups which we call a map. Four evacuation exits were placed at the corners of the map. On the map, there are people, consisting of vulnerable people and healthy normal people. The average slow running speed of healthy and young individuals (aged 20-45 years) is 5.4 miles per hour or 2.4 meters per second (Lung et al., 2021). Hence, we set the average speed of normal people to be meters per timestep. Each timestep represents seconds. Vulnerable people, such as the elderly move at a slower pace We exploited the Optimal Steps Model (OSM) in Vadere which incorporates the psychological principle of “social distance” into its mathematical framework, which means that agents strive to avoid encroaching on others’ personal or intimate space and to prevent physical contact (Kleinmeier et al., 2019).


(a)(b)


(c)(d)
3.2. Evaluation
We simulated various scenarios for crowd distribution on the map illustrated in Figure 1:
-
•
Scenario 1: Center crowd gathering: Serving as an exemplar for an event with a setup focused on the center stage.
-
•
Scenario 2: Non-center crowd gathering: Serving as an exemplar for an event with a setup focused on a non-center stage.
-
•
Scenario 3: Evenly crowd dispersing: Representing carnival event across the entire map.
-
•
Scenario 4: Unevenly crowd dispersing: Representing carnival event with varying area of crowd densities: in top-left, in top-right, in bottom-left, and in bottom-right.
| RGA | VEGA | CGA | |||||||
|---|---|---|---|---|---|---|---|---|---|
| (149.9, 80.9, 0.54) | 98.1 | (201, 187, 195, 195) | (154.3, 72.4, 0.47) | 92.8 | (198, 99, 88, 98) | (125.7, 68.3, 0.54) | 82.6 | (143, 144, 146, 150) | |
| (153.4, 83.8, 0.55) | 101.1 | (143, 193, 250, 200) | (97.0, 83.1, 0.86) | 86.5 | (140, 105, 115, 103) | (132.1, 70.9, 0.54) | 86.2 | (90, 153, 204, 158) | |
| (138.0, 70.5, 0.51) | 87.3 | (263, 254, 227, 257) | (137.4, 33.0, 0.24) | 59.0 | (262, 61, 63, 63) | (64.7, 33.5, 0.52) | 41.3 | (122, 116, 129, 112) | |
| (140.7, 69.5, 0.49) | 87.3 | (226, 233, 258, 250) | (91.2, 58.3, 0.64) | 66.5 | (260, 93, 60, 90) | (79.0, 41.8, 0.53) | 51.1 | (132, 122, 120, 116) | |
We measure the fairness of the time-to-evacuation across all individuals. We used a metric fairness index (FI) which indicates the ratio of normal healthy people’s time-to-evacuation to vulnerable people’s time-to-evacuation. This means the higher the FI value, the higher the notion of fairness. Table 1 presents the results of average time-to-evacuation and FI using three different strategies. Gate Time shows the last human exiting time in each gate, providing insight into the gate utility. RGA shows the worst time-to-evacuation for all people in all scenarios. In scenarios 1 and 3, CGA demonstrates the best average time-to-evacuation for all people. In scenarios 2 and 4, VEGA achieves the highest FI of and , respectively, with a slightly slower average time-to-evacuation compared to CGA for all individuals.
Takeaways:
Our preliminary experiment aims to investigate whether a specific evacuation strategy for vulnerable groups, such as VEGA, enhances fairness while maintaining overall efficiency. In crowd scenarios 1 and 3, the presence of a vulnerable exclusive gate may not improve fairness or efficiency when people initially gather around the center of each exit. Nonetheless, when a considerable number of vulnerable individuals congregate near a single exit, such as in scenarios 2 and 4, the VEGA strategy leads to a fairness improvement of on average, compared to both RGA and CGA. In scenario 2, the VEGA strategy demonstrates a fairness increase of and compared to RGA and CGA, while in scenario 4, it shows a fairness improvement of and compared to RGA and CGA. VEGA can decrease the time gap between vulnerable groups and others, and the average time-to-evacuation either reduces or remains relatively unchanged. In real-world scenarios, it is anticipated that some individuals may not adhere to the recommended guidelines set by the organizers or the automated crowd management system. Therefore, a comprehensive study into the social psychological dynamics of the crowd becomes imperative to better understand and address such situations.
4. Preventative Strategy
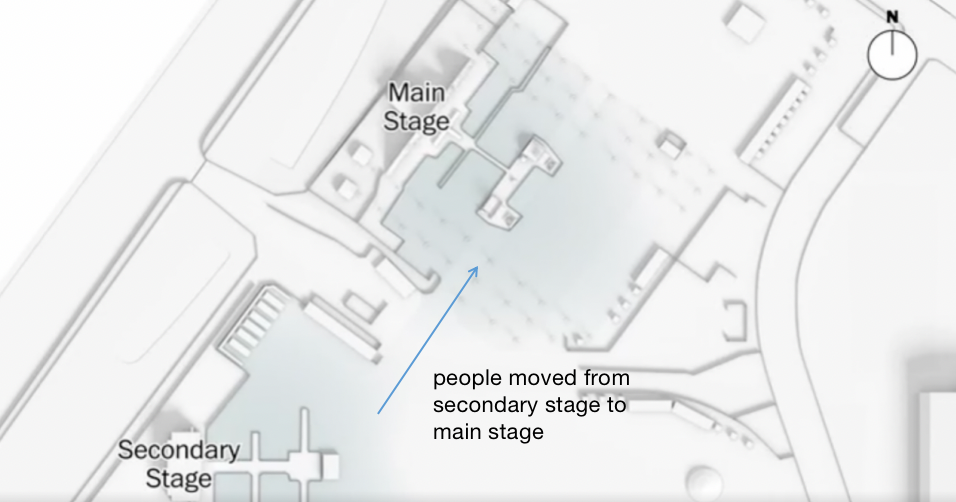
Our second experiment is motivated by the tragic Astroworld Festival accident in 2021 (The New York Times, 2021). The festival featured two stages: the main stage for the main performance and a secondary stage with performances by other artists throughout the day. During the concert night, after one performance at the secondary stage, the audience began moving towards the already crowded area near the main stage, resulting in a surge and crush near the stage, as depicted in Figure 2.
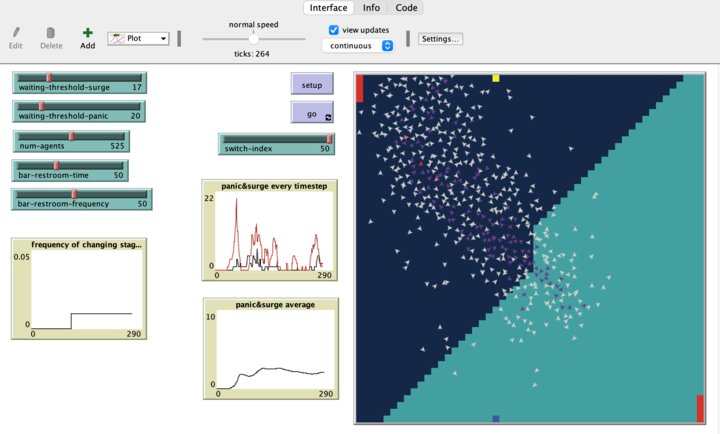
Our prevention strategy suggests alleviating congestion during stage performances by employing stage switching at designated time intervals. This approach aims to decrease the likelihood of overcrowding and improve crowd management throughout the event. To determine the optimal switching points between stages, we propose three metrics; the Panic State and the Surge State per individual, and the Crowded State for each subarea. We will explain how to determine these metrics in Section 4.1. We developed a tool using NetLogo, an agent-based programmable modeling environment (Tisue and Wilensky, 2004; Zia and Ferscha, 2020), to configure various user-definable attributes, such as position and walking speed.
4.1. Modeling and Simulation
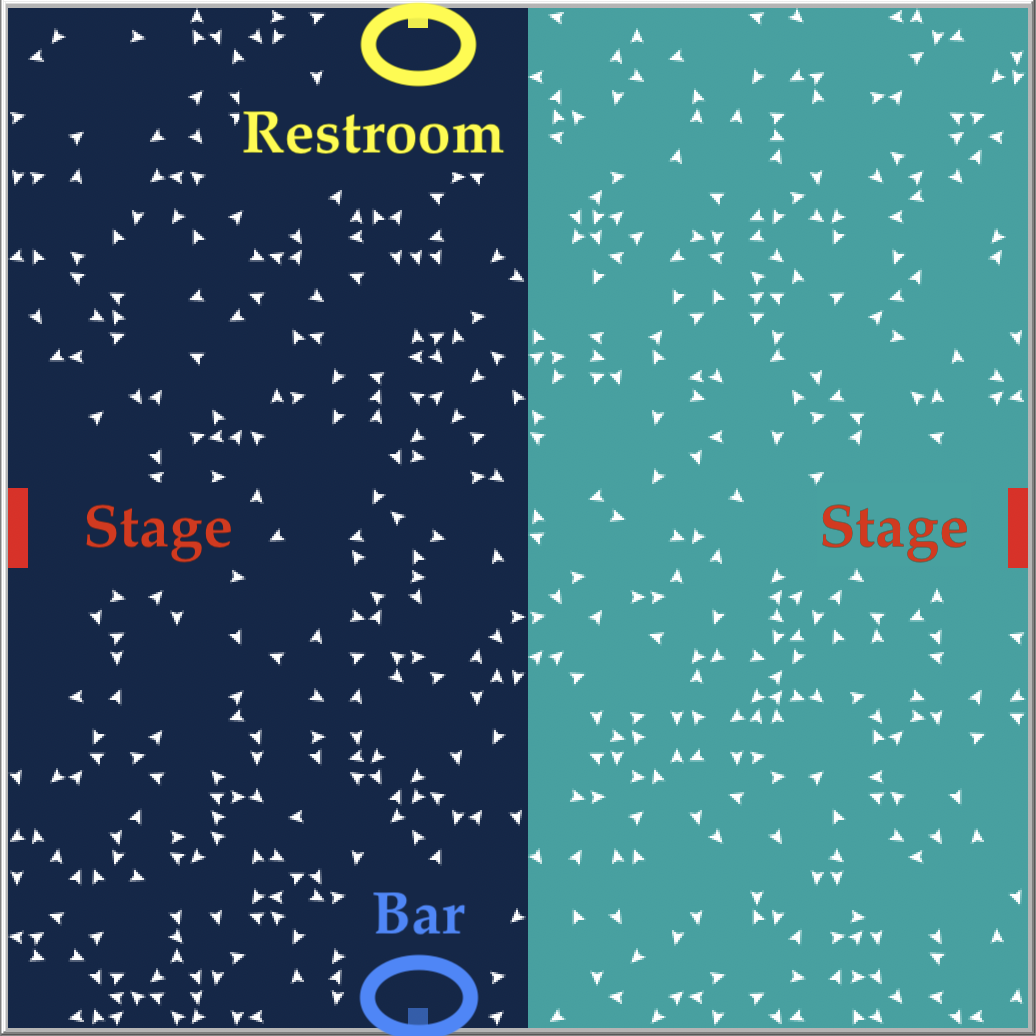
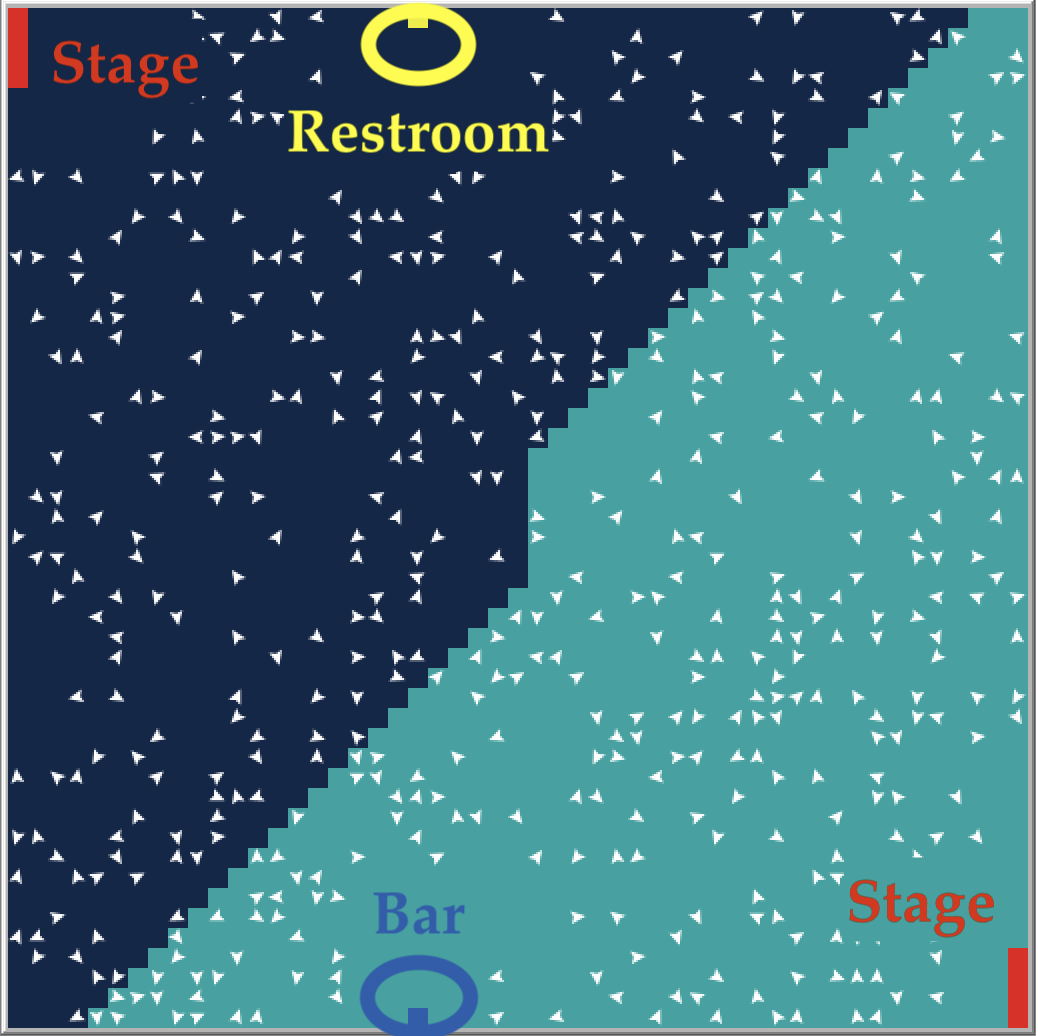
We simulate a crowded scene with two stages in a two-dimensional square world composed of patches. Each patch is represented by a xy-coordinate point, with the origin located at the left bottom. The map is divided into multiple subareas using a grid, with each subareas containing patches. Each human, depicted as triangular shapes, resides on these patches and utilizes information from the underlying patch and neighboring patches and people to make decisions. The scene includes two stages, a bar, and a restroom. The stages are positioned at the far left and right sides of the scene, respectively, while the bar and restroom are located at the top and bottom sides of the scene. Figure 3 provides a visual representation of the map. In order to make the simulation scenes more realistic, the simulation considers four factors: the speed of humans, psychological factors, such as comfort zone and the preferred distance from the stage performance, and hesitation time the frequency and duration of visits to the bar or restroom, which can be changed in the interface,
The first is speed. The paper uses the ”random” method in NetLogo’s code to randomly set the speed of half of the agents to 1 step per time-step, and the speed of the other half of the agents to 2 steps per time-step.
The second is a comfort zone and the preferred distance. This paper takes into account that everyone has a different level of comfort when it comes to the distance from the stage. For example, some people like to watch performances right by the stage, while others are satisfied with watching from a slightly farther distance. Therefore, in the NetLogo code, we randomly set the comfort distance of each agent between 1-10 meters.
Third, People in the scene randomly go to the bar and a restroom. The total time spent and the frequency of going to the bar or restroom could be set in the NetLogo interface. Our current setting is that 40% of the agents go to the bar or restroom every 50 time-steps, and the duration of each trip is 50 time-steps. Additionally, we have included adjustment bars for users to set the frequency and duration of going to the bar or restroom in the NetLogo interface according to their requirements.
The last one is hesitation time. This paper considers the variation in the time agents take to decide whether to switch stages after a performance has ended. Some agents may move to another stage immediately, while others may stay around the original stage for some time before moving to another one. To capture this, we assigned a random hesitation time between 1-20 timesteps to each agent in the NetLogo code.
Our prevention strategy focuses on determining the best time to switch stages, considering various parameters. To achieve this, we have developed a simulation tool that can evaluate different scenarios and parameters, allowing us to estimate the most suitable moment for switching the performance to a new stage. We propose using a set of metrics to determine the status of individuals and subareas during the event:
-
•
Panic state: Once an individual is blocked and stuck on the way to the restroom or bar for some time more than a particular threshold (panic threshold (PT)) the individual enters the panic status.
-
•
Surge state: Once an individual is blocked and stuck on the way to the stage for some time more than a particular threshold (surge threshold (ST)), the individual enters the surge state.
-
•
Crowded state: A subarea enters the crowded state when over of its patches have people, and at least one person is in a panic or surge state.
-
•
Switch index (SI): The switch index (SI) refers to a threshold on the time for which a subarea is continuously in the crowded state before the performance is switched to the other stage.
When a subarea consistently stays in a crowded state, exceeding the threshold of the switch index (SI), and its two neighboring subareas are in a crowded state (not necessarily passed the threshold of the SI), it indicates a critical surge situation. At this point, the currently performing stage will receive instructions to stop, and the performance switches to another stage.
(a)(b)(c)
(d)(e)
4.2. Evaluation
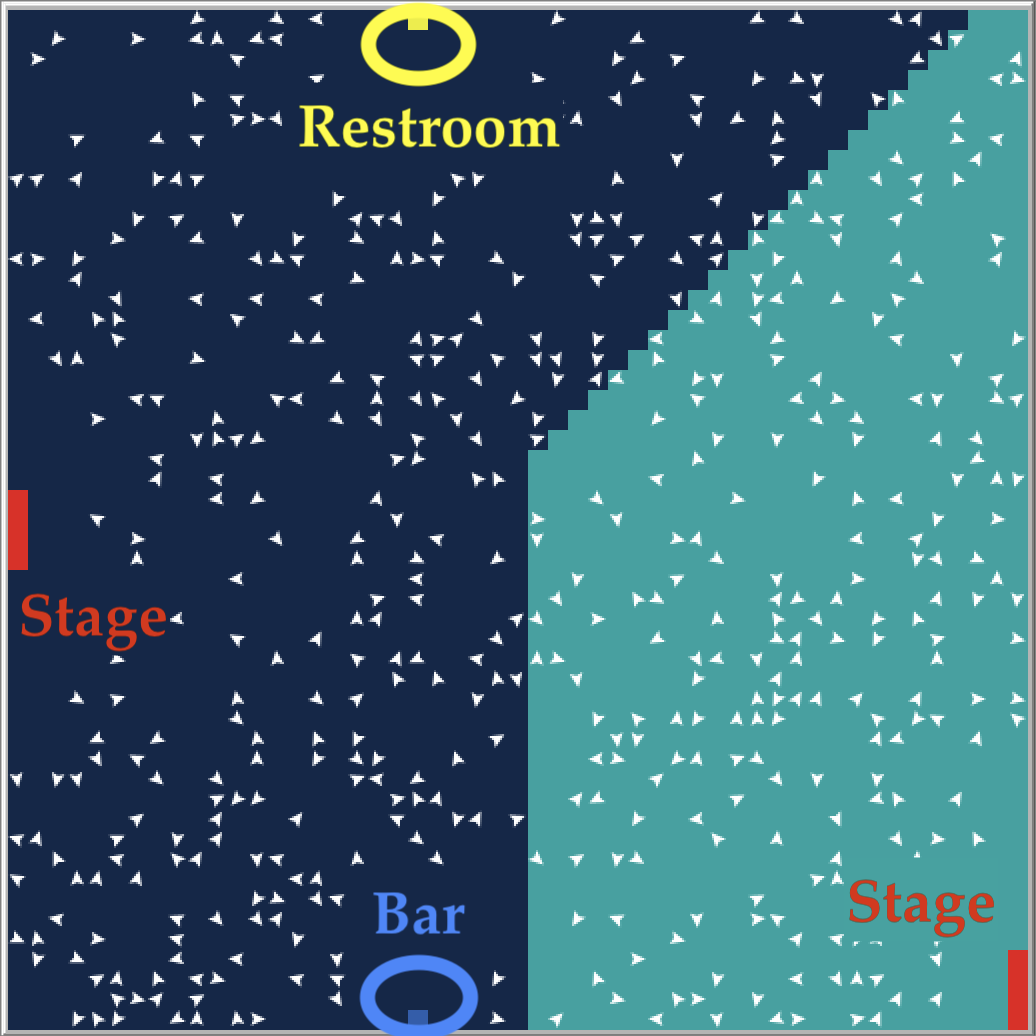
We first explored the correlation between stage positions and the likelihood of surge accidents. The Astroworld tragedy highlighted the significant impact of stages’ close proximity. Figure 4 illustrates three maps with different stage positions: Map A features stages placed directly facing each other, Map B has one stage in the bottom-right corner and another in the middle on the left side, while Map C positions two stages at the top-left and bottom-right, respectively. In each map, the speed of half the people doubles the other half. Each individual’s comfort distance is randomly set between units patch-size, and their hesitation time is randomly assigned between time-steps. The Switch Index(SI) is set at time-steps. We assign for the people to go to the bar or restroom and each trip lasts for time-steps. Additionally, we have four adjustable parameters: total number of people (PN), frequency of bar/restroom visits (BRF), Panic Threshold (PT), and Surge Threshold (ST). The default parameters are set as follows: PN , BRF , PT , and ST .
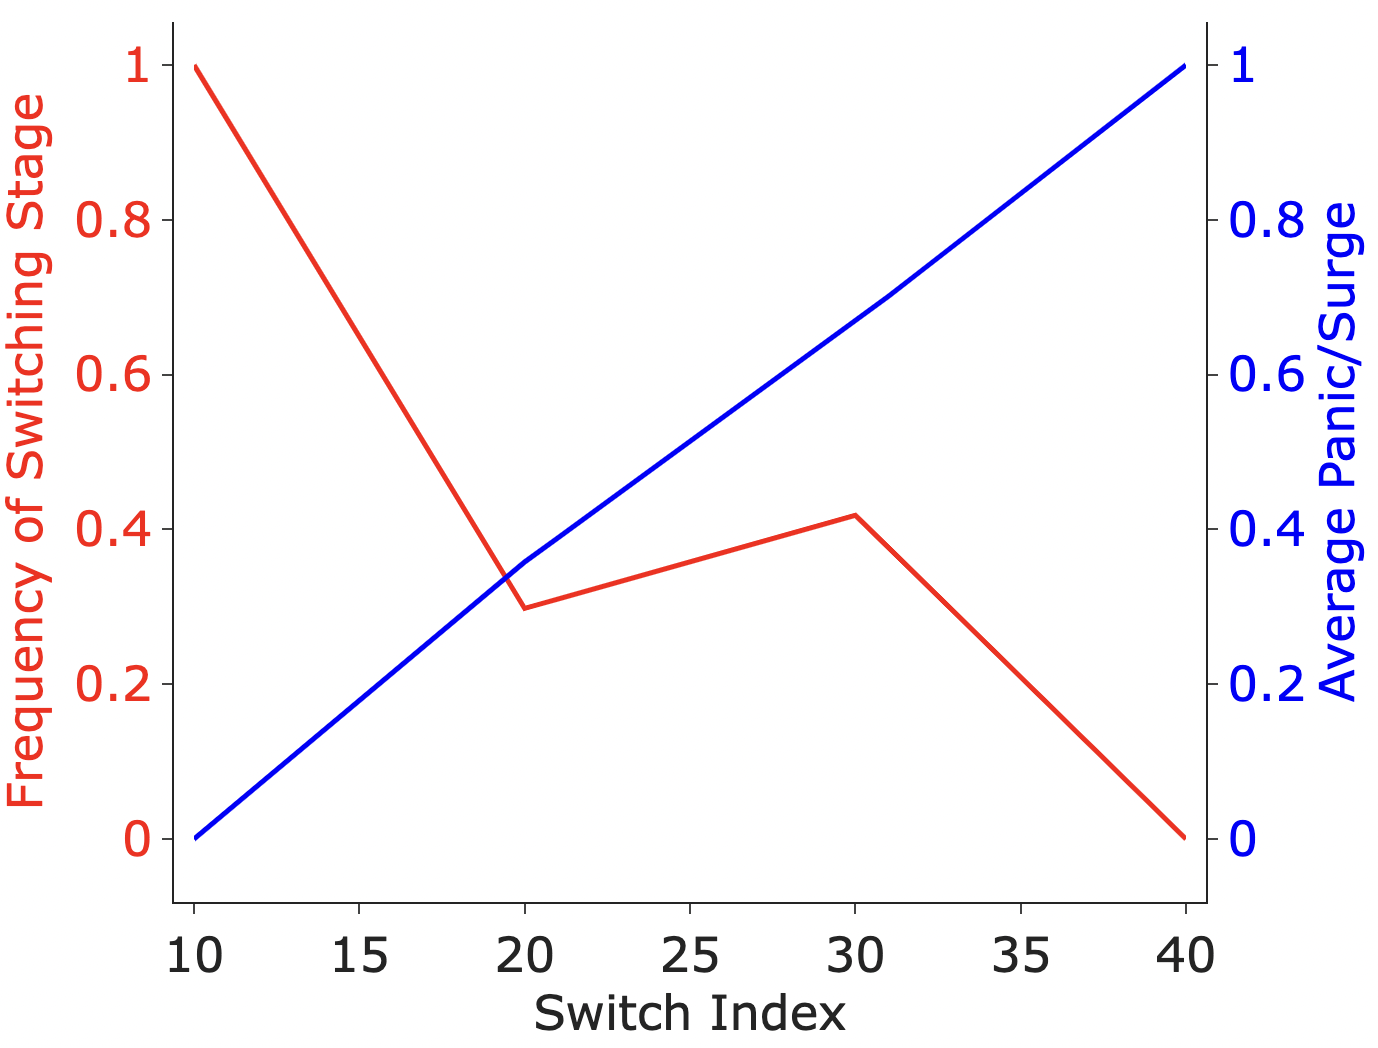
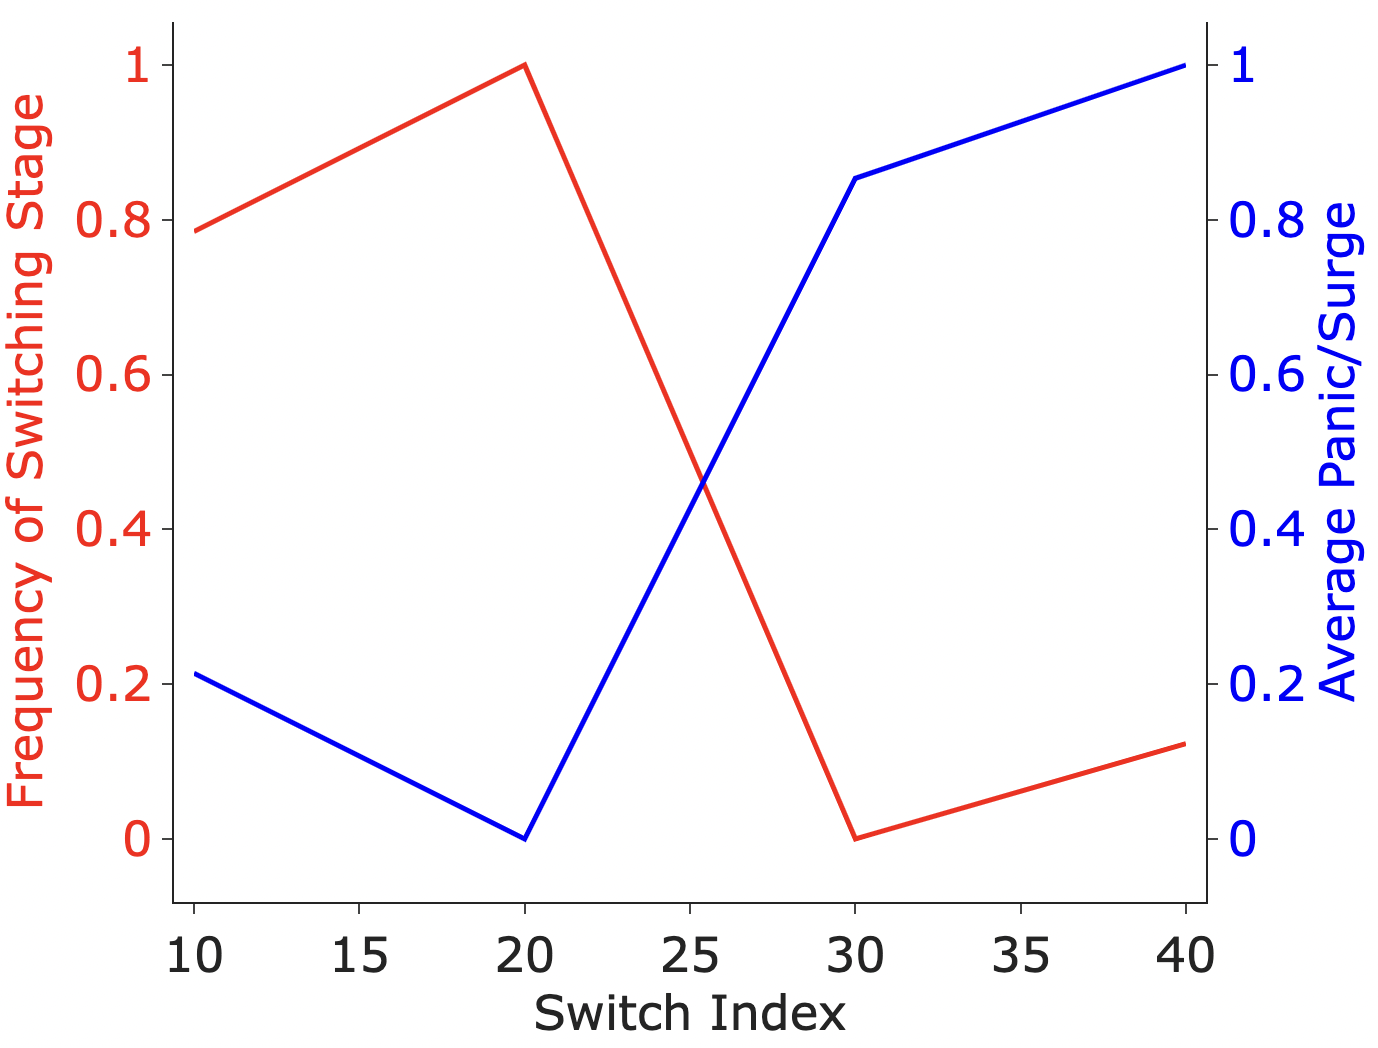
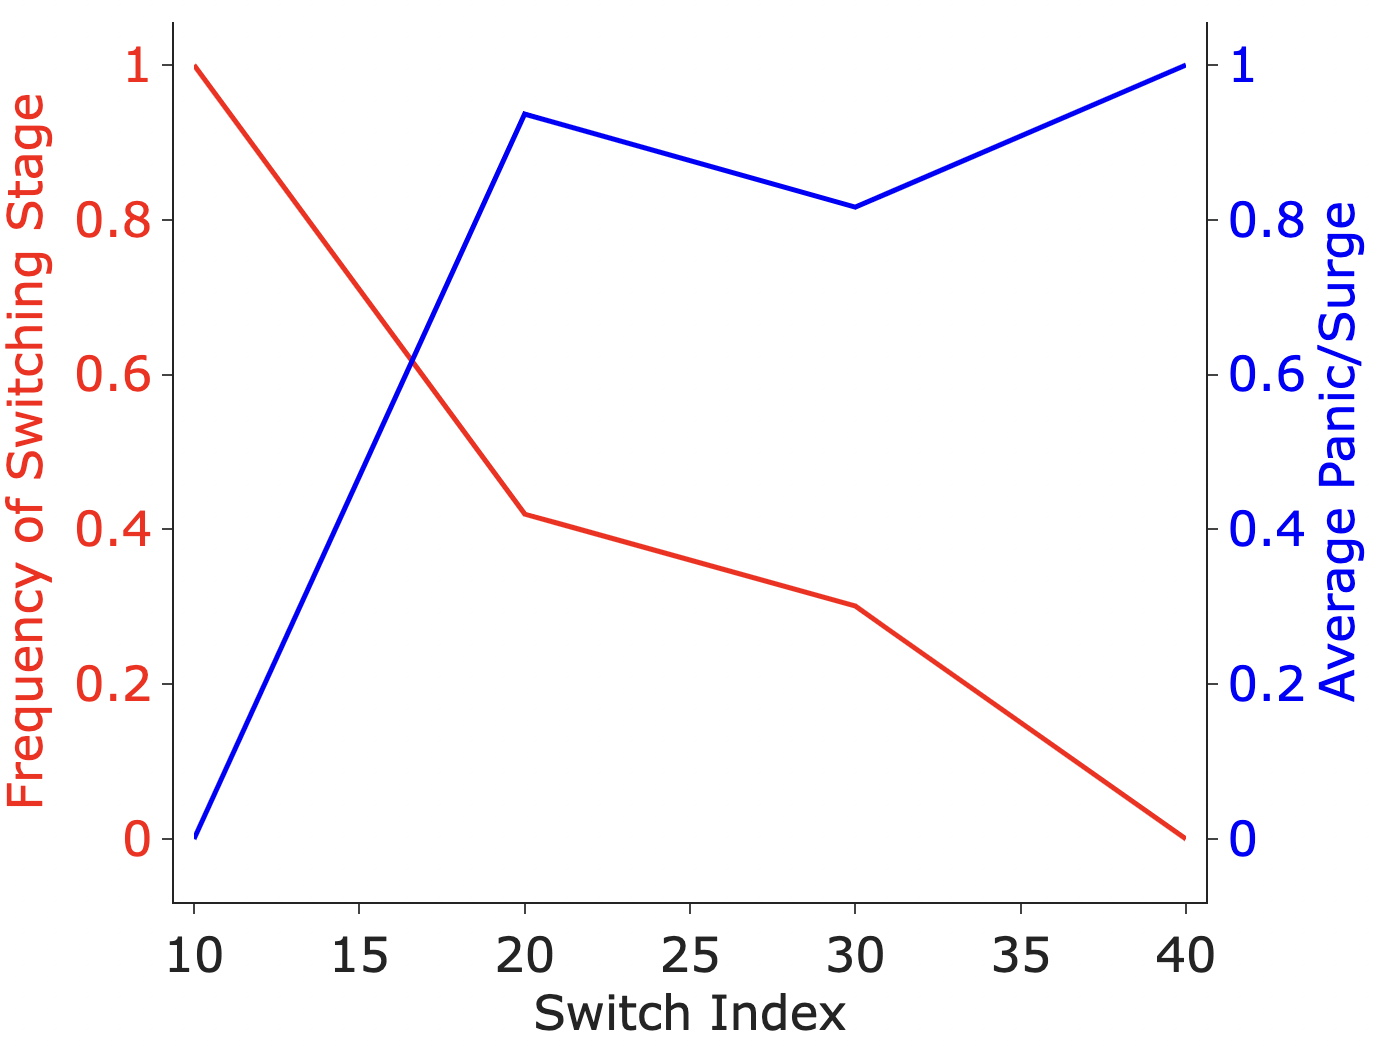
We utilize several metrics to assess crowd behavior. We consider the Frequency of stage switching (F) and Average Panic/Surge (APS). The Average Panic/Surge (APS) metric reflects the average number of people in Panic/Surge Status per timestep. These metrics collectively help us understand and evaluate the effectiveness of our strategies and response measures. Our experiments showed that in Map A, the Frequency of stage switching (F) is and the Average Panic/Surge (APS) is . In Map B, the F is and APS is . In Map C, the F is and APS is . On average, Map C reduced F by and APS by . The results in Map C show that increasing the distance between the two stages can reduce both the likelihood of crowd surge occurrence and the stage switching frequency. Therefore, the subsequent experiments will Map C to explore the effect of choosing different values of SI on F and APS under different parameters including:
-
•
Total number of people (PN): Figure 4(a) is 500. In Figure 5(b), PN increases to 750, showcasing a more crowded environment.
-
•
Frequency of bar/restroom use (BRF): Figure 4(a) is 50 while in Figure 5(c), BRF decreases to 30, indicating limited availability of restroom and bar facilities.
-
•
Panic threshold (PT) and Surge threshold (ST): Different values of ST and PT represent varying audience compositions. Figure 4(a) has ST=10 and PT=10. In Figure 5(d)(e), with ST increasing to 40, and with PT increasing to 20.
In all of these setups, we observed that the value of SI provides a tradeoff between the frequency of switching stages (F) and the average of panic/surge (APS). Indeed this tool can provide insights to the event organizers to balance the frequency of switching the stages.
Takeaways:
Our experiments have provided insights into the correlation between stage positions and crowd state. The analysis of SI and different parameters emphasizes the significance of adapting the SI according to the crowd state and the availability of facilities. In real situations, to estimate the individual state (panic/surge state), people’s intention to move can be detected using wearable sensors, such as accelerometers, gyroscopes, and heart rate data from wearable devices. These sensors enable the estimation of gait parameters, making them useful for determining individuals’ states.
5. Future Work & Conclusion
Crowd evacuation and surge prevention represent critical research directions due to their significant implications for public safety, urban planning, and smart building systems. As urbanization and population density continue to rise, ensuring efficient and safe evacuation procedures during emergencies or crowded events becomes increasingly challenging. Our research focuses on addressing crowd management challenges by exploring both evacuation strategies and preventive methodologies. We emphasize the importance of balancing fairness and efficiency in evacuation plans while considering psychological factors influencing individual social distancing behavior during evacuations. Our preliminary results showed that by utilizing simulation tools like Vadere, we can design evacuation strategies that consider vulnerable people. Additionally, we developed a NetLogo-based tool to simulate preventive strategies based on the current crowd state. In the future, we aim to further optimize our preventive approach by integrating post-event analysis and privacy protection measures. These steps will ensure ethical data usage and enhance the overall effectiveness of crowd management.
Acknowledgements.
This research was partially supported by NSF award # CNS-2105084.References
- (1)
- Aalami and Kattan (2020) Soheila Aalami and Lina Kattan. 2020. Fairness and efficiency in pedestrian emergency evacuation: Modeling and simulation. Safety science 121 (2020), 373–384.
- Abuarafah et al. (2012) Adnan Ghazi Abuarafah, Mohamed Osama Khozium, and Essam AbdRabou. 2012. Real-time crowd monitoring using infrared thermal video sequences. Journal of American Science 8, 3 (2012), 133–140.
- Elmalaki (2021) Salma Elmalaki. 2021. Fair-iot: Fairness-aware human-in-the-loop reinforcement learning for harnessing human variability in personalized iot. In Proceedings of the International Conference on Internet-of-Things Design and Implementation. 119–132.
- Illiyas et al. (2013) Faisel T Illiyas, Shibu K Mani, AP Pradeepkumar, and Keshav Mohan. 2013. Human stampedes during religious festivals: A comparative review of mass gathering emergencies in India. International Journal of Disaster Risk Reduction 5 (2013), 10–18.
- Kleinmeier et al. (2019) Benedikt Kleinmeier, Benedikt Zönnchen, Marion Gödel, and Gerta Köster. 2019. Vadere: An open-source simulation framework to promote interdisciplinary understanding. arXiv preprint arXiv:1907.09520 (2019).
- Lung et al. (2021) Chi-Wen Lung, Ben-Yi Liau, Joseph A Peters, Li He, Runnell Townsend, and Yih-Kuen Jan. 2021. Effects of various walking intensities on leg muscle fatigue and plantar pressure distributions. BMC Musculoskeletal Disorders 22, 1 (2021), 1–9.
- Martella et al. (2017) C Martella, J Li, C Conrado, and A Vermeeren. 2017. On current crowd management practices and the need for increased situation awareness, prediction, and intervention. Safety science 91 (2017), 381–393.
- Sharma et al. (2023) Avinash Sharma, Brian McCloskey, David S Hui, Aayushi Rambia, Adam Zumla, Tieble Traore, Shuja Shafi, Sherif A El-Kafrawy, Esam I Azhar, Alimuddin Zumla, et al. 2023. Global mass gathering events and deaths due to crowd surge, stampedes, crush and physical injuries-lessons from the Seoul Halloween and other disasters. Travel medicine and infectious disease 52 (2023).
- Sharma et al. (2018) Deepak Sharma, Amol P Bhondekar, AK Shukla, and C Ghanshyam. 2018. A review on technological advancements in crowd management. Journal of Ambient Intelligence and Humanized Computing 9, 3 (2018), 485–495.
- Taherisadr et al. (2023) Mojtaba Taherisadr, Stelios Andrew Stavroulakis, and Salma Elmalaki. 2023. adaPARL: Adaptive Privacy-Aware Reinforcement Learning for Sequential Decision Making Human-in-the-Loop Systems. In Proceedings of the 8th ACM/IEEE Conference on Internet of Things Design and Implementation. 262–274.
- The New York Times (2021) The New York Times. 2021. ‘No Way Out’: A Sudden Life-and-Death Struggle at a Houston Concert. https://www.nytimes.com/2021/11/06/us/travis-scott-crowd-surge.html Accessed: 2023-05-14.
- Tisue and Wilensky (2004) Seth Tisue and Uri Wilensky. 2004. Netlogo: A simple environment for modeling complexity. In International conference on complex systems, Vol. 21. Citeseer, 16–21.
- Ulicny et al. (2013) Brian Ulicny, Jakub Moskal, and Mieczyslaw M Kokar. 2013. Situational Awareness from Social Media.. In STIDS. 87–93.
- United Nations (2004) United Nations. 2004. United Nations Enable - Accessibility Design for All. https://www.un.org/esa/socdev/enable/designm/AD1-04.htm Accessed: 2023-05-14.
- Ushahidi ([n. d.]) Ushahidi. [n. d.]. Ushahidi Support. Ushahidi. https://www.ushahidi.com/support/overview/
- Weppner et al. (2016) Jens Weppner, Benjamin Bischke, and Paul Lukowicz. 2016. Monitoring crowd condition in public spaces by tracking mobile consumer devices with wifi interface. In Proceedings of the 2016 ACM International Joint Conference on Pervasive and Ubiquitous Computing. 1363–1371.
- Yaagoubi et al. (2023) Reda Yaagoubi, Yehia Miky, Kamil Faisal, and Ahmed Al Shouny. 2023. A combined agent-based modeling and GIS approach for HAJJ crowd simulation. Journal of Engineering Research 11, 1 (2023), 100014.
- Yuan et al. (2013) Weiwei Yuan, Donghai Guan, Eui-Nam Huh, and Sungyoung Lee. 2013. Harness human sensor networks for situational awareness in disaster reliefs: a survey. IETE Technical Review 30, 3 (2013), 240–247.
- Zhao (2016) Hantao Zhao. 2016. Crowd Simulation and Virtual Reality Experiments for 2010 Love Parade Disaster. Master’s thesis. Department of Computer Science, ETH Zurich.
- Zhou et al. (2020) Yuren Zhou, Billy Pik Lik Lau, Zann Koh, Chau Yuen, and Benny Kai Kiat Ng. 2020. Understanding crowd behaviors in a social event by passive wifi sensing and data mining. IEEE Internet of Things Journal 7, 5 (2020), 4442–4454.
- Zia and Ferscha (2020) Kashif Zia and Alois Ferscha. 2020. An agent-based model of crowd evacuation: combining individual, social and technological aspects. In Proceedings of the 2020 ACM SIGSIM conference on principles of advanced discrete simulation. 129–140.