∎
corrauthor correspondence gerda-eb@mpi-hd.mpg.de \thankstextalsoMEPHIalso at: NRNU MEPhI, Moscow, Russia \thankstextnowDukenow at: Duke University, Durham, NC USA \thankstextalsoLevalso at: Moscow Inst. of Physics and Technology, Russia \thankstextalsoDubnaalso at: Dubna State University, Dubna, Russia \thankstextalsoRM3also at: INFN Roma Tre, Rome, Italy 11institutetext: INFN Laboratori Nazionali del Gran Sasso, Assergi, Italy 22institutetext: INFN Laboratori Nazionali del Gran Sasso and Gran Sasso Science Institute, Assergi, Italy 33institutetext: INFN Laboratori Nazionali del Gran Sasso and Università degli Studi dell’Aquila, L’Aquila, Italy 44institutetext: INFN Laboratori Nazionali del Sud, Catania, Italy 55institutetext: Institute of Physics, Jagiellonian University, Cracow, Poland 66institutetext: Institut für Kern- und Teilchenphysik, Technische Universität Dresden, Dresden, Germany 77institutetext: Joint Institute for Nuclear Research, Dubna, Russia 88institutetext: European Commission, JRC-Geel, Geel, Belgium 99institutetext: Max-Planck-Institut für Kernphysik, Heidelberg, Germany 1010institutetext: Department of Physics and Astronomy, University College London, London, UK 1111institutetext: INFN Milano Bicocca, Milan, Italy 1212institutetext: Dipartimento di Fisica, Università degli Studi di Milano and INFN Milano, Milan, Italy 1313institutetext: Institute for Nuclear Research of the Russian Academy of Sciences, Moscow, Russia 1414institutetext: Institute for Theoretical and Experimental Physics, NRC “Kurchatov Institute”, Moscow, Russia 1515institutetext: National Research Centre “Kurchatov Institute”, Moscow, Russia 1616institutetext: Max-Planck-Institut für Physik, Munich, Germany 1717institutetext: Physik Department, Technische Universität München, Germany 1818institutetext: Dipartimento di Fisica e Astronomia, Università degli Studi di Padova, Padua, Italy 1919institutetext: INFN Padova, Padua, Italy 2020institutetext: Physikalisches Institut, Eberhard Karls Universität Tübingen, Tübingen, Germany 2121institutetext: Physik-Institut, Universität Zürich, Zurich, Switzerland
An improved limit on the neutrinoless double-electron capture of 36Ar with GERDA
Abstract
The GERmanium Detector Array (Gerda) experiment operated enriched high-purity germanium detectors in a liquid argon cryostat, which contains 0.33% of 36Ar, a candidate isotope for the two-neutrino double-electron capture (2ECEC) and therefore for the neutrinoless double-electron capture (0ECEC). If detected, this process would give evidence of lepton number violation and the Majorana nature of neutrinos. In the radiative 0ECEC of 36Ar, a monochromatic photon is emitted with an energy of 429.88 keV, which may be detected by the Gerda germanium detectors. We searched for the 36Ar 0ECEC with Gerda data, with a total live time of 4.34 yr (3.08 yr accumulated during Gerda Phase II and 1.26 yr during Gerda Phase I). No signal was found and a 90% C.L. lower limit on the half-life of this process was established yr.
1 Introduction
The simultaneous capture of two bound atomic electrons followed by the emission of two neutrinos plus X-rays or Auger electrons, known as two-neutrino double-electron capture (2ECEC), is a nuclear process allowed in the Standard Model. Compared to the two-neutrino double-beta () decay, the simultaneous emission of two electrons and two anti-neutrinos, 2ECEC processes have lower probabilities due to the smaller phase space, therefore experimentally, they are much more challenging to observe. The first direct observation of 2ECEC was made only in 2018 by the XENON1T experiment with 124Xe XenonCollaboration2019 . Previously, indications of 2ECEC were found in geochemical measurements with 130Ba and 132Ba Meshik2001 and in a large proportional counter experiment with 78Kr Ratk2017 .
The lepton number violating counterpart of 2ECEC, the neutrinoless double-electron capture (0ECEC), in which no neutrinos are emitted, is also predicted Winter1955 . This process must be accompanied by the emission of at least another particle to ensure energy and momentum conservation. Different modes can be considered in which 0ECEC is associated with the emission of different particles like pairs, one or two photons, or one internal conversion electron Doi1993 ; Blaum2020 . In analogy with the neutrinoless double-beta () decay, the 0ECEC violates the lepton number symmetry by two units and implies that neutrinos have a Majorana mass component Georgi1981 . Although the sensitivity of 0ECEC processes to the Majorana neutrino mass is estimated to be many orders of magnitude lower than that of the decay, the interest in 0ECEC is theoretically motivated by the possibility of resonant enhancement when the parent nucleus and an excited state of the daughter nucleus are energetically degenerate Winter1955 ; Blaum2020 ; Georgi1981 ; Voloshin1982 ; Bernabeu1983 . In this case, the half-life of 0ECEC processes becomes comparable to that of decays. Experimental searches for 0ECEC have been performed by double- decay experiments, even though with less sensitivity compared to the search for decay Blaum2020 .
The GERmanium Detector Array (Gerda) experiment, whose main goal was to search for the decay of 76Ge GERDA:2012qwd ; GERDA:2020xhi , operated enriched high purity germanium detectors in a liquid argon (LAr) cryostat, which naturally contains the 36Ar isotope with an isotopic abundance of 0.33%. 36Ar can undergo 2ECEC to the ground state of 36S Tretyak1995 . The corresponding lepton number violating process, 0ECEC, may occur via the simplest radiative mode111Given the available energy of the process, the internal conversion mode would also be allowed for 36Ar. Nevertheless, the latter is strongly suppressed due to argon’s low atomic number and the relatively high energy Merle2009 .
| (1) |
The 36Ar nucleus captures one electron each from its K- and L-shells and turns into 36S. Two X-rays are emitted, with energies E keV, and E keV, corresponding to the capture of the electrons from the K- and the L-shell, respectively. Given the available energy of the decay Q keV Wang2012 , the corresponding energy for the ray is E keV. Resonance enhancement of the process is not possible for 36Ar Blaum2020 . In the light neutrino exchange scenario, assuming a Majorana mass of 0.1 eV, the half-life of 36Ar 0ECEC is predicted in the order of yr, with calculations based on the quasiparticle random-phase approximation (QRPA) Merle2009 . Experimental searches for 0ECEC of 36Ar have been performed since the early stages of the Gerda experiment Chkvorets2008 . The most stringent limit to date on the 36Ar 0ECEC half-life is T yr (90% C.I.), established in Phase I of the Gerda experiment Agostini2016 . More recently, this process has been searched with the DEAP detector Dunford2018 , although with less sensitivity than Gerda Phase I.
In this paper, we report on the search for the 429.88 keV line from the 36Ar 0ECEC with the whole Gerda data, accumulated for a total live time of 3.08 yr during Gerda Phase II and 1.26 yr during Gerda Phase I.
2 The GERDA experiment
The Gerda experiment was located at the Laboratori Nazionali del Gran Sasso (LNGS) of INFN, in Italy GERDA:2012qwd ; GERDA:2017ihb ; Agostini:2019hzm , where a rock overburden of 3500 m water equivalent reduces the flux of cosmic muons by six orders of magnitude GERDA:2012qwd . High-purity germanium (HPGe) detectors, isotopically enriched in 76Ge, were operated inside a 64 m3 LAr cryostat Knopfle:2022fso . In the second phase of the experiment, 10 coaxial (including 3 detectors with natural isotopic abundance) and 30 Broad Energy Germanium (BEGe) detectors were used GERDA:2017ihb . After an upgrade in May 2018, the three natural coaxial detectors were removed, and 5 additional inverted coaxial (IC) detectors were installed GERDA:2020xhi . Detectors were mounted on 7 strings, and each string was placed inside a nylon cylinder to limit the collection of radioactive potassium ions on the detector surfaces Lubashevskiy:2017lmf . The LAr volume around the detectors was instrumented with a curtain of wavelength-shifting fibers connected to silicon photo-multipliers (SiPM) and 16 cryogenic photo-multiplier tubes (PMTs) to detect scintillation light in the LAr Janicsko-Csathy:2010uif ; GERDA:2017ihb . During the upgrade, the geometrical coverage of the fibers was improved, more SiPM channels were added, and their radiopurity increased GERDA:2020xhi . The cryostat was surrounded by a water tank containing 590 m3 of pure water, equipped with PMTs to detect the Cherenkov light of residual cosmic muons reaching the detector site. The instrumented water tank formed, together with scintillator panels on the top of the experiment, the muon veto system Freund:2016fhz .
3 Data selection
The Gerda Phase II data taking started in December 2015; it was shortly interrupted in the Summer of 2018 for the upgrade of the setup and lasted until November 2019. The total collected data used to search for the 429.88 keV line from the 0ECEC of 36Ar corresponds to a live time of 3.08 yr, divided into 1.91 yr before the upgrade and 1.17 yr after the upgrade. Due to the different detector properties, e.g. energy resolution and efficiency, and the changes in the detector configuration during the upgrade, data were split into 5 data sets, namely pre-upgrade enrBEGe, pre-upgrade enrCoax, post-upgrade enrBEGe, post-upgrade enrCoax, and post-upgrade enrIC. The natCoax detectors were excluded from the analysis since they have a low duty factor due to their unstable operation in Gerda Phase II and made up a minimal amount of the exposure.
Data have been processed following the procedures and digital signal processing algorithms described in Agostini:2011mh . The energy of an event is reconstructed using a zero-area-cusp filter GERDA:2015rik . Events must pass several quality cuts based on the flatness of the baseline, polarity, and time structure of the pulse to reject non-physical events. The acceptance efficiency of physical events by quality cuts is larger than 99.9% GERDA:2020xhi . Events preceded by a trigger in the muon-veto system within 10 s are also discarded, with negligible induced dead time (0.01%) GERDA:2020xhi .
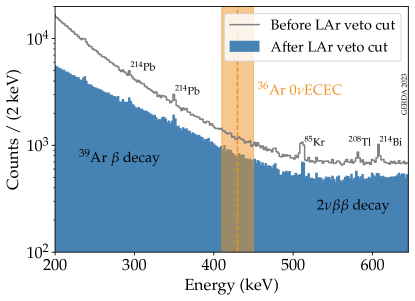
The experimental signature used to search for 36Ar 0ECEC in the Gerda data corresponds to the full energy deposition of the ray in one germanium detector. Neglecting the energy deposition of the two X-rays, no coincident energy deposition is expected, neither in the other germanium detectors nor the LAr. Consequently, the detector anti-coincidence cut and the LAr veto cut were also applied. The energy of the two X-rays is low enough that, even if they reached the germanium detector surface, they could not penetrate the 1–2 mm dead layer and, therefore, not be detected by the germanium detector. Nevertheless, since they deposit their energy in the LAr, they could be seen by the LAr instrumentation and trigger the LAr veto. The corresponding event would escape the data selection. This effect is considered in the total detection efficiency, as will be explained in section 5. The LAr veto cut reduces the background in the region of interest of this analysis by a factor of , as can be seen in Figure 1. In this energy region, 39Ar decay dominates up to the endpoint at 565 keV, while decay is the second dominant contribution. The Pulse Shape Discrimination (PSD) cut, successfully employed in the search for decay Agostini2022 , is unsuitable for this analysis and, therefore, not used. In fact, rays mostly result in multiple separated energy depositions in the germanium detector, i.e. multi-site events, in contrast to the single-site events produced in the decay. In addition, the performances of the PSD cut at the energy of interest of this analysis are poorly known. Consequently, part of the data excluded in the decay analysis from enrBEGe and enrIC data sets because of the PSD cut was instead included here.
We combine the analysis of Gerda Phase II data with that of Gerda Phase I data reported in Agostini2016 . The Gerda Phase I data taking started in November 2011 and lasted until May 2013. The total collected data used for searching for 0ECEC of 36Ar corresponded to a live time of 1.26 yr and was divided into three data sets, namely enrCoax, enrBEGe, and natCoax. More details on the data processing and selection of these three data sets can be found in Agostini2016 . It has to be noticed that the instrumentation of the LAr volume is a unique feature of Gerda Phase II and that no LAr veto cut was available in Gerda Phase I.
4 Energy resolution and energy scale
The energy calibration of the Gerda germanium detectors was performed during dedicated weekly calibration runs in which the germanium detectors were exposed to three 228Th sources GERDA:2021pcs . All calibration data were combined as detailed in GERDA:2021pcs to determine the energy scale and resolution throughout the experiment.
This work uses the effective resolution curves calculated for the five analysis data sets Ransom:2021fcg . The resolution curves are evaluated at the 36Ar 0ECEC energy of 429.88 keV. The energy resolution in full width at half maximum (FWHM) and their uncertainties are summarized in table 1. The uncertainty on the FWHM is calculated assuming the same relative uncertainty as for the FWHM at the of the 76Ge decay ( = 2039 keV). This was calculated in GERDA:2021pcs as exposure-weighted standard deviation. The picture might be different at low energy, and the results obtained for the decay peak at 2039 keV might not be valid for the 0ECEC peak at 429.88 keV. In fact, the lowest energy peak used to determine the resolution curves above is the 583 keV 208Tl peak, above the energy region of interest in this analysis. To cross-check the energy resolution at the energy of interest, we use the results of the special low-energy calibration performed at the end of the Gerda data taking. This calibration run aimed to study the energy scale and stability at low energy. The energy threshold was set to 100 keV (while it was 400 keV during regular calibration runs), allowing to extend the energy range in which the resolution curve is calculated to about 238 keV, the energy of the first 212Pb peak usable for the calibration. We use the peak at 583 keV as a proxy for the 0ECEC peak, being the closest in energy. We should note that also the topology of the events for the two peaks is the same. In both cases, it is a full energy deposition of the energy in one germanium detector, with the ray starting in the surrounding of the detector array. We calculate the residuals on the FWHM as the difference between the FWHM extracted in the special low-energy calibration and the value obtained evaluating the resolution curves above at 583 keV. The residuals for each detector are shown in a histogram at the left-handed side of figure 2. We find no systematic deviation of the FWHM at this energy compared to the resolution curves. The RMS of the residuals is 0.049 keV, with only one detector with a larger residual of -0.2 keV.222This is a enrCoax detector, so the result is compatible with the larger FWHM uncertainty of the post-upgrade enrCoax data set.
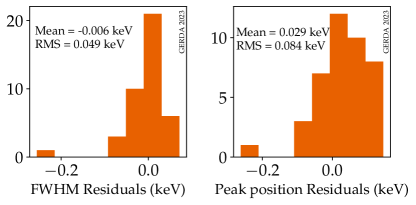
The monitoring of the energy scale for the decay search was performed using the single escape peak of 208Tl at 2103 keV, which is typically used as a proxy for the decay peak at . The residuals between the peak position after energy calibration and the nominal energy value were evaluated over time, giving a mean energy bias of -0.07 keV with an average uncertainty of 0.17 keV GERDA:2021pcs . To cross-check the energy bias at the energy of interest, we use the results of the special low energy calibration run and the 583 keV peak as a proxy for the 0ECEC peak again. We calculate the residuals on the peak position as the difference between the nominal energy value and the energy value extracted from the special low-energy calibration. The residuals for each detector are shown in a histogram at the right-handed side of figure 2. We find a mean energy bias of 0.03 keV with a RMS among detectors of 0.084 keV. This is below the estimated bias uncertainty of 0.17 keV for the decay peak at . It should be noted that these biases are well below the binning of 1 keV used in the analysis. The effect is therefore expected to be marginal. In this work, we adopt a mean energy bias of 0 keV with an uncertainty of 0.1 keV for all the five analysis data sets.
| Data set | FWHM (keV) | (kg) |
|---|---|---|
| Phase II pre-upgrade | ||
| enrBEGe | ||
| enrCoax | ||
| Phase II post-upgrade | ||
| enrBEGe | ||
| enrCoax | ||
| enrIC | ||
| Phase I | ||
| enrCoax | ||
| enrBEGe | ||
| natCoax | ||
5 Detection efficiency
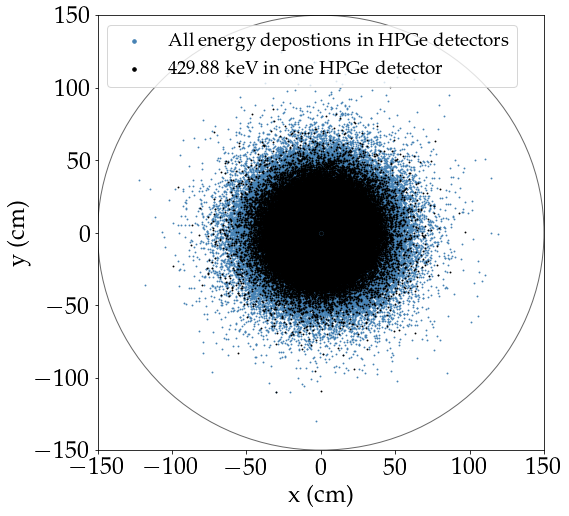
The detection efficiency is defined as the probability that a 429.88 keV ray entirely deposits its energy inside a single germanium detector. This was determined via Monte Carlo simulations with the Geant4-based MaGe framework Agostinelli2003 ; Boswell2011 . In total, rays with an energy of 429.88 keV were generated in a cylindrical volume of LAr, with a radius of 1.5 m and a height of 2.5 m, around the detector array. This corresponds to a net volume of LAr, after taking into account the volume occupied by the germanium detectors and structural materials, of 17.657 m3. The corresponding LAr mass, given the LAr density of 1385 kg/m3, is 24459 kg. The contribution from rays originating from outside this volume to the detection efficiency is negligible, as shown in figure 3. The projected distribution of vertices from which the simulated rays originate is shown in blue for all the events resulting in an energy deposition in the germanium detectors and black for the events resulting in the deposition of the entire 429.88 keV energy in one germanium detector.
Only the last contribute to the detection efficiency, defined for each data set as the ratio between the number of events in which the full energy is deposited in one germanium detector in the specific data set and the number of initially simulated events. The number of simulated events is high enough that the statistical uncertainties on these quantities are negligible. Detector active volume and the status of each detector over the whole data taking are considered in the simulation, as detailed in GERDA:2019cav . The dominant systematic uncertainty on the detection efficiency comes from the detector active volume uncertainty. This is estimated by varying the detector dead layer in the simulation by , where is the dead layer uncertainty, and evaluating the impact on the efficiency. Typical sizes of the detector dead layers are 1–2 mm known with a typical uncertainty of 5–30 % GERDA:2019vry . The corresponding systematic uncertainty on the detection efficiency is 3% for enrBEGe detectors, 4% for enrCoax detectors, and 1% for enrIC detectors. The detection efficiencies multiplied by the mass of LAr in the simulation volume, together with their uncertainties, are summarized in table 1 for the different data sets.
The two X-rays that are emitted in the process being searched for are neglected in the simulations. As anticipated in section 3, their energy deposition in LAr could trigger the LAr veto. To account for this possibility, the survival probability of the two X-rays to the LAr veto cut is evaluated and combined with the detection efficiency. We use the Gerda photon detection probability map developed in GERDA:2022hxs to estimate the probability to detect scintillation light for each simulated event starting at position and corresponding to a full energy deposition. From this probability, the number of photons produced by the two X-rays of total energy = (2.47 + 0.23) keV is obtained:
| (2) |
where 28.12 is the number of photons produced for an energy deposition of 1 keV expected in the Gerda LAr GERDA:2022hxs . The probability P that the corresponding event survives the LAr veto cut is the Poisson probability .333Where the probability mass function for a Poisson variable is defined as . The mean survival probability is obtained by averaging the survival probabilities of the events corresponding to a full energy deposition and results in . Thus, the data selection discards almost 5% of the events due to the X-rays depositing their energy in LAr. The calculation of the survival probability assumes that the two X-rays deposit all the energy at the exact point where the ray is emitted. This assumption is considered valid since the attenuation length for a 3 keV X-ray was estimated to be about 42 m XrayCoefficients , negligible compared to the mm3 binning of the photon detection probability map. The main systematic uncertainty on the mean survival probability comes from the photon detection probability map. The uncertainties on this probability map given in GERDA:2022hxs result in a 0.5% systematic uncertainty on the survival probability. Finally, we should note that the photon detection probability map assumes the pre-upgrade configuration of the LAr instrumentation GERDA:2022hxs . This means the model does not include the inner fiber shroud installed during the upgrade to improve the light detection efficiency near the germanium detectors GERDA:2020xhi . Therefore, a customized LAr veto cut was applied to select the post-upgrade data used in this work: the SiPM channels corresponding to the inner fiber shroud are not considered to build the LAr veto condition. This way, the X-rays survival probability obtained with the pre-upgrade photon detection probability map is extended to the post-upgrade data sets.
6 Analysis methods
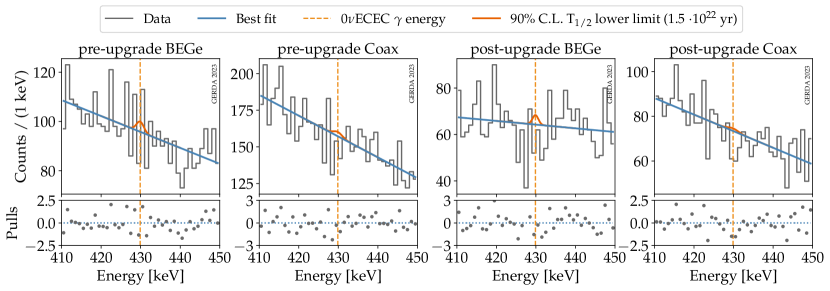
The energy region used to set a limit on the half-life of 0ECEC of 36Ar is defined between 410 and 450 keV (20 keV around the energy of 429.88 keV, as indicated by the orange band in figure 1). Given the high statistics in this energy region, data are used in a binned form, with a 1 keV binning. It was checked that the binning choice did not impact the analysis results. In this energy region, the dominant backgrounds are the decay of 39Ar and the decay of 76Ge. Subdominant contributions to the background are, in order of importance, the 42K decays in LAr, the 40K, 214Pb, and 214Bi decays in structural materials. The sum of these contributions in the analysis window can be approximated by a linear distribution, as seen in figure 1. The signal is modeled with a Gaussian peak centered at the energy and with the width given by the detector energy resolution ( = FWHM/2.355). Uncertainties on the energy scale are parametrized by a shift of the signal peak compared to the nominal energy.
A simultaneous fit is performed on the eight data sets listed in table 1 by adopting the following binned likelihood:
| (3) |
where the number of events in each bin is Poisson distributed, and the likelihood is given by the product of the Poisson probabilities for all bins and data sets . The likelihood depends on the half-life of the investigated process, which is a common parameter among the eight data sets and is the only parameter of interest, and on some nuisance parameters that are data set specific and affect both the signal and background distributions. Gaussian pull terms are introduced in the likelihood to constrain some of the nuisance parameters. Finally, denotes the number of observed events in the data set and bin , and is the expectation value for the same data set and bin. The latter is given by the sum of the signal and background in that bin: . The number of signal events is given by the integral of the signal distribution for the data set in the bin . This is a Gaussian distribution centered at , where is the energy of 429.88 keV and the energy bias for the data set calculated for the same energy, and with the width given by the detector energy resolution evaluated for the same data set and at the same energy. The total number of signal events in a data set is related to the half-life through the relation:
| (4) |
where is the Avogadro constant, is the molar mass of argon (35.968 g/mol), is the mass of LAr in the simulations from which the detection efficiencies are extracted (the product is given in table 1 for each analysis data set), is the abundance of 36Ar in ultra-pure natural Argon (0.334%) lee2006 , and is the live time of the experiment. The total efficiency for the Phase II data sets is given by the product , where is the detection efficiency, the X-rays survival probability (both discussed in section 5), and is the efficiency of the LAr veto cut. The latter was estimated to be (97.70.1)% for the pre-upgrade data and (98.20.1)% for the post-upgrade data GERDA:2020xhi . The total efficiency of the Phase I data sets equals the detection efficiency , because no LAr veto cut was available in Gerda Phase I. Analogously, the number of background events is given by the integral of the background distribution for the data set in the bin . The background distribution is a linear function that depends on two parameters, the normalization and the slope, both data set-specific. We verified that the first-order polynomial function describes the data in this energy region well and that a second-order polynomial function does not fit the data better. In modeling the background of Phase I data, an additional Gaussian distribution is used to describe the full energy deposition of the 433.9 keV ray from 108mAg, which lies in the energy region of the analysis. Contamination from 108mAg was observed in the screening measurements, and all the three expected lines from 108mAg were observed in Gerda Phase I data Agostini2016 ; GERDA:2015naf . The origin of the 108mAg contamination in Gerda Phase I was found in the signal cables GERDA:2015naf , which were exchanged in Gerda Phase II GERDA:2017ihb . In addition, none of these lines was observed in Gerda Phase II data after the LAr veto cut. The decay of 108mAg proceeds through a cascade of three equally probably rays at energies of 433.9 keV, 614.3 keV, and 722.9 keV. Therefore, even if any 108mAg contamination were still present in Gerda Phase II, the LAr veto cut would likely discard the corresponding events. In total, the fit has 42 floating parameters, 22 describing the signal peak (, , )444While for the Phase II data, the energy bias is assumed to be different among data sets, for Phase I data only one parameter, common for the three data sets is adopted, following the previous analysis Agostini2016 ., 10 for the linear background of Phase II data sets, 6 for the linear background of Phase I data sets, 3 parameters for the number of 108mAg events in Phase I data sets, plus one common parameter to all data sets . The latter is constrained to positive values. Gaussian pull terms in the likelihood given in Eq. 3 constrain some of the nuisance parameters, namely the efficiency , the energy bias , and the energy resolution around their central value and uncertainty. All the other nuisance parameters are free and unconstrained, and their uncertainties are propagated into the result by profiling.
To set a lower limit on the half-life of the investigated process, we use a modified frequentist approach, namely the method Read2002 . The latter was found to be a more appropriate choice in the case of an experiment with low sensitivity or, in different words, a background-dominated experiment Read2002 . Compared to a pure frequentist approach, the exclusion region does not assure the correct coverage and often results in an over-coverage, thus a more conservative result. The profile likelihood ratio test statistic is used for the calculation. Asymptotic distributions of the test statistic and the Asimov data set are used Cowan2011 . The statistics in each bin is high enough for this assumption to be valid.
7 Results
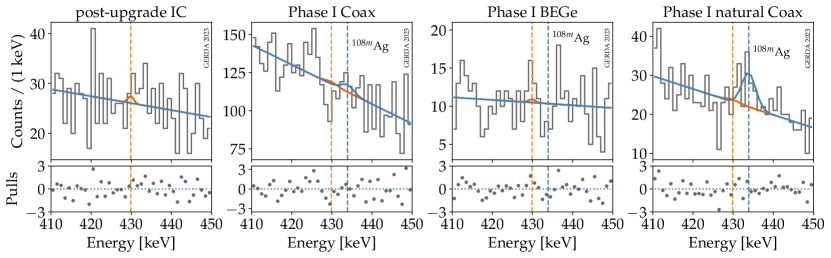
The best fit, defined as the minimum of the profiled likelihood ratio, yields = 0, i.e. we do not observe any signal events from 0ECEC. Data from the five Gerda Phase II analysis data sets and in the energy region of the analysis are shown in figure 4 together with the best-fit model and the residuals normalized to the expected statistical fluctuations of the bins.
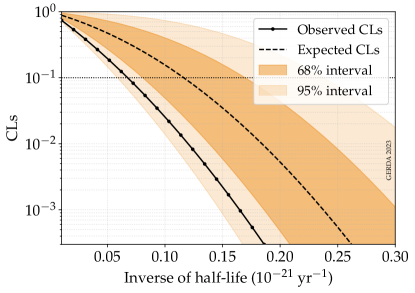
The 90% C.L. limit on the half-life is obtained by scanning the observed over different values of and finding the value for which = 0.1. For Gerda Phase II data only, this gives yr. The 90% C.L. sensitivity of the Gerda Phase II experiment, i.e. the median expectation under the no signal hypothesis, is obtained analogously by scanning the expected over different values of and finding the value for which = 0.1. The latter gives yr. The analysis of the combined Gerda Phase I and Phase II data gives a 90% C.L. sensitivity of yr and an observed lower limit of yr. Figure 5 shows the scan of the observed and expected over a range of values of obtained in the analysis of the combined Gerda Phase I and Phase II data.
Systematic uncertainties on the efficiency , the energy bias , and the energy resolution are identified as primary sources of systematic uncertainties and included in the likelihood through nuisance parameters constrained by Gaussian pull terms as explained in section 6. Their overall effect on the limit derived in section 7 is estimated to be 2%. Potential systematic uncertainties related to the fit model, particularly the background distribution, are also investigated. First, the assumption of a linear distribution is compared to a more general second-order polynomial distribution. This has a negligible impact on the result. The presence of additional structures in the background is also investigated. As discussed in section 6, a line from 108mAg, very close to the expected signal energy, is included in the background model of the Phase I data sets, as in previous analysis Agostini2016 . A possible systematic uncertainty due to the above line in Phase II data is investigated by introducing it in the background model. This would worsen our result of a 2%.
8 Conclusions
In this work, we searched for the 429.88 keV line from the 36Ar 0ECEC using the final total exposure of the Gerda Phase II experiment, combined with the Gerda Phase I exposure. No signal was observed, and a lower limit on the half-life of this process was derived, yielding yr (90% C.L.). This is the most stringent limit on the half-life of the 36Ar 0ECEC. This work shows that the potential of the Gerda experiment in investigating physics beyond the Standard Model extends further than the search for the decay of 76Ge (see also GERDA:2020emj ; GERDA:2022ffe ). Even if the sensitivity is many orders of magnitude below the theoretical expectation for this process, to our knowledge, the Gerda experiment was, to date, the only experiment with the capability to search for the 0ECEC of 36Ar with competitive sensitivities. The Gerda sensitivity is limited by the physical background from 39Ar and 76Ge decays in the energy region where the peak is expected, which is, for instance, orders of magnitude higher than the background in the region of interest for the 76Ge decay. An additional limiting factor is the low detection efficiency since the ray is emitted in the LAr and must be detected in one of the germanium detectors. Only rays emitted in the proximity of the detector array contribute to the total efficiency as discussed in section 5 (See figure 3).
Among the planned future experiments, the Large Enriched Germanium Experiment for Neutrinoless- Decay (LEGEND) experiment can extend the search for the 0ECEC of 36Ar to higher sensitivity. In the first phase of the project, LEGEND-200 will deploy about 200 kg of germanium detectors. This is more than a factor of four compared to the Gerda detector mass and will imply a higher detection efficiency to the ray emitted in this process. On the other hand, the background in the energy region where the peak is expected should be comparable to the Gerda background, largely dominated by the 39Ar decay. Still, an improvement in the current sensitivity is foreseen. LEGEND-1000 will deploy about 1 ton of germanium detectors, implying an even higher detection efficiency to the ray emitted in this process. In addition, using underground Ar instead of atmospheric Ar is intended. This is depleted of 39Ar, which is the main background contribution in this search. A significant improvement in the sensitivity is therefore expected. To our knowledge, no other planned experiment has competitive sensitivity to LEGEND in the search for 0ECEC of 36Ar.
Acknowledgements.
The Gerda experiment is supported financially by the German Federal Ministry for Education and Research (BMBF), the German Research Foundation (DFG), the Italian Istituto Nazionale di Fisica Nucleare (INFN), the Max Planck Society (MPG), the Polish National Science Centre (NCN, grant number UMO-2020/37/B/ST2/03905), the Polish Ministry of Science and Higher Education (MNiSW, grant number DIR/WK/2018/08), the Russian Foundation for Basic Research, and the Swiss National Science Foundation (SNF). This project has received funding/support from the European Union’s Horizon 2020 research and innovation programme under the Marie Sklodowska-Curie grant agreements No 690575 and No 674896. This work was supported by the Science and Technology Facilities Council, part of the U.K. Research and Innovation (Grant No. ST/T004169/1). The institutions acknowledge also internal financial support. The Gerda collaboration thanks the directors and the staff of the LNGS for their continuous strong support of the Gerda experiment.References
- (1) E. Aprile et al. (XENON Collaboration), Nature 568(7753), 532 (2019). DOI 10.1038/s41586-019-1124-4
- (2) A.P. Meshik, C.M. Hohenberg, O.V. Pravdivtseva, Y.S. Kapusta, Phys. Rev. C 64, 035205 (2001). DOI 10.1103/PhysRevC.64.035205
- (3) S.S. Ratkevich, A.M. Gangapshev, Y.M. Gavrilyuk, F.F. Karpeshin, V.V. Kazalov, V.V. Kuzminov, S.I. Panasenko, M.B. Trzhaskovskaya, S.P. Yakimenko, Phys. Rev. C 96(6), 065502 (2017). DOI 10.1103/PhysRevC.96.065502
- (4) R.G. Winter, Phys. Rev. 100, 142 (1955). DOI 10.1103/PhysRev.100.142
- (5) M. Doi, T. Kotani, Progress of Theoretical Physics 89(1), 139 (1993). DOI 10.1143/ptp/89.1.139
- (6) K. Blaum, S. Eliseev, F.A. Danevich, V.I. Tretyak, S. Kovalenko, M.I. Krivoruchenko, Y.N. Novikov, J.T. Suhonen, Rev. Mod. Phys. 92, 045007 (2020). DOI 10.1103/RevModPhys.92.045007
- (7) H.M. Georgi, S.L. Glashow, S. Nussinov, Nucl. Phys. B 193, 297 (1981). DOI 10.1016/0550-3213(81)90336-9
- (8) R.A. Eramzhian, G. Mitselmakher, M.B. Voloshin, JETP Lett. 35, 656 (1982)
- (9) J. Bernabeu, A. De Rujula, C. Jarlskog, Nucl. Phys. B 223, 15 (1983). DOI 10.1016/0550-3213(83)90089-5
- (10) K. H. Ackermann et al. (Gerda Collaboration), Eur. Phys. J. C 73(3), 2330 (2013). DOI 10.1140/epjc/s10052-013-2330-0
- (11) M. Agostini et al. (Gerda Collaboration), Phys. Rev. Lett. 125(25), 252502 (2020). DOI 10.1103/PhysRevLett.125.252502
- (12) V. Tretyak, Y. Zdesenko, Atom. Data Nucl. Data Tabl. 61, 43 (1995). DOI 10.1016/S0092-640X(95)90011-X
- (13) A. Merle, The Mysteries of Leptons: New Physics and unexplained Phenomena. Dissertation (2009). DOI 10.11588/heidok.00010180
- (14) M. Wang, W.J. Huang, F.G. Kondev, G. Audi, S. Naimi, Chin. Phys. C 45(3), 030003 (2021). DOI 10.1088/1674-1137/abddaf
- (15) O. Chkvorets, Search for double beta decay with HPGe detectors at the Gran Sasso underground laboratory. Dissertation (2008). DOI 10.11588/heidok.00008572
- (16) M. Agostini et al. (Gerda Collaboration), Eur. Phys. J. C 76(12), 652 (2016). DOI 10.1140/epjc/s10052-016-4454-5
- (17) M.G. Dunford, A Search for the Neutrinoles Double Electron Capture of 36Ar and a Measurement of the Specific Activity of 39Ar in Atmospheric Argon with the DEAP-3600 Detector. Ph.D. thesis (2018). DOI 10.22215/etd/2018-13483
- (18) M. Agostini et al. (Gerda Collaboration), Eur. Phys. J. C 78(5), 388 (2018). DOI 10.1140/epjc/s10052-018-5812-2
- (19) M. Agostini et al. (Gerda Collaboration), Science 365, 1445 (2019). DOI 10.1126/science.aav8613
- (20) K.T. Knöpfle, B. Schwingenheuer, JINST 17(02), P02038 (2022). DOI 10.1088/1748-0221/17/02/P02038
- (21) A. Lubashevskiy, et al., Eur. Phys. J. C 78(1), 15 (2018). DOI 10.1140/epjc/s10052-017-5499-9
- (22) J. Janicskó-Csáthy, H.A. Khozani, X. Liu, B. Majorovits, A. Caldwell, Nucl. Instrum. Meth. A 654, 225 (2011). DOI 10.1016/j.nima.2011.05.070
- (23) K. Freund, et al., Eur. Phys. J. C 76(5), 298 (2016). DOI 10.1140/epjc/s10052-016-4140-7
- (24) M. Agostini, L. Pandola, P. Zavarise, J. Phys. Conf. Ser. 368, 012047 (2012). DOI 10.1088/1742-6596/368/1/012047
- (25) M. Agostini et al. (Gerda Collaboration), Eur. Phys. J. C 75(6), 255 (2015). DOI 10.1140/epjc/s10052-015-3409-6
- (26) M. Agostini et al. (Gerda Collaboration), Eur. Phys. J. C 82(4), 284 (2022). DOI 10.1140/epjc/s10052-022-10163-w
- (27) M. Agostini et al. (Gerda Collaboration), Eur. Phys. J. C 81(8), 682 (2021). DOI 10.1140/epjc/s10052-021-09403-2
- (28) C. Ransom, Energy Calibration for the GERDA and LEGEND-200 Experiments. Ph.D. thesis (2021)
- (29) S. Agostinelli et al. (GEANT4 Collaboration), Nucl. Instrum. Meth. A 506, 250 (2003). DOI 10.1016/S0168-9002(03)01368-8
- (30) M. Boswell, et al., IEEE Trans. Nucl. Sci. 58, 1212 (2011). DOI 10.1109/TNS.2011.2144619
- (31) M. Agostini et al. (Gerda Collaboration), JHEP 03, 139 (2020). DOI 10.1007/JHEP03(2020)139
- (32) M. Agostini et al. (Gerda Collaboration), Eur. Phys. J. C 79(11), 978 (2019). DOI 10.1140/epjc/s10052-019-7353-8
- (33) M. Agostini et al. (Gerda Collaboration), Eur. Phys. J. C 83(4), 319 (2023). DOI 10.1140/epjc/s10052-023-11354-9
- (34) J. Hubbell, S. Seltzer, X-Ray Mass Attenuation Coefficients — NIST. URL https://www.nist.gov/pml/x-ray-mass-attenuation-coefficients
- (35) J.Y. Lee, K. Marti, J.P. Severinghaus, K. Kawamura, H.S. Yoo, J.B. Lee, J.S. Kim, Geochimica et Cosmochimica Acta 70(17), 4507 (2006). DOI 10.1016/j.gca.2006.06.1563
- (36) M. Agostini et al. (Gerda Collaboration), J. Phys. G 42(11), 115201 (2015). DOI 10.1088/0954-3899/42/11/115201
- (37) A.L. Read, J. Phys. G 28, 2693 (2002). DOI 10.1088/0954-3899/28/10/313
- (38) G. Cowan, K. Cranmer, E. Gross, O. Vitells, Eur. Phys. J. C 71, 1554 (2011). DOI 10.1140/epjc/s10052-011-1554-0. [Erratum: Eur.Phys.J.C 73, 2501 (2013)]
- (39) M. Agostini et al. (Gerda Collaboration), Phys. Rev. Lett. 125(1), 011801 (2020). DOI 10.1103/PhysRevLett.125.011801. [Erratum: Phys.Rev.Lett. 129, 089901 (2022)]
- (40) M. Agostini et al. (Gerda Collaboration), JCAP 12, 012 (2022). DOI 10.1088/1475-7516/2022/12/012
- (41) See Supplemental Material at [URL] for the data shown in Figs. 1 and 4.